Article

Numerical Characterization of Protein Sequences Based on the Generalized Chou’s Pseudo Amino Acid Composition

1
Department of Mathematics, Bohai University, Jinzhou 121013, China
2
NIASRA—National Institute for Applied Statistics Research Australia, School of Mathematics and Applied Statistics, University of Wollongong, Wollongong 2522, Australia
*
Author to whom correspondence should be addressed.
Appl. Sci. 2016, 6(12), 406; https://doi.org/10.3390/app6120406
Submission received: 18 September 2016 / Revised: 30 October 2016 / Accepted: 29 November 2016 / Published: 6 December 2016
(This article belongs to the Special Issue Dynamical Models of Biology and Medicine)

Abstract

:
The technique of comparison and analysis of biological sequences is playing an increasingly important role in the field of Computational Biology and Bioinformatics. One of the key steps in developing the technique is to identify an appropriate manner to represent a biological sequence. In this paper, on the basis of three physical–chemical properties of amino acids, a protein primary sequence is reduced into a six-letter sequence, and then a set of elements which reflect the global and local sequence-order information is extracted. Combining these elements with the frequencies of 20 native amino acids, a ( 21 + λ ) dimensional vector is constructed to characterize the protein sequence. The utility of the proposed approach is illustrated by phylogenetic analysis and identification of DNA-binding proteins.

1. Introduction

In the task of comparison and analysis of biological sequences, choosing a type of DNA/protein representation is an important step. The usual representation of the primary structure of DNA is a string of four letters: A (adenine); G (guanine); C (cytosine); and T (thymine). This expression is called a letter sequence representation (LSR) or a DNA primary sequence. Similarly, a protein primary sequence is usually expressed in terms of a series of 20 letters, which denote 20 different amino acids. The sequence encodes information of the corresponding structure and function in a living organism. However, it is difficult to obtain the information from the representation of a primary sequence directly. Therefore, various sequence representation techniques have been developed for encoding bio-sequences and extracting the hidden information.
Graphical representation of DNA is a useful tool for visualizing and analyzing DNA sequences. By using the tool, one can obtain a route to condense the information coded by DNA primary sequences into a set of invariants [1,2]. Early attempts towards graphical representations of DNA were made by Hamori and Ruskin in 1983 [3], Hamori in 1985 [4], and Gates in 1985 [5]. Afterwards, more graphical representations of DNA sequences were well developed by researchers [1,2,6,7,8,9,10,11,12,13,14,15]. In comparison with DNA, graphical representations of proteins emerged only very recently [2,16,17,18,19,20,21,22,23,24,25,26,27]. As a matter of fact, most of the graphical representations of DNA involve some degree of arbitrariness, such as the selection of directions to be assigned to individual bases. For a string like DNA sequence over an alphabet with size 4, there are 4 ! = 24 possible ways of assigning 4 directions to 4 nucleic acid bases. If these methods are directly extended to protein sequences, the corresponding figure is 20 ! 2.433 × 10 18 . It is impracticable to represent one protein sequence by such an enormous number of graphs. This is probably the most important reason why protein graphical representations have not been advanced [19,23]. It is found that reducing the alphabet or fixing the directions assigned to amino acid residues plays an important role in addressing this problem. For details, we refer to some recent publications [2,16,21,23,24,28].
Matrix representation of a biological sequence is another powerful tool for characterization and comparison of sequences. These matrices include: The frequency matrix; Euclidean-distance matrix (ED); graph theoretical distance matrix (GD); line distance matrix (LD); quotient matrix (D/D, M/M, L/L); and their “higher order” matrices [1,2,12,13,20,21,27,29,30]. Among them, ED, GD, L/L, etc., are derived from a graphical representation. For example, L/L is a symmetric matrix whose diagonal entries are zero, while other entries are defined as the quotient of the Euclidean distance between two points of the graph and the sum of geometrical lengths of edges between the two points. Once the matrix is given, some of matrix invariants can be used as descriptors of the sequence. Eigenvalues of a matrix are one of the best-known matrix invariants [31]. In fact, two graphs are isomorphic if and only if their adjacency matrices are similar. It is of interest to note that similar matrices have the same eigenvalues. Among all the eigenvalues, the leading eigenvalue often plays a special role and has been widely used in the field of biological science and chemistry. However, a problem we must face is that the calculation of the eigenvalue will become more and more difficult with the order of the matrix large. ALE-index is an alternative invariant we proposed in 2005 [32]. The ALE-index can be viewed as an Approximation of the Leading Eigenvalue (ALE) of the corresponding matrix (it is just in this sense that it is called ‘ALE’-index), while it is much simpler for calculation than the latter. Therefore, it may be more economical to adopt the ALE-index when one is interested only in the leading eigenvalue.
The third method for formulating a protein sequence is the pseudo amino acid composition (PseAAC), with the advantage of avoiding loss of the sequence-order information. Ever since the concept of PseAAC [33,34] or Chou’s PseAAC [35,36] was proposed, it has rapidly penetrated into nearly all fields of computational proteomics (see a long list papers cited in [36,37]). Stimulated by the great successes of PseAAC in dealing with protein/peptide sequences, the concept of PseAAC has been extended [38,39,40,41,42] to cover DNA/RNA sequences as well via the form of PseKNC (pseudo K-tuple nucleotide composition) [43,44], which has been proven very useful in studying many important genome analysis problems, as summarized in a recent review paper [45]. Also, because the concept of PseAAC has been increasingly and widely used in both computational proteomics and genomics, a very powerful web-server called “Pse-in-One” [46] was established that can be used to generate the pseudo components for both protein/peptide and DNA/RNA sequences.
In this paper, we modify the method of Chou’s PseAAC and propose a novel approach for numerically characterizing a protein sequence. We characterize a protein sequence by a ( 21 + λ ) dimensional vector, whose first 20 components are the occurrence frequencies of 20 native amino acids, while the last λ + 1 components are based on a six-letter sequence derived from the protein primary sequence. The former is used to reflect the effect of the amino acid composition, and the latter is used to reflect the effect of sequence order and property of the residues. It is well known that a sequence naturally contains two pieces of information: the elements of the sequence; and the orders of the elements. Any methodologies based on the amino acid composition alone are worthy of further investigation. However, as pointed out by Chou [33,34], it is not feasible to completely include all sequence order patterns. It was stirring to see that Chou creatively developed an approach as mentioned above to extract the important feature beyond amino acid composition. Our scheme is similar to, but different from, that of Chou. Experiments about phylogenetic analysis on two datasets and identification of DNA-binding proteins illustrate the utility of the proposed method.

2. Methods

A protein sequence can be viewed as a string of 20 amino acids. Without loss of generality, by the numerical indices 1,2,…,20, we represent the 20 native amino acids according to the alphabetical order of their single-letter codes: A,C,D,E,F,G,H,I,K,L,M,N,P,Q,R,S,T,V,W and Y. Then the frequencies of appearance of the 20 amino acids in a protein sequence are often used to construct a vector
[ f 1 , f 2 , , f 20 ]
This is the conventional amino acid composition. The advantage of such a vector representation is that it is easy in statistical treatment, but it cannot reflect the effect regarding sequence order and property. In what follows, we will take this effect into account through a set of elements in addition to the 20 components.
Hydrophobicity, isoelectric point (pI), and relative distance (RD) are three important physicochemical properties of the 20 native amino acids. Here RD can be viewed as an integration of the information on three side chain properties: composition; polarity; and molecular volume—where composition is defined as the atomic weight ratio of hetero (noncarbon) elements in end groups or rings to carbons in the side chain (for details, see [47]). Listed in Table 1 are the original numerical values for hydrophobicity, pI and RD. As can be seen from Table 1, the values of P 1 0 (Hydrophobicity) is in the range [−2.53~1.38], and the values of P 2 0 (isoelectric point) are in the range of 2.97~10.76, while P 3 0 (relative distance) varies between 1469 and 3355. Therefore, the normalization of these values is needed. Here we normalize them by the formulary below:
p n ( A A i ) = P n 0 ( A A i ) m i n j = 1 , , 20 { P n 0 ( A A j ) } ,
P n * ( A A i ) = p n ( A A i ) m a x j = 1 , , 20 { p n ( A A j ) } .   i = 1 , 2 , ,   20 ,   n = 1 , 2 , 3 .
Clearly, the normalized values for properties of the 20 native amino acids are in the interval [0,1]. The corresponding values are listed in Table 2. The last row in this table gives the average values.
For each amino acid (AA), we associate it with a triple (t(1), t(2), t(3)), where
t ( n ) = { + 1 if   P n * ( A A ) P n ¯ 1 otherwise ( n = 1 , 2 , 3 )
All the amino acids with a same triple form a group. In this way, the 20 native amino acids can be classified into 6 groups:
  • GI = {A, Y, V, M, L, I},
  • GII = {C, W, G, F},
  • GIII = {D, S, N},
  • GIV = {E, Q},
  • GV = {H, T, R, K},
  • GVI = {P}.
For each group, the first amino acid is selected to be the representative. That is, A, C, D, E, H and P are used to stand for the six groups, respectively. The value of the property of a group is defined as the average value of the property of amino acids belonging to the group. Listed in Table 3 are the corresponding values of the six groups.
At the same time, a protein primary sequence can be reduced into a six-letter sequence by replacing each element in the protein sequence with its representative letter. Suppose S = S 1 S 2 S L is a given six-letter sequence, we inspect it by stepping one element at a time. For the step k ( k = 1 , 2 , ,   L ), a 3-D space point q k = ( x k , y k , z k ) can be constructed as follows:
( x k , y k , z k ) = ( x k 1 , y k 1 , z k 1 ) + ( P 1 ( S k ) , P 2 ( S k ) , P 3 ( S k ) ) ,
where ( x 0 , y 0 , z 0 ) = ( 0 , 0 , 0 ) . When k runs from 1 to L, we get L points q 1 , q 2 , ,   q L . Connecting these points one by one sequentially with straight lines, a three-dimensional curve can be drawn. One can further associate the graph with some structural matrices. Here we adopt the L/L matrix and denote it by M, whose (i,j)-entry is defined as follows:
m i j = { d ( i , j ) d ( i , i + 1 ) + d ( i + 1 , i + 2 ) + + d ( j 1 , j ) if   i < j 0 if   i = j m j i if   i > j ,
where d ( i , j ) is the Euclidean distance between points q i and q j . It is not difficult to see that lim t + tM is a (0,1) matrix; here tM stands for the product of Hadmammard multiplication of the matrix M by itself t-times. In this paper, we call the limit matrix as a generalized adjacency matrix (GAM) generated by points q 1 , q 2 , ,   q L , and denote it by MG. Obviously, [ M G ] i j = 1 if and only if q i and q j lie on a straight line in the graph.
As mentioned above, once a symmetric matrix is given, one can calculate its ALE-index by the following formula:
χ = 1 2 ( 1 L || · || m 1 + L 1 L || · || F ) ,
where L is the order of the matrix, || · || m 1 and || · || F are the m1- and F-norms of a matrix, respectively. In order to reduce variations caused by comparison of matrices with different sizes, we consider instead of χ ( M G ) a normalized ALE-index χ ( M G ) = χ ( M G ) 6 L .
In addition, following the similar procedures in capturing the sequence-order information of a protein [33,34], for the six-letter sequence S = S 1 S 2 S L , we extract a set of new order-correlated factors as defined below:
θ 1 = 1 L 1 × 1 3 × n = 1 3 g n ( S , 1 ) , θ 2 = 1 L 2 × 1 3 × n = 1 3 g n ( S , 2 ) , θ λ = 1 L λ × 1 3 × n = 1 3 g n ( S , λ ) .     ( λ < L )
where θ k ( k = 1 , 2 , , λ ) is called the k-th tier correlation factor, g n ( S , k ) represents the coupling mode function as given by
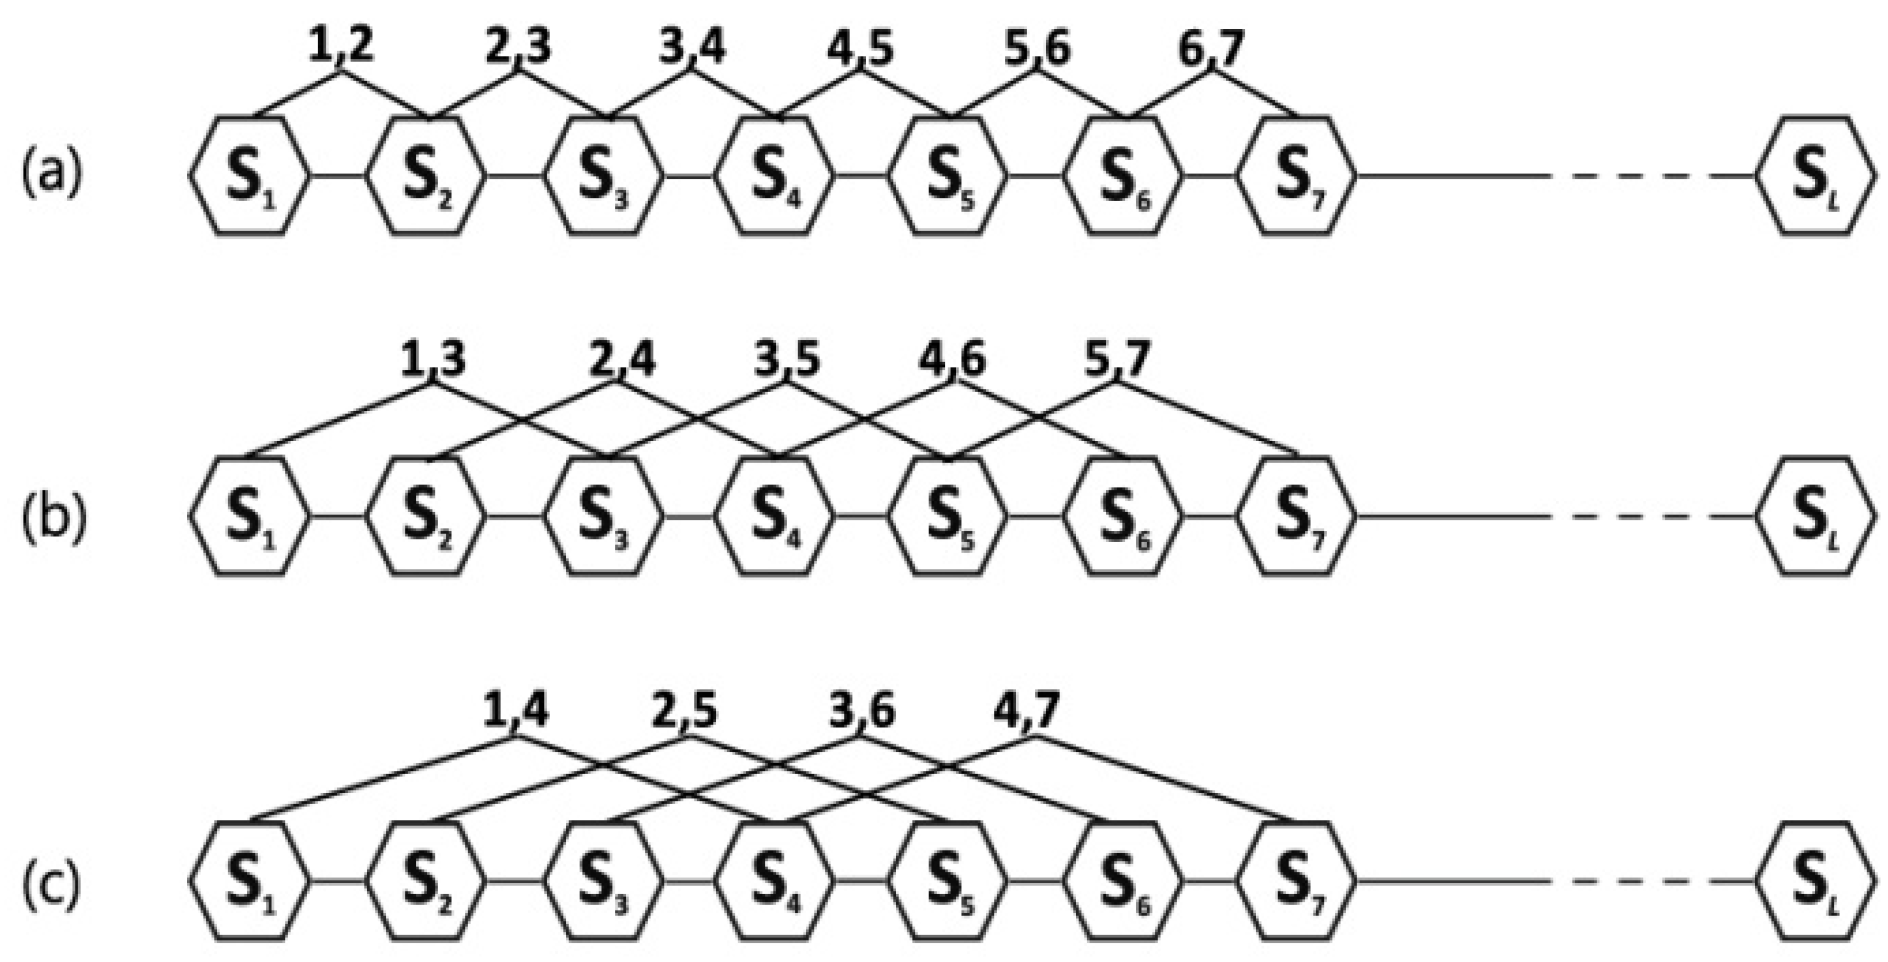
g n ( S , k ) = i = 1 L k ( P n ( S i ) P n ( S i + k ) ) 2
Factor θ 1 reflects the coupling mode between the most contiguous elements along a six-letter sequence (Figure 1a); θ 2 reflects the coupling mode between the second-most contiguous (Figure 1b); θ 3 reflects the coupling mode between the third-most contiguous (Figure 1c), and so on. λ is the highest rank of the coupling mode.
Consequently, a protein sequence can be characterized by a ( 21 + λ ) dimensional vector V:
V = ( v 1 , v 2 , , v 20 , v 20 + 1 , , v 20 + λ , v 20 + λ + 1 ) ,
where
v i = { f i 1 i 20 w 1 θ i 20 20 + 1 i 20 + λ w 2 χ i = 20 + λ + 1
Here w 1 and w 2 are weight factors. It is easy to see that the first 20 components reflect the effect of the amino acid composition, whereas the last λ + 1 components reflect the effect of sequence order and property of the residues. For convenience, a set of such 21 + λ components as formulated by Equations (8) and (9) is called the generalized pseudoamino acid composition of a protein sequence, and denoted by G-PseAAC.

3. Results

In this section, we will illustrate the use of the new quantitative characterization of protein sequences with two experiments. As we can see from Equations (8) and (9), there are three adjustable parameters for the G-PseAAC: λ , w 1 , and w 2 . It is not known beforehand which λ , w 1 , and w 2 are best for a given problem. Three datasets are considered in this paper. The first one is used for determining these parameters and others for testing purpose.

3.1. Experiment I: Phylogenetic Analysis on Two Datasets

The first dataset used in this paper is composed of β -globin protein of 17 species (see Table 4). According to the method proposed, we associate each of the 17 protein sequences with a τ = 21 + λ dimensional vector. These vectors are then used to define a pair-wise evolutionary distance between any two protein sequences i and j:
D ( i , j ) = d ( V i , V j ) = k = 1 τ ( v i k v j k ) 2
where V i = ( v i 1 , v i 2 , , v i , τ ) and V j = ( v j 1 , v j 2 , , v j , τ ) are the corresponding vectors for sequences i and j, respectively. Thus, a 17 × 17 real symmetric matrix D 17 is obtained. On the basis of the achieved distance matrix D 17 , a phylogenetic tree can be constructed using a UPGMA (Unweighted Pair Group Method with Arithmetic Mean) program included in the MEGA4 package. It is found that, when λ = 7 and w 1 = w 2 = 1.6 , the non-mammals, including Guttata, Gallus and Muscovy duck, appear to cluster together and stay outside of the mammals, while Opossum is distinguished from the remaining mammals. In addition, Primate group {Human, Chimpanzee, Gorilla}, Cetartiodactyla group {Cattle, Banteng, Sheep, Goat}, Lagomorpha group {Rabbit, European hare}, and Rodentia group {House mouse, Western wild mouse, Spiny mouse, Norway rat} form separate branches, respectively (cf. Figure 2). This result is in accordance with the accepted taxonomy and the literature [1,12,30].
Using the above-determined values for λ , w 1 , and w 2 , we infer the relationship of 72 coronavirus spike (S) proteins. The coronavirus, whose name is derived from its crown-like shape, is a positive-sense, single-stranded RNA virus in the family Coronaviridae. It was first identified in the 1960s from the nasal cavities of patients with the common cold. Most coronaviruses are not dangerous, but some strains could cause severe, sometimes fatal, diseases in humans and other animals. The MERS coronavirus (commonly shortened to MERS-CoV) is the virus that causes the Middle East respiratory syndrome (MERS). MERS was first reported in 2012 in Saudi Arabia and then in other countries in the Middle East, Africa, Asia, Europe and America. As of July 2016, 1769 laboratory-confirmed cases of MERS-CoV infection, including at least 630 related deaths (the case fatality rate is >30%), have been reported in over 27 countries (http://www.who.int/emergencies/mers-cov/en/). People also died from a severe acute respiratory syndrome (SARS), which first emerged in 2002 in Guangdong Province, China, and then spread globally. SARS resulted in more than 8000 infections with a case-fatality rate of ~10%. The virus that causes SARS is officially called SARS coronavirus (SARS-CoV). Both MERS-CoV and SARS-CoV are identified as members of the beta group of coronavirus, Betacoronavirus, while they are distinct from each other. The name, accession number, and abbreviation of the 72 sequences are listed in Table 5. According to the existing taxonomic groups, sequences 1–5 belong to group alpha (formerly known as Coronavirus group 1 (CoV-1)), sequences 6–8 are members of group gamma (formerly CoV-3), and the remaining belongs to group beta (formerly CoV-2). Refer to Table 5 for details.
The corresponding phylogenetic tree constructed by our method is shown in Figure 3. Observing Figure 3, we find that TGEVG, TGEV, PEDVC, PEDV and HCoV-229E, which belong to group alpha, are clearly clustered together, and so do the three gamma coronaviruses IBV, IBVBJ, IBVC. In the subtree of the group beta, MERS-CoVs appear to cluster together, and SARS-CoVs are situated at an independent branch, while BCoV, BCoVM, BCoVQ, BCoVE, BCoVL, HCoV-OC43, MHV, MHVA, MHVM, MHVP and MHVJHM form a separate branch. The resulting cluster agrees well with the established taxonomic groups.

3.2. Experiment II: Identification of DNA-Binding Proteins

Numerous biological mechanisms depend on nucleic acid-protein interactions. The first step for understanding these mechanisms is to identify the interacting molecules. There are different strategies for determining DNA sequences that bind specifically to a known protein. However, it is difficult to accurately identify DNA-binding proteins [50]. Existing experimental techniques have low practical value due to time consumption and expensive costs [51]. Therefore, developing an efficient computational approach for identifying DNA-binding proteins is becoming increasingly important. In this section, we explore the application of the G-PseAAC to the identification of DNA-binding proteins. The parameters λ , w 1 , and w 2 used here are the same as those determined in Section 3.1.
The dataset used here is taken from [51]. Itsoriginal version was created in 2009 by Kumar et al. [52], in which the DNA-binding proteins are extracted from the Pfam database [53] with keywords of “DNA-binding domain” and pairwise sequence identity cutoff of 25%, while the non DNA-binding domains are randomly selected from Pfam protein families that are unrelated to the DNA-binding protein family. Xu et al. [51] removed some sequences from the original dataset, and its current version is composed of 1585 protein sequences. This benchmark dataset contains 770 DNA-binding proteins and 815 non DNA-binding proteins, which form the positive sample set and negative sample set, respectively. We randomly divide the 770 DNA-binding proteins into two parts, one has 410 sequences and the other 360 sequences. Also, we randomly select 410 and 405 sequences from the 815 non DNA-binding proteins, respectively. We conduct two sets of data. Set I contains 410 DNA-binding proteins and 410 non DNA-binding proteins. This set serves as a training set. The remaining protein sequences (360 DNA-binding proteins and 405 non DNA-binding proteins) form Set II, which serves as a test set.
Support vector machine (SVM) is employed as the classifier, and its implementation is based on the package LIBSVM (a Library for Support Vector Machines) v3.17 [54], which is open sourced and can be freely downloaded from http://www.csie.ntu.edu.tw/~cjlin/libsvm. There are four types of kernel functions in LIBSVM: linear kernel; polynomial kernel; radial basis function (RBF) kernel; and sigmoid kernel. Among them, the RBF kernel is deemed a reasonable first choice [55]. The main reason is that, taking the form K ( V i , V j ) = e γ || V i V j || 2 , the RBF kernel can non-linearly map samples into a higher dimensional space so it can handle the non-linearly separable data. Accordingly, the RBF kernel is also adopted in this paper. The model selection of this kernel involves two parameters to be decided: the penalty parameter C and the kernel parameter γ . We first convert each of the 1585 protein sequences into a 28-D vector, and then the vectors belonging to Set I are scaled and fed to the SVM. With an optimization procedure using a grid search strategy in LIBSVM, the parameter pair (C, γ ) is determined as (8, 0.5) (It should be pointed out that the optimal values for one round of cross-validation may not be the same for another.). In literature, a set of metrics are often used to measure the prediction quality. To make it intuitive and easy to understand for readers, here we adopt the definition and notations used in [40,41,56,57,58,59,60] to describe the corresponding evaluation metrics:
S n = 1 N + N + ,
S p = 1 N + N ,
A c c = 1 N + + N + N + + N ,
M C C = 1 ( N + N + + N + N ) ( 1 + N + N + N + ) ( 1 + N + N + N ) ,
F 1 _ M = 2 × Precision × Recall Precision + Recall ,
where N + is the total number of DNA-binding proteins investigated, while N + the number of DNA-binding proteins incorrectly predicted to be of non DNA-binding proteins; N the total number of non DNA-binding proteins investigated, while N + the number of non DNA-binding proteins incorrectly predicted as DNA-binding proteins. Precision = N + N + N + N + + N + , Recall = 1 N + N + . It should be pointed out that the set of metrics above is valid only for the single-label system (such as the case at hand). For the multi-label systems whose existence has become more frequent in system biology [61,62,63,64] and system medicine [65], a completely different set of metrics as defined in [66] is needed.
With the best pair (C, γ ) obtained in the training stage, Set II is fed to the SVM. We find that N + = 17 and N + = 22 . We thus have
Sn = 95.28%, Sp = 94.57%, Acc = 94.90%, MCC = 0.8978, F1_M = 94.62%.
Repeating the above random division procedure three times, we perform three cross-validation tests and list the results in Table 6. As can be seen, the accuracy (Acc), Matthew’s correlation coefficient (MCC), and F1-measure (F1_M) in each cross-validation test are greater than 94.90%, 0.8977, and 94.59%, respectively. This result indicates that our method is promising in identifying DNA-binding proteins.

4. Discussion

4.1. Selection of Properties for Amino Acids

In addition to the three physical–chemical properties mentioned above, both hydrophilicity and molecular weight of amino acids can play important roles for characterization of proteins. Therefore, one can consider r-combinations of the five properties to describe a protein sequence. The purpose of this paper is to find an appropriate way for converting a protein sequence of 20 kinds of amino acids into a string over a “small” alphabet. If we take r to be 3, by the scheme described in Section 2, the triple ( t ( 1 ) ,   t ( 2 ) , t ( 3 ) ) has at most 2 3 = 8 different forms. This means that the 20 native amino acids can thus be classified into no more than eight groups, whereas if the 5-combination or 4-combination is selected, by the similar scheme, ( t ( 1 ) ,   t ( 2 ) , , t ( r ) ) will have 2 5 = 32 or 2 4 = 16 possible forms. Compared with “20,” the figure is not “small.” Therefore, r is taken to be 3 in this paper. By means of each of the 3-combinations of the five properties, the same experiments are performed. As a result, we find that hydrophobicity, isoelectric point, and relative distance form the best 3-combination.

4.2. Feature Analysis

As we see from Equations (8) and (9), the 28-D feature vector consists of three parts: 20 amino acid compositions; 7 correlation factors; and 1 ALE-index. One may be interested in knowing whether or not the last two parts are significant. First and foremost, let us see what would happen if only the first part was used? Without loss of generality, suppose S is a protein sequence and the counts of 20 native amino acids are n 1 , n 2 , , n 20 , respectively. Then we have a multi-set M ( S ) = { n 1 · A , n 2 · C , , n 20 · Y } . Based on the knowledge of combinatorics, it is not difficult to see that there are a total of | S | ! n 1 ! · n 2 ! · · n 20 ! = ( n 1 + n 2 + · n 20 ) ! n 1 ! · n 2 ! · · n 20 ! different sequence/strings possessing the same amino acid compostion. This suggests that the amino acid composition alone is not sufficient to represent and compare protein sequences. What would happen if only the first two parts were used (i.e., without using the ALE-index)? By using the vector with the first 27 components, experiments I and II are performed. For the first dataset, there is no significant difference between the tree constructed with the 27-D vector and that with the 28-D vector. For the second dataset, the corresponding relationship tree of coronavirus spike proteins is shown in Figure 4. From Figure 4, it is easy to see that MERS-CoVs belonging to Betacoronavirus appear to cluster together with the three Gammacoronaviruses, instead of the other Betacoronaviruses. This phenomenon is disappointing. For the third dataset, we repeat the three cross-validation tests with the 27-D vector and list the corresponding results in Table 7. By comparing Table 7 with Table 6, we can find that the prediction quality diminished slightly. These results indicate that the ALE-index can make a very positive contribution to the performance of experiments.

5. Conclusions

By means of three important physicochemical properties of amino acids, we first classify the 20 native amino acids into six groups, and assign to each group a representative symbol. Then, by substituting each letter with its representative letter, we convert a protein primary sequence into a six-letter sequence, which can be regarded as a coarse-grained description of the protein primary sequence. In comparison with the string composed of 20 kinds of amino acids, the reduced sequence not only makes the generalization from representations of DNA sequences to those of proteins easier, but also enables us to focus more on the information of our interest. On the basis of the six-letter sequence, we obtain a generalized adjacency matrix (GAM) and then its normalized ALE-index. Also, we extract λ order-correlated factors via the reduced sequence. Combining these elements with the frequencies of occurrenceof 20 native amino acids, we constructa ( 21 + λ ) dimensional vector to characterize a protein sequence. Our method is tested byphylogenetic analysis and identification of DNA-binding proteins. The feature analysis implies that the λ + 1 components beyond the amino acid composition play very important roles in the performance of the experiment. As shown in a series of recent publications (see, e.g., [58,67,68,69,70,71,72]) in demonstrating new methods or approaches, user-friendly and publicly accessible web-servers will significantly enhance their impacts [73]. We will make efforts in our future work to further improve our method and provide a web-server for the new method presented.

Acknowledgments

The authors wish to thank the four anonymous referees for their valuable suggestions and support. The authors also thank Ren Zhang, University of Wollongong, Australia, for helpful discussions. This work was partially supported by the National Natural Science Foundation of China (No. 11171042), the Program for Liaoning Innovative Research Team in University (LT2014024), the Natural Science Foundation of Liaoning Province (201602005), and the Liaoning Bai Qian Wan Talents Program (2012921060).

Author Contributions

Chun Li and Yan-Xia Lin conceived the study and wrote the paper. Xueqin Li participated in the design of the study and analysis of the results.

Conflicts of Interest

The authors declare no conflict of interest.

References

  1. Randic, M.; Vracko, M.; Nandy, A.; Basak, S.C. On 3-D graphical representation of DNA primary sequences and their numerical characterization. J. Chem. Inf. Comput. Sci. 2000, 40, 1235–1244. [Google Scholar] [CrossRef] [PubMed]
  2. Yao, Y.H.; Yan, S.; Han, J.; Dai, Q.; He, P.-A. A novel descriptor of protein sequences and its application. J. Theor. Biol. 2014, 347, 109–117. [Google Scholar] [CrossRef] [PubMed]
  3. Hamori, E.; Ruskin, J. H curves, a novel method of representation of nucleotide series especially suited for long DNA sequences. J. Biol. Chem. 1983, 258, 1318–1327. [Google Scholar] [PubMed]
  4. Hamori, E. Novel DNA sequencerepresentations. Nature 1985, 314, 585–586. [Google Scholar] [CrossRef] [PubMed]
  5. Gates, M.A. Simpler DNA sequence representations. Nature 1985, 316, 219. [Google Scholar] [CrossRef] [PubMed]
  6. Jeffrey, H.J. Chaos game representation of gene structure. Nucleic Acids Res. 1990, 18, 2163–2170. [Google Scholar] [CrossRef] [PubMed]
  7. Nandy, A. A new graphical representation and analysis of DNA sequence structure: I Methodology and application to globin genes. Curr. Sci. 1994, 66, 309–314. [Google Scholar]
  8. Nandy, A. Graphical representation of long DNA sequences. Curr. Sci. 1994, 66, 821. [Google Scholar]
  9. Leong, P.M.; Morgenthaler, S. Random walk and gap plots of DNA sequences. Comput. Appl. Biosci. 1995, 11, 503–507. [Google Scholar] [CrossRef] [PubMed]
  10. Zhang, R.; Zhang, C.T. Z curves, an intuitive tool for visualizing and analyzing DNA sequences. J. Biomol. Str. Dyn. 1994, 11, 767–782. [Google Scholar] [CrossRef] [PubMed]
  11. Zhang, R.; Zhang, C.T. A brief review: The Z-curve theory and its application in genome analysis. Curr. Genomics 2014, 15, 78–94. [Google Scholar] [CrossRef] [PubMed]
  12. Randic, M.; Vracko, M.; Lers, N.; Plavsic, D. Analysis ofsimilarity/dissimilarity of DNA sequences based on novel 2-Dgraphical representation. Chem. Phys. Lett. 2003, 371, 202–207. [Google Scholar] [CrossRef]
  13. Randic, M.; Novic, M.; Plavsic, D. Milestones in graphical bioinformatics. Int. J. Quantum Chem. 2013, 113, 2413–2446. [Google Scholar] [CrossRef]
  14. Li, C.; Fei, W.C.; Zhao, Y.; Yu, X.Q. Novel graphical representation and numerical characterization of DNA sequences. Appl. Sci. 2016, 6, 63. [Google Scholar] [CrossRef]
  15. Sen, D.; Dasgupta, S.; Pal, I.; Manna, S.; Basak, S.C.; Nandy, A. Intercorrelation of major DNA/RNA sequence descriptors—A preliminary study. Curr. Comput. Aided Drug Des. 2016, 12, 216–228. [Google Scholar] [CrossRef] [PubMed]
  16. Feng, Z.P.; Zhang, C.T. A graphic representation of protein sequence and predicting the subcellular locations of prokaryotic proteins. Int. J. Biochem. Cell Biol. 2002, 34, 298–307. [Google Scholar] [CrossRef]
  17. Randic, M. 2-D Graphical representation of proteins based on virtual genetic code. SAR QSAR Environ. Res. 2004, 15, 147–157. [Google Scholar] [CrossRef] [PubMed]
  18. Randic, M.; Zupan, J.; Balaban, A.T. Unique graphical representation of protein sequences based on nucleotide triplet codons. Chem. Phys. Lett. 2004, 397, 247–252. [Google Scholar] [CrossRef]
  19. Randic, M.; Butina, D.; Zupan, J. Novel 2-D graphical representation of proteins. Chem. Phys. Lett. 2006, 419, 528–532. [Google Scholar] [CrossRef]
  20. Randic, M.; Zupan, J.; Balaban, A.T.; Vikic-Topic, D.; Plavsic, D. Graphical representation of proteins. Chem. Rev. 2011, 111, 790–862. [Google Scholar] [CrossRef] [PubMed]
  21. Novic, M.; Randic, M. Representation of proteins as walks in 20-D space. SAR QSAR Environ. Res. 2008, 19, 317–337. [Google Scholar]
  22. Aguero-Chapin, G.; Gonzalez-Diaz, H.; Molina, R.; Varona-Santos, J.; Uriarte, E.; Gonzalez-Diaz, Y. Novel 2D maps and coupling numbers for protein sequences. The first QSAR study of polygalacturonases; isolation and prediction of a novel sequence from Psidiumguajava L. FEBS Lett. 2006, 580, 723–730. [Google Scholar] [CrossRef] [PubMed]
  23. Li, C.; Xing, L.L.; Wang, X. 2-D graphical representation of protein sequences and its application to coronavirus phylogeny. BMB Rep. 2008, 41, 217–222. [Google Scholar] [CrossRef] [PubMed]
  24. Nandy, A.; Ghosh, A.; Nandy, P. Numerical characterization of protein sequences and application to voltage-gated sodium channel α subunit phylogeny. Silico Biol. 2009, 9, 77–87. [Google Scholar]
  25. Ghosh, A.; Nandy, A. Graphical representation and mathematical characterization of protein sequences and applications to viral proteins. Adv. Protein Chem. Struct. Biol. 2011, 83, 1–42. [Google Scholar] [PubMed]
  26. Sun, D.D.; Xu, C.R.; Zhang, Y.S. A novel method of 2D graphical representation for proteins and its application. MATCH Commun. Math. Comput. Chem. 2016, 75, 431–446. [Google Scholar]
  27. Qi, Z.H.; Jin, M.Z.; Li, S.L.; Feng, J. A protein mapping method based on physicochemical properties and dimension reduction. Comput. Biol. Med. 2015, 57, 1–7. [Google Scholar] [CrossRef] [PubMed]
  28. Randic, M.; Balaban, A.T. On a four-dimensional representation of DNA primary sequences. J. Chem. Inf. Comput. Sci. 2003, 43, 532–539. [Google Scholar] [CrossRef] [PubMed]
  29. Li, C.; Yang, Y.; Jia, M.D.; Zhang, Y.Y.; Yu, X.Q.; Wang, C.Z. Phylogenetic analysis of DNA sequences based on k-word and rough set theory. Physica A 2014, 398, 162–171. [Google Scholar] [CrossRef]
  30. Randic, M.; Guo, X.F.; Basak, S.C. On the characterization of DNA primary sequences by triplet of nucleic acid bases. J. Chem. Inf. Comput. Sci. 2001, 41, 619–626. [Google Scholar] [CrossRef] [PubMed]
  31. Randic, M.; Vracko, M. On the similarity of DNA primary sequences. J. Chem. Inf. Comput. Sci. 2000, 40, 599–606. [Google Scholar] [CrossRef] [PubMed]
  32. Li, C.; Wang, J. New invariant of DNA sequences. J. Chem. Inf. Model. 2005, 36, 115–120. [Google Scholar] [CrossRef] [PubMed]
  33. Chou, K.C. Prediction of protein cellular attributes using pseudo-amino acid composition. Proteins Struct. Funct. Bioinform. 2001, 43, 246–255. [Google Scholar] [CrossRef] [PubMed]
  34. Chou, K.C. Using amphiphilic pseudo amino acid composition to predict enzyme subfamily classes. Bioinformatics 2005, 21, 10–19. [Google Scholar] [CrossRef] [PubMed]
  35. Cao, D.S.; Xu, Q.S.; Liang, Y.Z. Propy: A tool to generate various modes of Chou’s PseAAC. Bioinformatics 2013, 29, 960–962. [Google Scholar] [CrossRef] [PubMed]
  36. Du, P.; Gu, S.; Jiao, Y. PseAAC-General: Fast building various modes of general form of Chou’s pseudo amino acid composition for large-scale protein datasets. Int. J. Mol. Sci. 2014, 15, 3495–3506. [Google Scholar] [CrossRef] [PubMed]
  37. Chou, K.C. Pseudo amino acid composition and its applications in bioinformatics, proteomics and system biology. Curr. Proteom. 2009, 6, 262–274. [Google Scholar] [CrossRef]
  38. Kabir, M.; Hayat, M. iRSpot-GAEnsC: Identifying recombination spots via ensemble classifier and extending the concept of Chou’s PseAAC to formulate DNA samples. Mol. Genet. Genom. 2016, 291, 285–296. [Google Scholar] [CrossRef] [PubMed]
  39. Tahir, M.; Hayat, M. iNuc-STNC: A sequence-based predictor for identification of nucleosome positioning in genomes by extending the concept of SAAC and Chou’s PseAAC. Mol. Biosyst. 2016, 12, 2587–2593. [Google Scholar] [CrossRef] [PubMed]
  40. Chen, W.; Feng, P.M.; Lin, H.; Chou, K.C. iRSpot-PseDNC: Identify recombination spots with pseudo dinucleotide composition. Nucleic Acids Res. 2013, 41, e68. [Google Scholar] [CrossRef] [PubMed]
  41. Qiu, W.R.; Xiao, X.; Chou, K.C. iRSpot-TNCPseAAC: Identify recombination spots with trinucleotide composition and pseudo amino acid components. Int. J. Mol. Sci. 2014, 15, 1746–1766. [Google Scholar] [CrossRef] [PubMed]
  42. Li, L.Q.; Yu, S.J.; Xiao, W.D.; Li, Y.S.; Huang, L.; Zheng, X.Q.; Zhou, S.W.; Yang, H. Sequence-based identification of recombination spots using pseudo nucleic acid representation and recursive feature extraction by linear kernel SVM. BMC Bioinform. 2014, 15, 340. [Google Scholar] [CrossRef] [PubMed]
  43. Chen, W.; Lei, T.Y.; Jin, D.C.; Chou, K.C. PseKNC: A flexible web-server for generating pseudo K-tuple nucleotide composition. Anal. Biochem. 2014, 456, 53–60. [Google Scholar] [CrossRef] [PubMed]
  44. Chen, W.; Zhang, X.; Brooker, J.; Lin, H.; Zhang, L.Q.; Chou, K.C. PseKNC-General: A cross-platform package for generating various modes of pseudo nucleotide compositions. Bioinformatics 2015, 31, 119–120. [Google Scholar] [CrossRef] [PubMed]
  45. Chen, W.; Lin, H.; Chou, K.C. Pseudo nucleotide composition or PseKNC: An effective formulation for analyzing genomic sequences. Mol. Biosyst. 2015, 11, 2620–2634. [Google Scholar] [CrossRef] [PubMed]
  46. Liu, B.; Liu, F.; Wang, X.L.; Chen, J.; Fang, L.; Chou, K.C. Pse-in-One: A web server for generating various modes of pseudo components of DNA, RNA, and protein sequences. Nucleic Acids Res. 2015, 43, W65–W71. [Google Scholar] [CrossRef] [PubMed]
  47. Grantham, R. Amino acid difference formula to help explain protein. Science 1974, 185, 862–864. [Google Scholar] [CrossRef] [PubMed]
  48. Ma, F.; Wu, Y.T.; Xu, X.F. Correlation analysis of some physical chemistry properties among genetic codons and amino acids. J. Anhui Agric. Univ. 2003, 30, 439–445. [Google Scholar]
  49. Li, C.; Wang, J.; Zhang, Y.; Wang, J. Similarity analysis of protein sequences based on the normalized relative entropy. Comb. Chem. High Throughput Scr. 2008, 11, 477–481. [Google Scholar] [CrossRef]
  50. Hegarat, N.; Francois, J.C.; Praseuth, D. Modern tools for identification of nucleic acid-binding proteins. Biochimie 2008, 90, 1265–1272. [Google Scholar] [CrossRef] [PubMed]
  51. Xu, R.F.; Zhou, J.Y.; Liu, B.; Yao, L.; He, Y.L.; Zou, Q.; Wang, X.L. enDNA-Prot: Identification of DNA-binding proteins by applying ensemble learning. Biomed. Res. Int. 2014, 2014, 294279. [Google Scholar] [CrossRef] [PubMed]
  52. Kumar, K.K.; Pugalenthi, G.; Suganthan, P.N. DNA-Prot: Identification of DNA binding proteins from protein sequence information using random forest. J. Biomol. Struct. Dyn. 2009, 26, 679–686. [Google Scholar] [CrossRef] [PubMed]
  53. Sonnhammer, E.L.; Eddy, S.R.; Durbin, R. Pfam: A comprehensive database of protein domain families based on seed alignments. Proteins 1997, 28, 405–420. [Google Scholar] [CrossRef]
  54. Chang, C.C.; Lin, C.J. Libsvm: A library for support vector machines. ACM Trans. Intell. Syst. Technol. 2011, 2, 1–27. [Google Scholar] [CrossRef]
  55. Hsu, C.W.; Chang, C.C.; Lin, C.J. A Practical Guide to Support Vector Classification. Available online: Https://www.csie.ntu.edu.tw/~cjlin/libsvm (accessed on 17 August 2014).
  56. Lin, H.; Deng, E.Z.; Ding, H.; Chen, W.; Chou, K.C. iPro54-PseKNC: A sequence-based predictor for identifying sigma-54 promoters in prokaryote with pseudo k-tuple nucleotide composition. Nucleic Acids Res. 2014, 42, 12961–12972. [Google Scholar] [CrossRef] [PubMed]
  57. Liu, B.; Fang, L.; Long, R.; Lan, X.; Chou, K.C. iEnhancer-2L: A two-layer predictor for identifying enhancers and their strength by pseudo k-tuple nucleotide composition. Bioinformatics 2016, 32, 362–369. [Google Scholar] [CrossRef] [PubMed]
  58. Jia, J.; Zhang, L.; Liu, Z.; Xiao, X.; Chou, K.C. pSumo-CD: Predicting sumoylation sites in proteins with covariance discriminant algorithm by incorporating sequence-coupled effects into general PseAAC. Bioinformatics 2016, 32, 3133–3141. [Google Scholar] [CrossRef] [PubMed]
  59. Chen, W.; Feng, P.; Ding, H.; Lin, H.; Chou, K.C. Using deformation energy to analyze nucleosome positioning in genomes. Genomics 2016, 107, 69–75. [Google Scholar] [CrossRef] [PubMed]
  60. Chen, W.; Tang, H.; Ye, J.; Lin, H.; Chou, K.C. iRNA-PseU: Identifying RNA pseudouridine sites. Mol. Ther. Nucleic Acids 2016, 5, e332. [Google Scholar]
  61. Chou, K.C.; Wu, Z.C.; Xiao, X. iLoc-Euk: A Multi-Label Classifier for Predicting the Subcellular Localization of Singleplex and Multiplex Eukaryotic Proteins. PLoS ONE 2011, 6, e18258. [Google Scholar] [CrossRef] [PubMed]
  62. Chou, K.C.; Wu, Z.C.; Xiao, X. iLoc-Hum: Using accumulation-label scale to predict subcellular locations of human proteins with both single and multiple sites. Mol. Biosyst. 2012, 8, 629–641. [Google Scholar] [CrossRef] [PubMed]
  63. Wu, Z.C.; Xiao, X.; Chou, K.C. iLoc-Plant: A multi-label classifier for predicting the subcellular localization of plant proteins with both single and multiple sites. Mol. Biosyst. 2011, 7, 3287–3297. [Google Scholar] [CrossRef] [PubMed]
  64. Lin, W.Z.; Fang, J.A.; Xiao, X.; Chou, K.C. iLoc-Animal: A multi-label learning classifier for predicting subcellular localization of animal proteins. Mol. Biosyst. 2013, 9, 634–644. [Google Scholar] [CrossRef] [PubMed]
  65. Xiao, X.; Wang, P.; Lin, W.Z.; Jia, J.H.; Chou, K.C. iAMP-2L: A two-level multi-label classifier for identifying antimicrobial peptides and their functional types. Anal. Biochem. 2013, 436, 168–177. [Google Scholar] [CrossRef] [PubMed]
  66. Chou, K.C. Some remarks on predicting multi-label attributes in molecular biosystems. Mol. Biosyst. 2013, 9, 1092–1100. [Google Scholar] [CrossRef] [PubMed]
  67. Qiu, W.R.; Sun, B.Q.; Xiao, X.; Xu, Z.C.; Chou, K.C. iPTM-mLys: Identifying multiple lysine PTM sites and their different types. Bioinformatics 2016, 32, 3116–3123. [Google Scholar] [CrossRef] [PubMed]
  68. Qiu, W.R.; Sun, B.Q.; Xiao, X. iHyd-PseCp: Identify hydroxyproline and hydroxylysine in proteins by incorporating sequence-coupled effects into general PseAAC. Oncotarget 2016, 7, 44310–44321. [Google Scholar] [CrossRef] [PubMed]
  69. Qiu, W.R.; Xiao, X.; Xu, Z.H.; Chou, K.C. iPhos-PseEn: Identifying phosphorylation sites in proteins by fusing different pseudo components into an ensemble classifier. Oncotarget 2016, 7, 51270–51283. [Google Scholar] [CrossRef] [PubMed]
  70. Chen, W.; Ding, H.; Feng, P.; Lin, H.; Chou, K.C. iACP: A sequence-based tool for identifying anticancer peptides. Oncotarget 2016, 7, 16895–16909. [Google Scholar] [CrossRef] [PubMed]
  71. Jia, J.; Liu, Z.; Xiao, X.; Liu, B.X.; Chou, K.C. iCar-PseCp: Identify carbonylation sites in proteins by Monto Carlo sampling and incorporating sequence coupled effects into general PseAAC. Oncotarget 2016, 7, 34558–34570. [Google Scholar] [CrossRef] [PubMed]
  72. Xiao, X.; Ye, H.X.; Liu, Z.; Jia, J.H.; Chou, K.C. iROS-gPseKNC: Predicting replication origin sites in DNA by incorporating dinucleotide position-specific propensity into general pseudo nucleotide composition. Oncotarget 2016, 7, 34180–34189. [Google Scholar] [CrossRef] [PubMed]
  73. Chou, K.C. Impacts of bioinformatics to medicinal chemistry. Med. Chem. 2015, 11, 218–234. [Google Scholar] [CrossRef] [PubMed]
Figure 1. A schematic diagram to show: (a) the first-tier; (b) the second tier; and (c) the third-tier sequence order correlation mode along a sequence. Where the regular hexagon is used to show that each element of the sequence corresponds to one of the six amino acid groups.
Applsci 06 00406 g001
Figure 2. The relationship tree of 17 species.
Applsci 06 00406 g002
Figure 3. The relationship tree of 72 coronavirus spike proteins.
Applsci 06 00406 g003
Figure 4. The relationship tree of the coronavirus spike proteins with the 27-D vector.
Applsci 06 00406 g004
Table 1. The original numerical values for the properties of the 20 native amino acids.
Amino Acid (AA)Hydrophobicity a ( P 1 0 )pI b ( P 2 0 )RD b ( P 3 0 )
A0.626.021889
C0.295.023355
D−0.902.972209
E−0.743.221812
F1.195.481916
G0.485.972078
H−0.407.591507
I1.386.021765
K−1.509.741797
L1.065.981822
M0.645.751689
N−0.785.421943
P0.126.301720
Q−0.855.651538
R−2.5310.761697
S−0.185.682000
T−0.056.531469
V1.085.971680
W0.815.892317
Y0.265.661787
a Taken from [41]; b Taken from [47,48,49].
Table 2. The normalized values for the properties of the 20 native amino acids.
AA P 1 * P 2 * P 3 *
A0.80560.39150.2227
C0.72120.26321.0000
D0.416900.3924
E0.45780.03210.1819
F0.95140.32220.2370
G0.76980.38510.3229
H0.54480.59310.0201
I1.00000.39150.1569
K0.26340.86910.1739
L0.91820.38640.1872
M0.81070.35690.1166
N0.44760.31450.2513
P0.67770.42750.1331
Q0.42970.34400.0366
R01.00000.1209
S0.60100.34790.2815
T0.63430.45700
V0.92330.38510.1119
W0.85420.37480.4496
Y0.71360.34530.1686
P n ¯ 0.64710.39940.2283
Table 3. The values for properties of the six groups.
GroupRepresentative P 1 P 2 P 3
GIA0.86190.37610.1607
GIIC0.82420.33630.5024
GIIID0.48850.22080.3084
GIVE0.44370.18810.1092
GVH0.36060.72980.0787
GVIP0.67770.42750.1331
Table 4. The β-globin protein of 17 species.
No.SpeciesAccession NumberLength (aa)
1HumanALU64020147
2GorillaP02024147
3ChimpanzeeP68873147
4CattleCAA25111145
5BantengBAJ05126145
6GoatAAA30913145
7SheepABC86525145
8European hareCAA68429147
9RabbitCAA24251147
10House mouseADD52660147
11Western wild mouseACY03394147
12Spiny mouseACY03377147
13Norway ratCAA29887147
14OpossumAAA30976147
15GuttataACH46399147
16GallusCAA23700147
17Muscovy duckCAA33756147
Table 5. The accession number, name and abbreviation for 72 coronavirus spike proteins.
NO.Accession NumberVirus Name/StrainAbbreviation
1CAB91145Transmissible gastroenteritis virus, genomic RNATGEVG
2NP_058424Transmissible gastroenteritis virusTGEV
3AAK38656Porcine epidemic diarrhea virus strain CV777PEDVC
4NP_598310Porcine epidemic diarrhea virusPEDV
5BAL45637Human coronavirus 229EHCoV-229E
6AAP92675Avian infectious bronchitis virus isolate BJIBVBJ
7AAS00080Avian infectious bronchitis virus strain Ca199IBVC
8NP_040831Avian infectious bronchitis virusIBV
9NP_937950Human coronavirus OC43HCoV-OC43
10AAK83356Bovine coronavirus isolate BCoV-ENTBCoVE
11AAL57308Bovine coronavirus isolate BCoV-LUNBCoVL
12AAA66399Bovine coronavirus strain MebusBCoVM
13AAL40400Bovine coronavirus strain QuebecBCoVQ
14NP_150077Bovine coronavirusBCoV
15AAB86819Mouse hepatitis virus strain MHV-A59C12 mutantMHVA
16YP_209233Murine hepatitis virus strain JHMMHVJHM
17AAF69334Mouse hepatitis virus strain Penn 97-1MHVP
18AAF69344Mouse hepatitis virus strain ML-10MHVM
19NP_045300Mouse hepatitis virusMHV
20AAU04646SARS coronavirus civet007civet007
21AAU04649SARS coronavirus civet010civet010
22AAU04664SARS coronavirus civet020civet020
23AAV91631SARS coronavirus A022A022
24AAV49730SARS coronavirus B039B039
25AAP51227SARS coronavirus GD01GD01
26AAS00003SARS coronavirus GZ02GZ02
27AAP30030SARS coronavirus BJ01BJ01
28AAP13567SARS coronavirus CUHK-W1CUHK-W1
29AAP37017SARS coronavirus TW1TW1
30AAR87523SARS coronavirus TW2TW2
31BAC81348SARS coronavirus TWH genomic RNATWH
32BAC81362SARS coronavirus TWJ genomic RNATWJ
33AAQ01597SARS coronavirus Taiwan TC1TaiwanTC1
34AAQ01609SARS coronavirus Taiwan TC2TaiwanTC2
35AAP97882SARS coronavirus Taiwan TC3TaiwanTC3
36AAP13441SARS coronavirus UrbaniUrbani
37AAP72986SARS coronavirus HSR 1HSR1
38AAQ94060SARS coronavirus ASAS
39AAP94737SARS coronavirus CUHK-AG01CUHK-AG01
40AAP94748SARS coronavirus CUHK-AG02CUHK-AG02
41AAP94759SARS coronavirus CUHK-AG03CUHK-AG03
42AAP30713SARS coronavirus CUHK-Su10CUHK-Su10
43AAP33697SARS coronavirus Frankfurt 1Frankfurt1
44AAR14803SARS coronavirus PUMC01PUMC01
45AAR14807SARS coronavirus PUMC02PUMC02
46AAR14811SARS coronavirus PUMC03PUMC03
47AAP41037SARS coronavirus TOR2TOR2
48AAP50485SARS coronavirus FRAFRA
49AAR23250SARS coronavirus Sin01-11Sino1-11
50AHX00731MERS coronavirusKFU-HKU1
51AHX00711MERS coronavirusKFU-HKU13
52AHX00721MERS coronavirusKFU-HKU19Dam
53AIY60578MERS coronavirusAbu-Dhabi_UAE_9
54AIY60568MERS coronavirusAbu-Dhabi_UAE_33
55AIZ74417MERS coronavirusHu-France(UAE)-FRA1
56AIZ74433MERS coronavirusHu-France-FRA2
57ALJ54502MERS coronavirusHu/Qunfidhah-KSA-Rs1338
58AKN24821MERS coronavirusKFMC-1
59AKN24830MERS coronavirusKFMC-7
60ALJ76282MERS coronavirusHu/Taif, KSA-2083
61ALJ76281MERS coronavirusHu/Taif, KSA-5920
62ALJ54493MERS coronavirusHu/Makkah-KSA-728
63ALB08267MERS coronavirusKOREA/Seoul/014-1
64ALB08278MERS coronavirusKOREA/Seoul/014-2
65ALR69641MERS coronavirusD2731.3
66AKQ21055MERS coronavirusADFCA-HKU1
67AKQ21064MERS coronavirusADFCA-HKU2
68AKQ21073MERS coronavirusADFCA-HKU3
69ALA50001MERS coronaviruscamel/Taif/T68
70ALA50012MERS coronaviruscamel/Taif/T89
71ALT66813MERS coronavirusJordan_1
72ALT66802MERS coronavirusJordan_10
Table 6. The results of three different cross-validation tests.
Test123Average
Sn (%)95.2894.7295.0095.00
Sp (%)94.5795.0695.0694.90
Acc (%)94.9094.9095.0394.94
MCC0.89780.89770.90040.8986
F1_M (%)94.6294.5994.7394.65
Table 7. Results of the three cross-validation tests with the 27-D vector.
Test123Average
Sn (%)95.0093.6194.4494.35
Sp (%)94.3294.3295.0694.57
Acc (%)94.6493.9994.7894.47

