Article

Frequency-Dependent Amplitude Panning for the Stereophonic Image Enhancement of Audio Recorded Using Two Closely Spaced Microphones

School of Information and Communications, Gwangju Institute of Science and Technology (GIST), Gwangju 61005, Korea
*
Author to whom correspondence should be addressed.
Appl. Sci. 2016, 6(2), 39; https://doi.org/10.3390/app6020039
Submission received: 19 November 2015 / Revised: 19 January 2016 / Accepted: 21 January 2016 / Published: 1 February 2016
(This article belongs to the Special Issue Audio Signal Processing)

Abstract

:
In this paper, we propose a new frequency-dependent amplitude panning method for stereophonic image enhancement applied to a sound source recorded using two closely spaced omni-directional microphones. The ability to detect the direction of such a sound source is limited due to weak spatial information, such as the inter-channel time difference (ICTD) and inter-channel level difference (ICLD). Moreover, when sound sources are recorded in a convolutive or a real room environment, the detection of sources is affected by reverberation effects. Thus, the proposed method first tries to estimate the source direction depending on the frequency using azimuth-frequency analysis. Then, a frequency-dependent amplitude panning technique is proposed to enhance the stereophonic image by modifying the stereophonic law of sines. To demonstrate the effectiveness of the proposed method, we compare its performance with that of a conventional method based on the beamforming technique in terms of directivity pattern, perceived direction, and quality degradation under three different recording conditions (anechoic, convolutive, and real reverberant). The comparison shows that the proposed method gives us better stereophonic images in a stereo loudspeaker reproduction than the conventional method without any annoying effects.

1. Introduction

Stereo loudspeaker reproduction is widely used to provide a more natural listening experience because of the distinguished relative positions of objects and events in the horizontal plane [1]. In fact, a stereo audio system can deliver a more immersive illusion than a mono system, because spatial information (e.g., inter-channel time difference (ICTD) and inter-channel level difference (ICLD) [2]) helps listeners perceive a horizontal direction [3]. In addition, according to duplex theory [2], the ICTD and ICLD are dominant for horizontal sound localization at low frequencies (below 1–2 kHz) and high frequencies (above 1–2 kHz), respectively.
Stereo audio recording techniques can be classified into three different categories depending on the placement and characteristics of microphones: coincident, near-coincident, and spaced recording techniques [4,5]. Coincident recording techniques such as the XY and mid-side (MS) techniques [5] place stereo microphones as close together as possible at different angles to capture a stereophonic image, where the stereophonic image is about sound recording and reproduction concerning the perceived spatial locations of the sound source. Thus, a good stereophonic image means that the location of the sound source can be clearly perceived, while a poor one means that the location of the source is difficult to be perceived [6]. In addition, near-coincident recording techniques such as the Office de Radiodiffusion Télévision Française (ORTF) and Nederlandse Omroep Stichting (NOS) techniques [4,7] place microphones slightly apart. In the ORTF technique, the microphone spacing is similar to the human ear spacing, while the spacing for the NOS technique is approximately 30 cm. In general, both coincident and near-coincident recording techniques utilize directional microphones to realize good directional characteristics [4]. However, with spaced recording techniques, including AB techniques [4,8], stereophonic images can be obtained by the ICTD between stereo microphones, because omni-directional microphones are often used in such techniques [4,9].
To date, numerous portable video and audio capture devices have been released to the market. These devices usually capture stereo audio as well as high-quality video. Unfortunately, because most portable devices are limited in size, and coincident or near-coincident recording techniques are most appropriate for such devices. However, when the audio signals captured by these recording techniques are reproduced, the stereophonic images often do not feel sufficient [10,11,12,13]. This is because the body of a portable device equipped with directional microphones acts as wall reflection in a recording, which is referred to as shadowed directivity [10]. As an alternative, a spaced recording technique can be applied to capture stereo audio from such portable devices [11,12,13]. In this case, the width or length of the portable device body such as a smart phone or digital camera is approximately 10 cm, thus the allowable distance between two microphones is less than 3 cm. This hardware limitation makes it difficult to match the perceived azimuth angle of the reproduced sound source to the actual that of the original sound source, when a spaced recording technique is applied [8].
To mitigate this, a stereophonic image enhancement method using head-related transfer functions (HRTFs) was proposed in [11]. This method was more successful at enhancing stereophonic images than original stereo signals, but it had a somewhat limited sweet spot, and it was difficult to deliver reliable stereo quality to a listener located beyond this sweet spot. If the original stereo signals were nearly monaural signals, it is difficult to enhance a stereophonic image properly, even though the illusion of wider stereo loudspeaker spacing is created. Umayahara et al. proposed a stereophonic image control method that linearly interpolated the spectra of the left and right channels in the frequency domain [12]. This method used the same interpolation factor for all frequencies; thus, its performance for enhancing a stereophonic image might have been limited when the direction of the input stereo signals was dependent on the frequency [14]. In another study, a delay-and-sum (DS) beamformer was utilized to convert AB stereo signals into XY stereo signals [13]. However, in real reverberant recording environments, the DS beamformer changed the direction of stereophonic images due to the reverberant effects [15]. This was because the reverberation time changed according to the frequency, and the DS beamforming weights could not be adapted to this reverberation time change [14]. These results suggest that frequency-dependent amplitude panning for stereophonic image enhancement is necessary for real reverberant environments.
Accordingly, we propose frequency-dependent amplitude panning for stereophonic image enhancement when two omni-directional microphones are closely spaced, as deployed in portable devices. In [16,17], frequency-dependent amplitude panning was also used to enhance the stereophonic image for portable devices equipped with closely spaced stereo microphones, where the ratio of spectral magnitudes between the left- and right-channel signal was used for the panning. On the other hand, the proposed method first introduces azimuth-frequency (A-F) analysis [18] to estimate the direction of the input audio according to frequency. In other words, we first apply short-time Fourier transform (STFT) to the input stereo audio signal, and then project the spectral component of each frequency bin on an azimuth plane that is generated by converting the time difference between two microphones into their level difference. Next, the direction at each frequency bin is assigned as the azimuth at which the projected magnitude is minimized. Finally, a frequency-dependent amplitude panning technique is proposed to enhance the stereophonic image by modifying the stereophonic law of sines [19].
To evaluate the performance of the proposed method, three different recording environments are considered: anechoic, convolutive, and real reverberant. First, the directivity pattern of the proposed method is compared with that of a conventional method based on the DS beamformer [13] in the three recording environments. Second, the directional accuracy of the stereo audio processed by the proposed method is compared to that of the audio processed by the conventional method by measuring the subjective directions of listeners depending on the horizontal direction of the sources. Finally, a degraded mean opinion score (DMOS) assessment [20] is carried out to evaluate the quality as an aspect of the audio distortion after the proposed method has been applied.
The remainder of this paper is organized as follows: a conventional method based on the DS beamformer [13] is described in Section 2. Section 3 describes the proposed stereophonic image enhancement method based on A-F analysis and a frequency-dependent amplitude panning technique. Section 4 then evaluates the performance of the proposed method applied to audio signals recorded in anechoic, convolutive, and real reverberant environments. Finally, Section 5 concludes this paper.

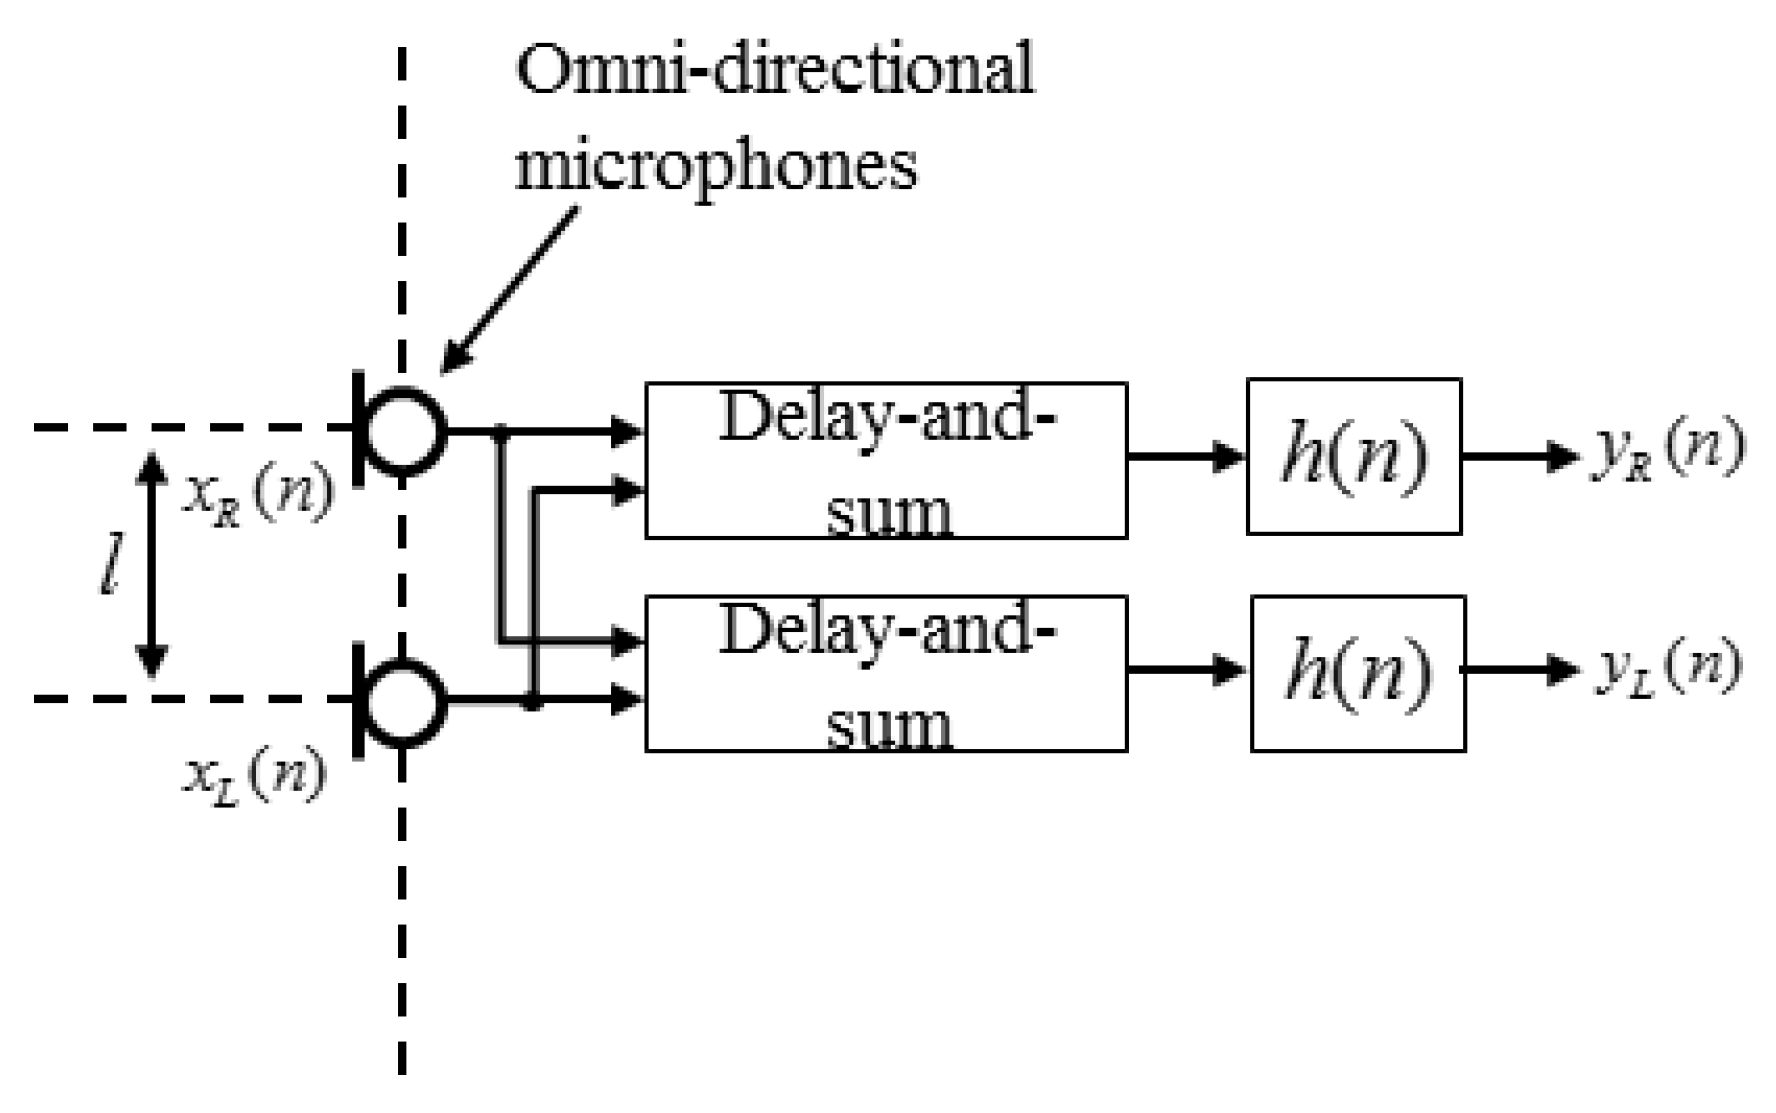
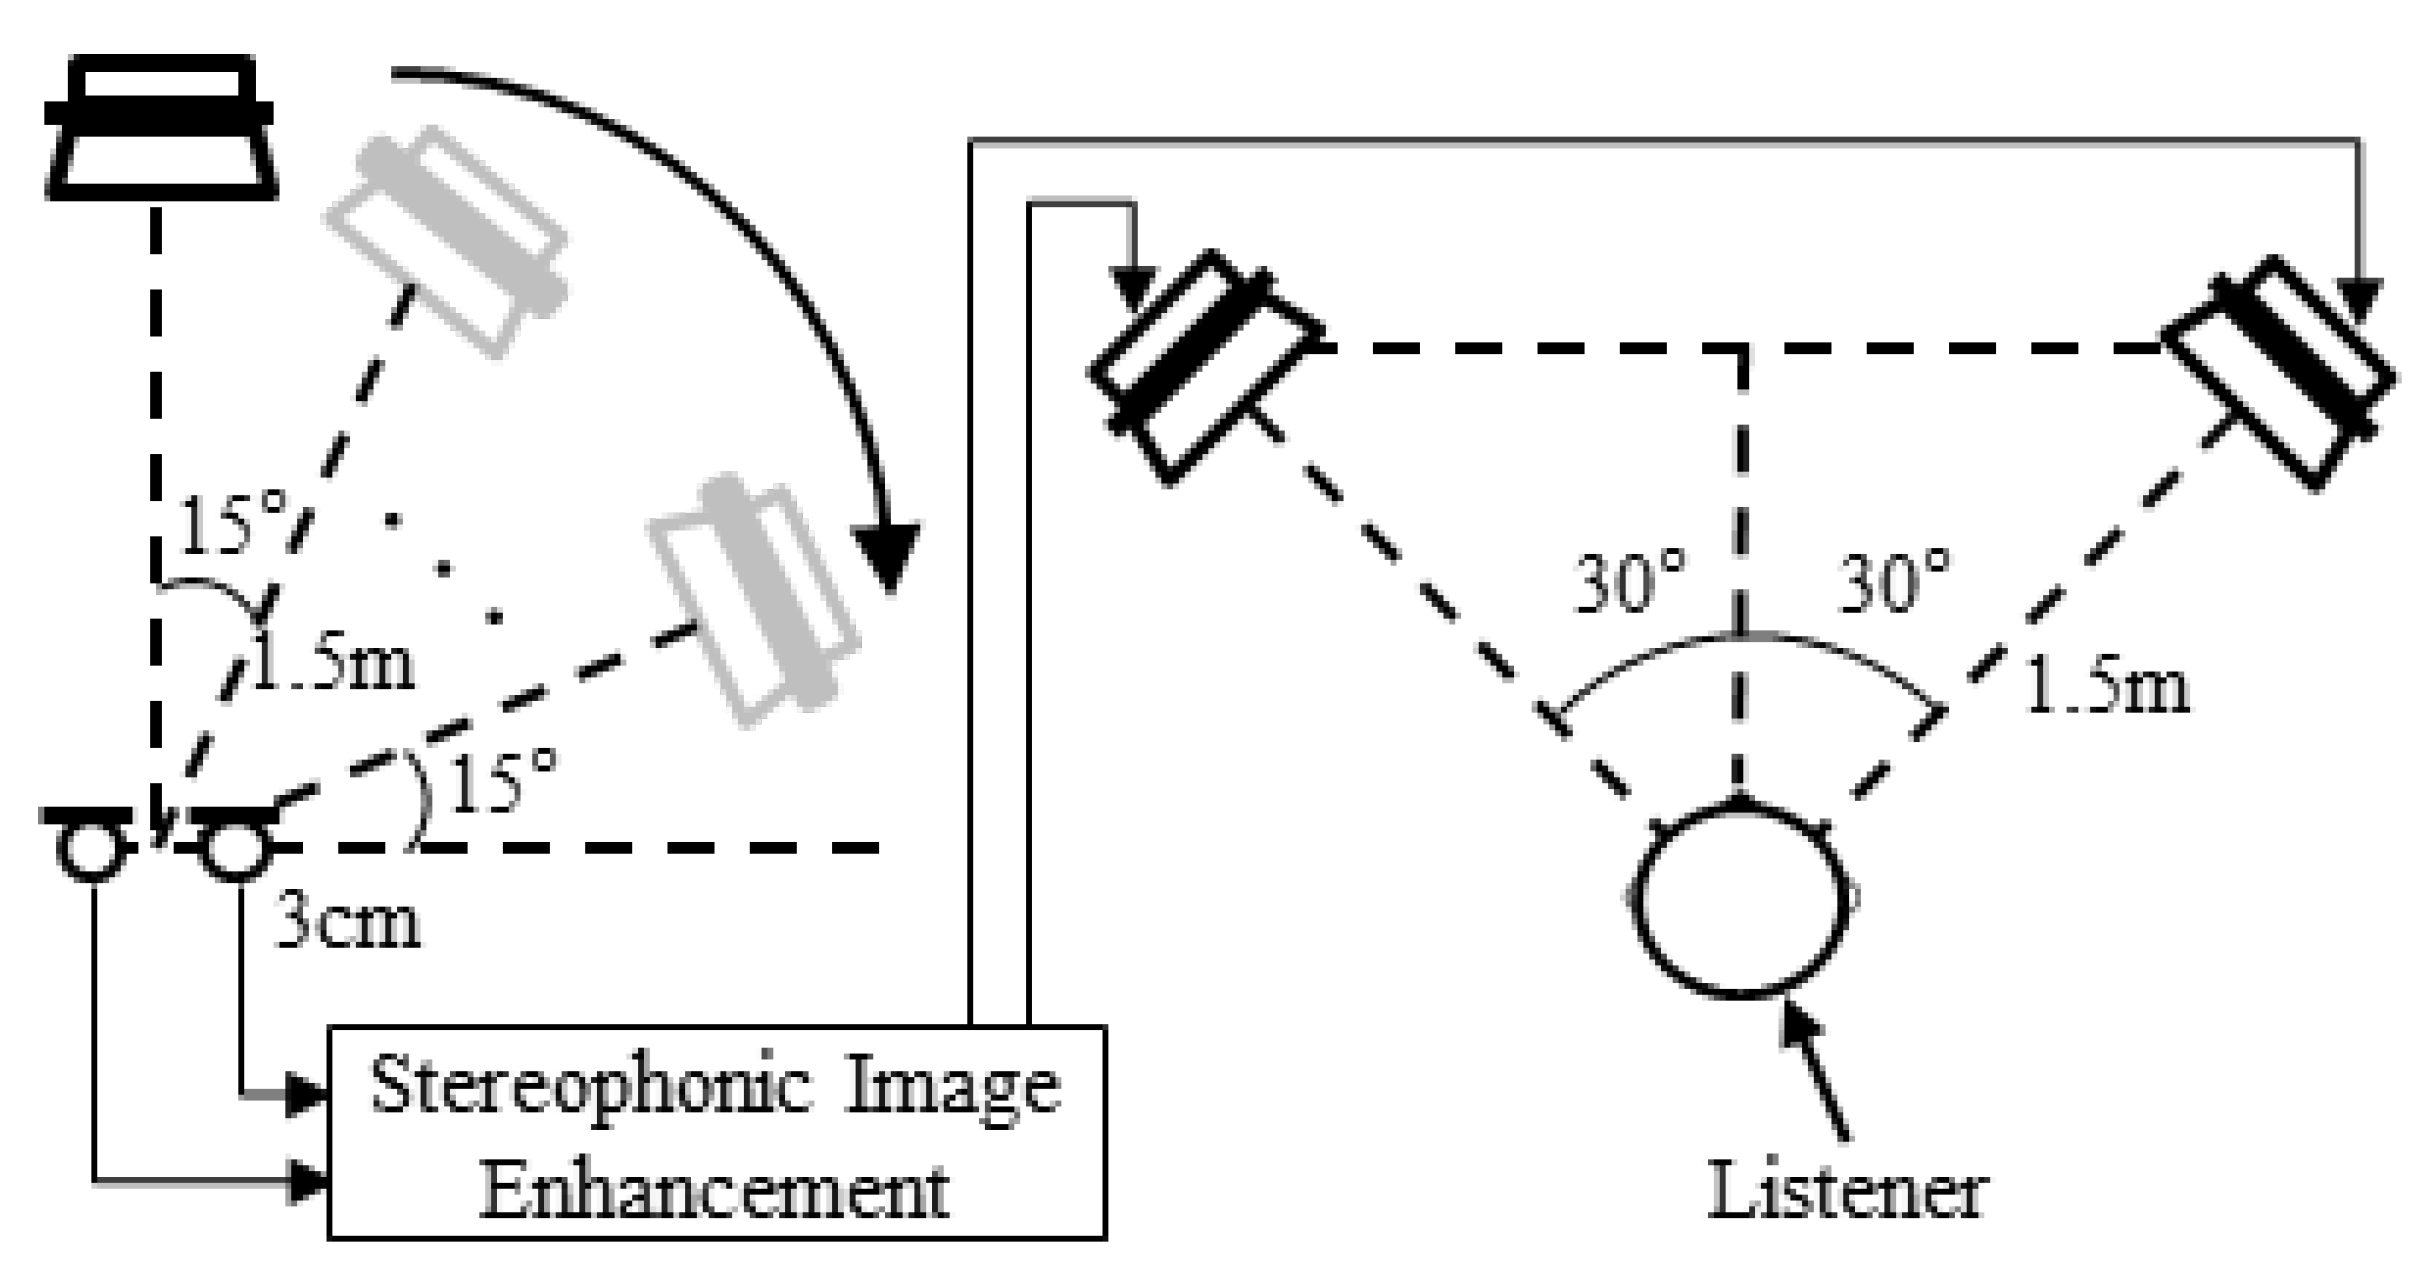
2. Conventional Stereophonic Image Enhancement

In this section, we describe a conventional stereophonic image enhancement method applied to closely spaced omni-directional microphones based on a DS beamforming technique [13,21]. Figure 1 shows a block diagram of the conventional method. As shown in the figure, the DS beamformer of the conventional method compensates for the delay between the two channels, where the delay, n d , is determined depending on the distance, l , between the two microphones. After that, a free-field response filter, h ( n ) , [13] is applied to the beamformed signals to obtain the enhanced stereo signals, y L ( n ) and y R ( n ) , respectively by:
y L ( n ) = h ( n ) ( x R ( n ) x L ( n n d ) )
y R ( n ) = h ( n ) ( x L ( n ) x R ( n n d ) )
where indicates the linear convolution operator, and x L ( n ) and x R ( n ) are the stereo audio sequences obtained by the omni-directional microphones.
Figure 1. Block diagram of a conventional stereophonic image enhancement method.
Applsci 06 00039 g001
The directivity patterns for the beamformed signal of the left channel at 2.5 kHz and 4 kHz are depicted in Figure 2a,b, respectively. Note that the directivity patterns for the right channel are exactly the opposite of those for the left channel. As illustrated in the figure, the conventional method provides different directional responses depending on the frequency. That is, it has a cardioid and a super-cardioid directivity pattern for 2.5 and 4 kHz, respectively. It is expected that the stereophonic image of the audio signal at 2.5 kHz should be enhanced but that at 4 kHz could be distorted due to the negative rear lobe of the super-cardioid pattern [13]. To remedy this problem, a Wiener filter has been applied to the beamformed signal to reduce the negative rear-lobe effects [13]. Nevertheless, it was reported that the DS beamformer with a Wiener filter could not change the direction of a stereophonic image when audio recording was performed in a reverberant environment [13]. This is because the reverberation time differs from the frequency and the DS beamformer cannot be adapted to such reverberation time changes [14].
Figure 2. Directivity patterns of the DS beamformer ( l = 3 cm, direction = 90°) at (a) 2.5 kHz and (b) 4 kHz.
Applsci 06 00039 g002
Therefore, we propose a method that operates differently depending on the frequency, referred to as the frequency-dependent amplitude panning for stereophonic image enhancement (FDAP-SIE) method and compare the performance of our proposed method with that of the DS beamformer described in this section.

3. Proposed Frequency-Dependent Amplitude Panning for Stereophonic Image Enhancement
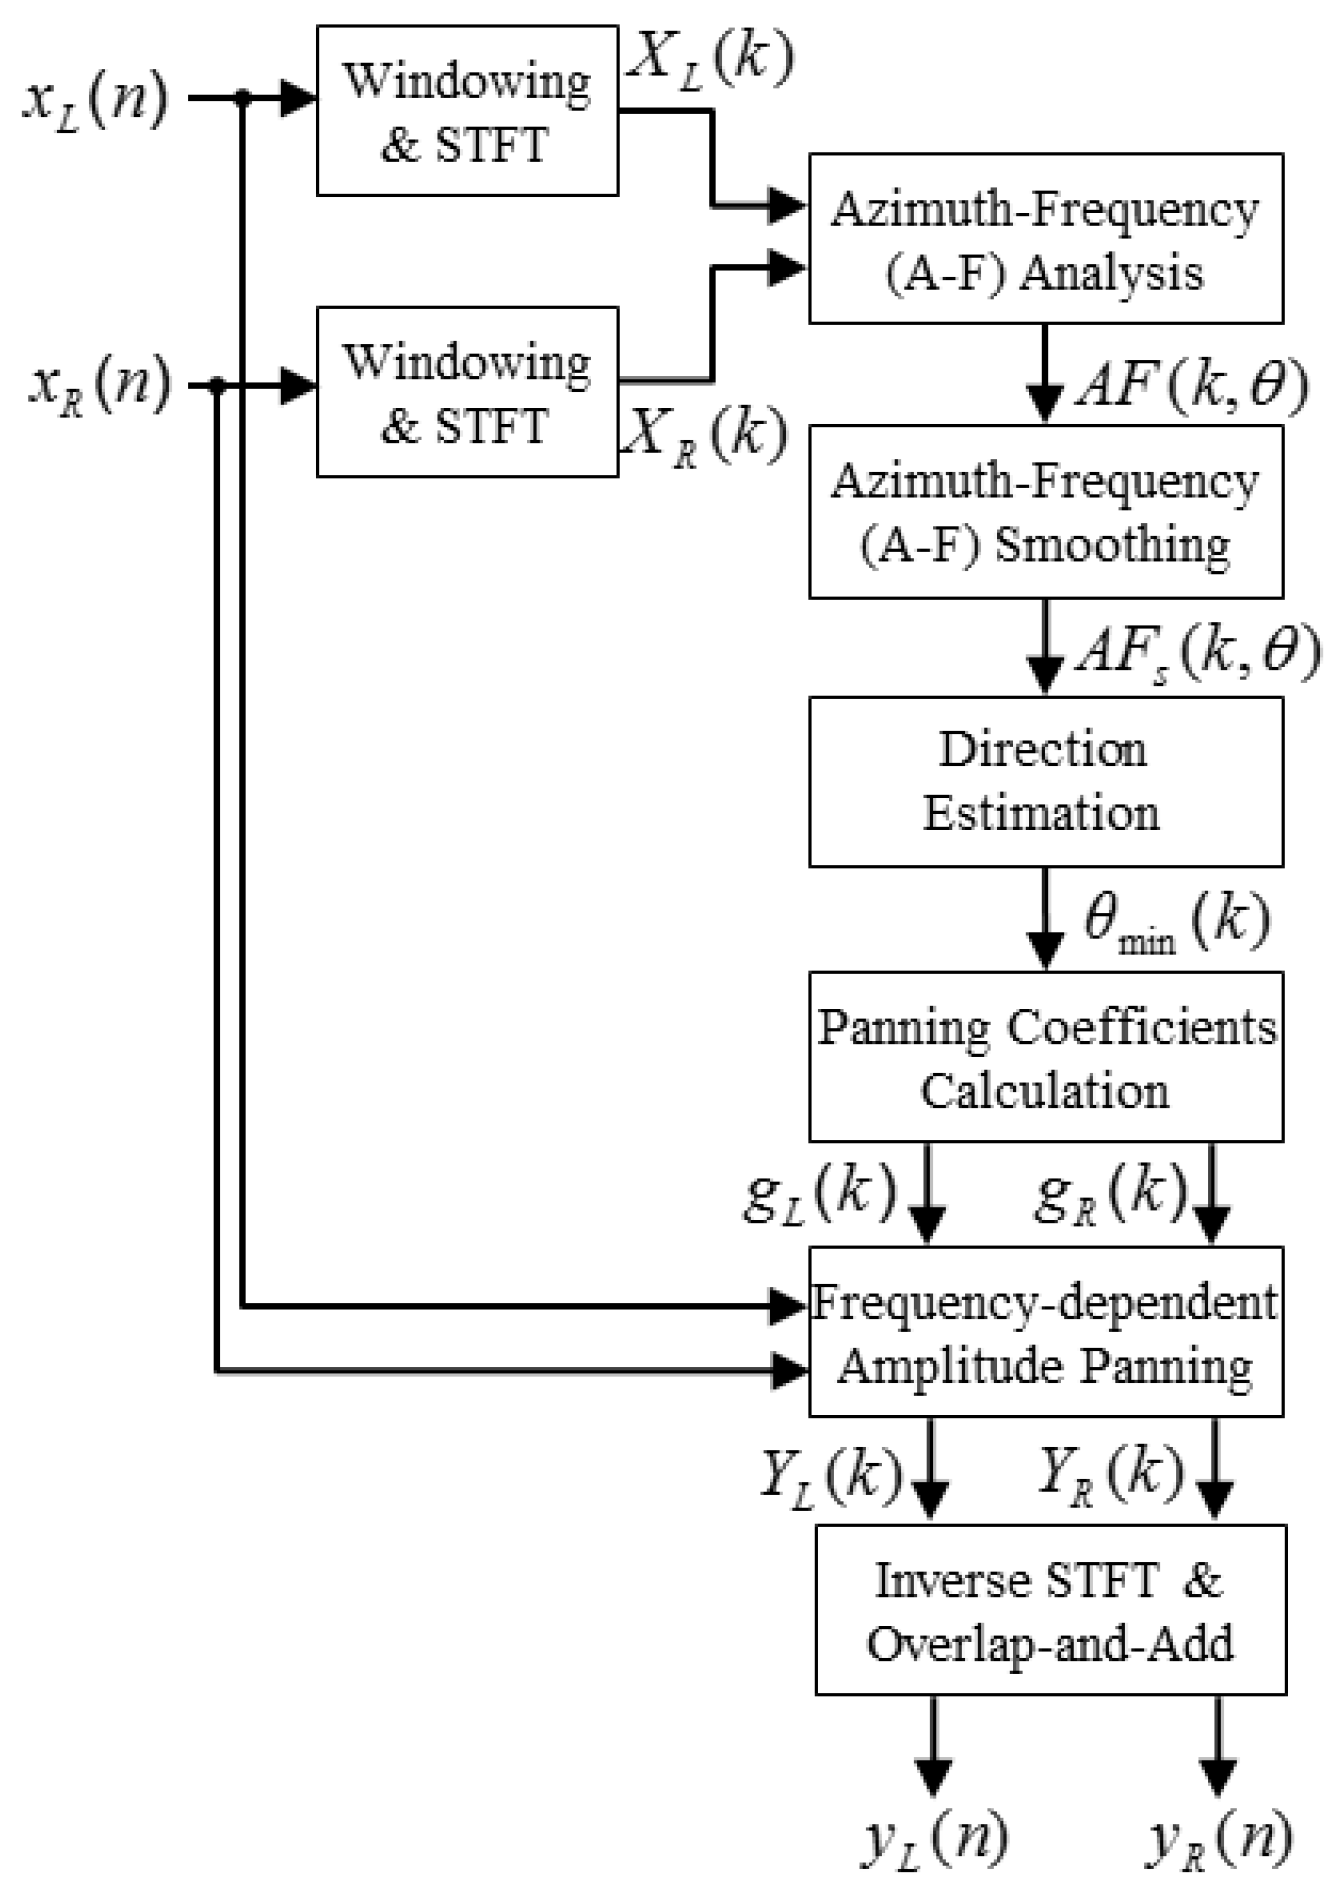
3.1. Overview

In this section, we propose an FDAP-SIE method applied to audio recording with two closely spaced omni-directional microphones and illustrate the block diagram of the proposed method in Figure 3. First, the left- and right-channel input signals, respectively designated x L ( n ) and x R ( n ) , are each segmented into a sequence of frames of 2048 samples by applying a Hanning window, and each frame is overlapped with 1024 samples of the previous frame. Then, a 2048-point STFT is applied to each segment to obtain X L ( k ) and X R ( k ) . Next, A-F analysis is carried out to estimate the direction of the sound sources in each frequency bin. After that, frequency-dependent amplitude panning is applied to X L ( k ) and X R ( k ) according to the estimated direction for the k-th frequency bin. Finally, an inverse STFT followed by an overlap-add method is applied to obtain the enhanced stereophonic signal.
Figure 3. Block diagram of the proposed frequency-dependent amplitude panning for stereophonic image enhancement.
Applsci 06 00039 g003

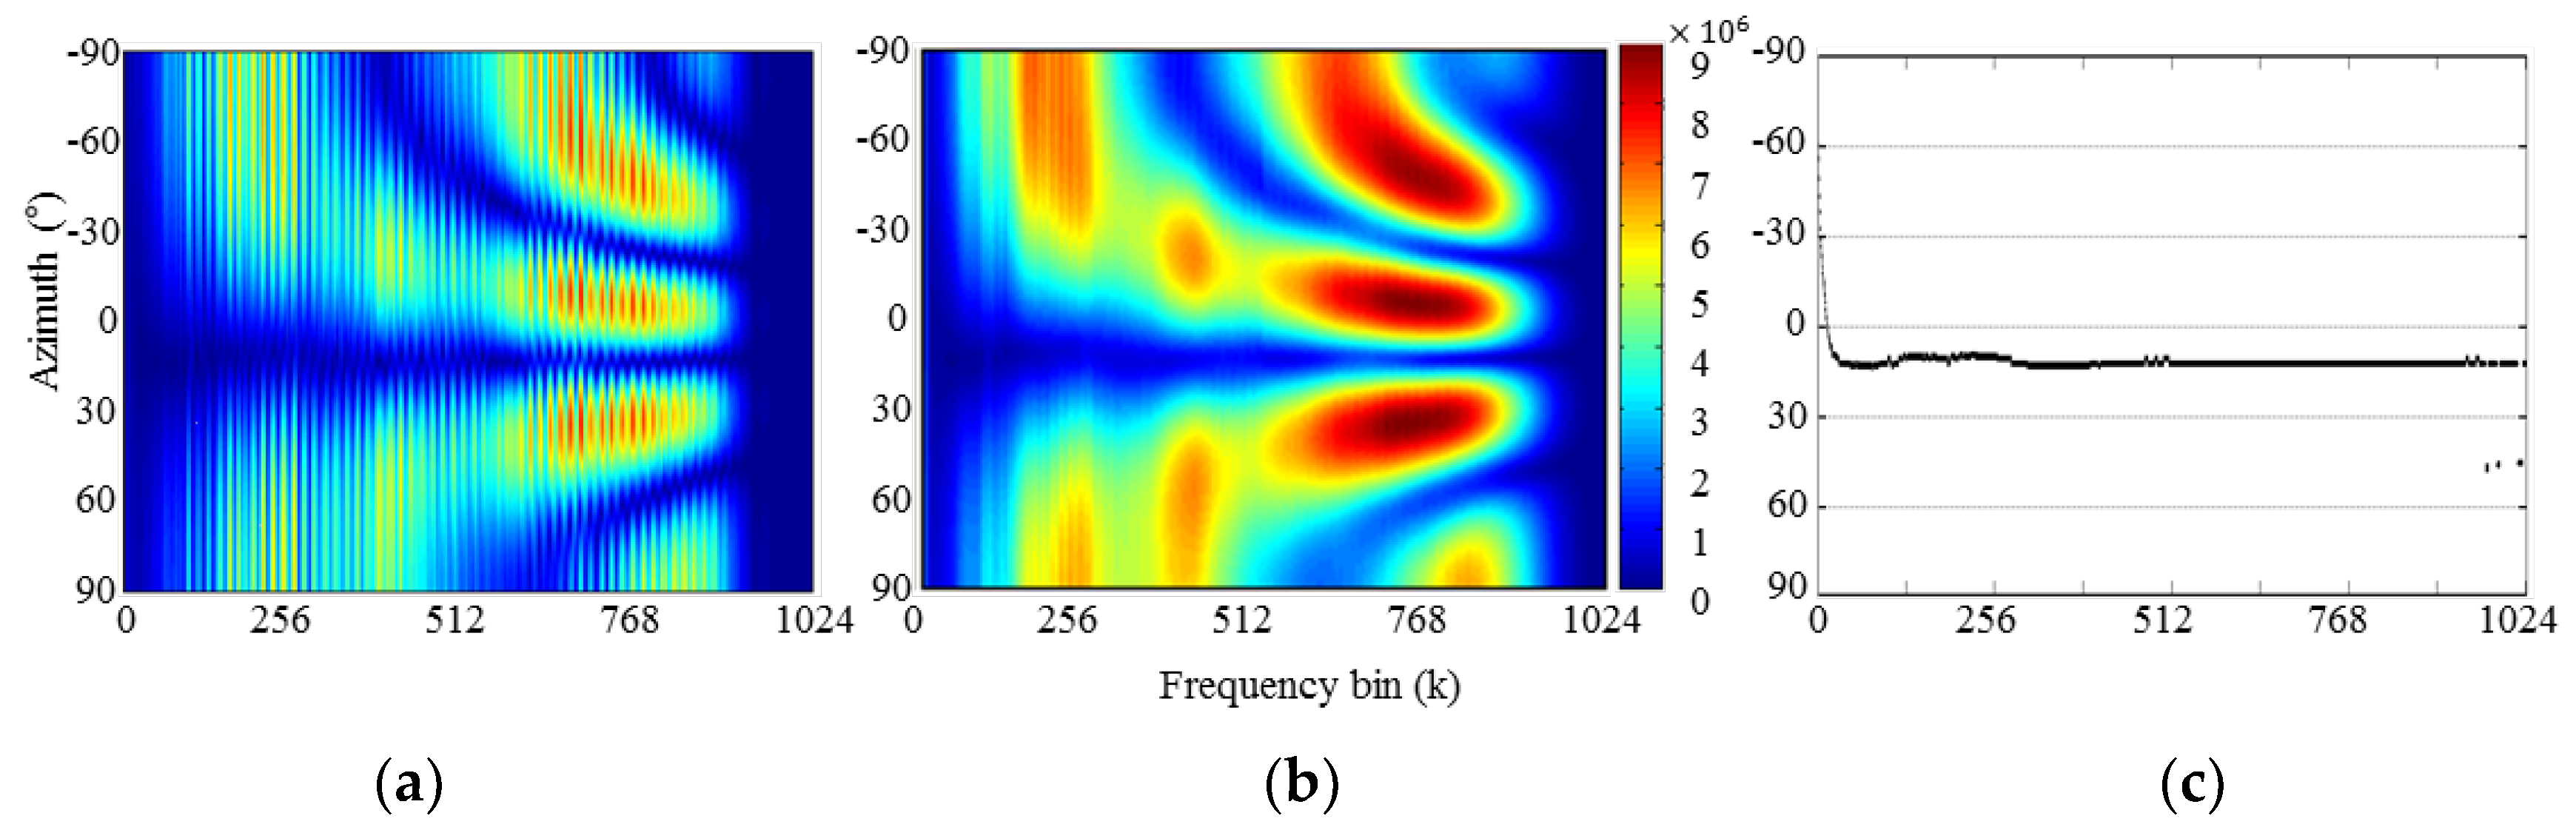
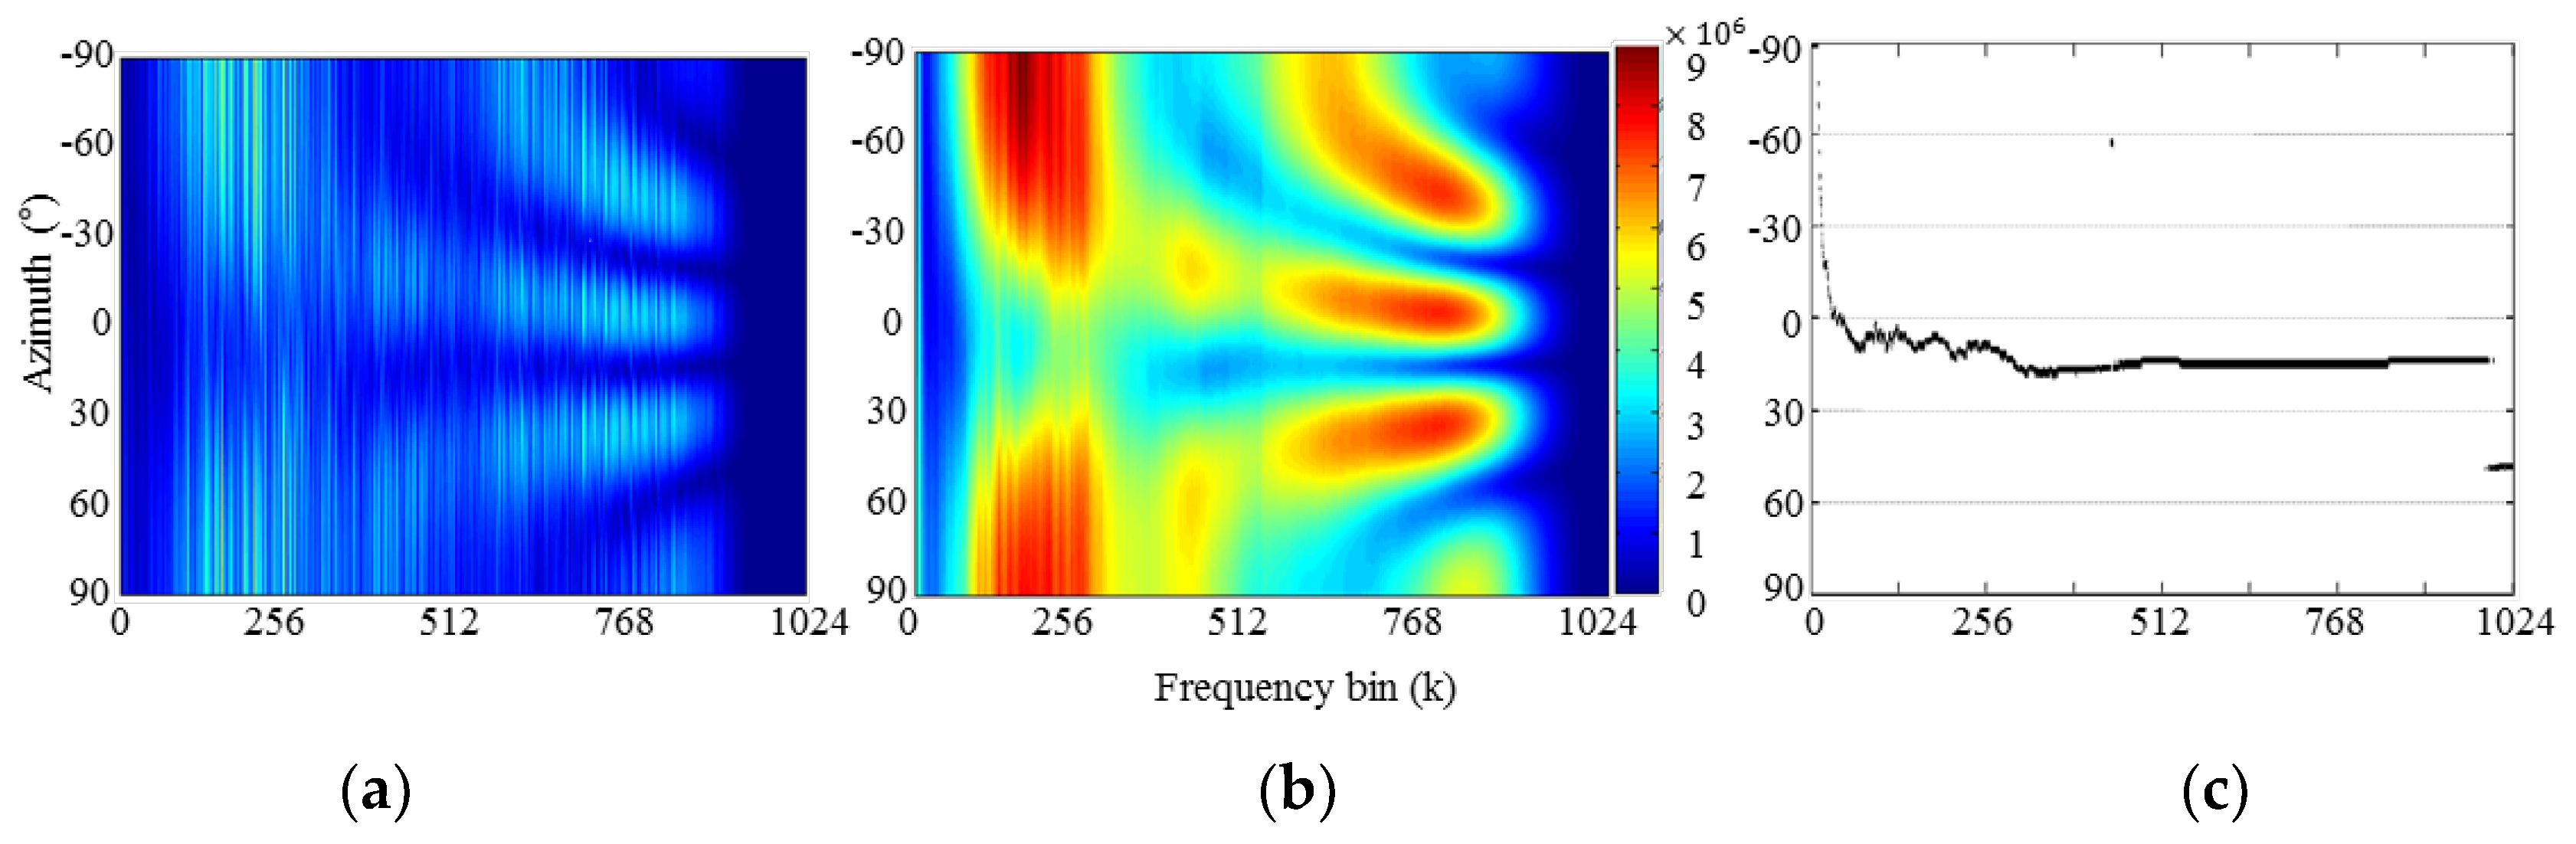
3.2. Azimuth-Frequency Analysis Using Time Delay

A stereo signal recorded using a stereo omni-directional microphone array, x L ( n ) and x R ( n ) , can be represented as a delayed and attenuated version of the desired signal, s ( n ) , such as [21]
[ x L ( n ) x R ( n ) ] = [ a L s ( n ) a R s ( n τ ) ] + [ v L ( n ) v R ( n ) ] ,
where v L ( n ) and v R ( n ) are ambient noise recorded by the left and right microphones, respectively. In addition, a L and a R are the respective attenuation factors, and τ is the relative time delay measured between the left and right microphones. Note here that Equation (3) is designed using the far-field model [18,19], because the spacing between the stereo omni-directional microphones is small. Moreover, we can assume a L = a R 1 [22]. Applying an N-point STFT to Equation (3) provides the following relationship:
X = d S ( k ) + V ,
where X T = [ X L ( k ) X R ( k ) ] and V T = [ V L ( k ) V R ( k ) ] . In addition, S ( k ) is the k-th spectral component of s ( n ) , and d is a steering vector of
d T = [ 1 exp ( j 2 π k τ N ) ] ,
where τ can be determined by the speed of sound c , the spacing between the microphones l , and the direction of the source θ , as τ = ( f s / c ) l sin θ , where f s is the sampling rate. Thus, we have the following equation:
d T = [ 1 exp ( j 2 π k N f s c l sin θ ) ] .
If θ is known, we can separate S ( k ) and d from Equation (4). Then, we can modify d by replacing θ with another value to improve the obtained stereophonic images. This is because the listener cannot feel the actual direction of S ( k ) when two stereo microphones are placed very close together. In practice, it is difficult to separate the direction d and source S ( k ) , and it is even more difficult to do so under ambient noise conditions and/or with multiple sound sources [23]. Therefore, instead of separating the sound source and its steering vector in this paper, we apply a panning law to the recorded signal X , with the estimated direction. To estimate the source direction, we consider the time delay τ in Equation (3) using the stereo signal x L ( n ) and x R ( n ) , where we have assumed that v L ( n ) and v R ( n ) are negligible under high signal-to-noise ratio (SNR) conditions. In other words, the time delay is estimated as τ ^ = arg min τ | x L ( n ) x R ( n τ ) | . We can then extend this concept in the frequency domain, as:
τ ^ ( k ) = arg min τ | X L ( k ) e j 2 π N k τ X R ( k ) | .
In this paper, τ in Equation (7) can be considered as a function of the direction θ . Therefore, the right-hand side of Equation (7), which is a function of the frequency k, and the direction θ , is referred to as an A-F plane and defined as [18].
A F ( k , θ ) = | X L ( k ) e j 2 π N k τ ( θ ) X R ( k ) | .
We can estimate the direction θ ^ ( k ) so that A F ( k , θ ) is minimized at the k-th frequency bin. However, when A F ( k , θ ) is used for estimating θ ^ ( k ) , many local minima exist. To mitigate this problem, a smoothing window is applied to A F ( k , θ ) prior to estimating θ ^ ( k ) , such that:
A F s ( k , θ ) = 1 B ( k ) + 1 m = k B ( k ) / 2 k + B ( k ) / 2 A F ( m , θ ) ,
where B ( k ) corresponds to a critical bandwidth of the auditory filter [2]. For example, B ( k ) = 6 (150 Hz) when k = 43 (1 kHz). Thus, the direction at each frequency bin is estimated so that A F s ( k , θ ) is minimized, such that:
θ ^ ( k ) = arg min θ A F s ( k , θ ) .
Figure 4 illustrates an A-F plane, A F ( k , θ ) , and a smoothed A-F plane, A F s ( k , θ ) , computed for a stereo signal that is recorded from a stereo microphone array in an anechoic room, where a white noise source is angled at 15° and placed 1.5 m from the center of the microphone array. In the figure, a 2048-point STFT is applied to each frame of white noise, and θ is changed from −90° to 90° at 1° steps. In addition, the distance between the two microphones is l = 3 cm and f s = 48 kHz. As shown in the figure, the direction of the white noise is easily estimated at low frequencies, but there are multiple minima at mid-to-high frequencies. As shown in Figure 4c, the estimated direction of the white noise is 15°, which is identical to the direction at which the white noise is located for recording.
Next, we repeat the experiment above by recording white noise in a reverberant room whose reverberation time ( R T 60 ) is measured as 230 ms, and the A-F planes and estimated direction are shown in Figure 4. Comparing Figure 5a with Figure 4a, the A-F plane in the reverberant room is more blurred than that in the anechoic room. This is because the reverberation muddles the direction of the sound source, making it seem as though multiple sound sources are being recorded by the stereo microphones. Owing to the smoothing window, the smoothed A-F plane shown in Figure 5b becomes similar to that in Figure 4b. Therefore, as shown in Figure 5c, the direction of white noise can be estimated correctly, especially at mid-to-high frequencies, while there are some errors at low frequencies. Since it is known that stereophonic images are mostly affected by mid-to-high frequencies, the quality of stereophonic images is not significantly affected by such errors at low frequencies [24].
Figure 4. A-F planes and estimated direction for white noise in an anechoic room: (a) A F ( k , θ ) ; (b) A F s ( k , θ ) ; (c) estimated direction using A F s ( k , θ ) .
Applsci 06 00039 g004

3.3. Frequency-Dependent Amplitude Panning

This subsection describes how the estimated direction in each frequency bin is used for stereophonic image enhancement. Figure 6 illustrates the concept of the process described in this subsection. As shown in Figure 6a, a sound source is located at an angle of θ . However, the close spacing between the stereo microphones could mean that it is perceived as being at a lesser angle—i.e., θ p < < θ . Thus, we have to increase the perceived angle by applying frequency-dependent amplitude panning such that θ 0 θ > > θ p .
Figure 5. A-F planes and estimated direction for white noise in a reverberant room with R T 60 = 230 ms: (a) A F ( k , θ ) ; (b) A F s ( k , θ ) ; (c) estimated direction using A F s ( k , θ ) .
Applsci 06 00039 g005
Figure 6. Illustrations of stereophonic image enhancement: (a) Original sound source; (b) perceived sound source without any enhancement technique; and (c) perceived sound source after applying the proposed method.
Applsci 06 00039 g006
Many panning methods have been reported [19,25,26]. Among them, the stereophonic law of sines [19] has been popularly used to reproduce a source using two loudspeakers, and it is realized as:
sin θ sin θ 0 = g L g R g L + g R ,
where θ 0 is the physical angle between stereo loudspeakers and θ is the desired angle at which the sound source should be located in terms of perception. Thus, g L and g R become the respective scale factors that are multiplied with the sound source according to the desired angle, as:
y L ( n ) = g L s ( n ) ,
and
y R ( n ) = g R s ( n ) ,
where s ( n ) is the sound source, and y L ( n ) and y R ( n ) are respectively the panned signals of the left and right channel.
In this paper, we extend the stereophonic law of sines so that it is applied in the frequency domain. For a given direction at the k-th frequency bin θ ^ ( k ) , as described in Section 3.2, the frequency-dependent scale factors, g L ( k ) and g R ( k ) , are obtained using the following equation:
sin ( θ ^ ( k ) ) sin θ 0 = g L ( k ) g R ( k ) g L ( k ) + g R ( k ) ,
where θ 0 is also the physical angle between stereo loudspeakers, as described in Equation (10). As in Equations (11) and (12), the scale factors to Equation (13) are multiplied to the k-th spectral magnitude of the sound source as:
Y L ( k ) = g L ( k ) S ( k ) ,
and
Y R ( k ) = g R ( k ) S ( k ) .
Here, while S ( k ) should be separated from X according to Equation (4), the spectral magnitude of the sound source is approximated as the mid signal of the recorded sound. That is S ( k ) ( X L ( k ) + X R ( k ) ) / 2 . Finally, by applying an inverse STFT followed by the overlap-add method, the output signal with an enhanced stereophonic image is obtained.

4. Performance Evaluation

To demonstrate the effectiveness of the proposed method, three different recording environments were considered: anechoic, convolutive, and real reverberant. Figure 7 illustrates the configuration for the room impulse response (RIR) filter design. The dimensions of the room were 4.5 m × 7.5 m × 2.5 m, and a stereo microphone array with 3-cm spacing was located in the room at the coordinates denoted in the figure. To simulate the convolutive environment, a RIR filter was designed based on the image method [27], and the response of the left channel is shown in Figure 8. As shown in the figure, R T 60 of this RIR was measured as 230 ms.
Figure 7. Experimental setup for simulating the room impulse response to simulate a reverberant environment.
Applsci 06 00039 g007
Figure 8. Simulated room impulse response of the left channel based on the image method, where R T 60 was measured as 230 ms.
Applsci 06 00039 g008
The performance of the proposed method was evaluated in terms of three different measurements. First, the directivity pattern of the proposed method was compared with that of a conventional method based on a DS beamformer [13] in the three recording environments. Second, the accuracy of direction estimates for the stereo audio processed by the proposed method was compared with that processed by the conventional method by measuring the perceived directions of listeners depending on the horizontal directions of sources. Third, a DMOS assessment [20] was carried out to evaluate the audio quality degradation after the proposed method had been applied.

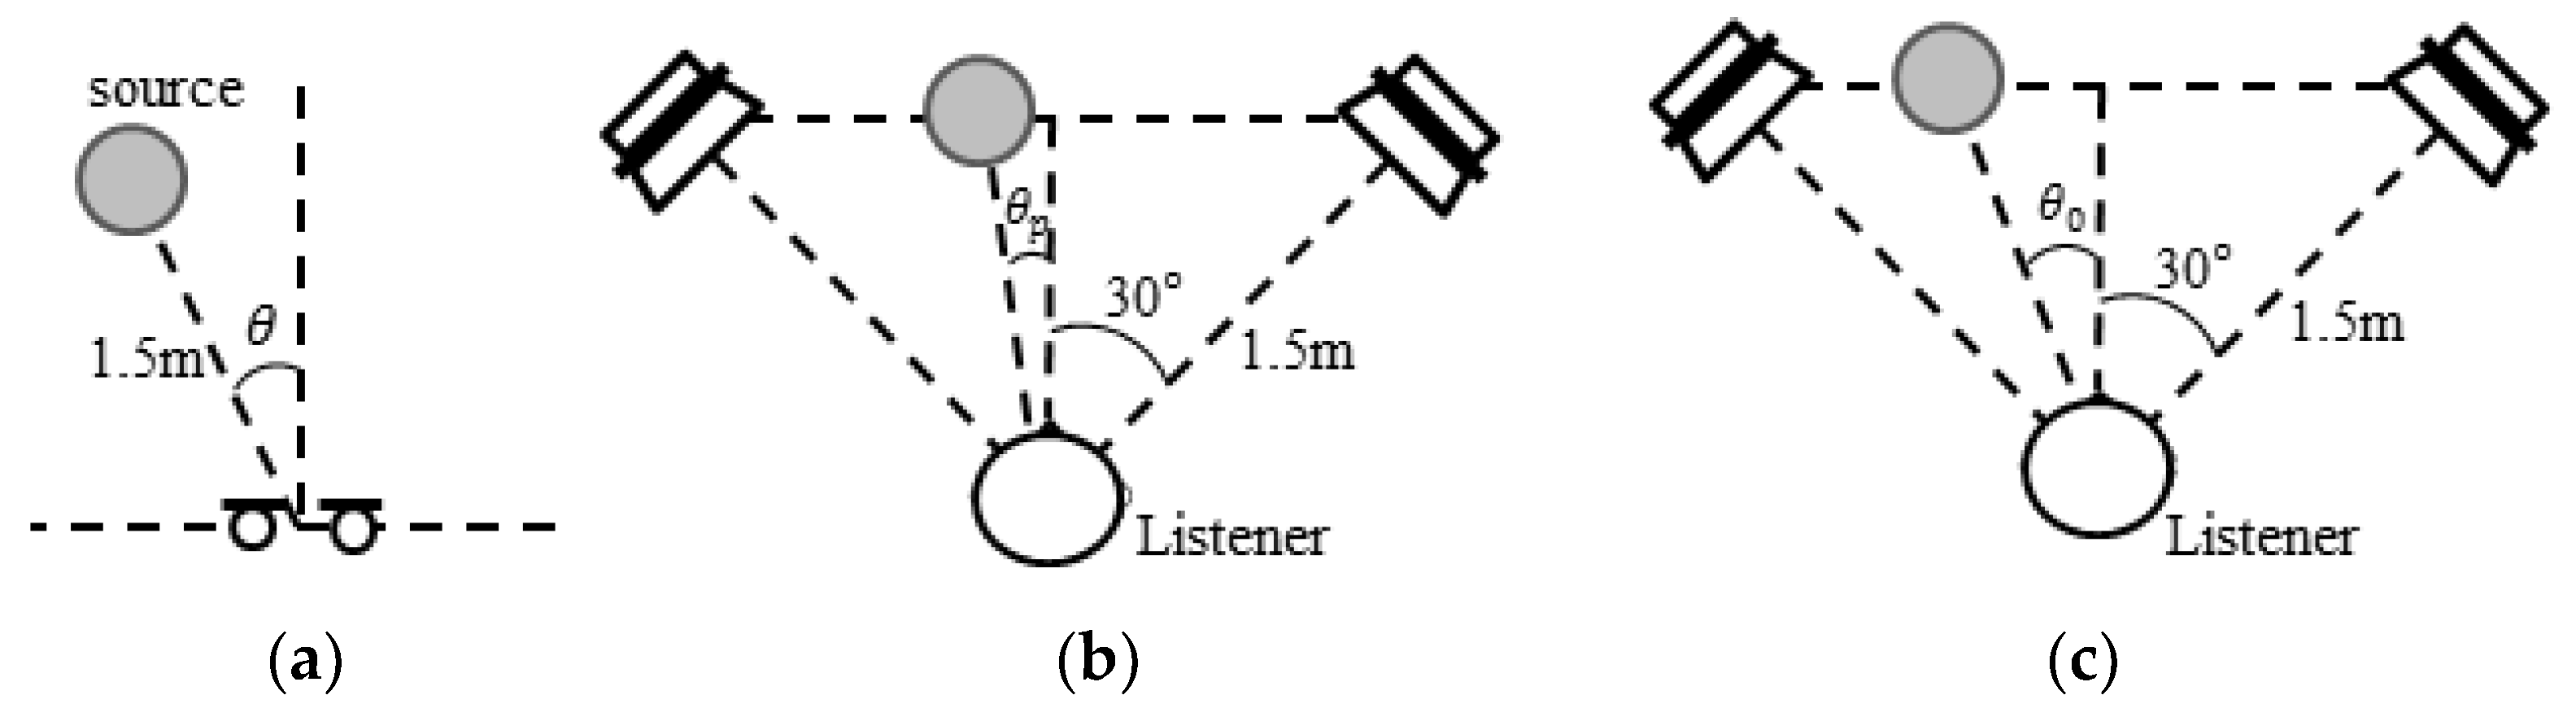
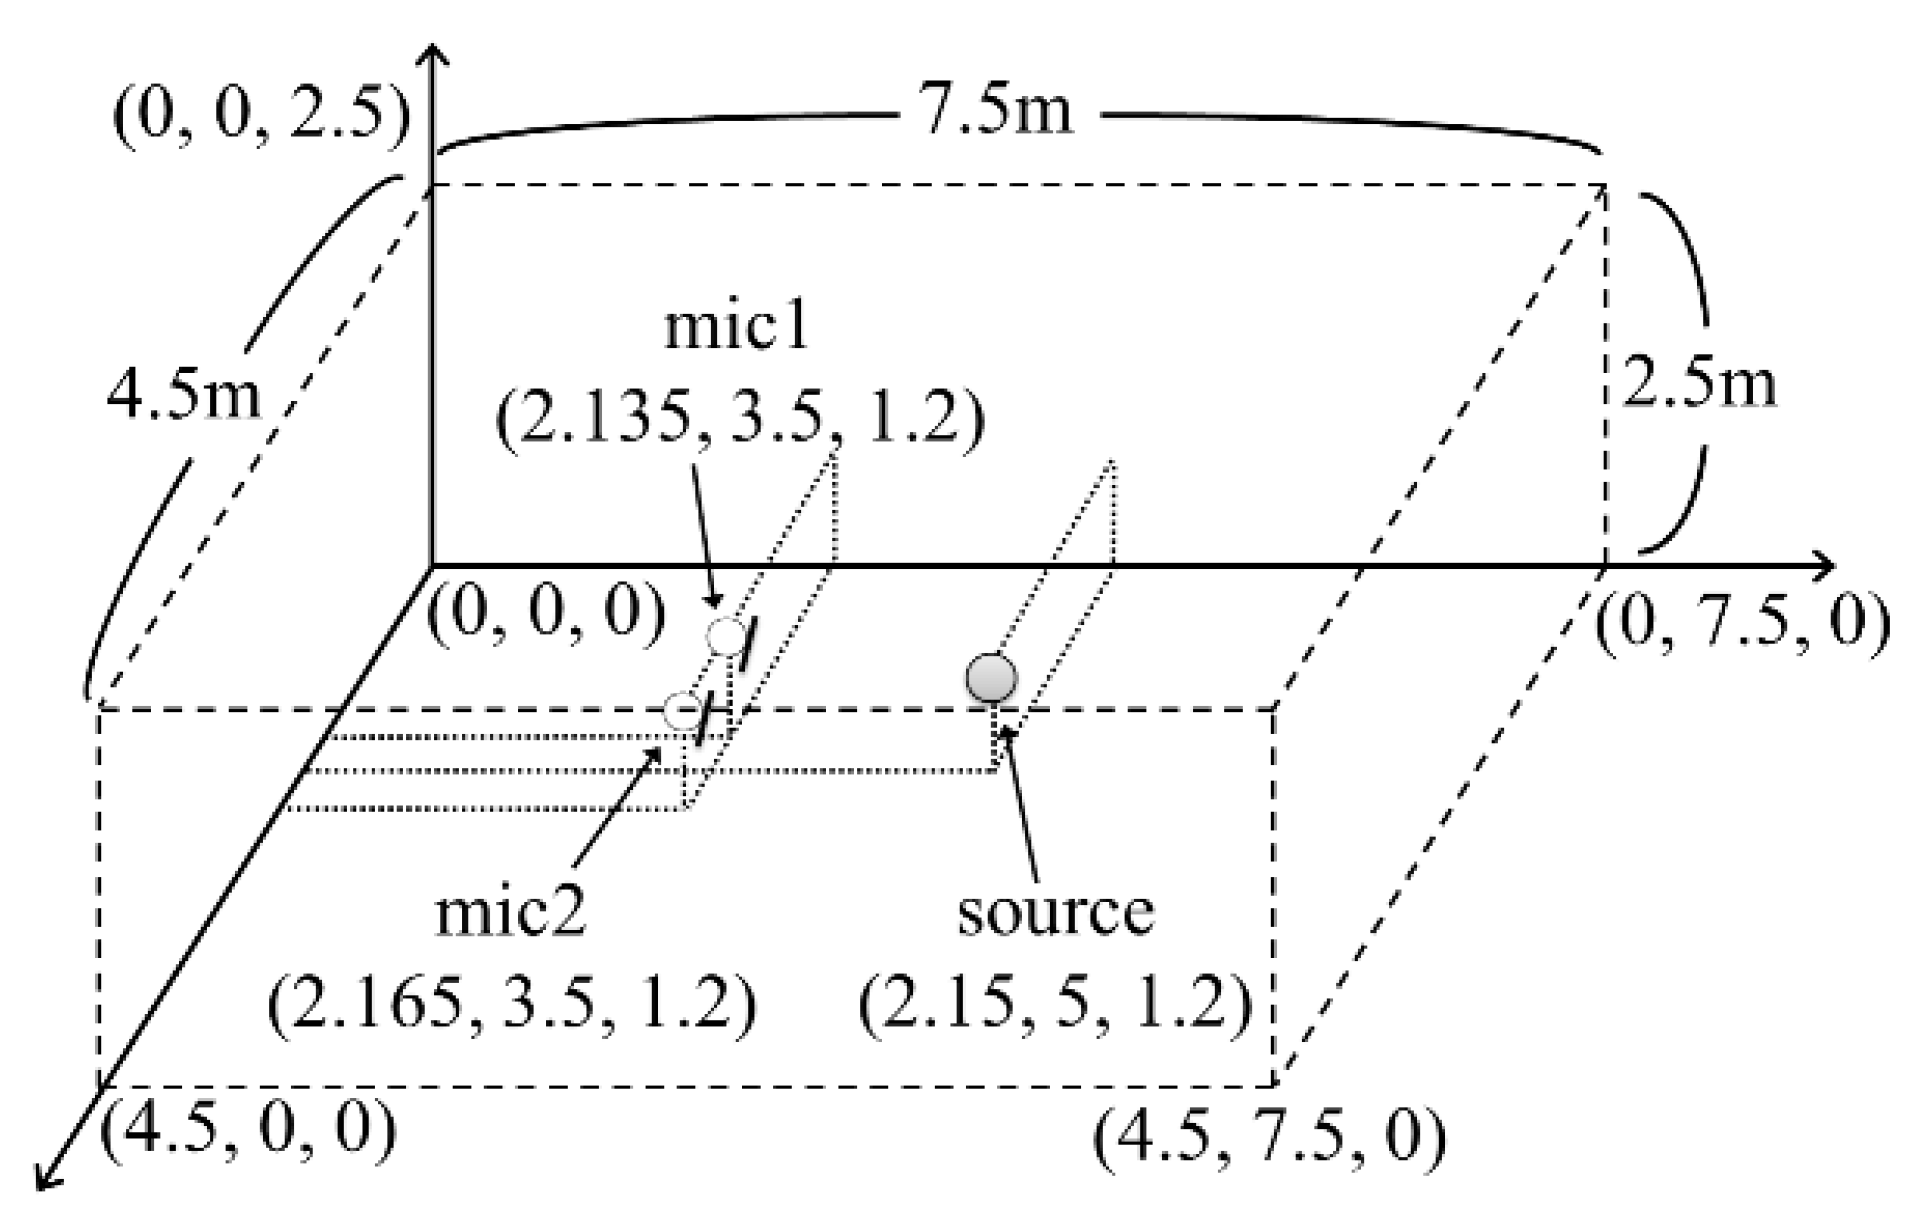
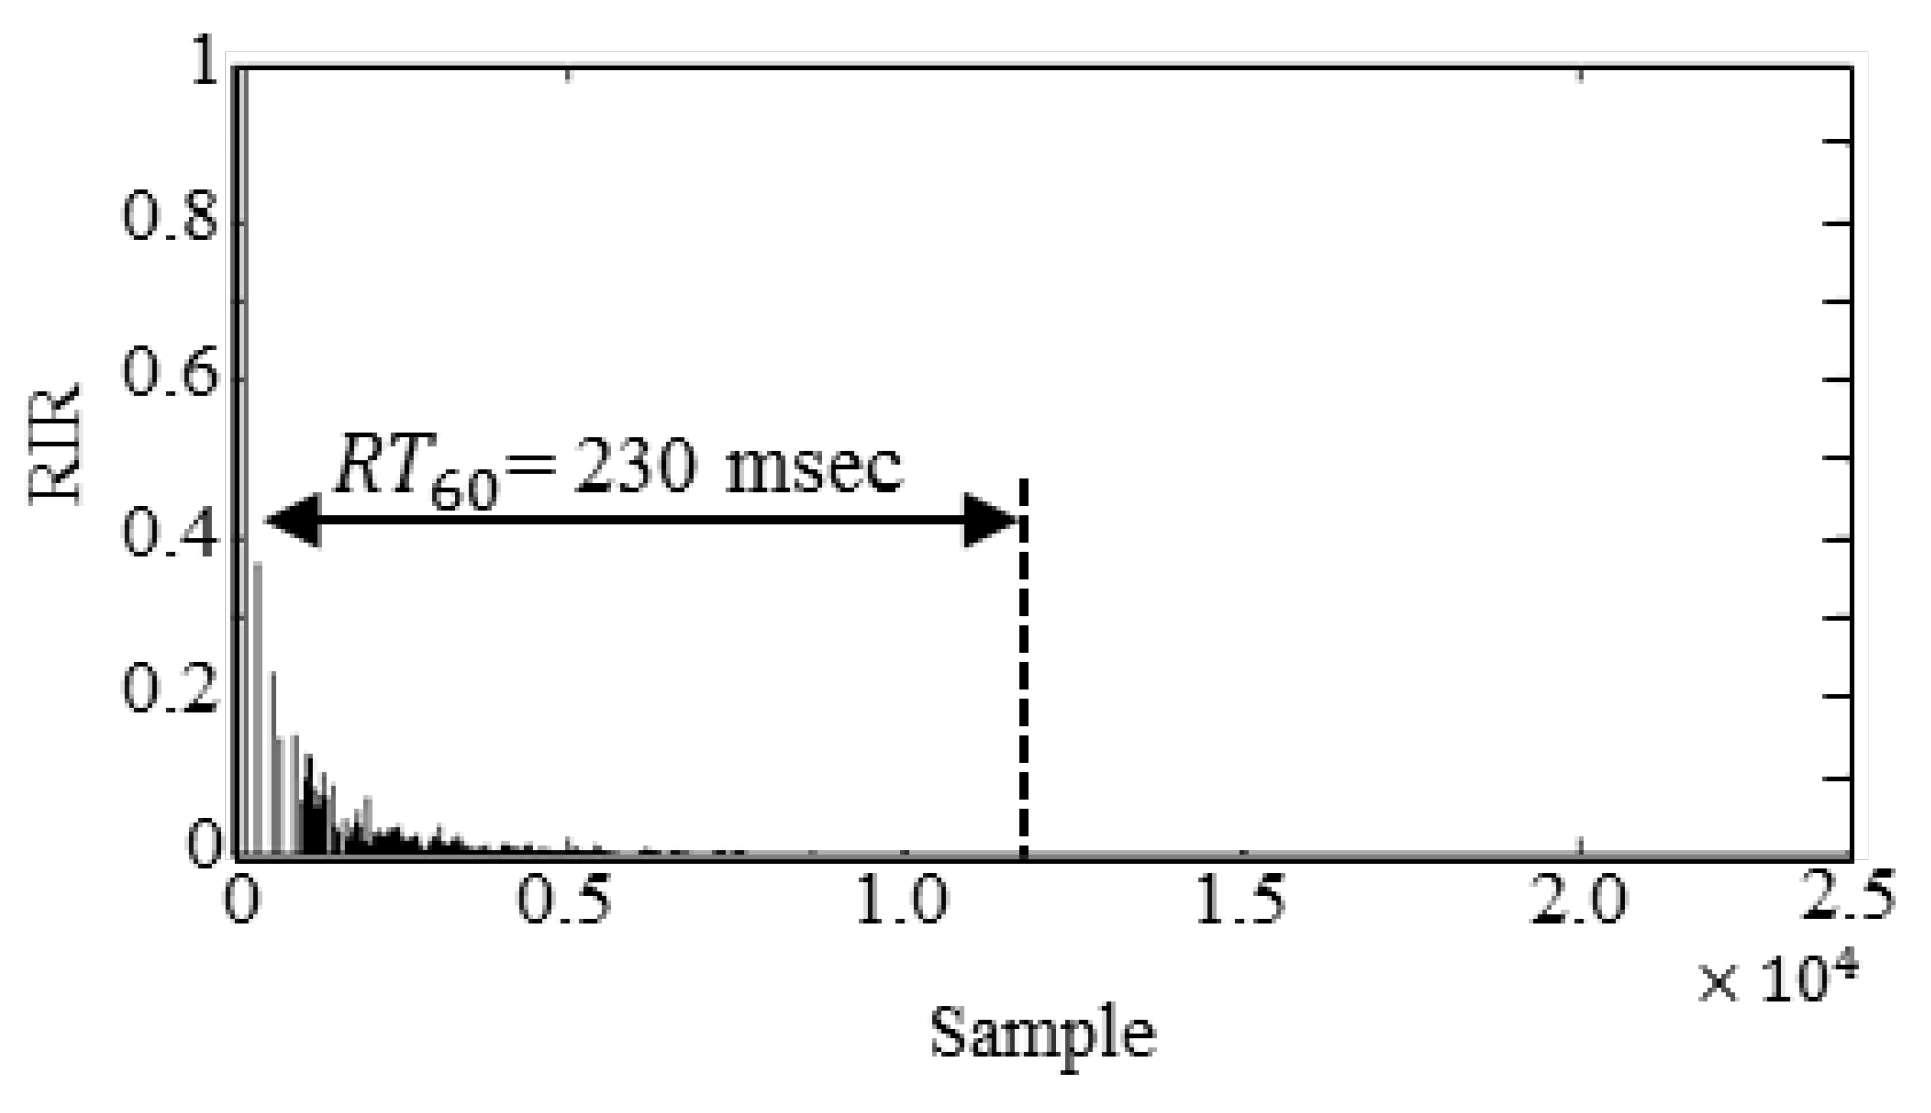
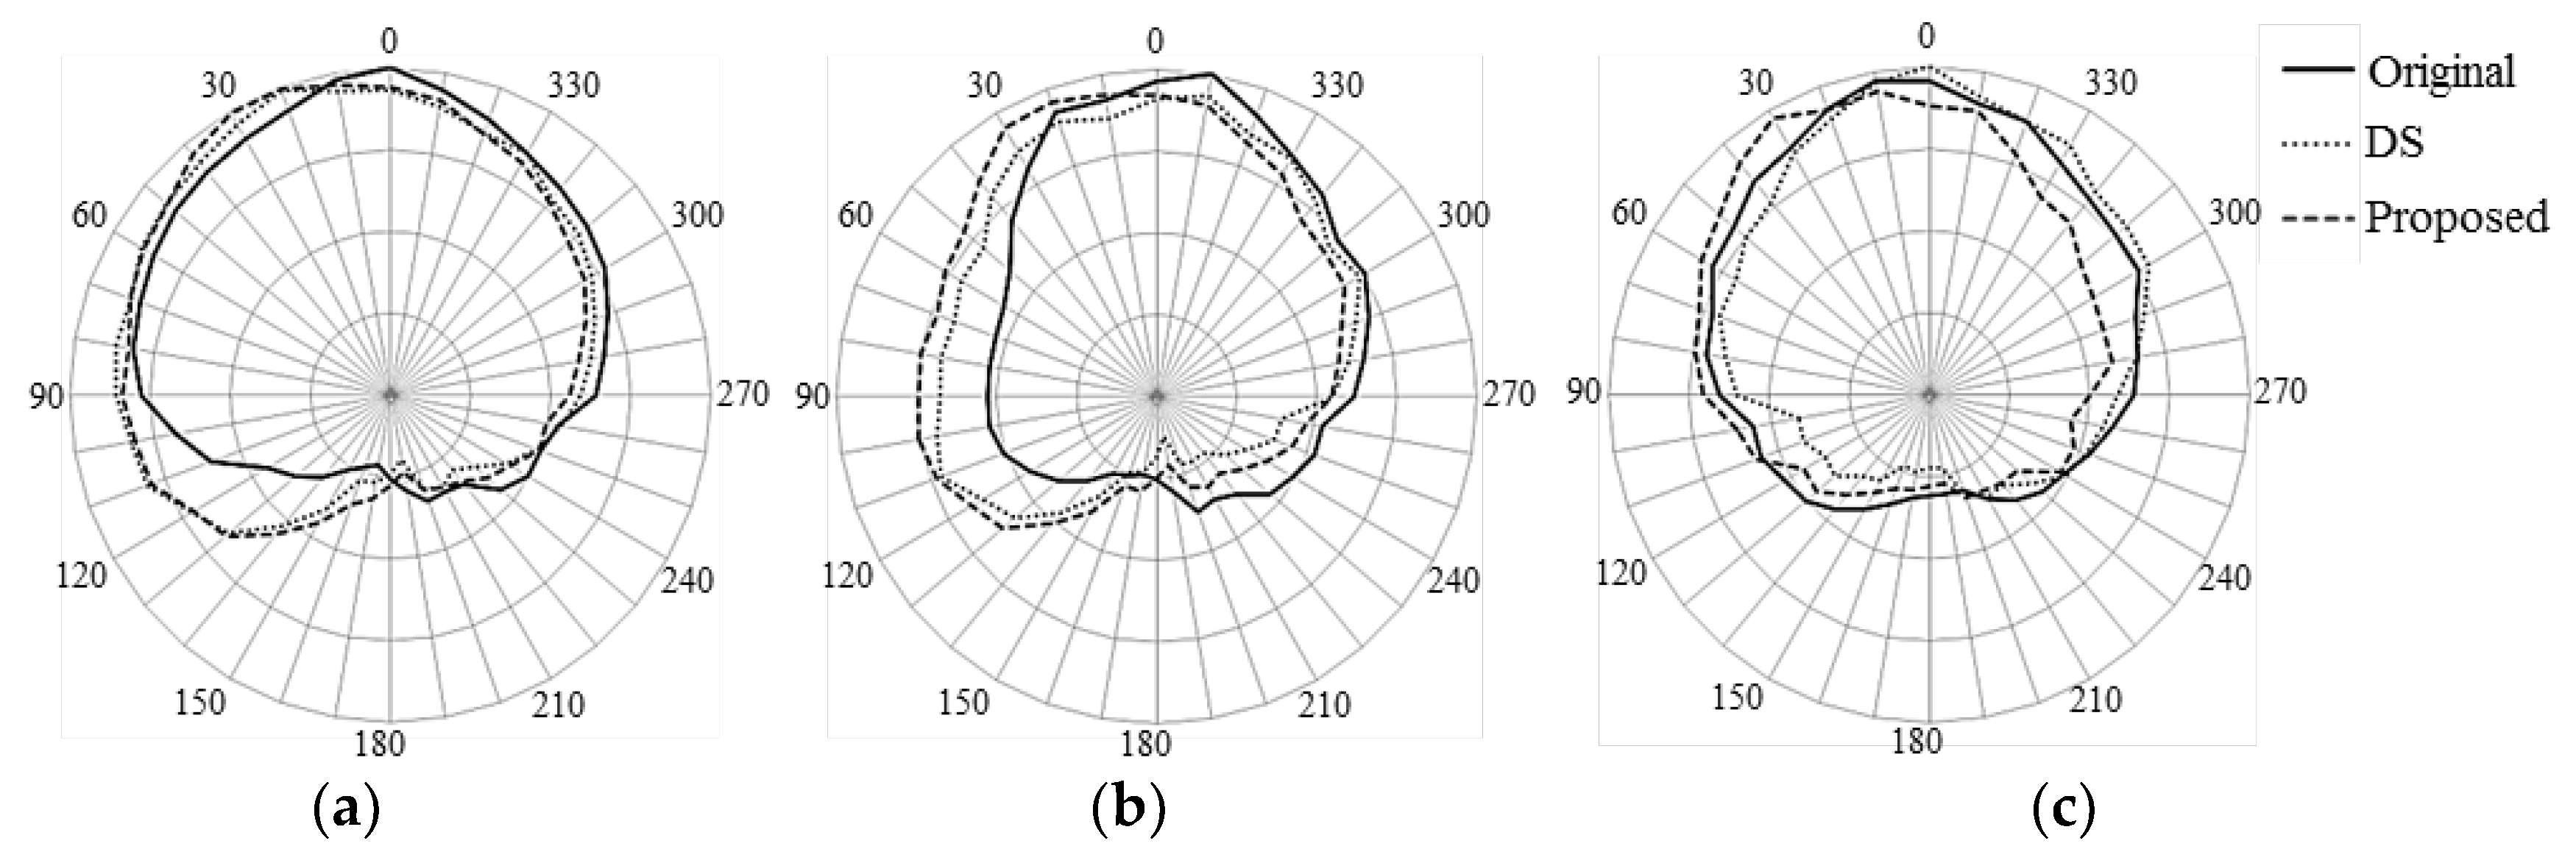
4.1. Directivity Pattern Performance

Figure 9 shows an experimental setup for evaluating the performance of the directivity patterns. A stereo microphone array was placed with 3-cm spacing, and one loudspeaker was located at 60° from the center of the microphone array at a distance of 1.5 m. The white noise at a sampling rate of 48 kHz was played out via loudspeaker and recorded by the microphone array. The recorded signal was processed by both the DS beamformer and the proposed method. After that, the recorded and processed white noise signals were all played through stereo loudspeakers that were configured according to International Telecommunication Union Radiocommunication Sector (ITU-R) Recommendation BS.775-1 [28]. Then, a dummy head [29] was rotated from 0° to 350° at 10° steps to measure the directivity patterns.
Figure 9. Experimental setup for evaluating the directivity patterns.
Applsci 06 00039 g009
Figure 10 compares the directivity patterns of the original source with those obtained by the DS beamformer and the proposed method in three different environments (anechoic, convolutive, and real reverberant room). As shown in Figure 10a, the directivity for the original signal was towards 0° in the anechoic environment, while the actual directivity was set to 60°. However, the directivities of the signals processed by the conventional and proposed methods were approximately 30°, which was the same angle of the loudspeakers against the dummy head. Consequently, we concluded that the proposed and conventional methods significantly enhanced the originally recorded signal.
Figure 10. Comparison of directivity pattern of the original source with those obtained by the DS beamformer and the proposed method in three different environments: (a) anechoic; (b) convolutive; and (c) real reverberant room.
Applsci 06 00039 g010
Next, when comparing the directivity in convolutive and real reverberant environments, it was clear that the proposed method could locate the sound source to approximately 30°, while the DS beamformer failed to do so. This was because the simulated and real reverberation limited the stereophonic image enhancement of the DS beamformer. However, the proposed method was not affected by the reverberation, due to the frequency-dependent direction estimation and panning.

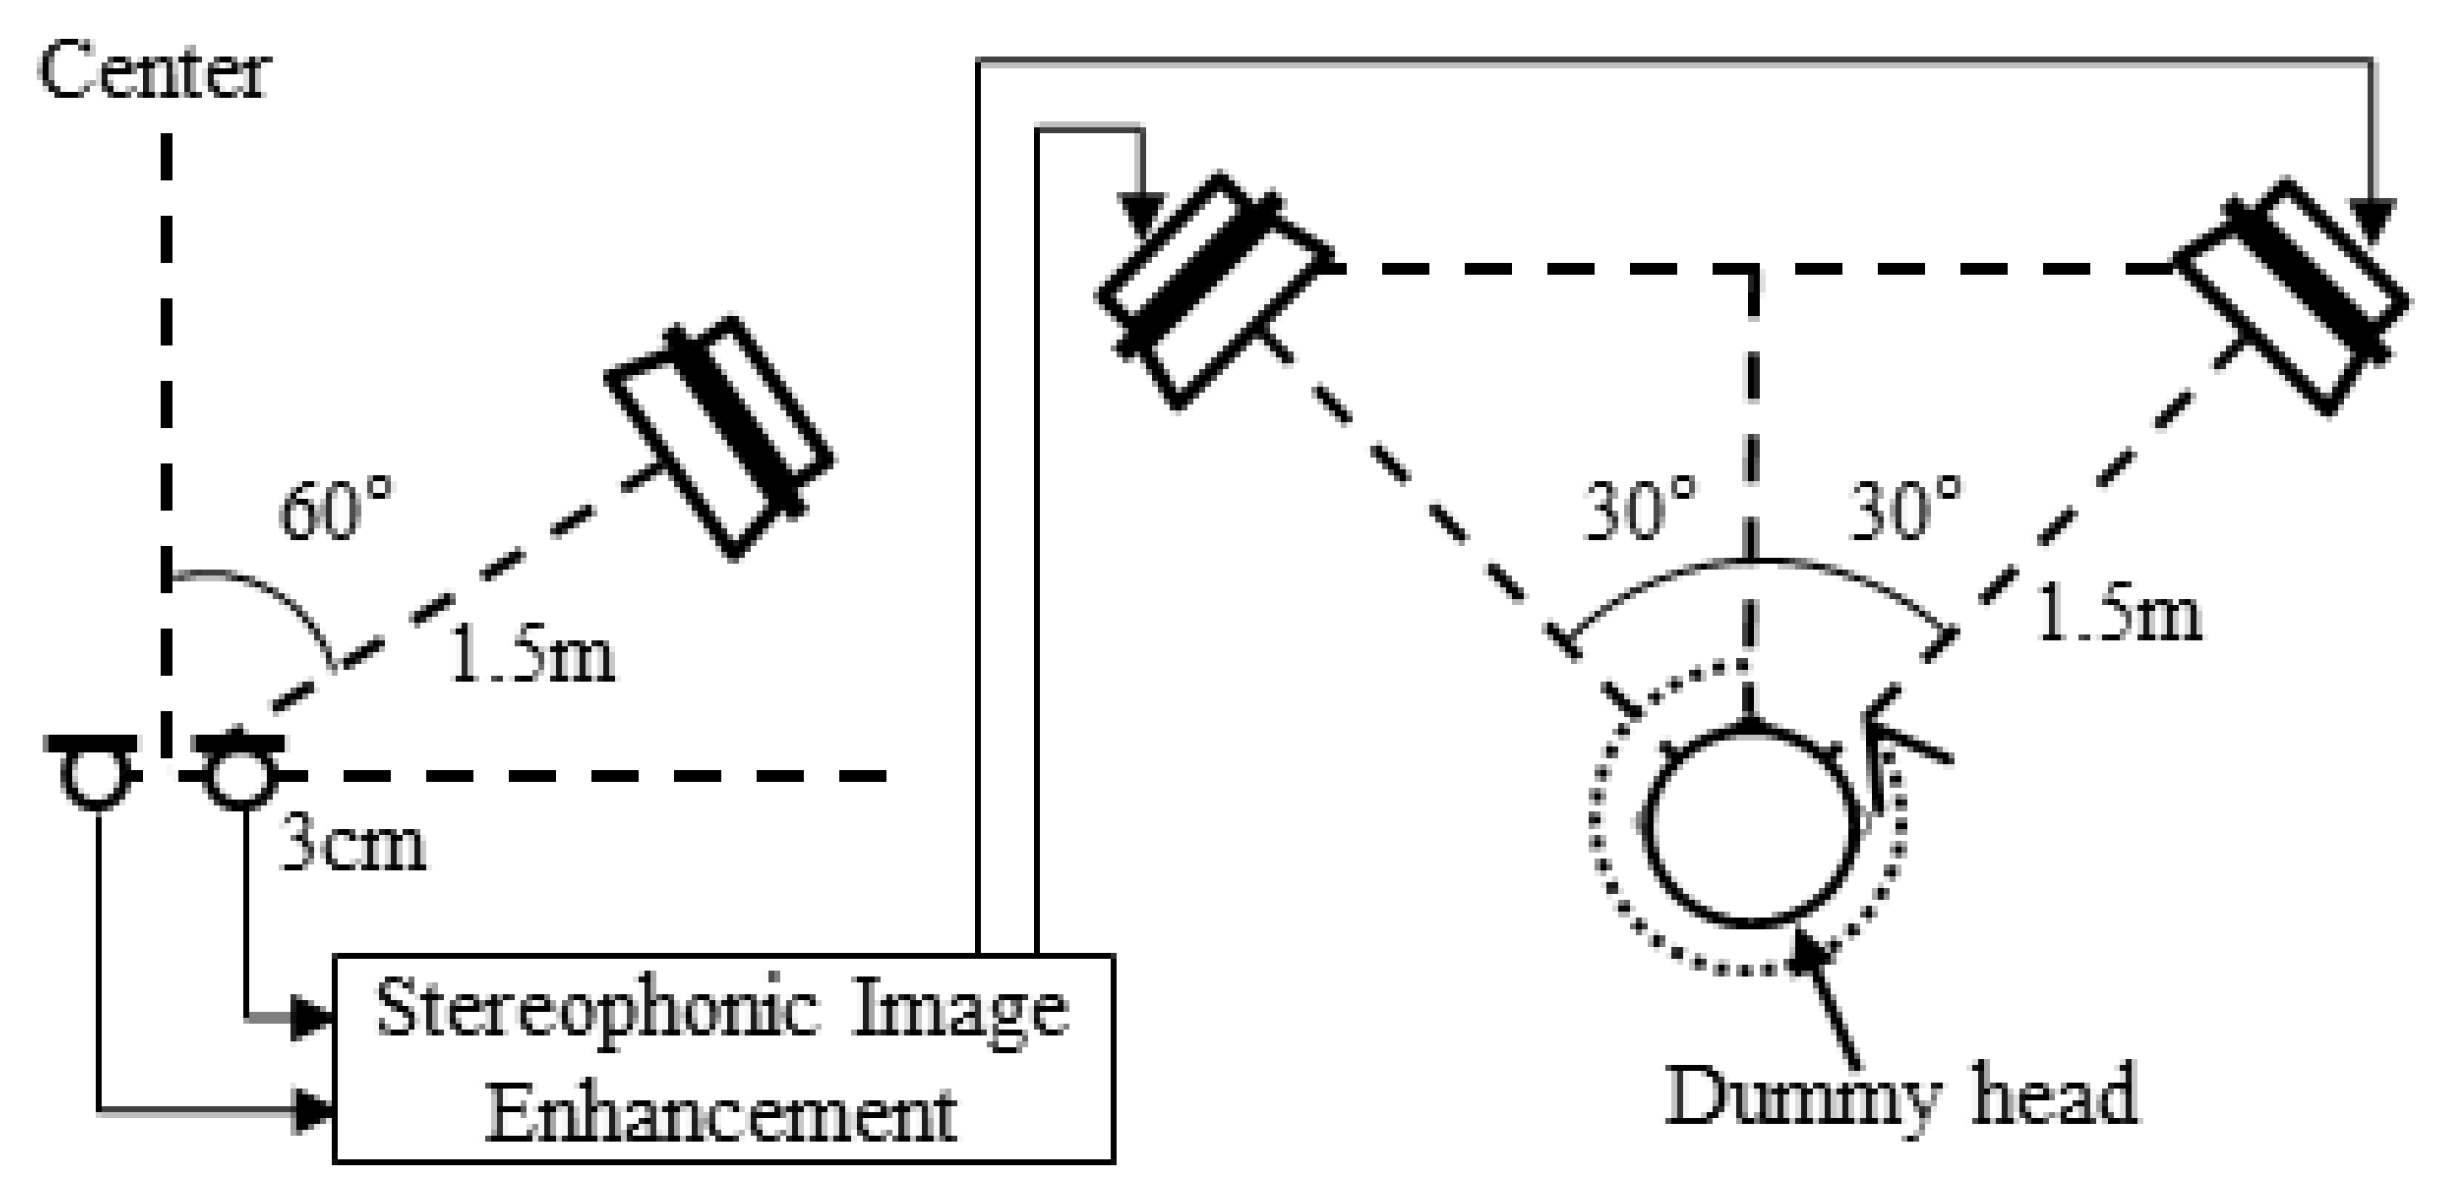
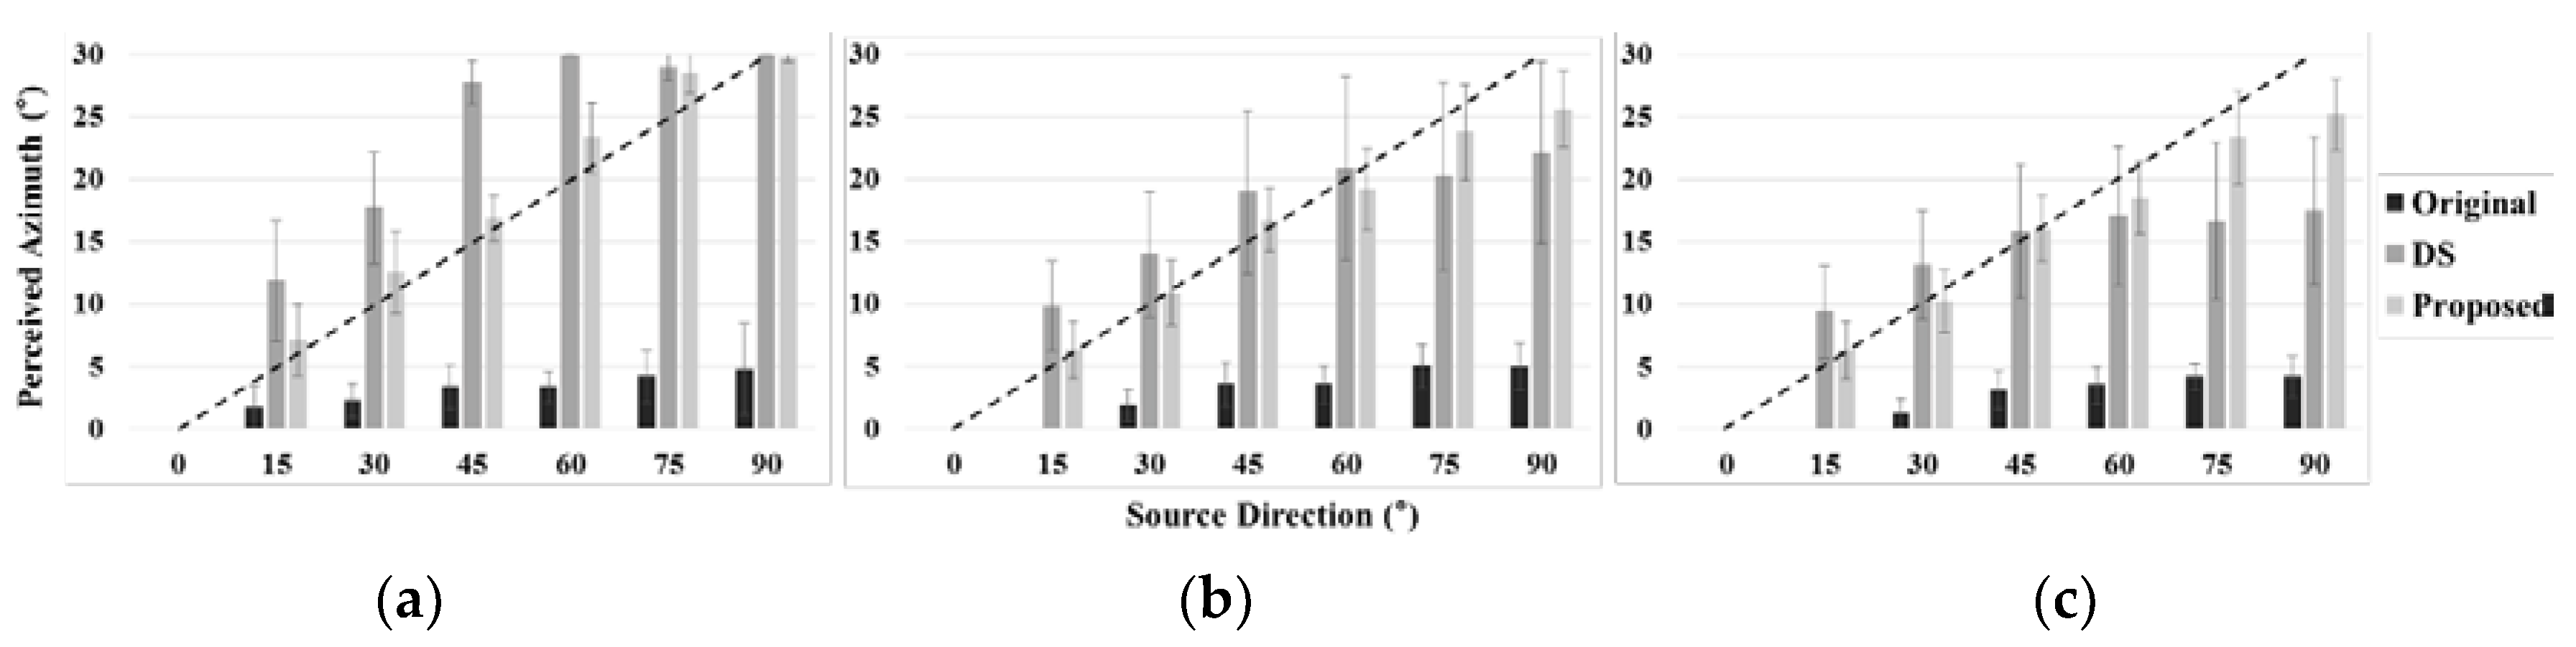
4.2. Perceived Direction Performance

Figure 11 shows the experimental setup for evaluating listeners’ directional perception. To record stereo signals, a stereo microphone array was placed with 3-cm spacing, and a sound source was played through one loudspeaker from the center of the microphone array at a distance of 1.5 m. For the evaluation, each listener was sitting in an anechoic room of dimensions 2130 mm × 3370 mm × 3000 mm, in which two loudspeakers had been placed as shown in the figure. Note that here the model of all the loudspeakers was Genelec 6010A. In this experiment, we prepared five audio clips that were excerpted from the sound quality assessment material (SQAM) [30]; Table 1 describes the genre and musician of each audio clip. Note that since all audio clips were sampled at 44.1 kHz, we upsampled the audio clips to 48 kHz to ensure a consistent experimental environment. Then, we recorded five audio clips in three different environments where the loudspeaker was rotated from 0° to 90° at a 15° step towards the right direction, resulting in seven different directions. After that, the recorded signals were processed by the DS beamformer and the proposed method (some audio samples can be found at [31]). After the processed clips were played at sound pressure level (SPL) 90 dB, eight participants (four males and four females) with no auditory diseases were asked to indicate their perceived directions for the original and processed signals. Note that the participants were allowed head movement.
Figure 11. Experimental setup for evaluating the perceived directions.
Applsci 06 00039 g011
Table 1. Detailed information on five audio clips used for the evaluation of perceived direction.
TrackGenreDescription
49SpeechFemale English speech
66OrchestraWind ensemble, Stravinsky
67OrchestraWind ensemble, Mozart
69Pop musicAbba
70Pop musicEddie Rabbit
Figure 12 compares the perceived azimuths averaged over five audio clips and eight participants for each source direction in three different recording environments, where the dashed line indicates the target direction, and the vertical bar on each bar chart corresponds to the standard deviation. As shown in the figure, the originally recorded signals were all perceived at around 0°–10° for all environments, even though the actual source angles were above 15°. By applying the DS beamformer to enhance the stereophonic image, the perceived angles increased. However, errors between the actual angle (dashed straight line) and the perceived angle increased as the actual angle increased, especially in anechoic and real reverberant environments. The proposed method provided smaller perceived errors than the DS beamformer, which implies that it could enhance stereophonic images for all recording environments compared to the conventional method.
Figure 12. Comparison of the perceived azimuth depending on the direction of the source in three different environments: (a) anechoic; (b) convolutive; and (c) real reverberant room.
Applsci 06 00039 g012

4.3. Audio Quality Degradation

To evaluate the quality degradation of audio signals processed by the proposed method, we performed a DMOS assessment test according to ITU Telecommunication Standardization Sector (ITU-T) Recommendation P.800 [20]. The experimental conditions such as audio clips, participants, and listening room are identical to those of the experiment described in Section 4.2. Each participant listened to a pair of audio clips composed of an original and processed version by either the DS beamformer or the proposed method. Then, each was asked to rate the degree of quality degradation from five to one. Table 2 describes the scores and their meanings for DMOS assessment.
Table 2. Score and description of degraded mean opinion score (DMOS) assessment.
ScoreDescription
5Degradation is inaudible
4Degradation is audible but not annoying
3Degradation is slightly annoying
2Degradation is annoying
1Degradation is very annoying
Table 3 compares the results of DMOS assessment between the conventional DS beamformer-based method and the proposed method in three different recording environments. We conducted a statistical analysis and indicated the 95% confidence intervals (CIs) as numbers in parentheses in Table 3. As shown in the table, the proposed method provided average DMOS scores of approximately four for all environments, which implied that there were no annoying effects [32]. However, there was significant quality degradation in the conventional method, especially in the real reverberant environment. It was revealed from statistical analysis that the quality degradation of the audio signals enhanced by the proposed method was statistically less than those enhanced by the DS beamformer.
Table 3. Comparison of DMOS assessment results of the conventional and proposed methods for three different recording environments where the numbers in parentheses indicate 95% CIs.
MethodDSProposed
Environment
Anechoic3.61 (0.2898)4.04 (0.2622)
Convolutive3.31 (0.3147)3.97 (0.2581)
Real Reverberant3.46 (0.2950)3.90 (0.2711)

5. Conclusions

In this paper, we proposed a frequency-dependent stereophonic image enhancement method that could be applied to two closely spaced omni-directional microphones available for portable audio recording devices. First, the A-F plane was obtained from the spectral magnitudes of stereo audio signals. Next, the direction at each frequency bin was estimated as the azimuth at which the A-F plane was minimized. Finally, a frequency-dependent amplitude panning technique was also proposed to enhance the stereophonic image from the stereophonic law of sines. The performance of the proposed method was evaluated in three different recording environments: anechoic, convolutive, and real reverberant. First, the directivity pattern of the proposed method was compared to that of a conventional method based on a DS beamformer. Second, the directional accuracy of the stereo audio processed by the proposed method was compared to that processed by a conventional method by the measurement of listeners’ perceived directions. Finally, a DMOS assessment test was carried out to evaluate quality degradation after the proposed method had been applied. Consequently, it was revealed that the proposed method gave better directivity, higher directional accuracy, and less quality degradation than the conventional method. It was argued here that, compared to the conventional method, the proposed method could improve performance with the help of frequency-dependent processing.
We have only experimented with a single source throughout this study, so we are planning to examine what happens when multiple sources are available. One possible approach will be to detect multiple directions from the A-F analysis and propose an appropriate panning method that can treat multiple angles.

Acknowledgments

This work was supported in part by the National Research Foundation of Korea (NRF) grant funded by the government of Korea (MSIP) (No. 2015R1A2A1A05001687), and by the ICT R&D program of MSIP/IITP (R01261510340002003, Development of hybrid audio contents production and representation technology for supporting channel and object based audio).

Author Contributions

All authors discussed the contents of the manuscript. Hong Kook Kim contributed to the research idea and the framework of this study. Chan Jun Chun performed the experimental work.

Conflicts of Interest

The authors declare no conflict of interest.

References

  1. Breebaart, J.; Faller, C. Spatial Audio Processing: MPEG Surround and Other Applications; John Wiley & Sons, Ltd.: Chichester, UK, 2007. [Google Scholar]
  2. Blauert, J. Spatial Hearing: The Psychophysics of Human Sound Localization; MIT Press: Cambridge, MA, USA, 1997. [Google Scholar]
  3. Rumsey, F. Spatial quality evaluation for reproduced sound: Terminology, meaning, and a scene-based paradigm. J. Audio Eng. Soc. 2002, 50, 651–666. [Google Scholar]
  4. Rumsey, F. Spatial Audio; Focal Press: Woburn, MA, USA, 2001. [Google Scholar]
  5. Hibbing, M. XY and MS microphone techniques in comparison. J. Audio Eng. Soc. 1989, 37, 823–831. [Google Scholar]
  6. Bennett, J.C.; Barker, K.; Edeko, F.O. A new approach to the assessment of stereophonic sound system performance. J. Audio Eng. Soc. 1985, 33, 314–321. [Google Scholar]
  7. Kim, J.K.; Chun, C.J.; Kim, H.K. Design of a coincident microphone array for 5.1-channel audio recording using the mid-side recording technique. Adv. Sci. Technol. Lett. 2012, 14, 61–64. [Google Scholar]
  8. Dooley, W.; Streicher, T. MS stereo: A powerful technique for working in stereo. J. Audio Eng. Soc. 1982, 30, 707–718. [Google Scholar]
  9. Eargle, J. The Microphone Book; Focal Press: Oxford, UK, 2004. [Google Scholar]
  10. Menounou, P.; Papaefthymio, E.S. Shadowing of directional noise sources by finite noise barriers. Appl. Acoust. 2000, 71, 351–367. [Google Scholar] [CrossRef]
  11. Aarts, R.M. Phantom sources applied to stereo-base widening. J. Audio Eng. Soc. 2000, 48, 181–189. [Google Scholar]
  12. Umayahara, T.; Hokari, H.; Shimada, S. Stereo width control using interpolation and extrapolation of time-frequency representation. Audio Speech Lang. Process. IEEE Trans. 2006, 14, 1364–1377. [Google Scholar] [CrossRef]
  13. Faller, C. Conversion of two closely spaced omnidirectional microphone signals to an XY stereo signal. In Proceedings of the 129th AES Convention, San Francisco, CA, USA, 4–7 November 2010; p. 8188.
  14. Marsch, J.; Porschmann, C. Frequency dependent control of reverberation time for auditory virtual environments. Appl. Acoust. 2000, 61, 189–198. [Google Scholar] [CrossRef]
  15. Usher, J.; Woszczyk, W. Interaction of source and reverberance spatial imagery in multichannel loudspeaker audio. In Proceedings of the 118th AES Convention, Barcelona, Spain, 28–31 May 2005; p. 6370.
  16. Cobos, M.; Lopez, J.J. Method and Apparatus for Stereo Enhancement in Audio Recordings. PCT Patent PCT/ES2009/000409, 31 July 2009. [Google Scholar]
  17. Cobos, M.; Lopez, J.J. Interactive enhancement of stereo recordings using time-frequency selective panning. In Proceedings of the 40th Audio Engineering Society Conference, Tokyo, Japan, 8–10 October 2010; pp. 2–10.
  18. Barry, D.; Coyle, E.; Lawlor, B. Real-time sound source separation: Azimuth discrimination and resynthesis. In Proceedings of the 117th AES Convention, San Francisco, CA, USA, 28–31 October 2004; p. 6258.
  19. Bauer, B.B. Phasor analysis of some stereophonic phenomena. J. Acoust. Soc. Am. 1961, 33, 1536–1539. [Google Scholar] [CrossRef]
  20. P.800: Methods for Subjective Determination of Transmission Quality. Available online: https://www.itu.int/rec/T-REC-P.800-199608-I/en (accessed on 27 January 2016).
  21. Brandstein, M.; Ward, D.B. Microphone Arrays: Signal. Processing Techniques and Applications; Springer-Heidelberg: New York, NY, USA, 2001. [Google Scholar]
  22. Kennedy, R.A.; Abhayapala, P.T.D.; Ward, D.B.; Williamson, R.C. Nearfield broadband frequency invariant beamforming. In Proceedings of the IEEE International Conference on Acoustics, Speech and Signal Processing (ICASSP), Atlanta, GA, USA, 7–10 May 1996; pp. 905–908.
  23. Duong, N.Q.K.; Vincent, E.; Gribonval, R. Under-determined reverberant audio source separation using local observed covariance and auditory-motivated time-frequency representation. Audio Speech Lang. Process. IEEE Trans. 2010, 18, 1830–1840. [Google Scholar] [CrossRef] [Green Version]
  24. Pulkki, V.; Karjalainen, M. Localization of amplitude-panned virtual sources I: Stereophonic panning. J. Audio Eng. Soc. 2001, 49, 739–752. [Google Scholar]
  25. Choi, T.S.; Park, Y.C.; Youn, D.H.; Lee, S.P. Virtual sound rendering in a stereophonic loudspeaker setup. Audio Speech Lang. Process. IEEE Trans. 2011, 19, 1962–1974. [Google Scholar]
  26. Pulkki, V. Virtual source positioning using vector base amplitude panning. J. Audio Eng. Soc. 1977, 45, 456–466. [Google Scholar]
  27. Allen, J.B.; Berkley, D.A. Image method for efficiently simulating small-room acoustics. J. Acoust. Soc. Am. 1979, 65, 943–951. [Google Scholar] [CrossRef]
  28. BS.775: Multichannel Stereophonic Sound System with and without Accompanying Picture. Available online: https://www.itu.int/rec/R-REC-BS.775/en (accessed on 27 January 2016).
  29. Product Information KU 100. Available online: http://www.coutant.org/ku100/ku100.pdf (accessed on 27 January 2016).
  30. Sound Quality Assessment Material Recordings for Subjective Tests—Users’ Handbook for the EBU-SQAM Compact Disc. Available online: https://tech.ebu.ch/docs/tech/tech3253.pdf (accessed on 27 January 2016).
  31. Chun, C.J.; Kim., H.K. Some Audio Samples Processed by Frequency-Dependent Amplitude Panning for the Stereophonic Image Enhancement. Available online: http://hucom.gist.ac.kr/2016ApplSci/sample.html (accessed on 27 January 2016).
  32. Spanias, A.; Painter, T.; Atti, V. Audio Signal. Processing and Coding; John Wiley & Sons, Inc.: Hoboken, NJ, USA, 2007. [Google Scholar]

