
A Microfluidic Device for Hydrodynamic Trapping and Manipulation Platform of a Single Biological Cell

 , and
, and
Abstract
:
1. Introduction
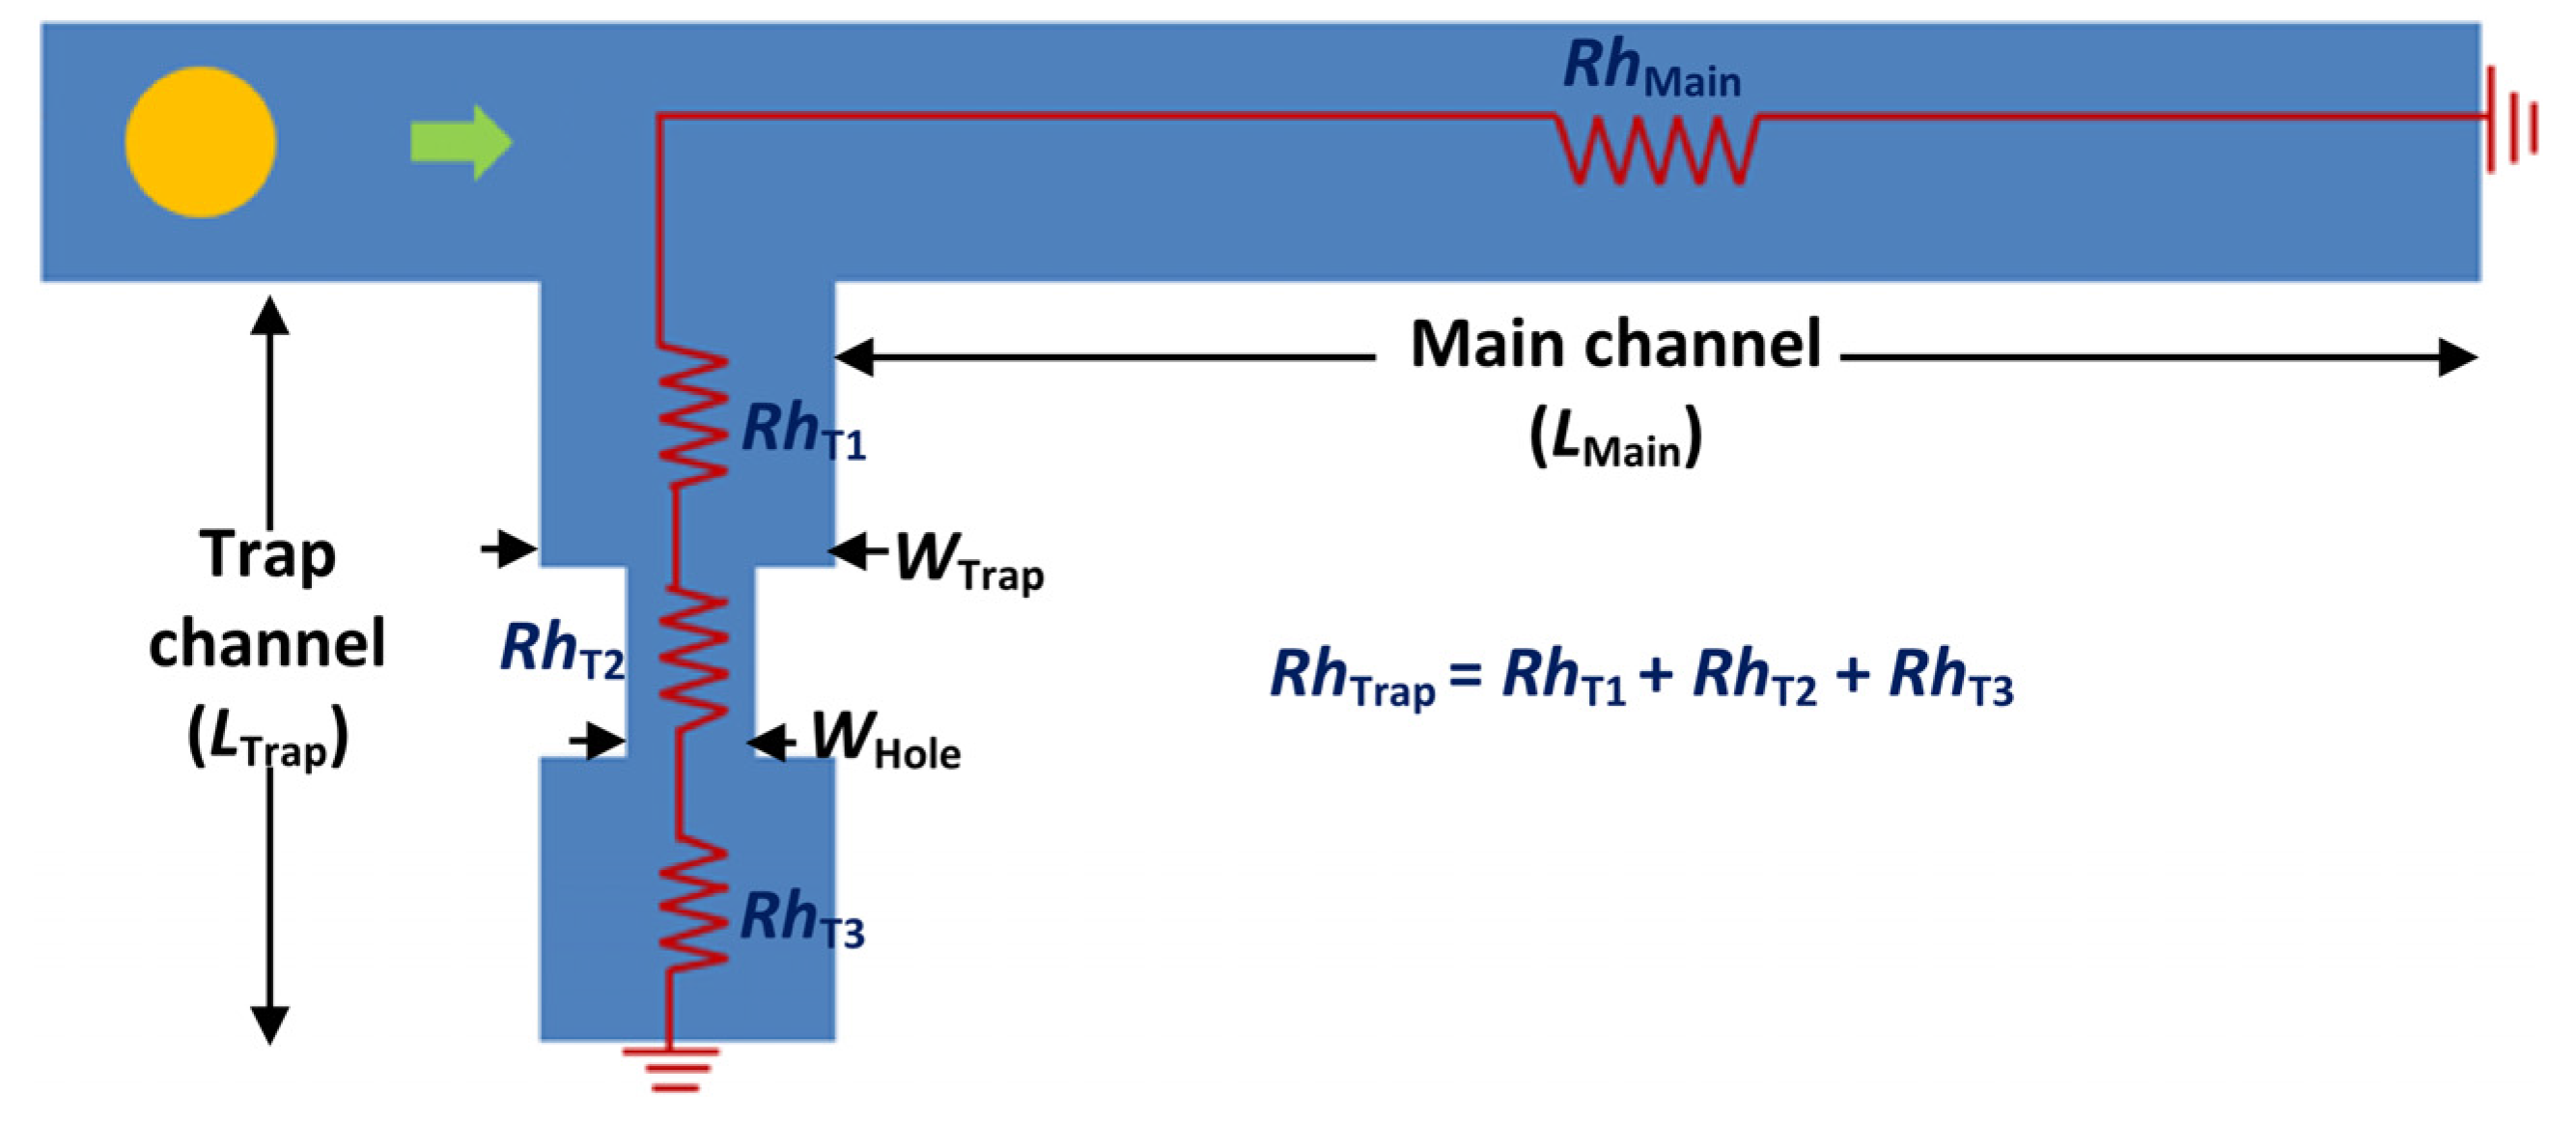
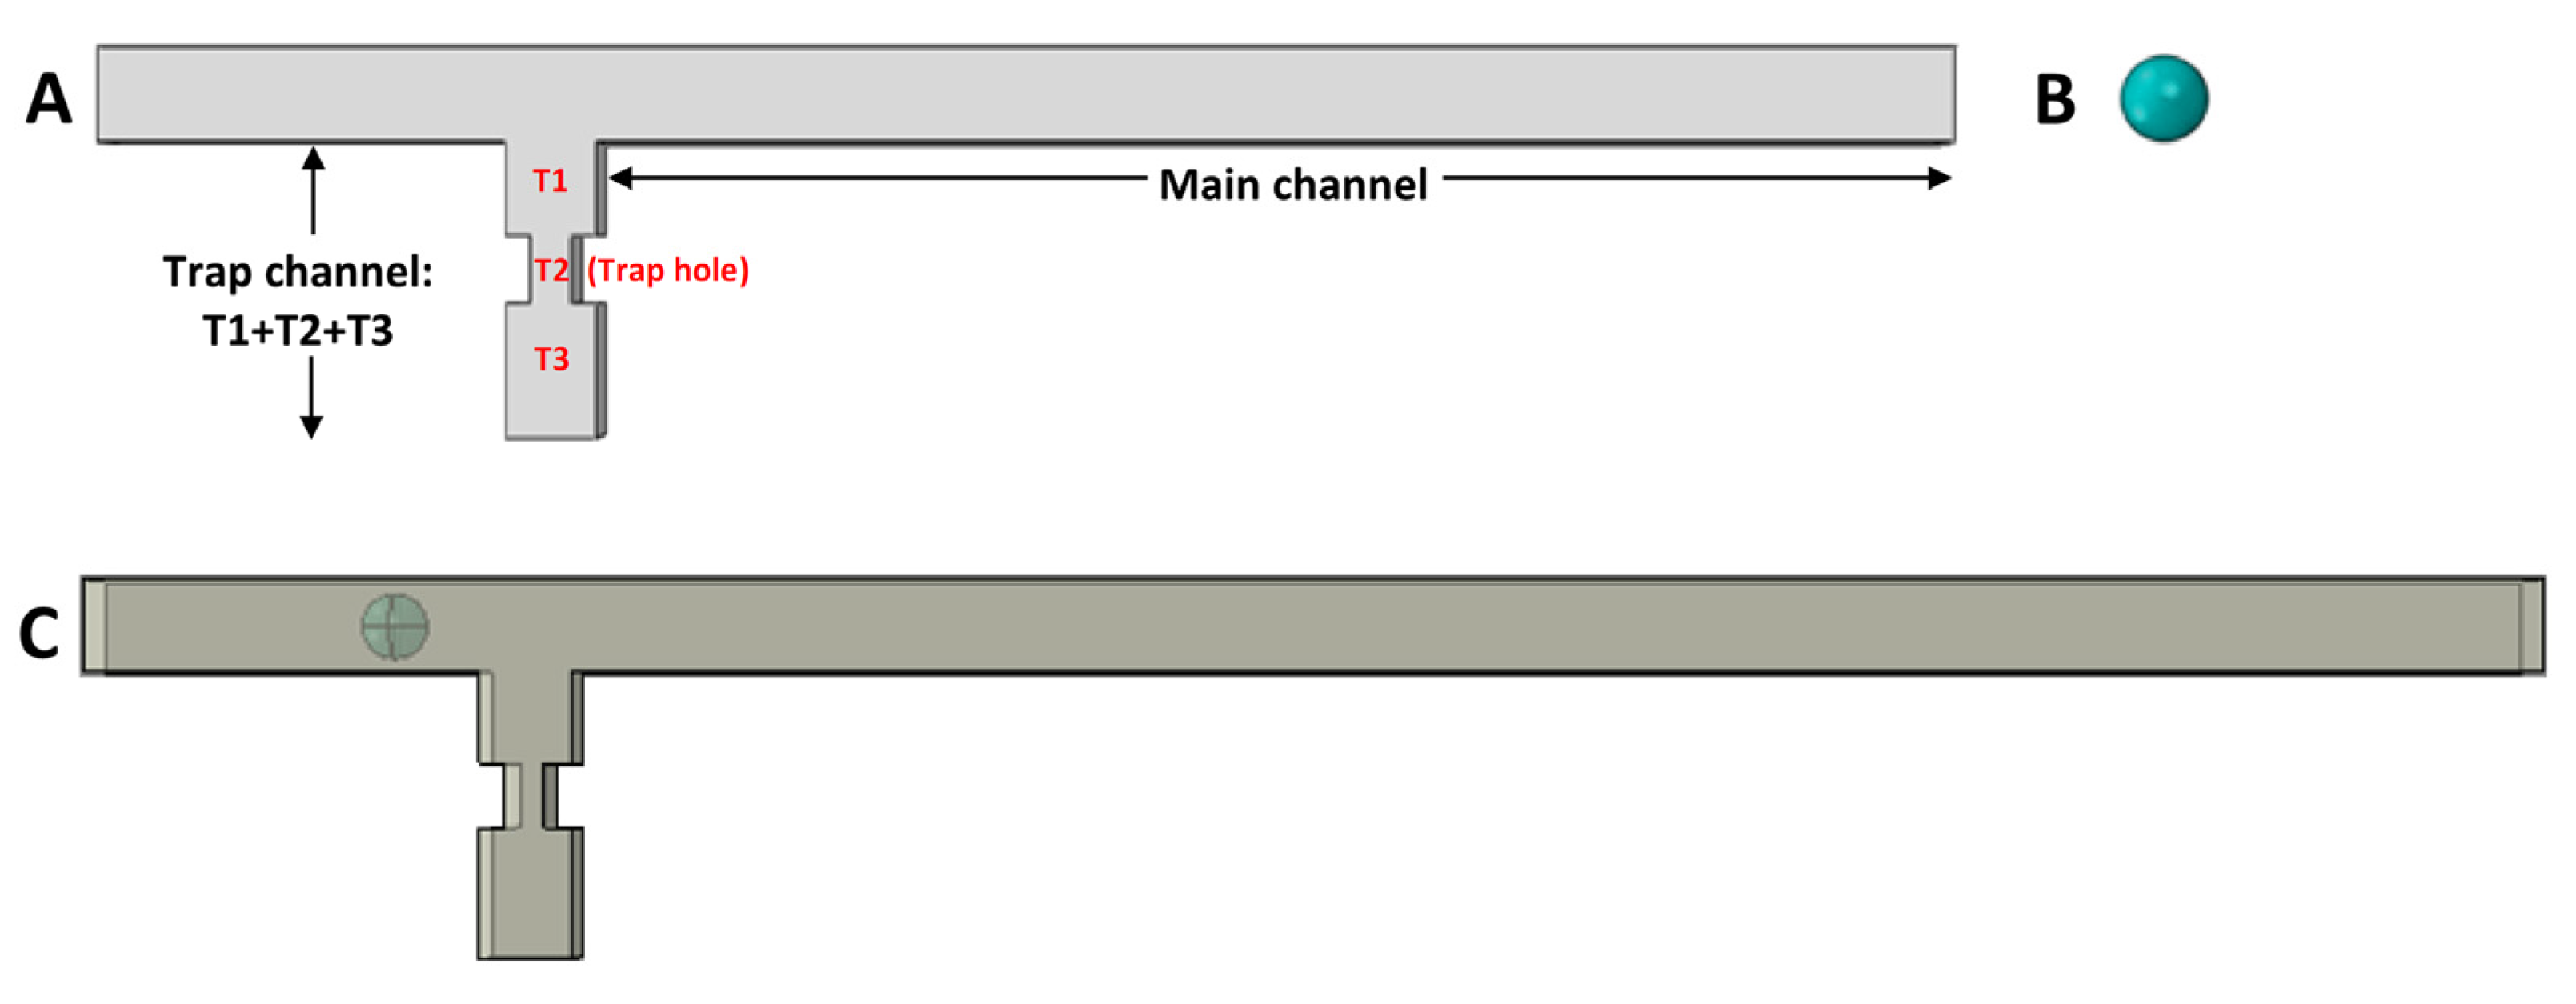
2. Idea and Concept


3. Methodology
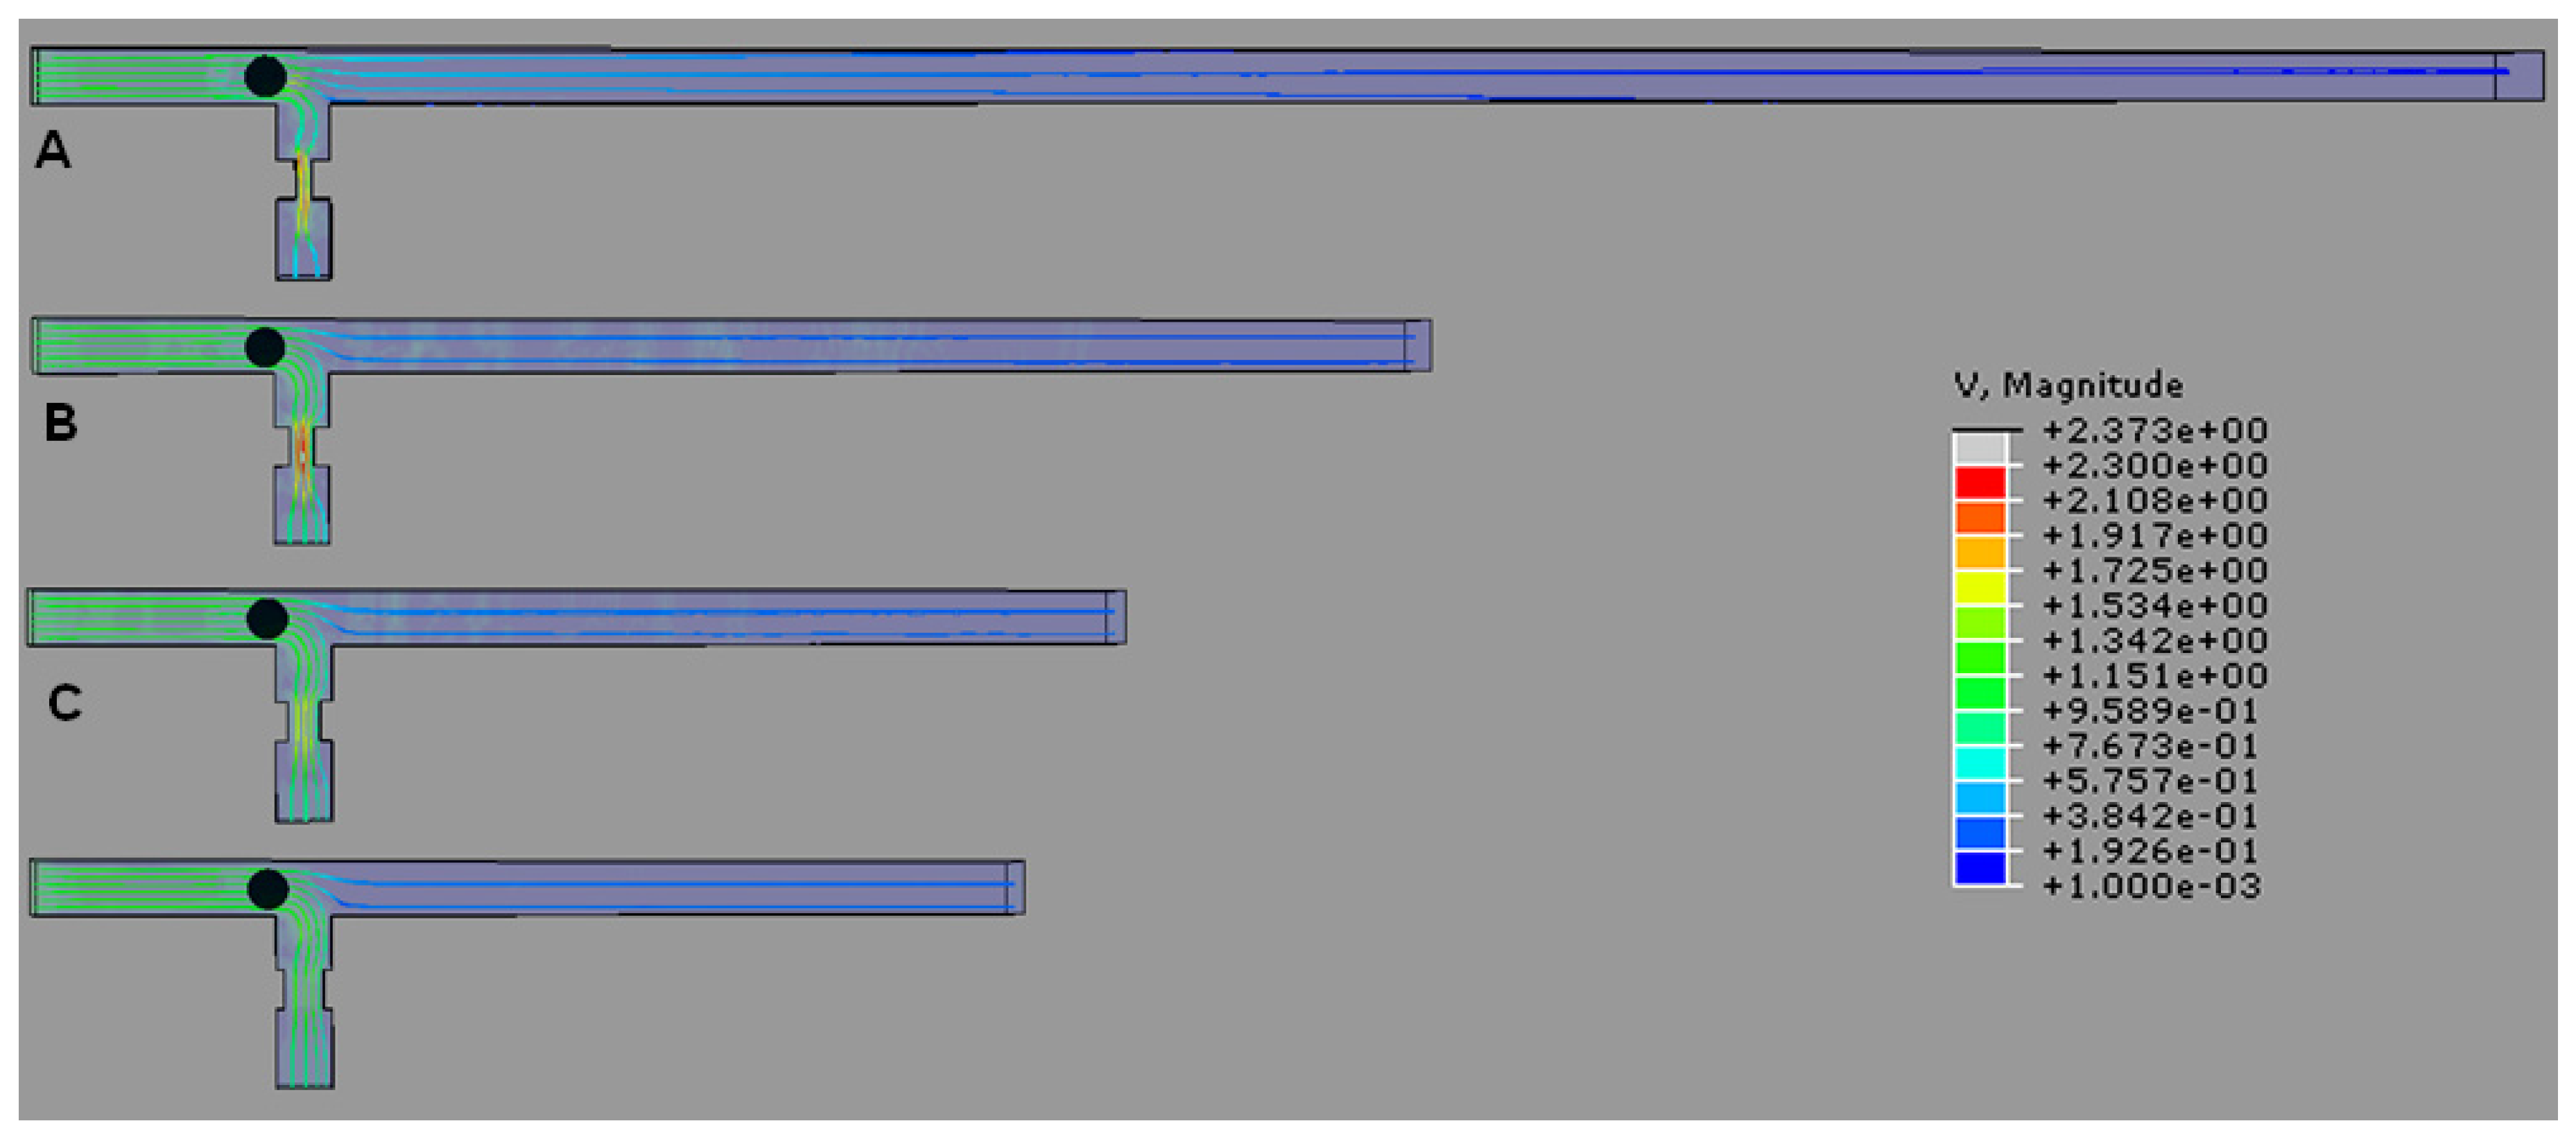
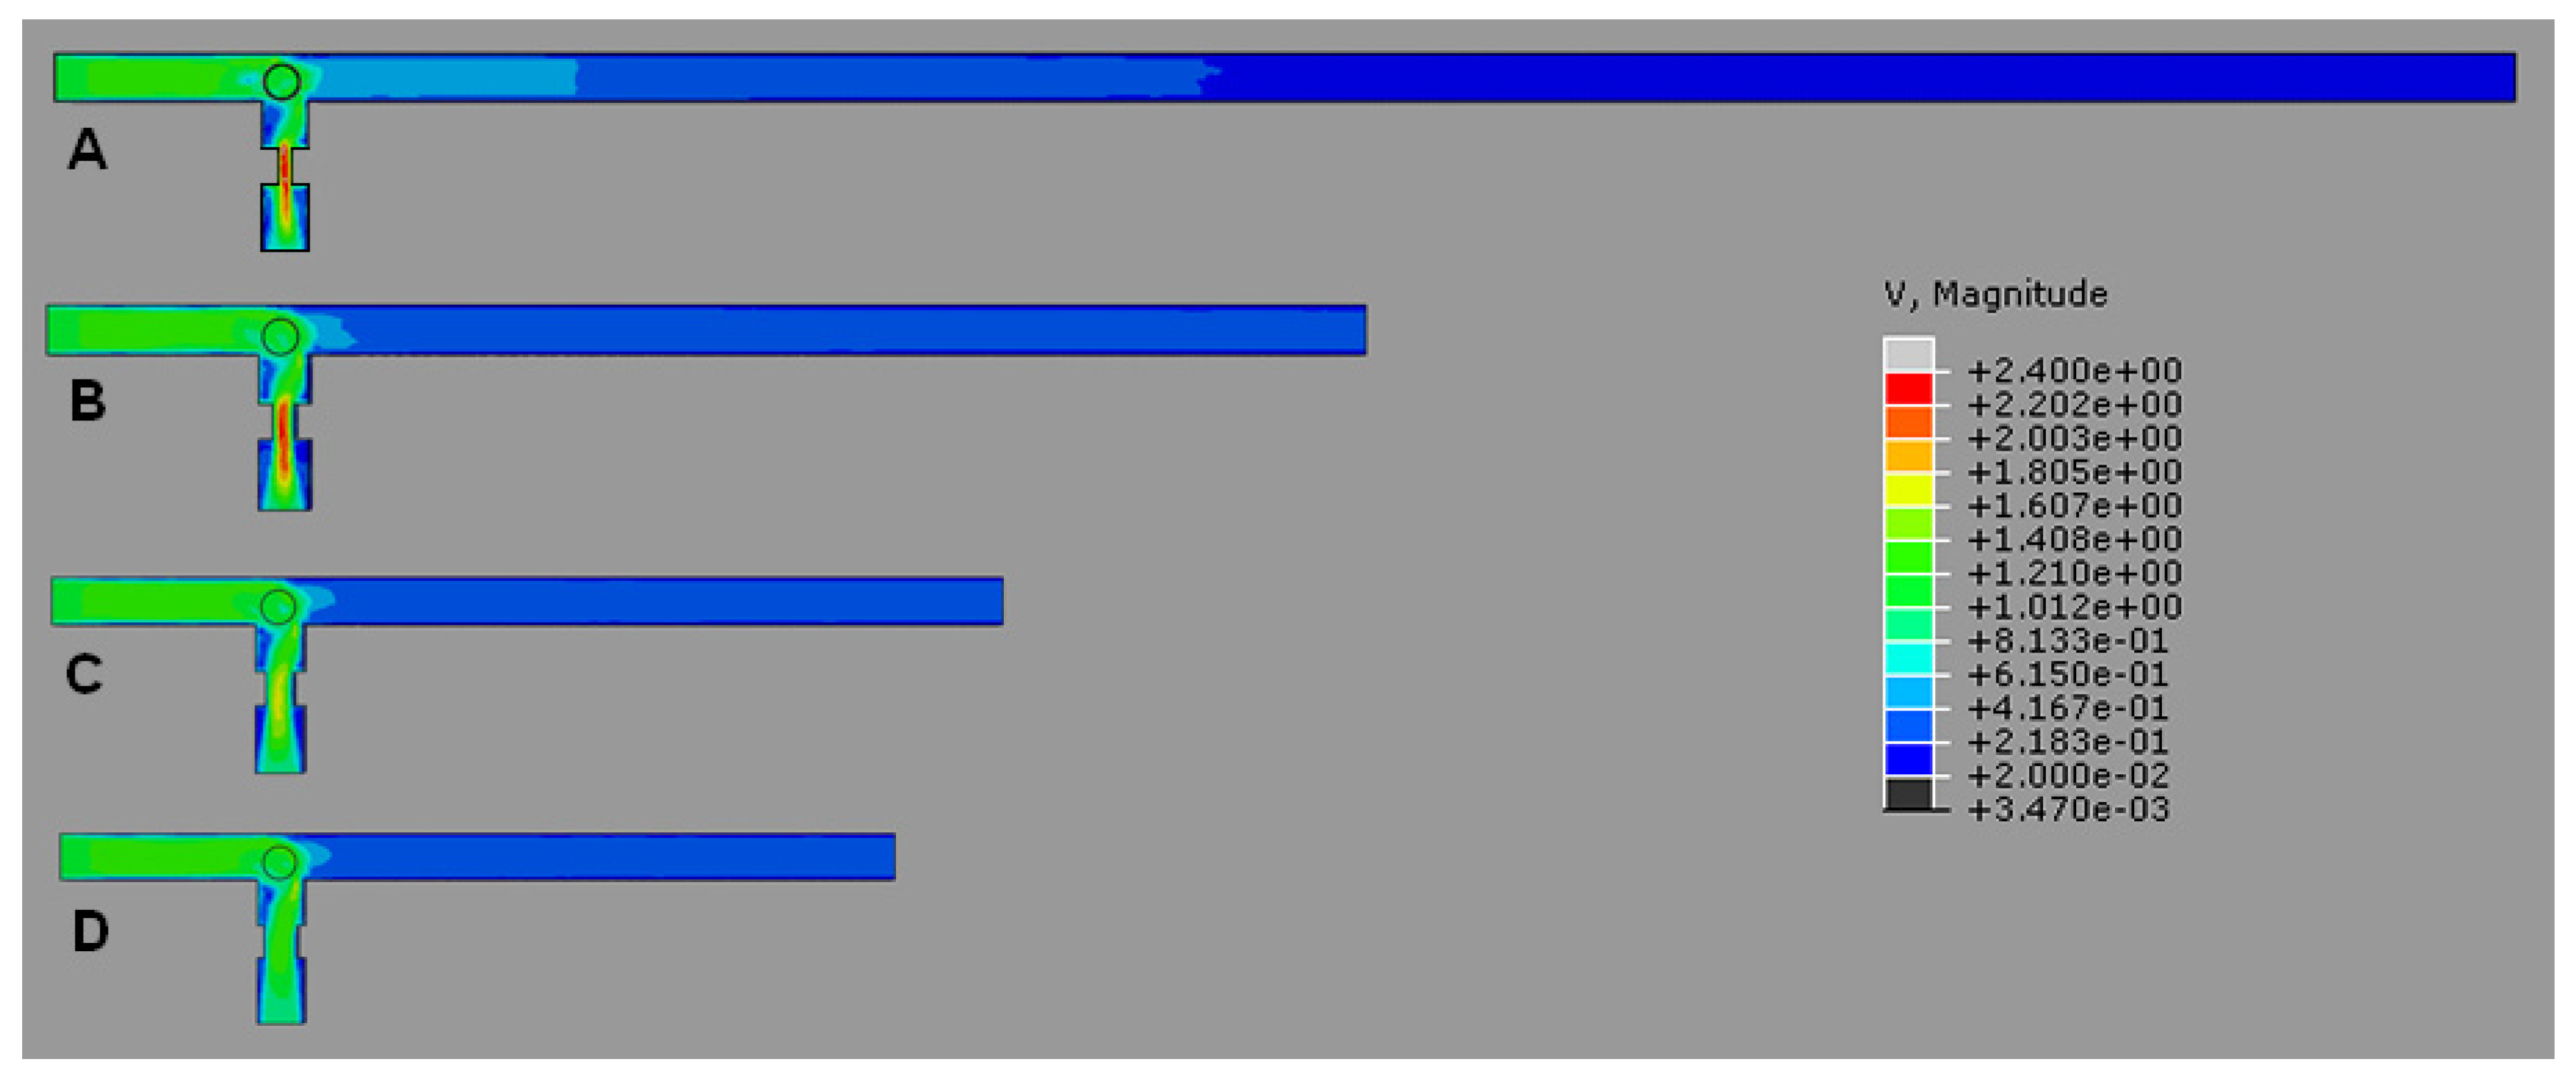
3.1. Simulation Setup

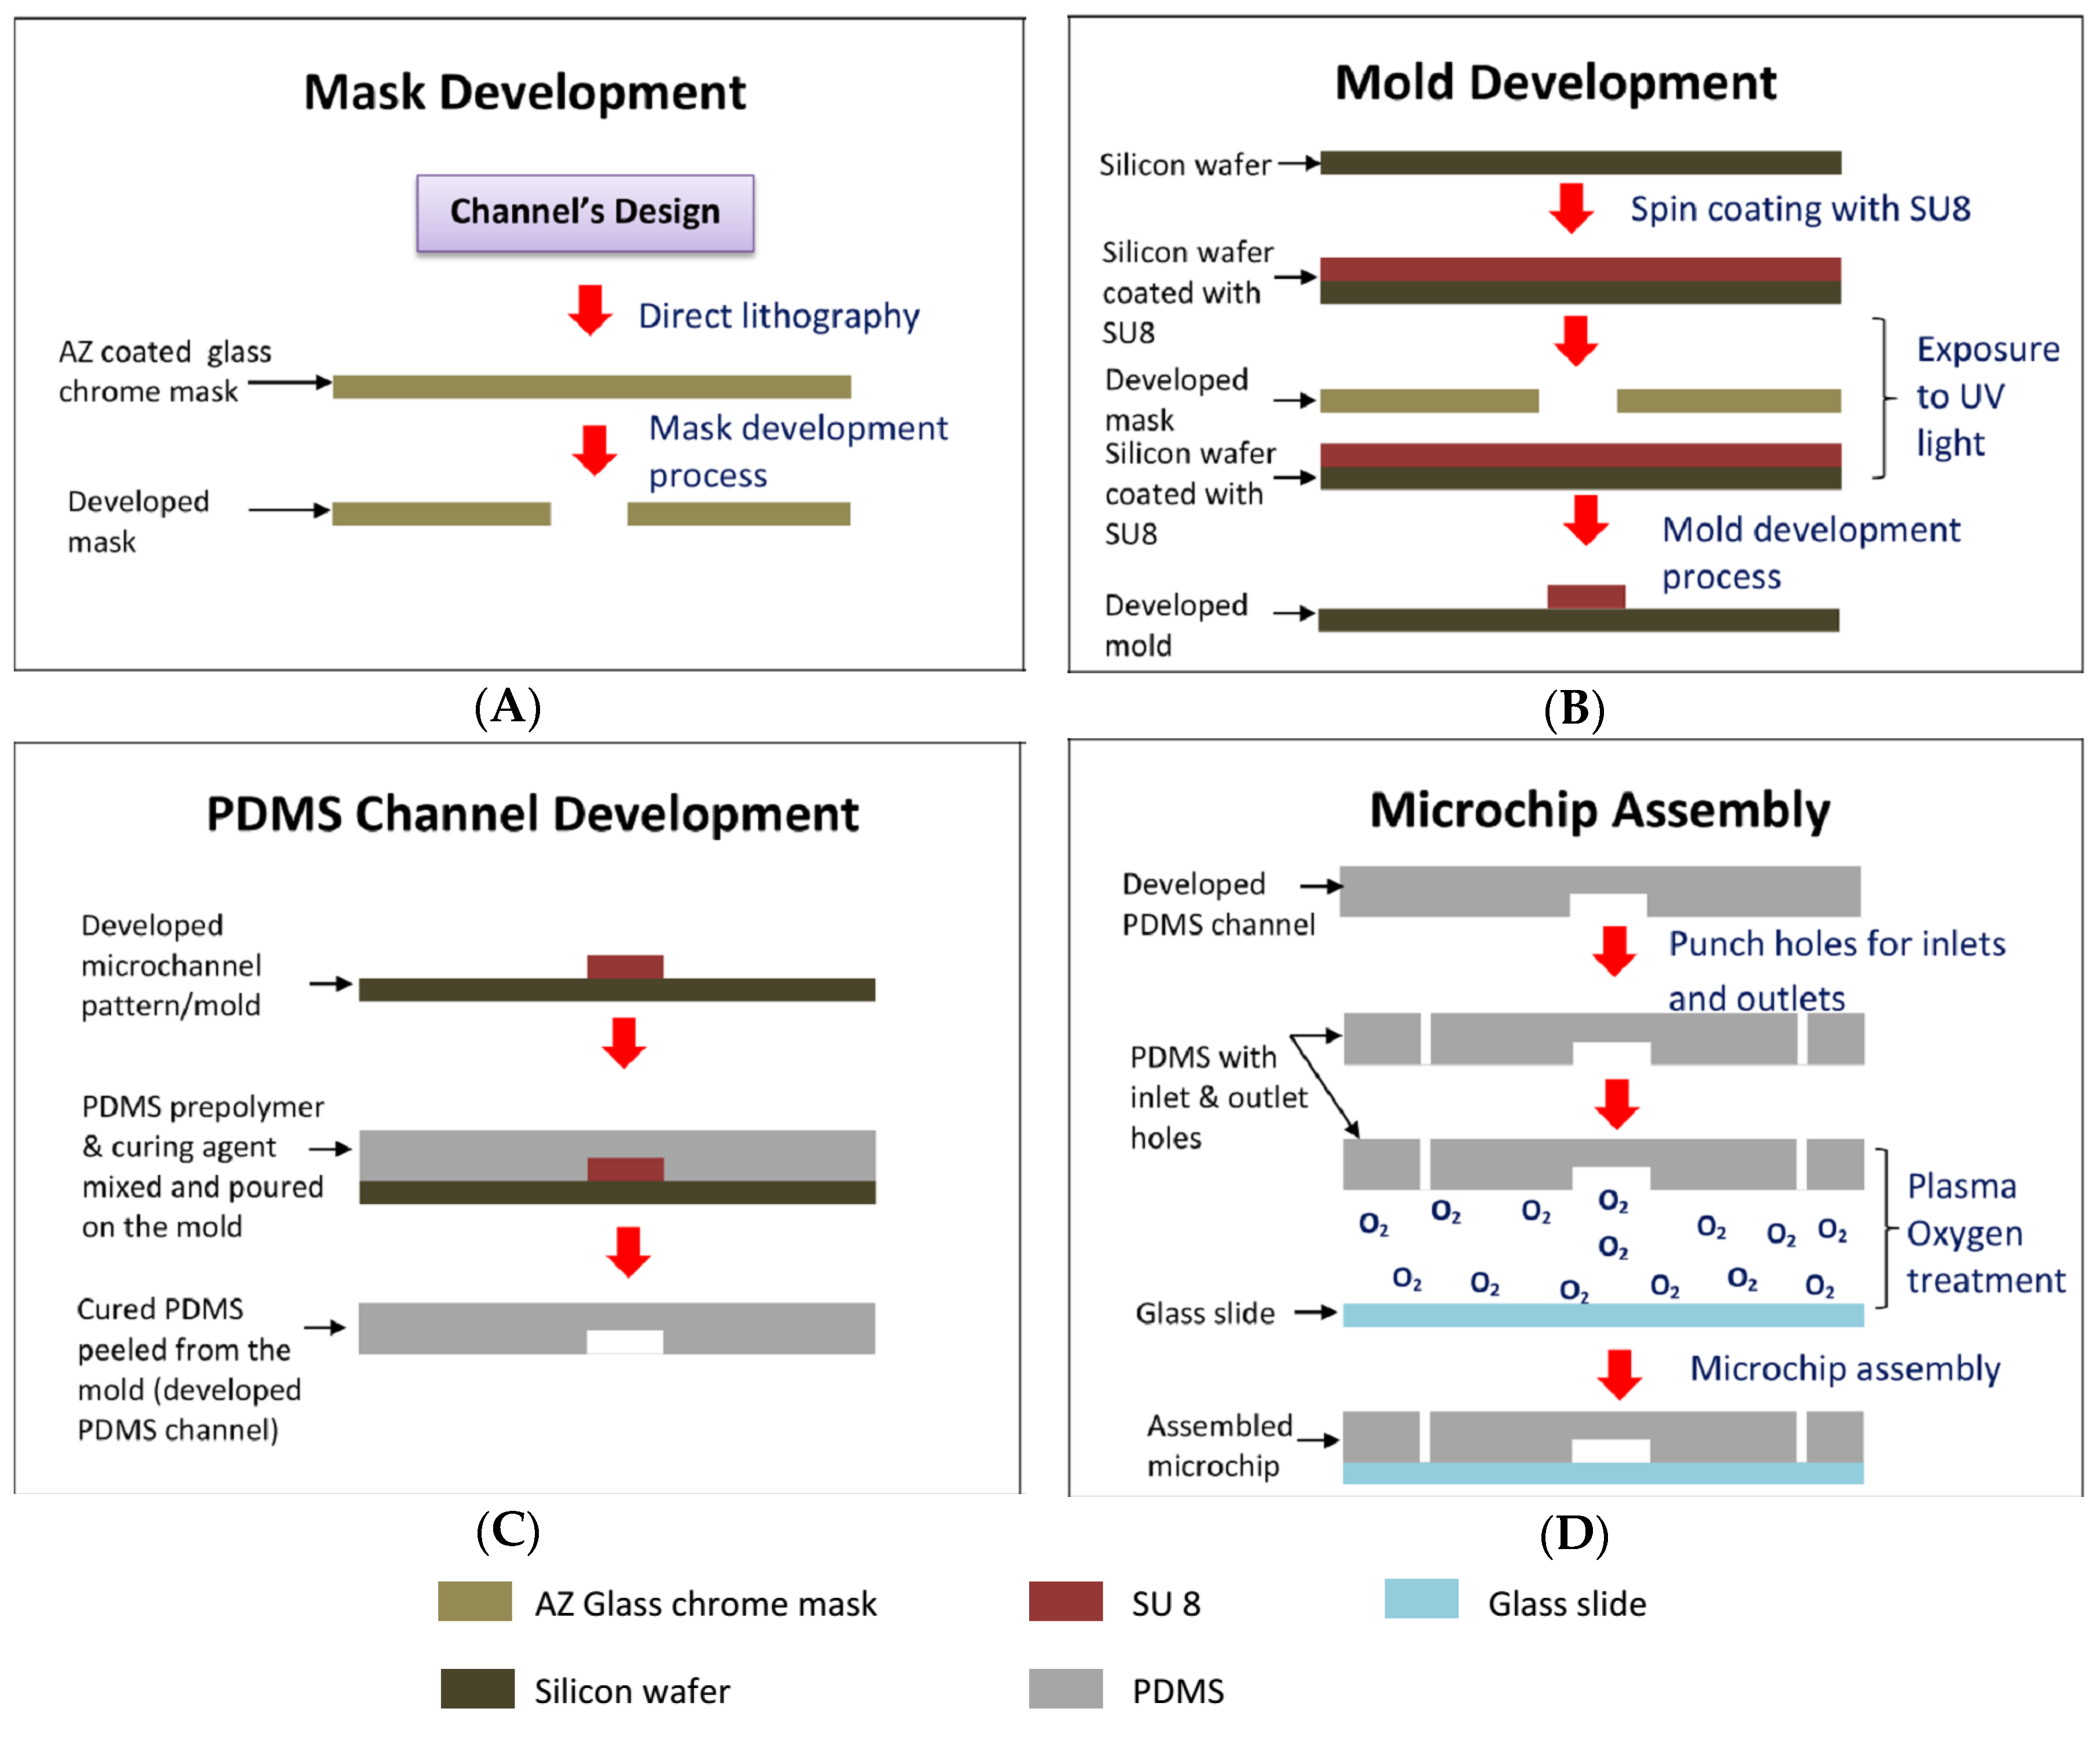
3.2. Microfluidic Chip Fabrication

3.3. Cell Culture and Cell Aggregates Formation
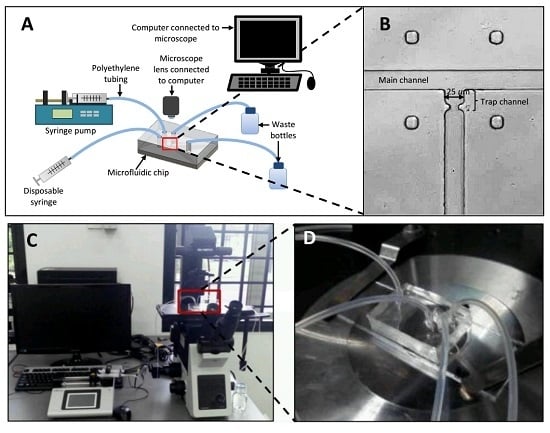
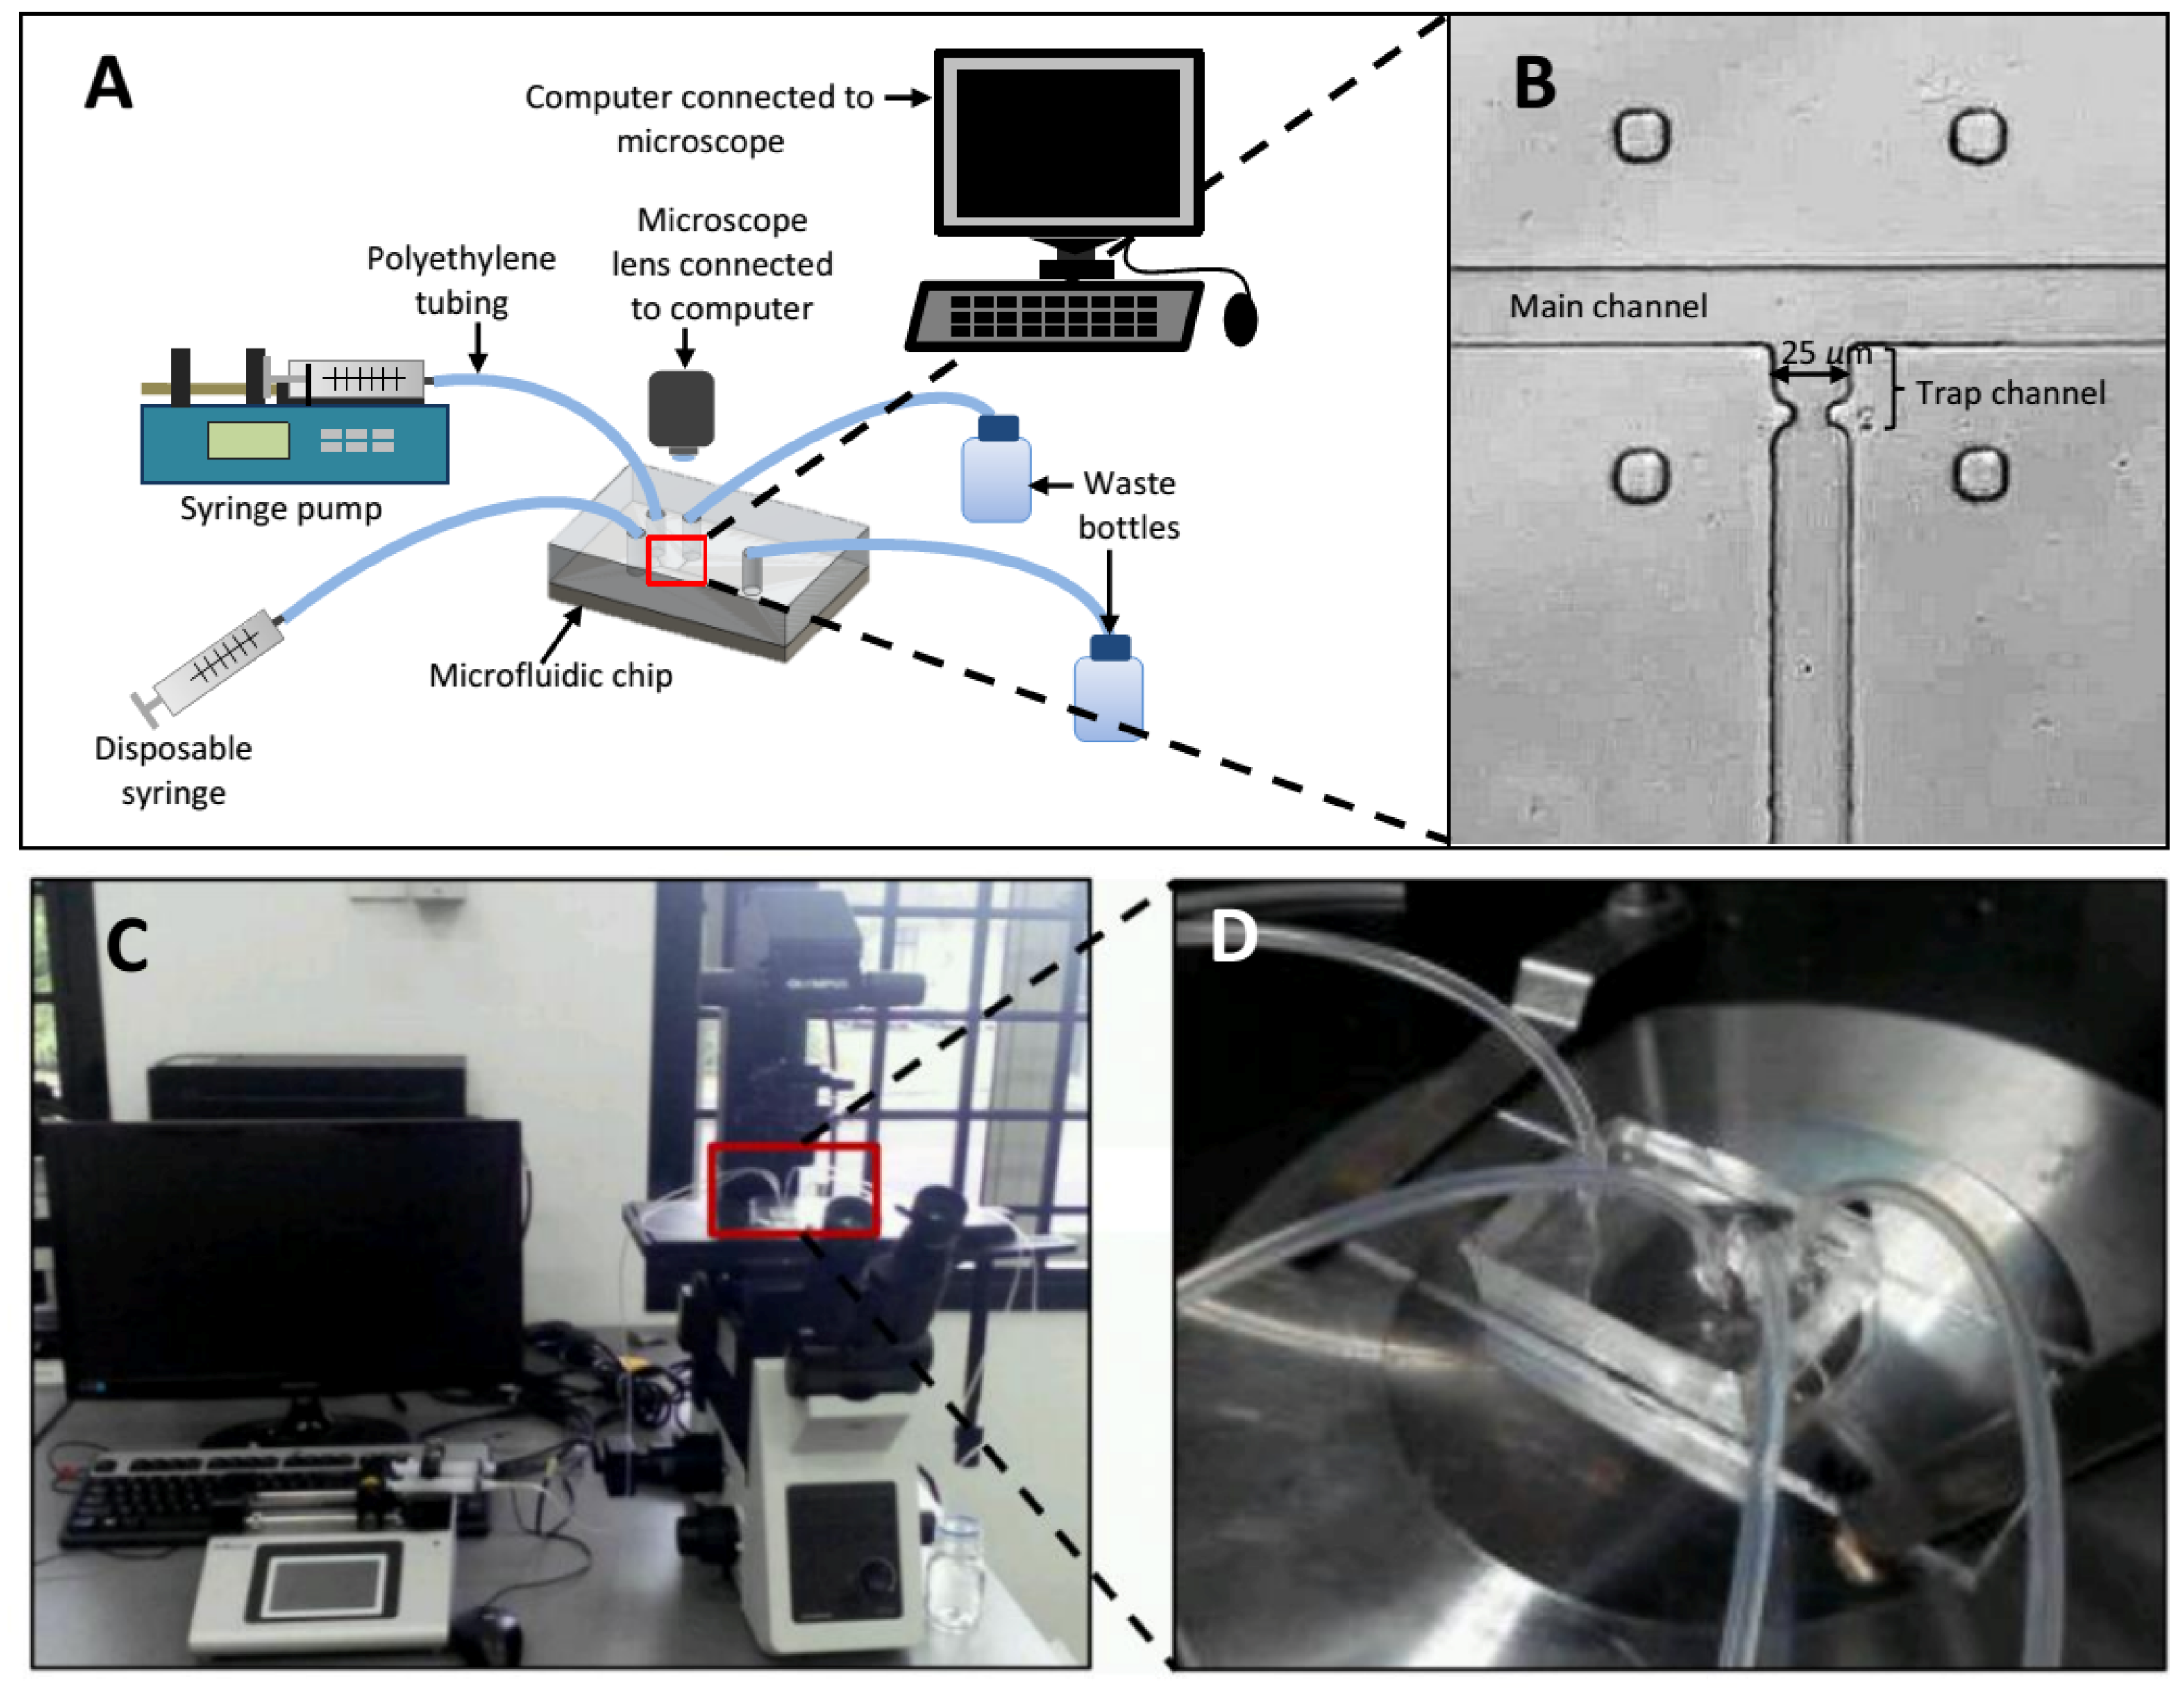
3.4. Experimental Setup

4. Results and Discussions
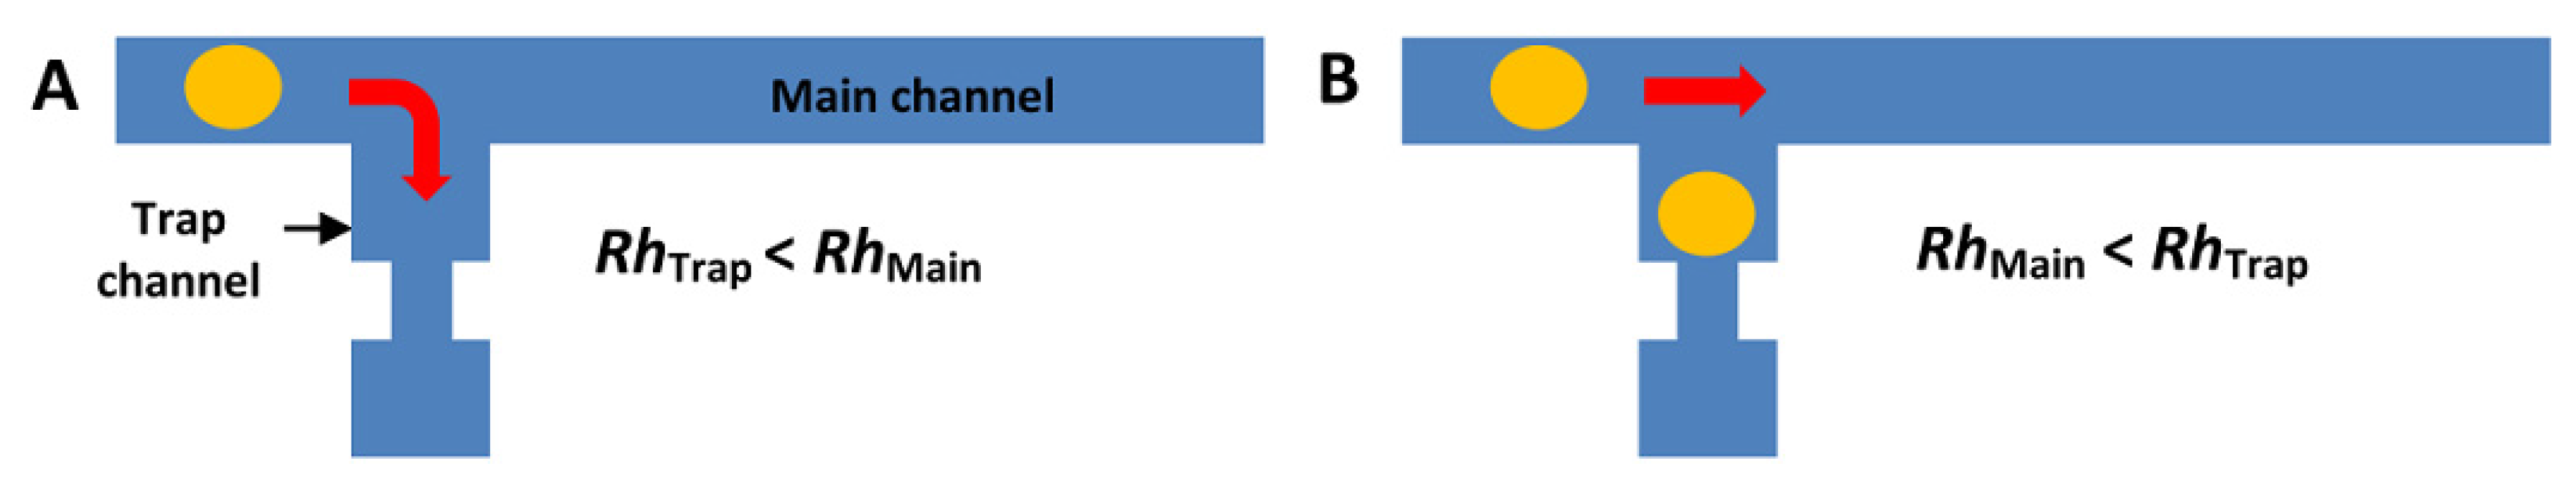
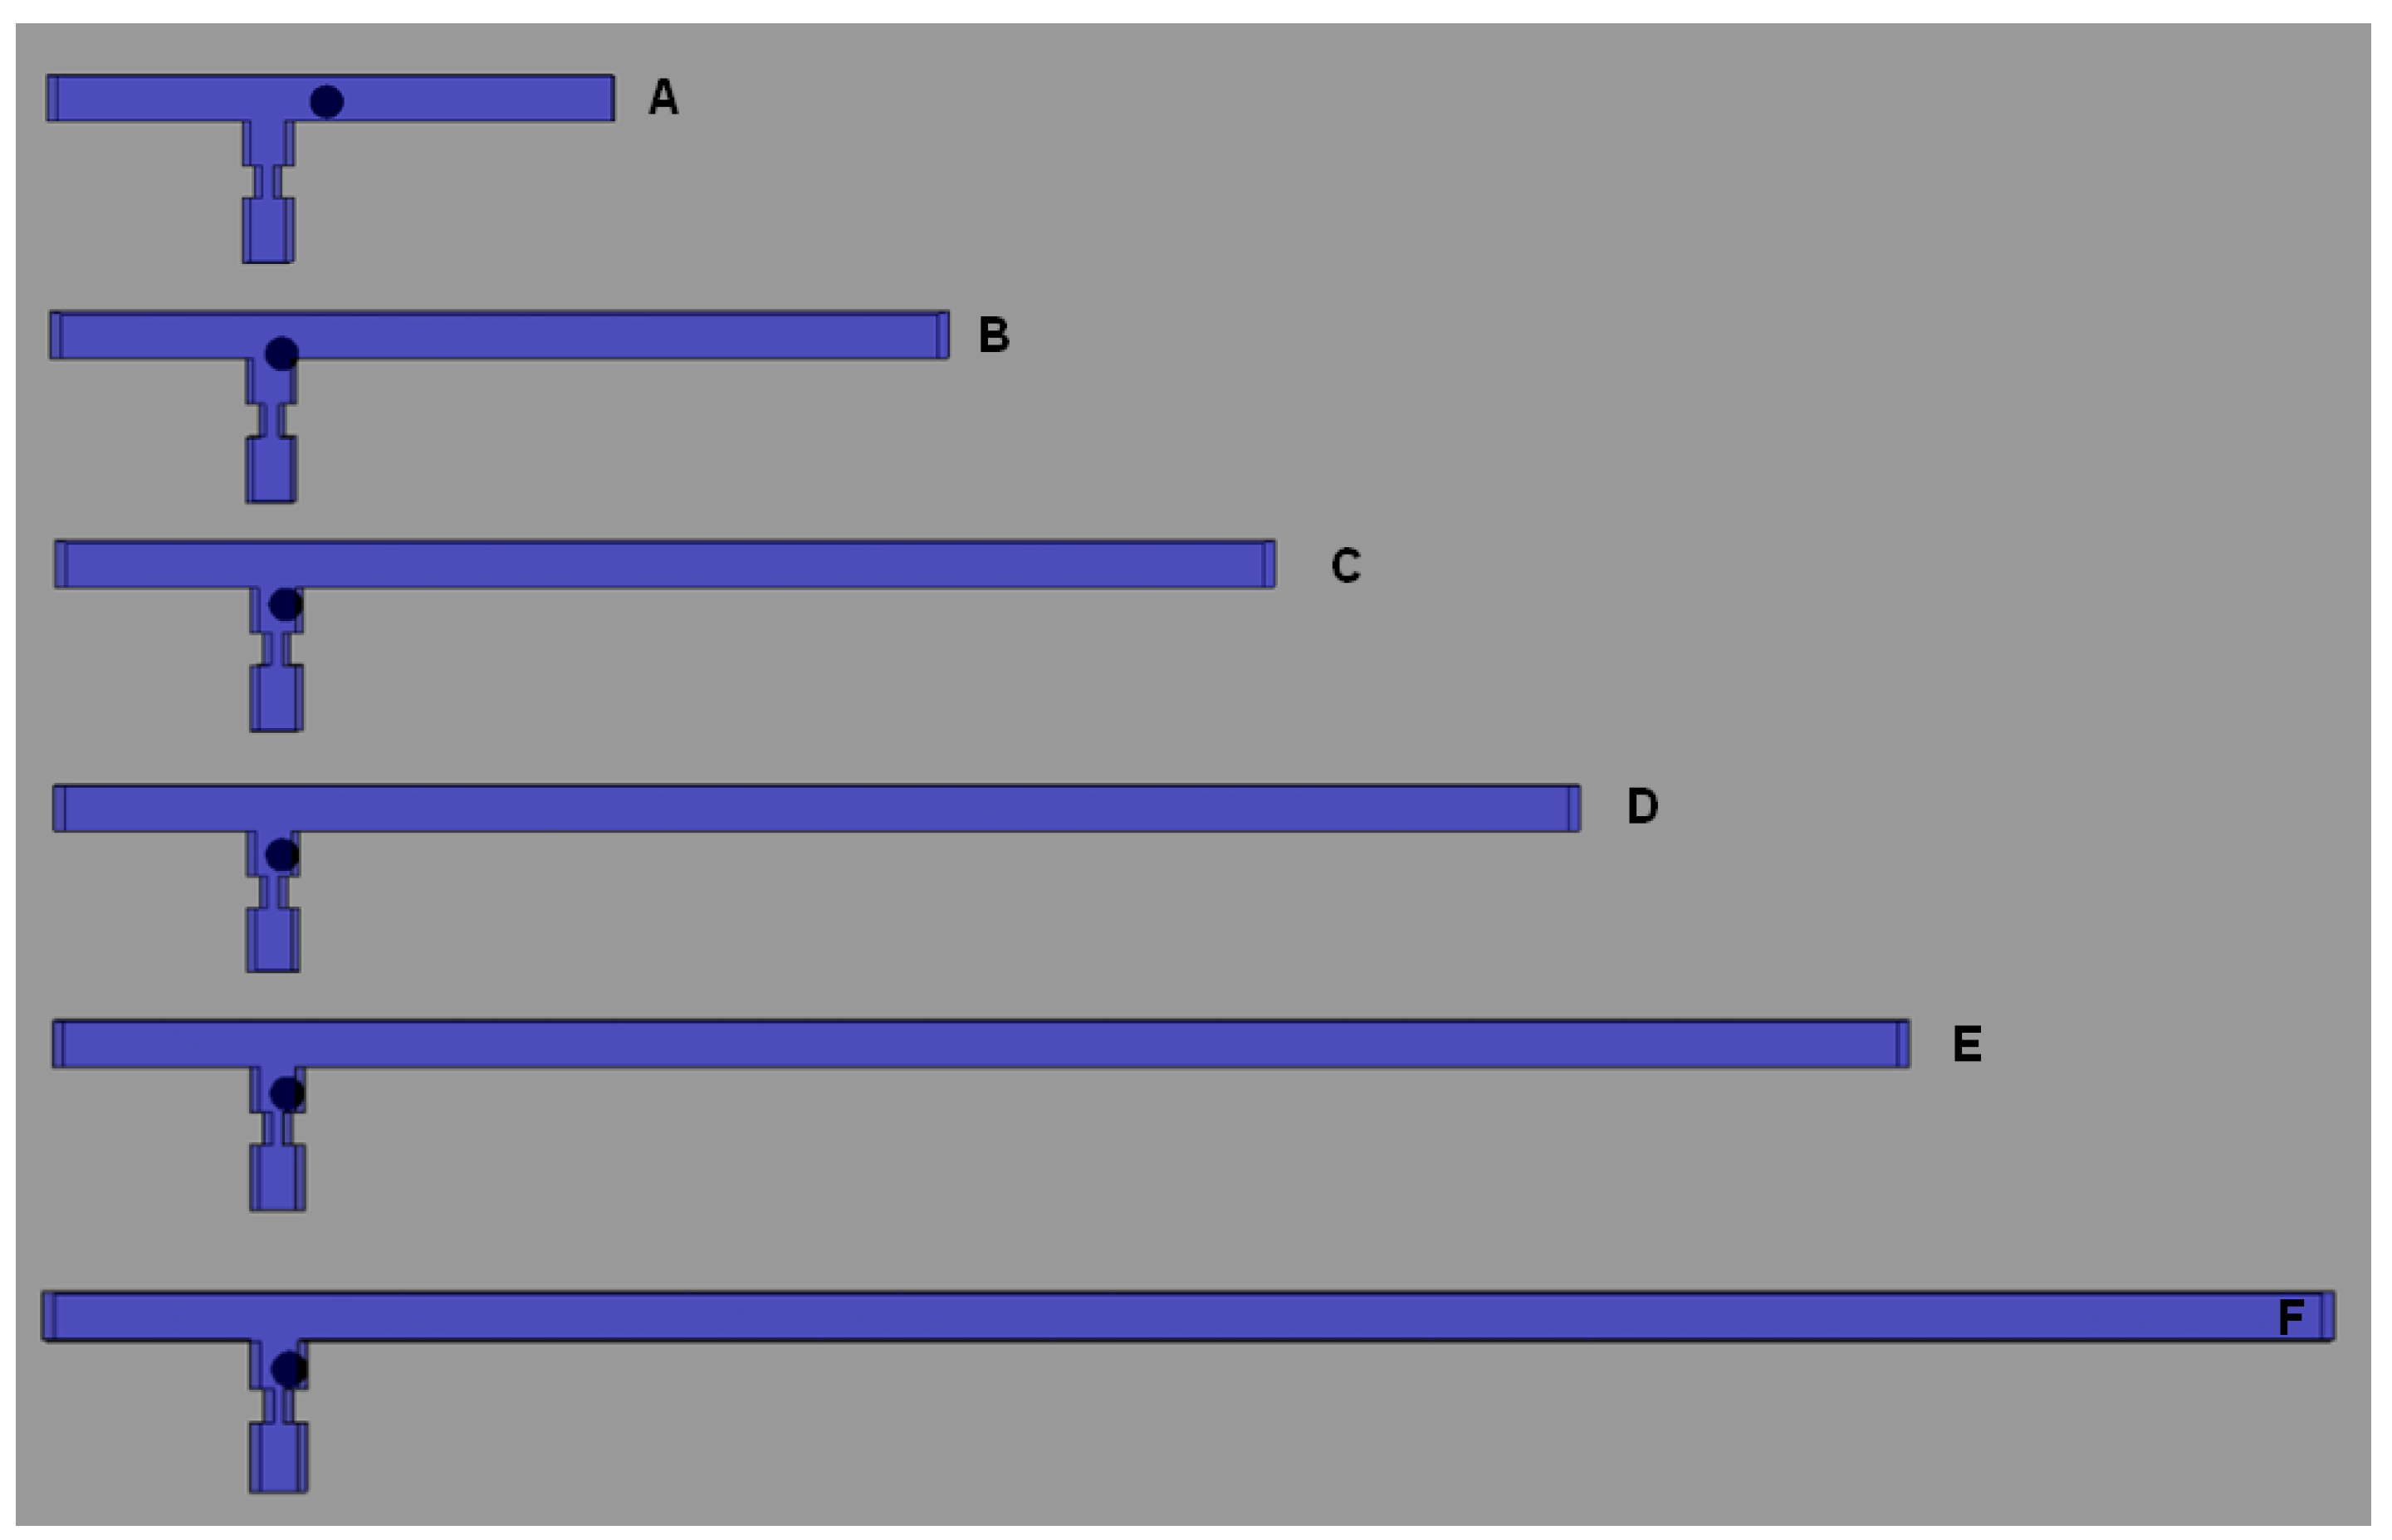
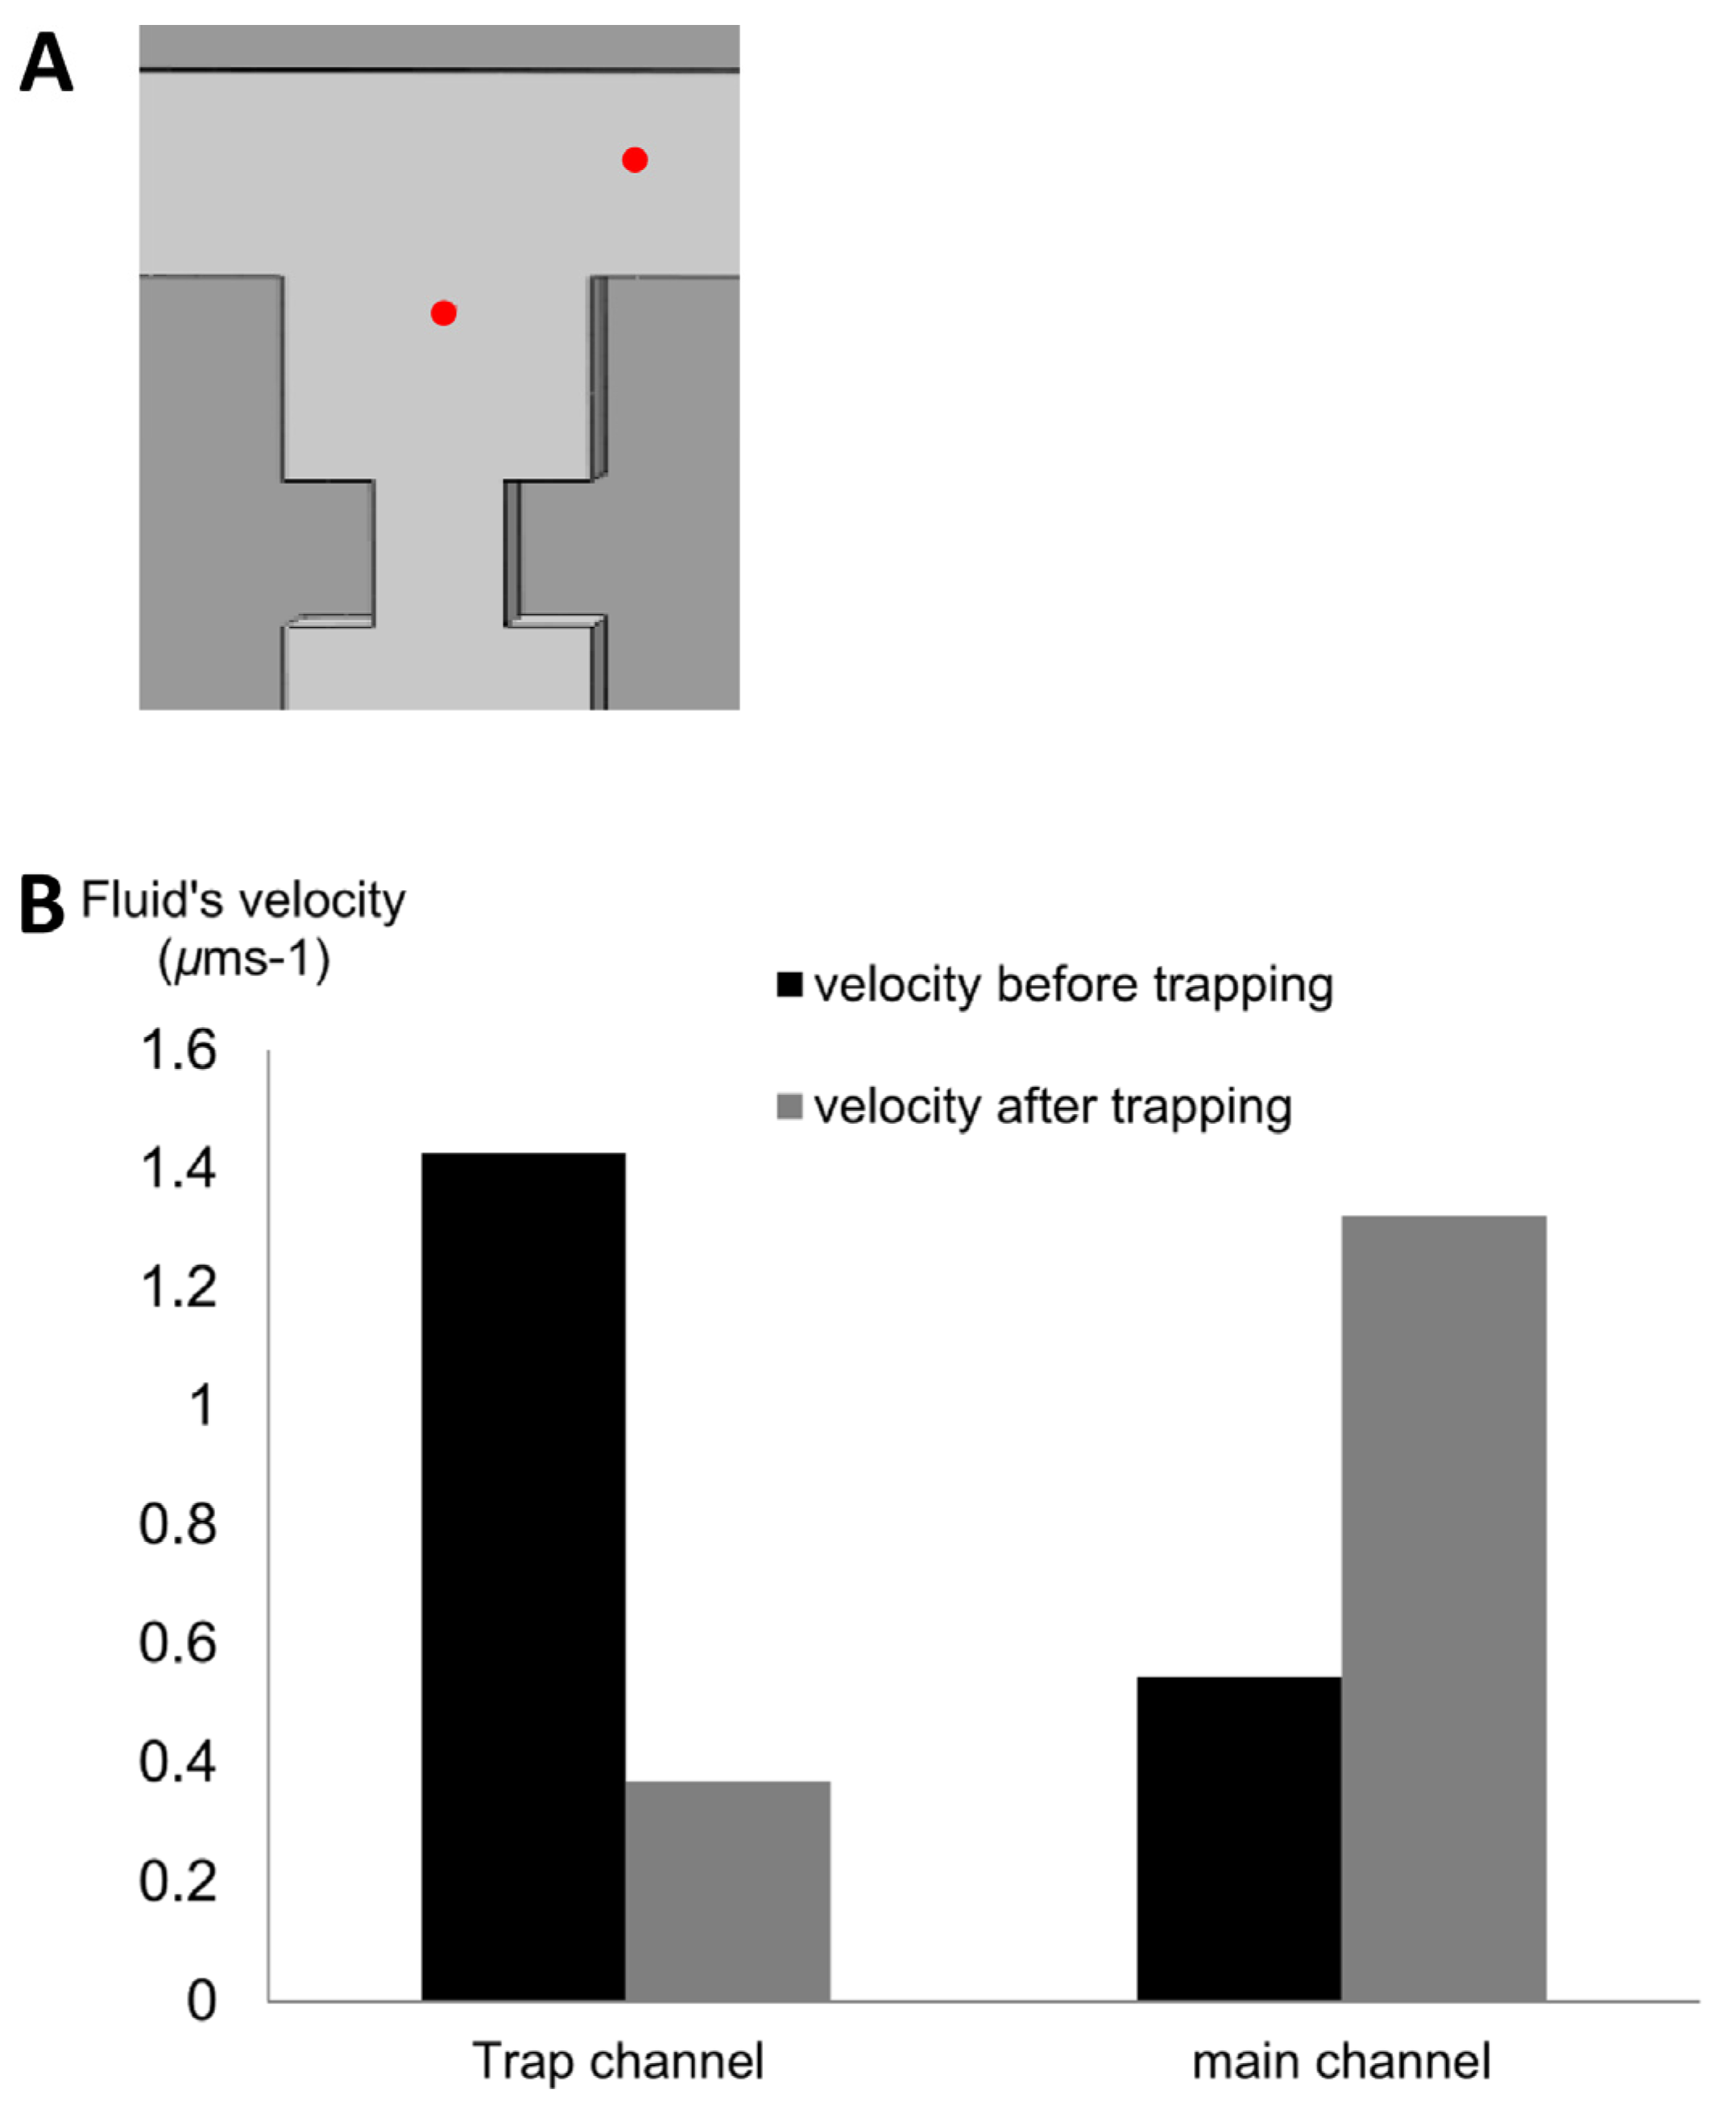
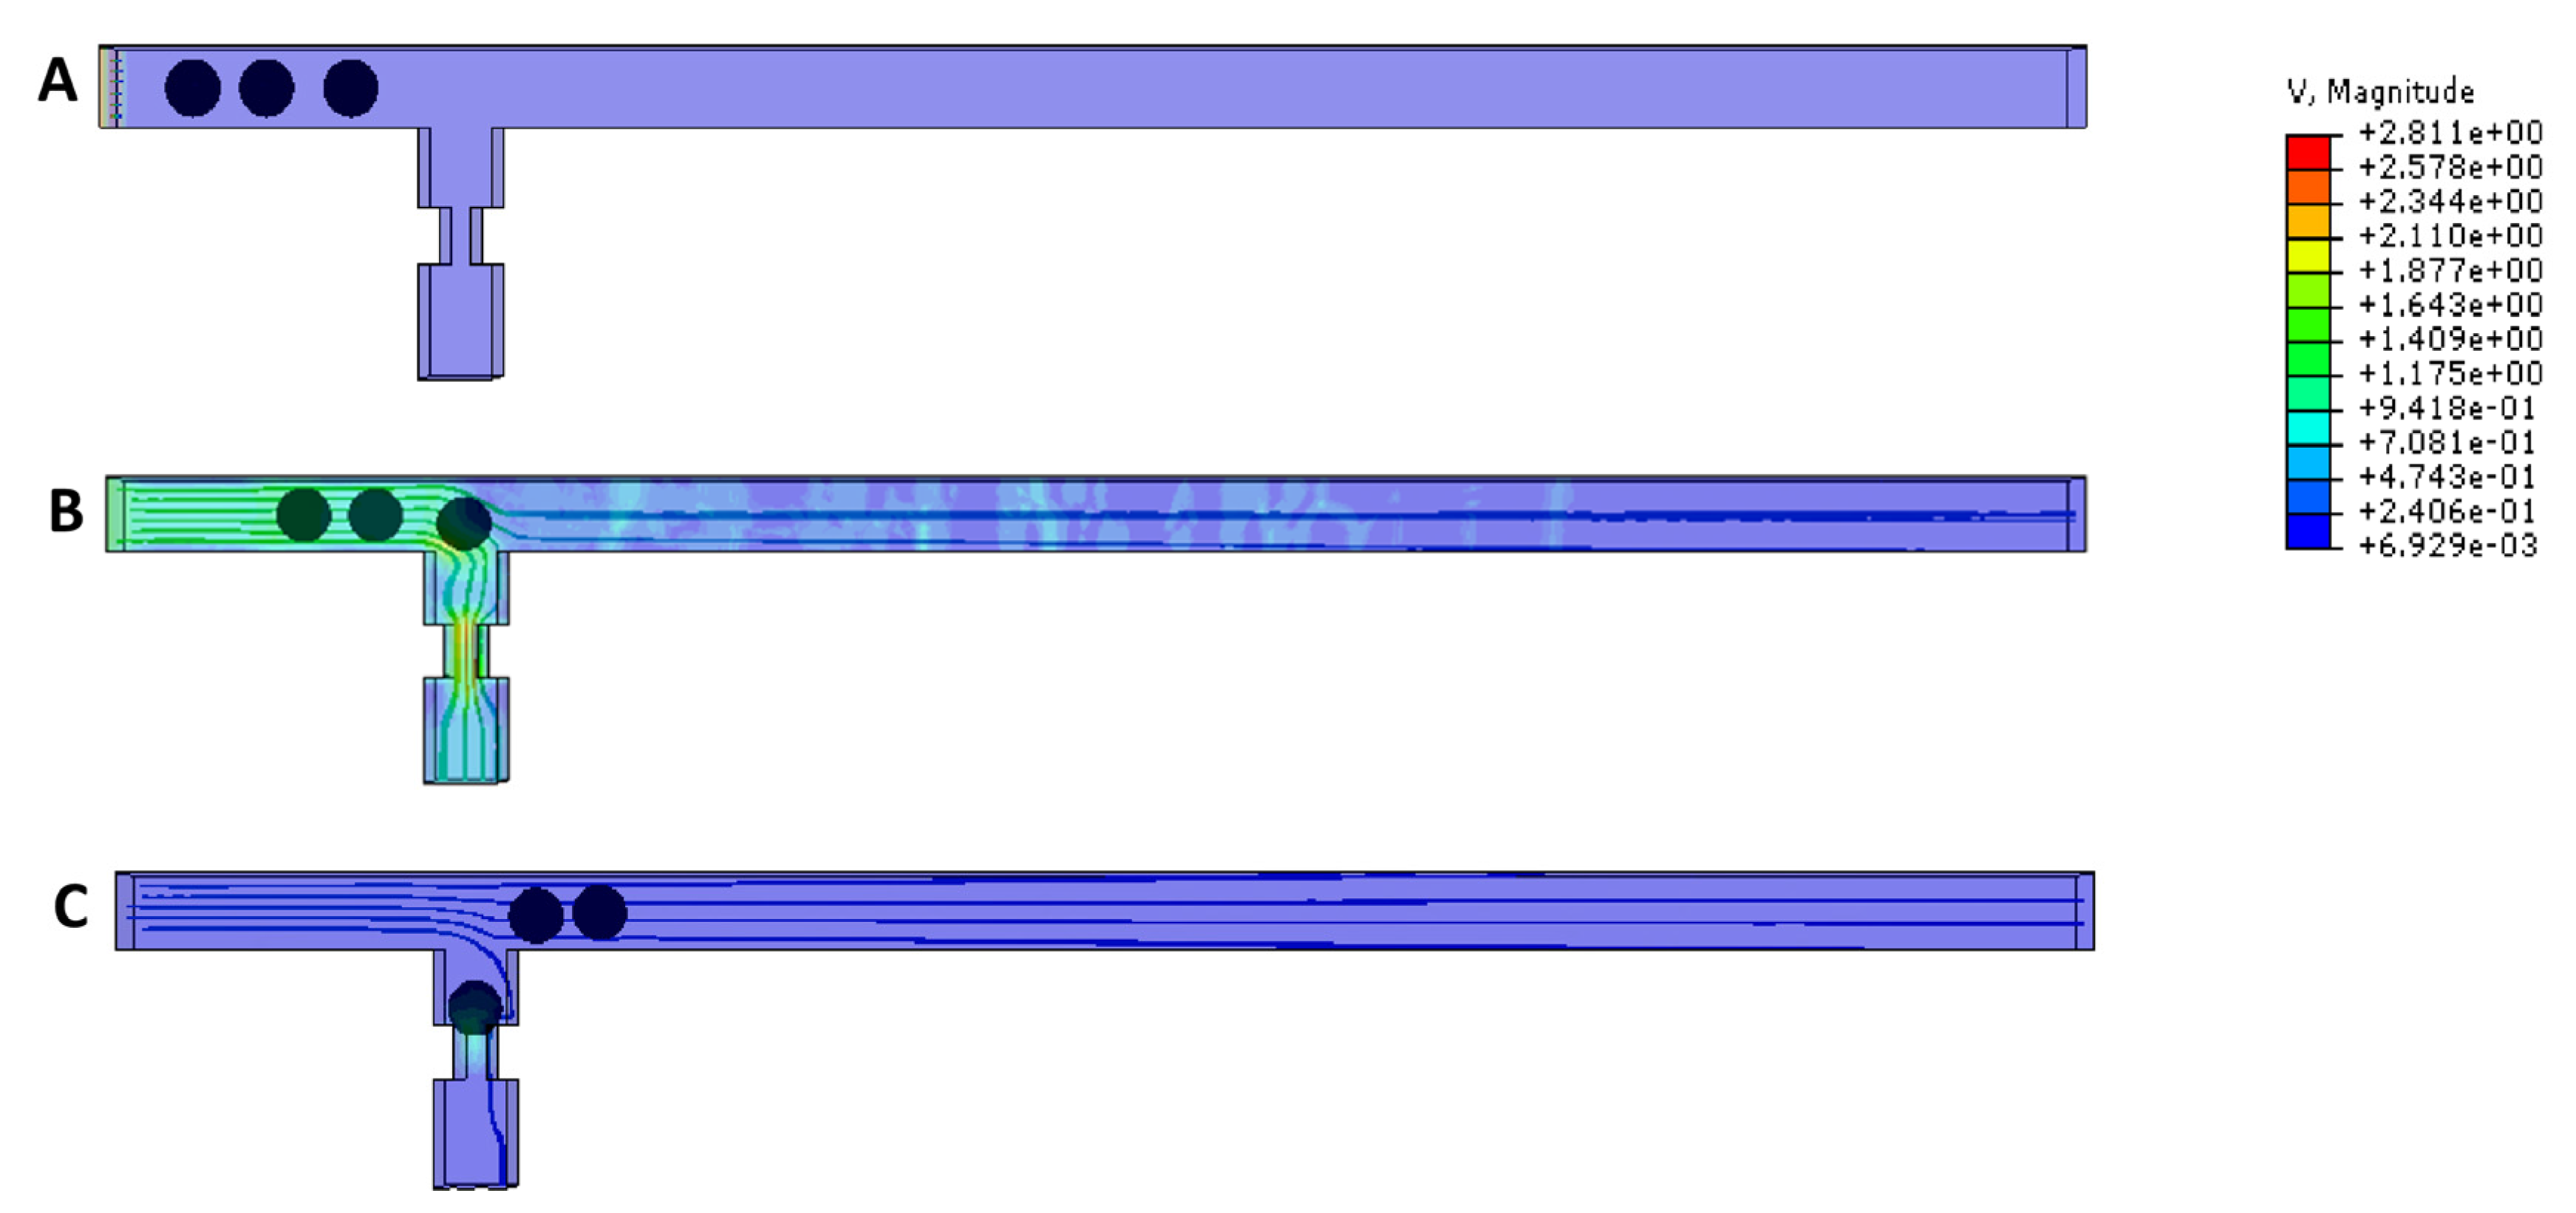
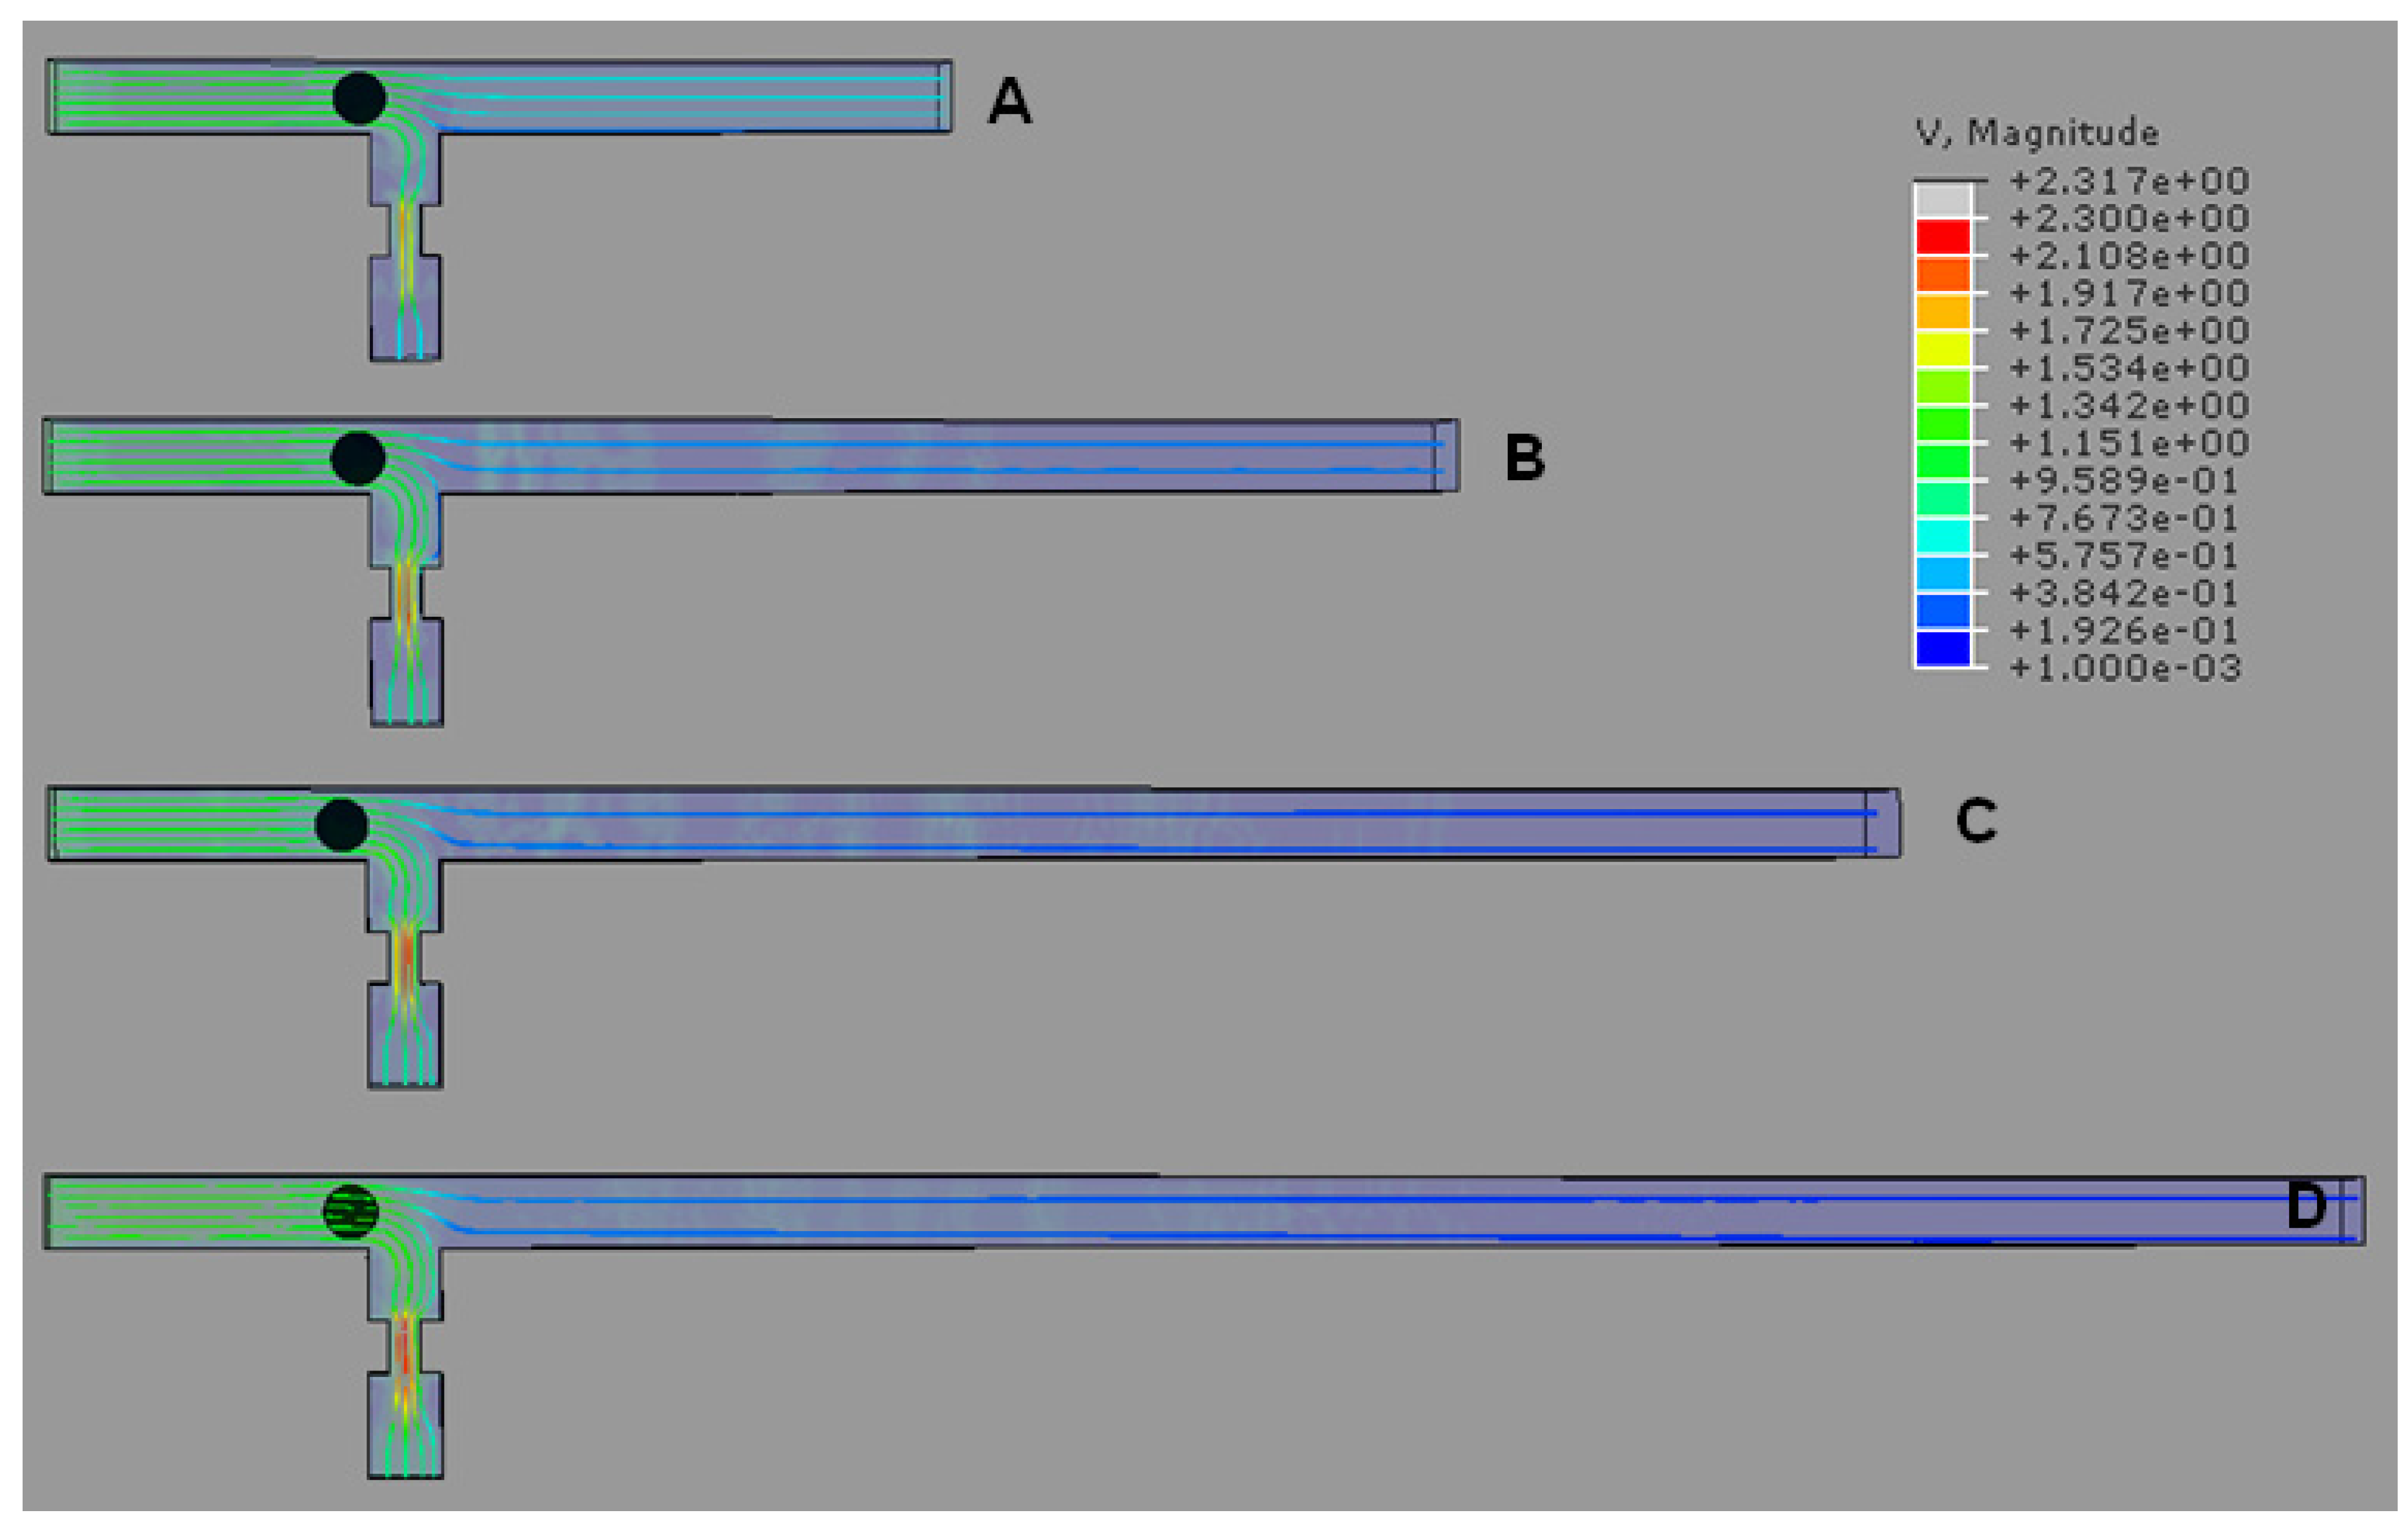
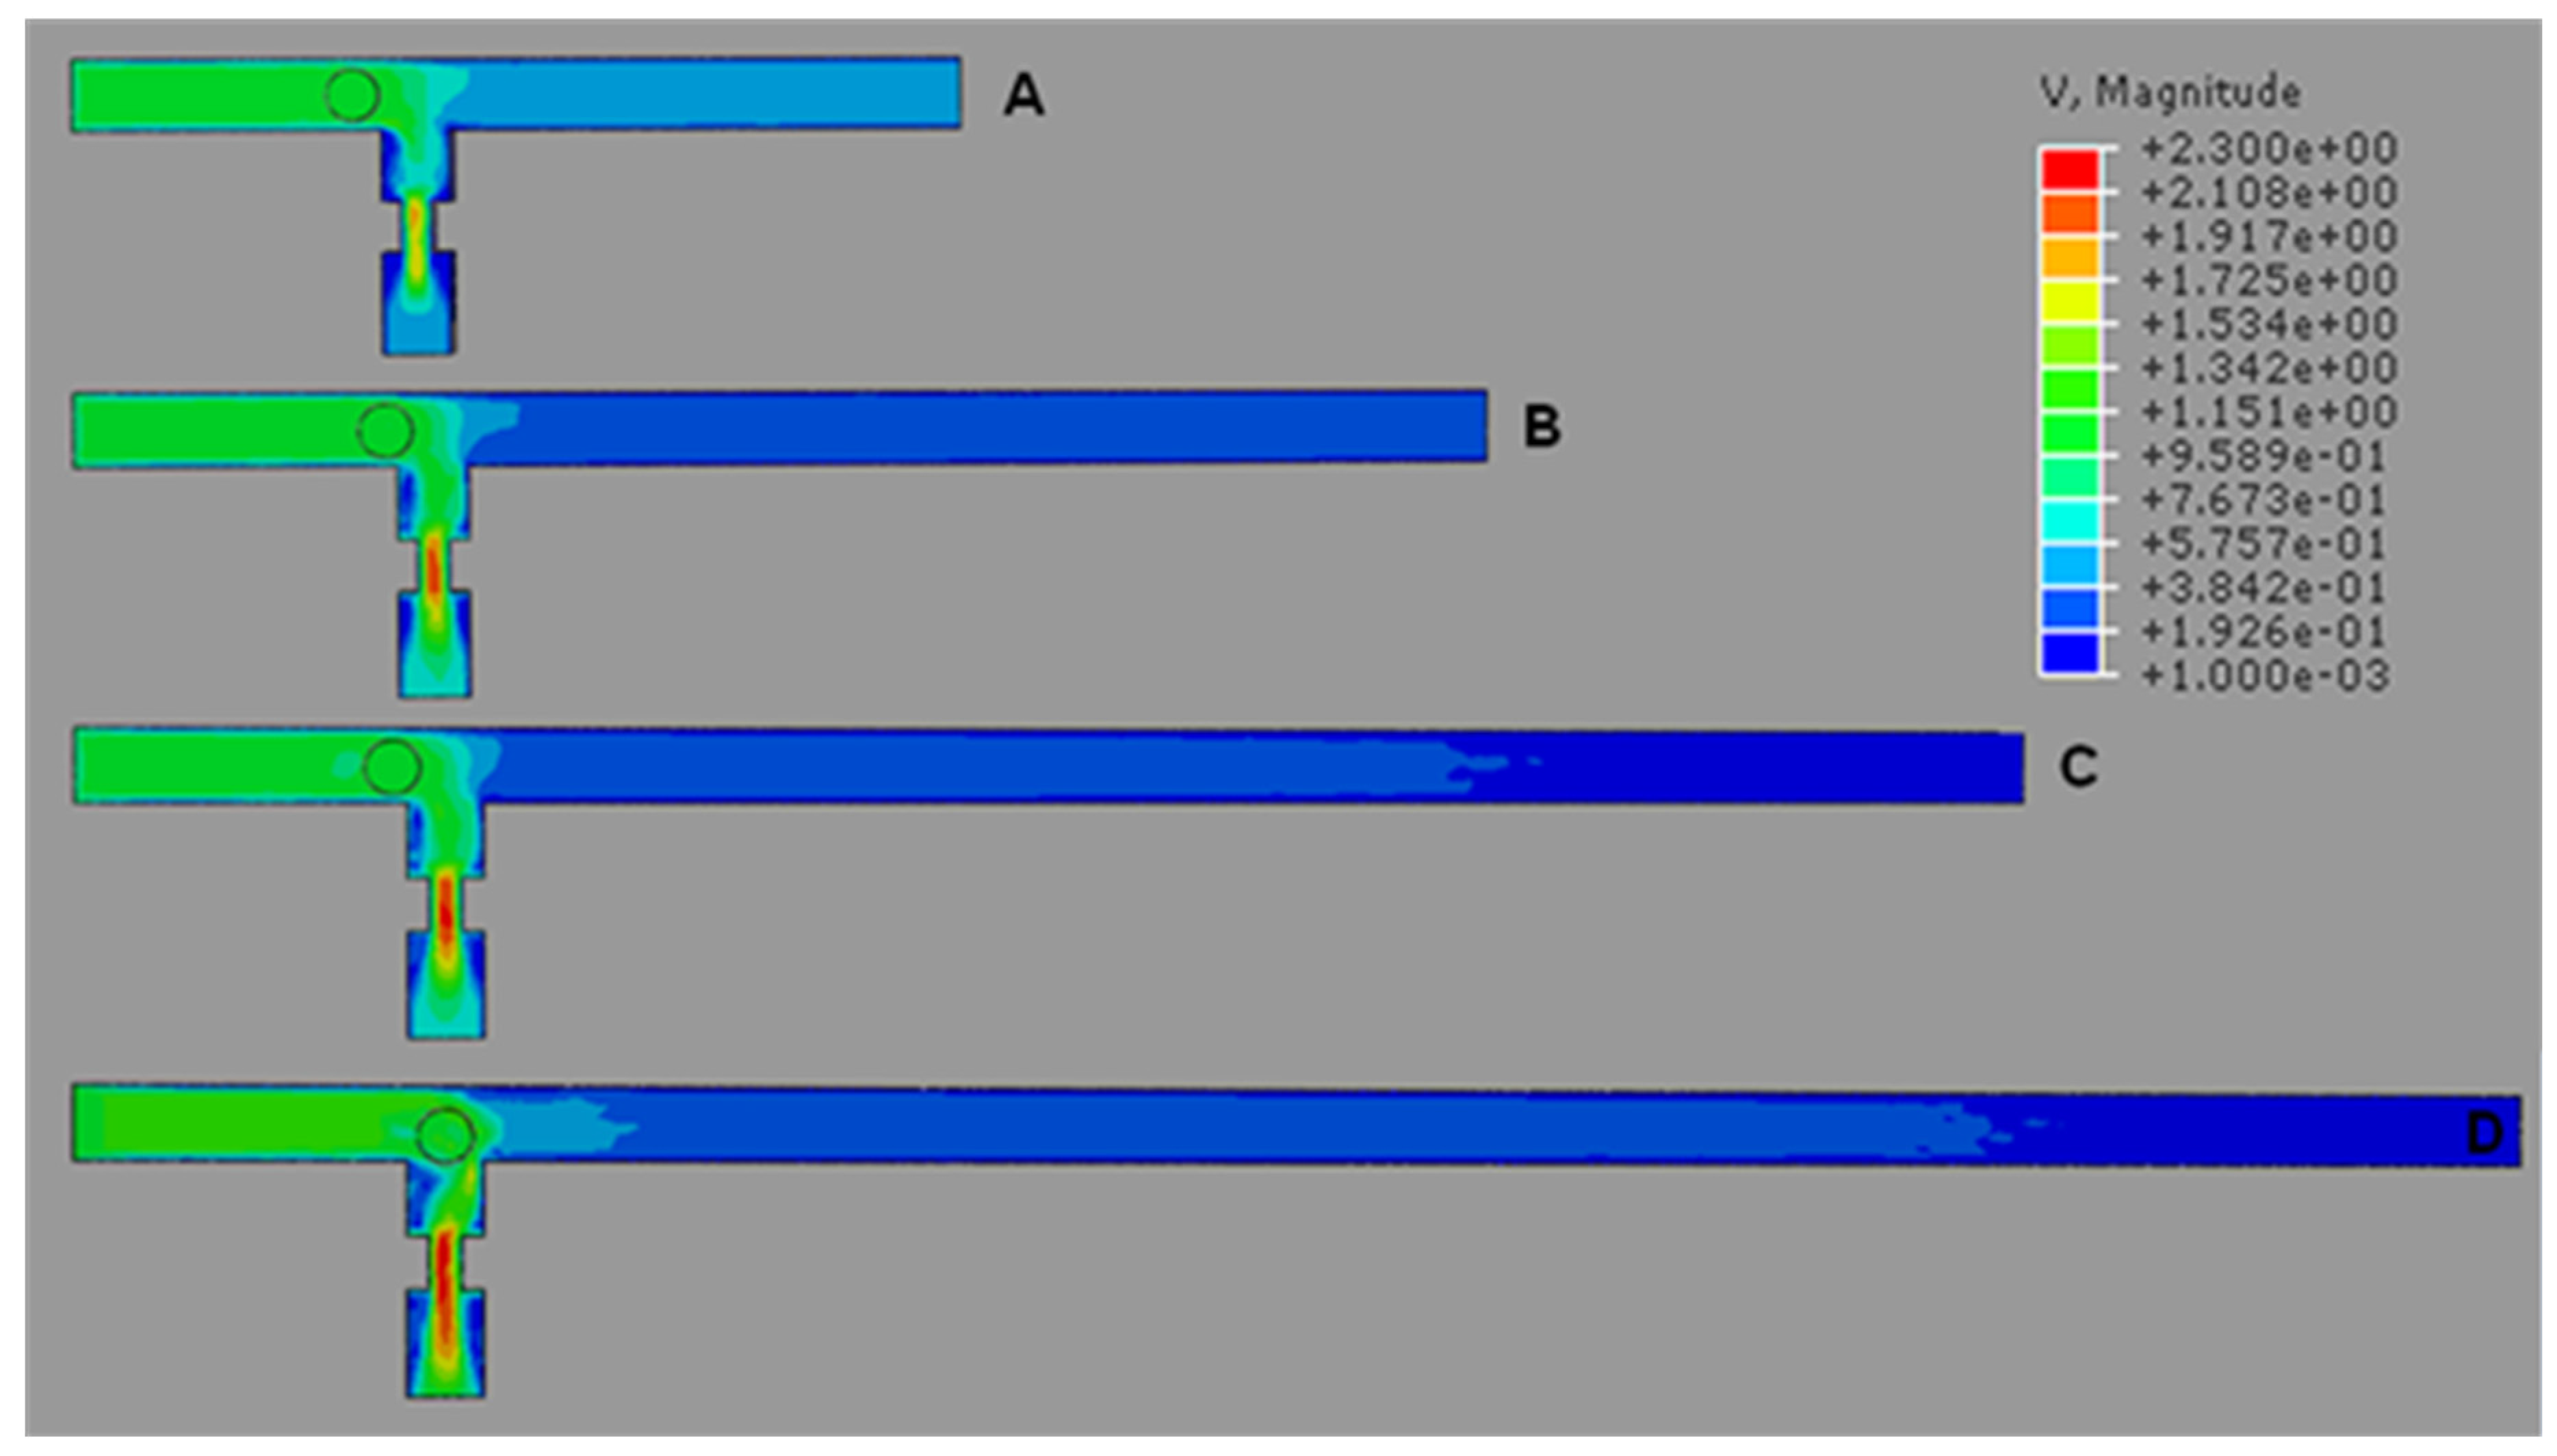
4.1. T-Channel Trapping Ability


4.2. Effects of Different RhMain/RhTrap Ratio and WHole


| WHole/RhMain/RhTrap Ratio | 1.0 µm | 1.5 µm | 2.0 µm | 2.5 µm | 3.0 µm | 3.5 µm | 4.0 µm | 4.5 µm | 5.0 µm |
|---|---|---|---|---|---|---|---|---|---|
| 0.5 | no | no | no | no | no | no | no | no | no |
| 1.0 | no | no | no | no | no | no | no | no | no |
| 1.5 | no | no | no | no | yes | yes | yes | yes | yes |
| 2.0 | no | no | no | no | yes | yes | yes | yes | yes |
| 2.5 | no | no | no | no | yes | yes | yes | yes | yes |
| 3.0 | no | no | no | no | yes | yes | yes | yes | yes |
| 3.5 | no | no | no | no | yes | yes | yes | yes | yes |
| 4.0 | no | no | no | no | yes | yes | yes | yes | yes |
| 4.5 | no | no | no | no | yes | yes | yes | yes | yes |
| 5.0 | no | no | no | no | yes | yes | yes | yes | yes |
| 5.5 | no | no | no | no | yes | yes | yes | yes | yes |
| 6.0 | no | no | no | no | yes | yes | yes | yes | yes |
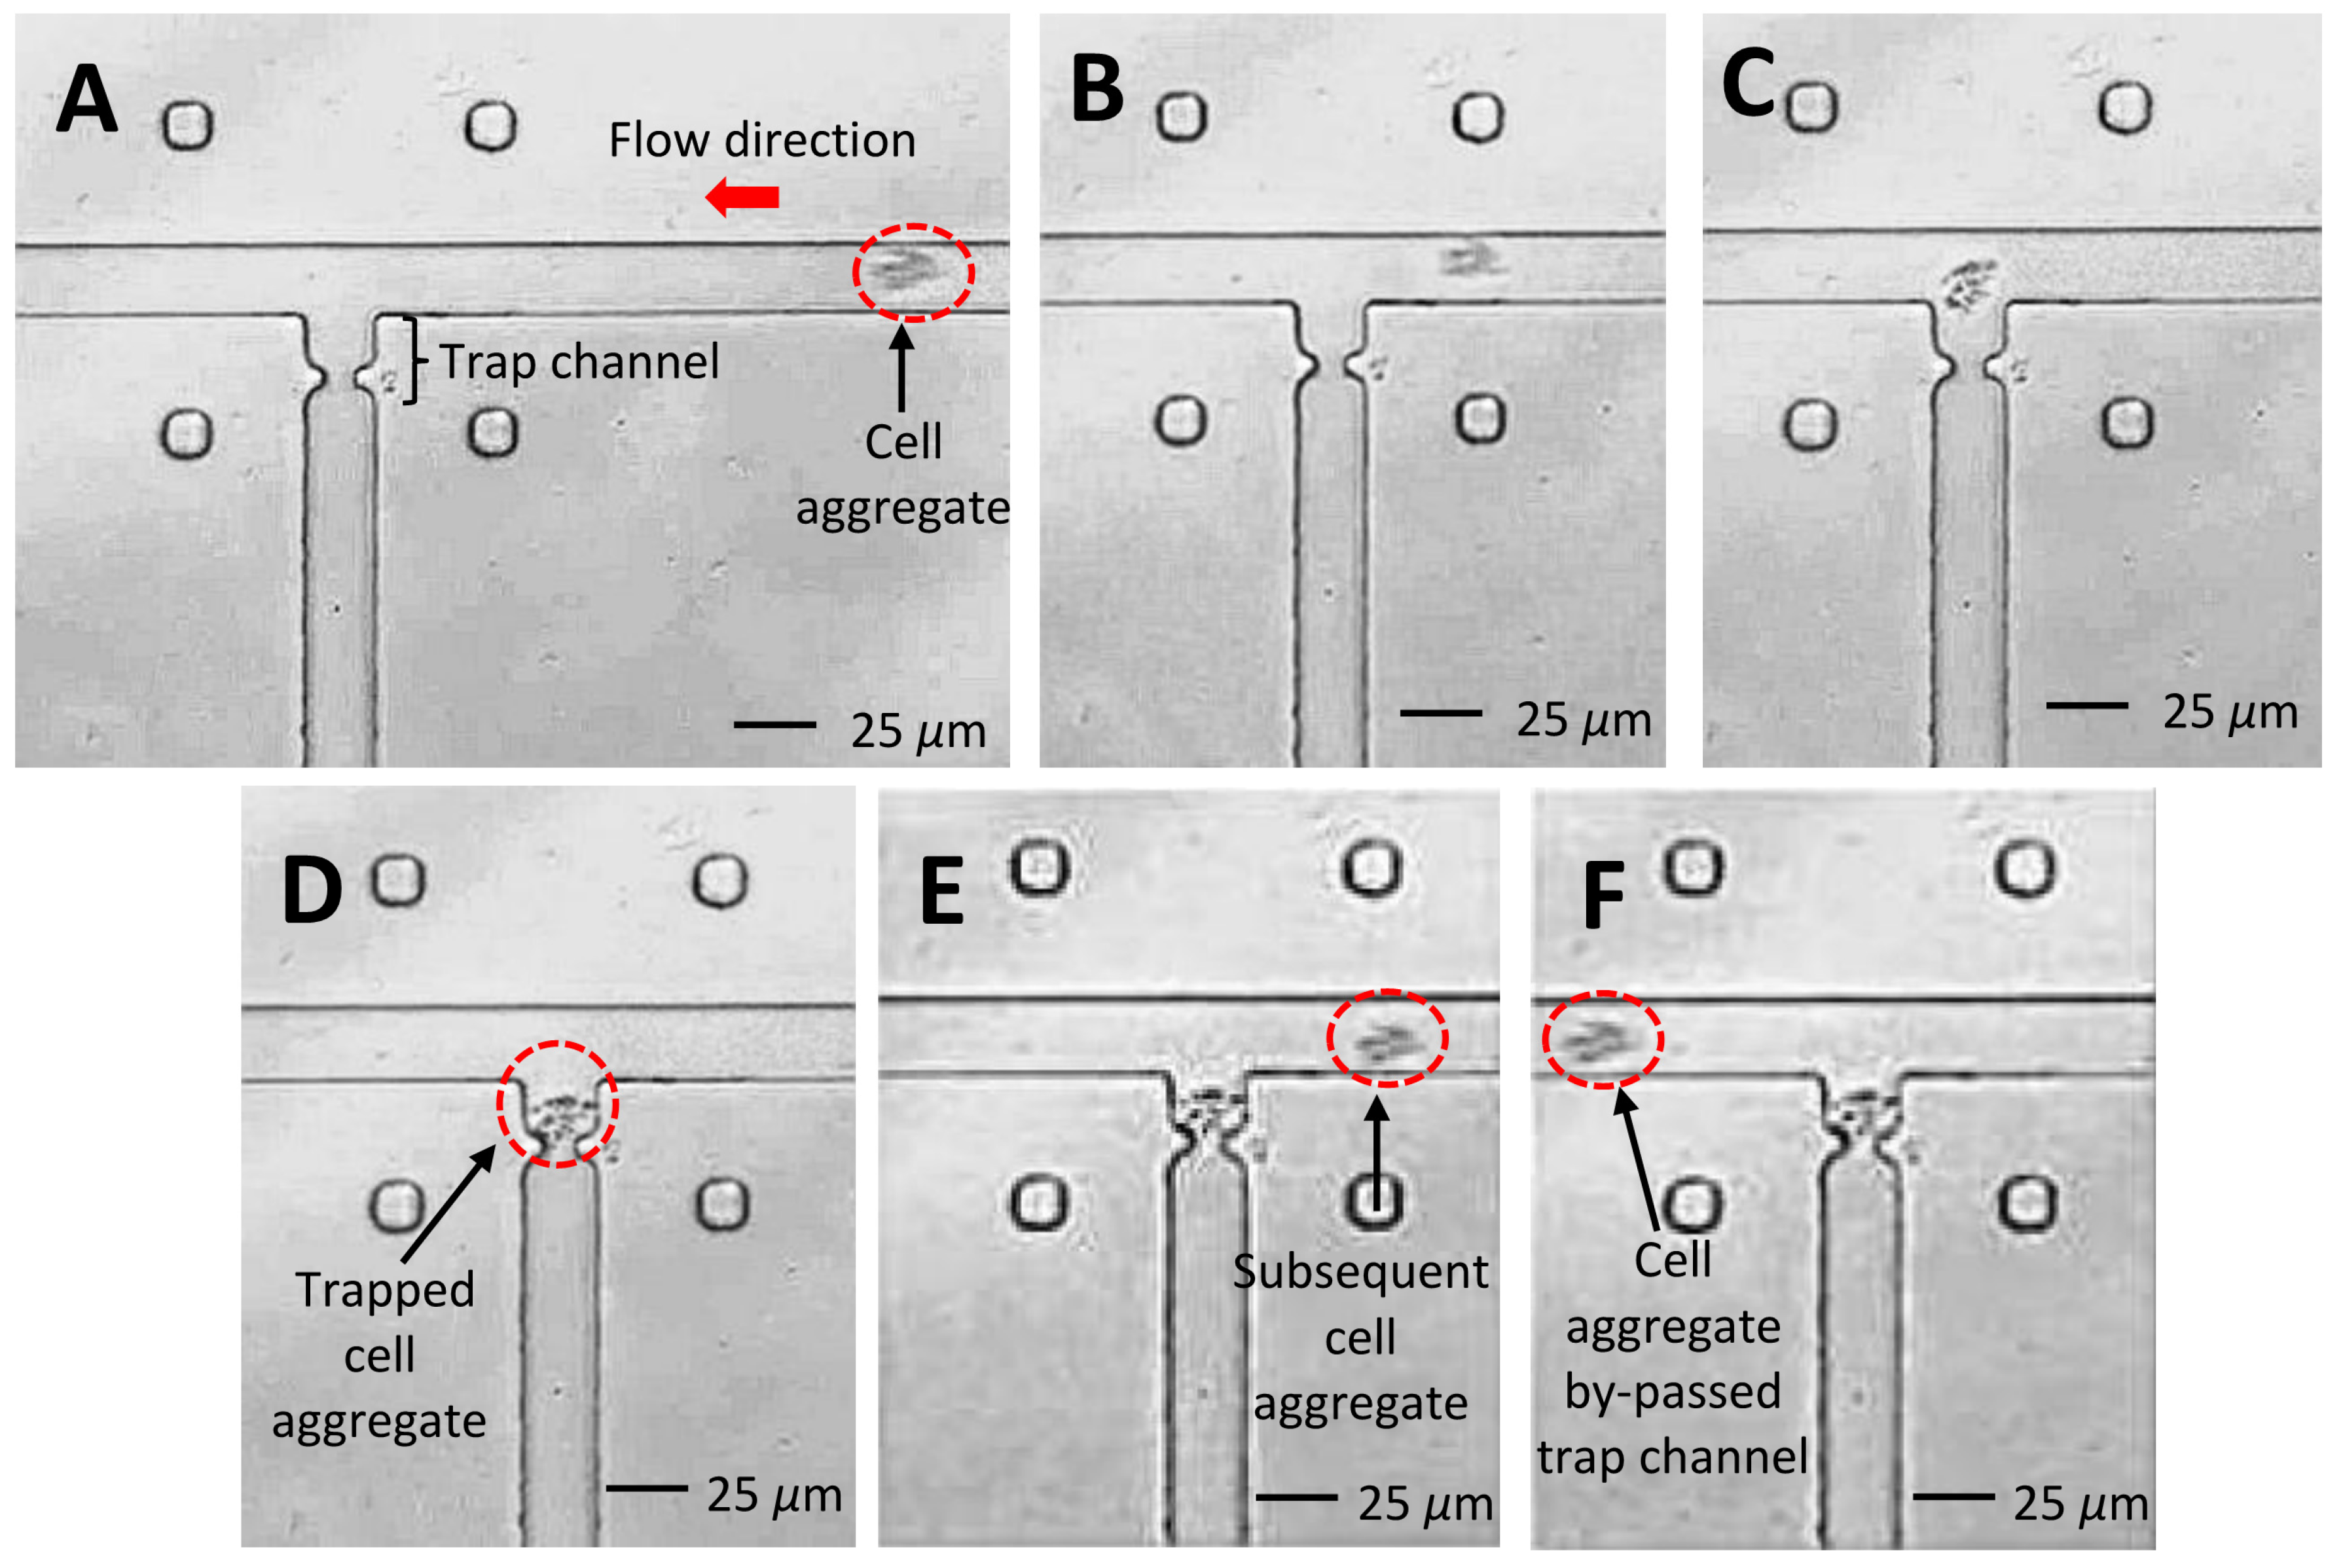
4.3. Experimental Verification

5. Conclusions
Acknowledgments
Author Contributions
Conflicts of Interest
References
- Hoffmann, C.S.; Cohnen, A.; Ludwig, T.; Watzl, C. 2B4 engagement mediates rapid LFA-1 and actin-dependent NK cell adhesion to tumor cells as measured by single cell force spectroscopy. J. Immunol. 2011, 186, 2757–2764. [Google Scholar] [CrossRef] [PubMed]
- Beaussart, A.; El-Kirat-Chatel, S.; Sullan, R.M.A.; Alsteens, D.; Herman, P.; Derclaye, S.; Dufrêne, F.Y. Quantifying the forces guiding microbial cell adhesion using single-cell force spectroscopy. Nat. Protoc. 2014, 9, 1049–1055. [Google Scholar] [CrossRef] [PubMed]
- Engel, A.; Gaub, E.H. Structure and mechanics of membrane proteins. Annu. Rev. Biochem. 2008, 77, 127–148. [Google Scholar] [CrossRef] [PubMed]
- Yang, S.-P.; Yang, C.-Y.; Lee, T.-M.; Lui, T.-S. Effects of calcium-phosphate topography on osteoblast mechanobiology determined using a cytodetacher. Mater. Sci. Eng. C 2012, 32, 254–262. [Google Scholar] [CrossRef]
- Muller, J.D. AFM: A Nanotool in Membrane Biology. Biochemistry 2008, 47, 7896–7898. [Google Scholar] [CrossRef] [PubMed]
- Khalili, A.A.; Ahmad, R.M. A review of cell adhesion studies for biomedical and biological applications. Int. J. Mol. Sci. 2015, 16, 18149–18184. [Google Scholar] [CrossRef] [PubMed]
- Palmer, C.P.; Mycielska, M.E.; Burcu, H.; Osman, K.; Collins, T.; Beckerman, R.; Perrett, R.; Johnson, H.; Aydar, E.; Djamgoz, M.B.A. Single cell adhesion measuring apparatus (SCAMA): Application to cancer cell lines of different metastatic potential and voltage-gated Na+ channel expression. Eur. Biophys. J. 2008, 37, 359–368. [Google Scholar] [CrossRef] [PubMed]
- Gao, Z.; Wang, S.; Zhu, H.; Su, C.; Xu, G.; Lian, X. Using selected uniform cells in round shape with a micropipette to measure cell adhesion strength on silk fibroin-based materials. Mater. Sci. Eng. C 2008, 28, 1227–1235. [Google Scholar] [CrossRef]
- Hochmuth, R.M. Micropipette aspiration of living cells. J. Biomech. 2000, 33, 15–22. [Google Scholar] [CrossRef]
- Gourier, C.; Jegou, A.; Husson, J.; Pincet, F. A nanospring named erythrocyte. The biomembrane force probe. Cell. Mol. Bioeng. 2008, 1, 263–275. [Google Scholar] [CrossRef]
- Evans, E.; Heinrich, V.; Leung, A.; Kinoshita, K. Nano- to microscale dynamics of P-selectin detachment from leukocyte interfaces. I. Membrane separation from the cytoskeleton. Biophys. J. 2005, 88, 2288–2298. [Google Scholar] [CrossRef] [PubMed]
- Castelain, M.; Rouxhet, P.G.; Pignon, F.; Magnin, A.; Piau, J.-M. Single-cell adhesion probed in-situ using optical tweezers: A case study with Saccharomyces cerevisiae. J. Appl. Phys. 2012, 111. [Google Scholar] [CrossRef]
- Schwingel, M.; Bastmeyer, M. Force mapping during the formation and maturation of cell adhesion sites with multiple optical tweezers. PLoS ONE 2013, 8. [Google Scholar] [CrossRef] [PubMed]
- Castelain, M.; Pignon, F.; Piau, J.-M.; Magnin, A. The initial single yeast cell adhesion on glass via optical trapping and Derjaguin-Landau-Verwey-Overbeek predictions. J. Chem. Phys. 2008, 128. [Google Scholar] [CrossRef] [PubMed]
- Chen, J.; Zheng, Y.; Tan, Q.; Zhang, Y.L.; Li, J.; Geddie, W.R.; Jewett, M.A.S.; Sun, Y. A microfluidic device for simultaneous electrical and mechanical measurements on single cells. Biomicrofluidics 2011, 5. [Google Scholar] [CrossRef] [PubMed]
- Mondal, D.; RoyChaudhuri, C.; Das, L.; Chatterjee, J. Microtrap electrode devices for single cell trapping and impedance measurement. Biomed. Microdevices 2012, 14, 955–964. [Google Scholar] [CrossRef] [PubMed]
- Gabriele, S.; Versaevel, M.; Preira, P.; Theodoly, O. A simple microfluidic method to select, isolate, and manipulate single-cells in mechanical and biochemical assays. Lab Chip 2010, 10, 1459–1467. [Google Scholar] [CrossRef] [PubMed]
- Forsyth, A.M.; Wan, J.; Ristenpart, W.D.; Stone, H.A. The dynamic behavior of chemically “stiffened” red blood cells in microchannel flows. Microvasc. Res. 2010, 80, 37–43. [Google Scholar] [CrossRef] [PubMed]
- Cho, Y.; Kim, H.S.; Bruno Frazier, A.; Chen, Z.G.; Shin, D.M.; Han, A. Whole-cell impedance analysis for highly and poorly metastatic cancer cells. J. Microelectromech. Syst. 2009, 18, 808–817. [Google Scholar]
- Lee, G.-H.; Kim, S.-H.; Kang, A.; Takayama, S.; Lee, S.-H.; Park, J.Y. Deformable L-shaped microwell array for trapping pairs of heterogeneous cells. J. Micromech. Microeng. 2015, 25. [Google Scholar] [CrossRef]
- Sun, T.; Kovac, J.; Voldman, J. Image-based single-cell sorting via dual-photopolymerized microwell arrays. Anal. Chem. 2014, 86, 977–981. [Google Scholar] [CrossRef] [PubMed]
- Rettig, J.R.; Folch, A. Large-scale single-cell trapping and imaging using microwell arrays. Anal. Chem. 2005, 77, 5628–5634. [Google Scholar] [CrossRef] [PubMed]
- Tang, J.; Peng, R.; Ding, J. The regulation of stem cell differentiation by cell-cell contact on micropatterned material surfaces. Biomaterials 2010, 31, 2470–2476. [Google Scholar] [CrossRef] [PubMed]
- Doh, J.; Kim, M.; Krummel, M.F. Cell-laden microwells for the study of multicellularity in lymphocyte fate decisions. Biomaterials 2010, 31, 3422–3428. [Google Scholar] [CrossRef] [PubMed]
- Chen, N.-C.; Chen, C.-H.; Chen, M.-K.; Jang, L.-S.; Wang, M.-H. Single-cell trapping and impedance measurement utilizing dielectrophoresis in a parallel-plate microfluidic device. Sens. Actuators B Chem. 2014, 190, 570–577. [Google Scholar] [CrossRef]
- Sen, M.; Ino, K.; Ramon-Azcon, J.; Shiku, H.; Matsue, T. Cell pairing using a dielectrophoresis-based device with interdigitated array electrodes. Lab Chip 2013, 13, 3650–3652. [Google Scholar] [CrossRef] [PubMed]
- Voldman, J.; Gray, M.L.; Toner, M.; Schmidt, M.A. A microfabrication-based dynamic array cytometer. Anal. Chem. 2002, 74, 3984–3990. [Google Scholar] [CrossRef] [PubMed]
- Thomas, R.S.; Morgan, H.; Green, N.G. Negative DEP traps for single cell immobilisation. Lab Chip 2009, 9, 1534–1540. [Google Scholar] [CrossRef]
- Gray, D.S.; Tan, J.L.; Voldman, J.; Chen, C.S. Dielectrophoretic registration of living cells to a microelectrode array. Biosens. Bioelectron. 2004, 19, 771–780. [Google Scholar] [CrossRef] [PubMed]
- Chen, Y.-C.; Allen, S.G.; Ingram, P.N.; Buckanovich, R.; Merajver, S.D.; Yoon, E. Single-cell migration chip for chemotaxis-based microfluidic selection of heterogeneous cell populations. Sci. Rep. 2015, 5, 1–13. [Google Scholar] [CrossRef] [PubMed]
- Jin, D.; Deng, B.; Li, J.X.; Cai, W.; Tu, L.; Chen, J.; Wu, Q.; Wang, W.H. A microfluidic device enabling high-efficiency single cell trapping. Biomicrofluidics 2015, 9. [Google Scholar] [CrossRef] [PubMed]
- Benavente-Babace, A.; Gallego-Pérez, D.; Hansford, D.J.; Arana, S.; Pérez-Lorenzo, E.; Mujika, M. Single-cell trapping and selective treatment via co-flow within a microfluidic platform. Biosens. Bioelectron. 2014, 61, 298–305. [Google Scholar] [CrossRef] [PubMed]
- Kim, J.; Erath, J.; Rodriguez, A.; Yang, C. A high-efficiency microfluidic device for size-selective trapping and sorting. Lab Chip 2014, 14, 2480–2490. [Google Scholar] [CrossRef] [PubMed]
- Lee, P.J.; Hung, P.J.; Shaw, R.; Jan, L.; Lee, L.P. Microfluidic application-specific integrated device for monitoring direct cell-cell communication via gap junctions between individual cell pairs. Appl. Phys. Lett. 2005, 86. [Google Scholar] [CrossRef]
- Frimat, J.-P.; Becker, M.; Chiang, Y.-Y.; Marggraf, U.; Janasek, D.; Hengstler, J.G.; Franzke, J.; West, J. A microfluidic array with cellular valving for single cell co-culture. Lab Chip 2011, 11, 231–237. [Google Scholar] [CrossRef] [PubMed]
- Kim, H.; Lee, S.; Kim, J. Hydrodynamic trap-and-release of single particles using dual-function elastomeric valves: design, fabrication, characterization. Microfluid. Nanofluid. 2012, 13, 835–844. [Google Scholar] [CrossRef]
- Arakawa, T.; Noguchi, M.; Sumitomo, K.; Yamaguchi, Y.; Shoji, S. High-throughput single-cell manipulation system for a large number of target cells. Biomicrofluidics 2011, 5. [Google Scholar] [CrossRef] [PubMed]
- Kobel, S.; Valero, A.; Latt, J.; Renaud, P.; Lutolf, M. Optimization of microfluidic single cell trapping for long-term on-chip culture. Lab Chip 2010, 10, 857–863. [Google Scholar] [CrossRef] [PubMed]
- Hong, S.; Pan, Q.; Lee, L.P. Single-cell level co-culture platform for intercellular communication. Integr. Biol. 2012, 4, 374–380. [Google Scholar] [CrossRef] [PubMed]
- Shi, W.; Qin, J.; Ye, N.; Lin, B. Droplet-based microfluidic system for individual Caenorhabditis elegans assay. Lab Chip 2008, 8, 1432–1435. [Google Scholar] [CrossRef] [PubMed]
- Di Carlo, D.; Aghdam, N.; Lee, L.P. Single-cell enzyme concentrations, kinetics, and inhibition analysis using high-density hydrodynamic cell isolation arrays. Anal. Chem. 2006, 78, 4925–4930. [Google Scholar] [CrossRef] [PubMed]
- Skelley, A.M.; Kirak, O.; Suh, H.; Jaenisch, R.; Voldman, J. Microfluidic control of cell pairing and fusion. Nat. Meth. 2009, 6, 147–152. [Google Scholar] [CrossRef] [PubMed]
- Di Carlo, D.; Wu, L.Y.; Lee, L.P. Dynamic single cell culture array. Lab Chip 2006, 6, 1445–1449. [Google Scholar] [CrossRef] [PubMed]
- Tan, W.-H.; Takeuchi, S. A trap-and-release integrated microfluidic system for dynamic microarray applications. Proc. Natl. Acad. Sci. USA 2007, 104, 1146–1151. [Google Scholar] [CrossRef] [PubMed]
- Chung, K.; Rivet, C.A.; Kemp, M.L.; Lu, H.; States, U. Imaging single-cell signaling dynamics with a deterministic high-density single-cell trap array. Anal. Chem. 2011, 83, 7044–7052. [Google Scholar] [CrossRef] [PubMed]
- Jin, H.-J.; Cho, Y.-H.; Gu, J.-M.; Kim, J.; Oh, Y.-S. A multicellular spheroid formation and extraction chip using removable cell trapping barriers. Lab Chip 2011, 11, 115–119. [Google Scholar] [CrossRef] [PubMed]
- Kangsun, L.; Choong, K.; Jae, Y.Y.; Hun, L.; Byungwook, A.; Linfeng, X.; Ji, Y.K.; Oh, K.W. Gravity-oriented microfluidic device for uniform and massive cell spheroid formation. Biomicrofluidics 2012, 6, 14114–141147. [Google Scholar]
- Li, X.; Valadez, A.V.; Zuo, P.; Nie, Z. Microfluidic 3D cell culture: potential application for tissue-based bioassays. Bioanalysis 2012, 4, 1509–1525. [Google Scholar] [CrossRef] [PubMed]
- Teshima, T.; Ishihara, H.; Iwai, K.; Adachi, A.; Takeuchi, S. A dynamic microarray device for paired bead-based analysis. Lab Chip 2010, 10, 2443–2448. [Google Scholar] [CrossRef] [PubMed]
- Kumano, I.; Hosoda, K.; Suzuki, H.; Hirata, K.; Yomo, T. Hydrodynamic trapping of Tetrahymena thermophila for the long-term monitoring of cell behaviors. Lab Chip 2012, 12, 3451–3457. [Google Scholar] [CrossRef] [PubMed]
- Gervais, T.; El-Ali, J.; Günther, A.; Jensen, K.F. Flow-induced deformation of shallow microfluidic channels. Lab Chip 2006, 6, 500–507. [Google Scholar] [CrossRef] [PubMed]
- Smith, A.E.; Zhang, Z.; Thomas, C.R.; Moxham, K.E.; Middelberg, A.P. The mechanical properties of saccharomyces cerevisiae. Proc. Natl. Acad. Sci. USA 2000, 97, 9871–9874. [Google Scholar] [CrossRef] [PubMed]
- Bryan, A.K.; Goranov, A.; Amon, A.; Manalis, S.R. Measurement of mass, density, and volume during the cell cycle of yeast. Proc. Natl. Acad. Sci. USA 2010, 107, 999–1004. [Google Scholar] [CrossRef] [PubMed]
- Stenson, J.D.; Thomas, C.R.; Hartley, P. Modelling the mechanical properties of yeast cells. Chem. Eng. Sci. 2009, 64, 1892–1903. [Google Scholar] [CrossRef]
- Stenson, J.D.; Hartley, P.; Wang, C.; Thomas, C.R. Determining the mechanical properties of yeast cell walls. Biotechnol. Prog. 2011, 27, 505–512. [Google Scholar] [CrossRef] [PubMed]
- Burg, T.P.; Godin, M.; Knudsen, S.M.; Shen, W.; Carlson, G.; Foster, J.S.; Babcock, K.; Manalis, S.R. Weighing of biomolecules, single cells and single nanoparticles in fluid. Nature 2007, 446, 1066–1069. [Google Scholar] [CrossRef] [PubMed]
- Lee, J.; Chunara, R.; Shen, W.; Payer, K.; Babcock, K.; Burg, T.P.; Manalis, S.R. Suspended microchannel resonators with piezoresistive sensors. Lab Chip 2011, 11, 645–651. [Google Scholar] [CrossRef] [PubMed]
- Khalili, A.A.; Ahmad, M.R. Numerical analysis of hydrodynamic flow in microfluidic biochip for single-cell trapping application. Int. J. Mol. Sci. 2015, 16, 26770–26785. [Google Scholar] [CrossRef] [PubMed]
- Khalili, A.A.; Basri, M.A.M.; Ahmad, M.R. Simulation of single cell trapping via hydrodynamic manipulation. J. Teknol. 2014, 69, 121–126. [Google Scholar]
© 2016 by the authors; licensee MDPI, Basel, Switzerland. This article is an open access article distributed under the terms and conditions of the Creative Commons by Attribution (CC-BY) license (http://creativecommons.org/licenses/by/4.0/).
Share and Cite
Ahmad Khalili, A.; Ahmad, M.R.; Takeuchi, M.; Nakajima, M.; Hasegawa, Y.; Mohamed Zulkifli, R. A Microfluidic Device for Hydrodynamic Trapping and Manipulation Platform of a Single Biological Cell. Appl. Sci. 2016, 6, 40. https://doi.org/10.3390/app6020040
Ahmad Khalili A, Ahmad MR, Takeuchi M, Nakajima M, Hasegawa Y, Mohamed Zulkifli R. A Microfluidic Device for Hydrodynamic Trapping and Manipulation Platform of a Single Biological Cell. Applied Sciences. 2016; 6(2):40. https://doi.org/10.3390/app6020040
Chicago/Turabian StyleAhmad Khalili, Amelia, Mohd Ridzuan Ahmad, Masaru Takeuchi, Masahiro Nakajima, Yasuhisa Hasegawa, and Razauden Mohamed Zulkifli. 2016. "A Microfluidic Device for Hydrodynamic Trapping and Manipulation Platform of a Single Biological Cell" Applied Sciences 6, no. 2: 40. https://doi.org/10.3390/app6020040