Computational Methodology for Knocking Combustion Analysis in Compression-Ignited Advanced Concepts


CMT-Motores Térmicos, Universitat Politècnica de València, Camino de Vera s/n, 46022 Valencia, Spain
*
Author to whom correspondence should be addressed.
Appl. Sci. 2018, 8(10), 1707; https://doi.org/10.3390/app8101707
Submission received: 5 September 2018
/
Revised: 16 September 2018
/
Accepted: 17 September 2018
/
Published: 20 September 2018
(This article belongs to the Special Issue Direct Injection Reciprocating Internal Combustion Engines)
Abstract
:In the present work, a numerical methodology based on three-dimensional (3D) computational fluid dynamics (CFD) was developed to predict knock in a 2-Stroke engine operating with gasoline Partially Premixed Combustion (PPC) concept. Single-cycle Unsteady Reynolds-Averaged Navier Stokes (URANS) simulations using the renormalization group (RNG) model were performed in parallel while the initial conditions are accordingly perturbed in order to imitate the variability in the in-cylinder conditions due to engine operation. Results showed a good agreement between experiment and CFD simulation with respect to cycle-averaged and deviation of the ignition timing, combustion phasing, peak pressure magnitude and location. Moreover, the numerical method was also demonstrated to be capable of predicting knock features, such as maximum pressure rise rate and knock intensity, with good accuracy. Finally, the CFD solution allowed to give more insight about in-cylinder processes that lead to the knocking combustion and its subsequent effects.
1. Introduction
The automotive industry is currently confronted with the hard challenge of achieving a compromise between performance and sustainability [1]. Most research efforts are focused on further developing spark-ignited (SI) engines and the exploration of new advanced combustion modes due to their advantages in terms of pollutant emissions [2]. In both concepts, knocking combustion is a major drawback to achieving higher thermal efficiency.
The overall tendency to knock is highly dependent on engine operating conditions as well as other aspects such as fuel anti-knock properties or combustion chamber design. It is, therefore, critical to gain a better understanding of knock generation mechanisms in order to develop robust knock mitigation strategies.
Owing to the clear propensity to generate extremely high burning rates, Low Temperature Combustion (LTC) concepts such HCCI (Homogeneous Charge Compression Ignition) [3,4], PCCI (Premixed Charge Compression Ignition) [5,6] or PPC (Partially Premixed Combustion) [7,8] could mean a significant improvement [9]. However, the extreme thermodynamic conditions achieved inside the combustion chamber due to the higher compression ratios and boosting pressures increase the knock propensity, thereby being an important constraint for their application to commercial vehicles.
In particular, PPC operated with low reacting fuels, such as gasoline, have shown encouraging results to achieve very low pollutant emissions while maintaining, or even improving, the thermal efficiency [10,11,12]. Indeed, this combustion concept operated in an innovative 2-Stroke high speed direct injection (HSDI) compression-ignited (CI) engine [13] offers a good flexibility to control the combustion timing and to extent the load range [14,15,16].
This concept operates between completely premixed and fully diffusive conditions, whereby low pollutant emissions may be attained. However, to achieve these conditions while retaining an accurate combustion timing control with the injection event remains as the main drawback of this particular system when operating under transient conditions.
Despite the attractive benefits of this engine system, its complexity due to the large number of parameters to be managed requires the use of optimization techniques which ensure greater flexibility, speed and lower costs than purely experimental procedures.
In this framework, the use of computational fluid dynamics (CFD) simulations is nowadays widely established in both the research community and the automotive industry. Here, aspects such as the simulation of turbulence and how it couples with the chemistry [17] are still the main limiting factors for reproducing the reacting flow field accurately. Since the requirements in both fields tend to differ, specially in terms of time available, the approaches used are also usually different. While in the industry sector, simulations are based on Unsteady Reynolds-averaged Navier–Stokes (URANS) turbulence modelling [18,19] and flamelet-based combustion models [20] owing its lower computational demands, the research community prefer to resort to high-fidelity combustion models and more complex turbulence schemes such as Large Eddy Simulations (LES) [21] or Direct Numerical Simulations (DNS) [22].
Although the industry standard tends to simplify the simulations as much as possible, reproducing only the most pertinent phenomena while dismissing the irrelevant ones, it is not always possible to meet all requirements in complex situations where there is no clearly dominant phenomenon. For instance, knocking combustion in SI engines appears as result of a particular situation in which local thermodynamic conditions are critical. In this context, the recreation of the in-cylinder temperature field (hot-spots, chamber inhomogeneities, etc.), turbulence field (flow velocity and at the spark plug) and species distribution (EGR, fuel injection, etc.) is determinant for the knock [9] and CCV prediction.
Misdariis et al. [23] has proven the suitability of multi-cycle LES and dual heat transfer to reproduce the cycle-to-cycle pressure variations (CCV) under knocking-like conditions [24]. However, requirements in terms of mesh resolution and runtime are prohibitive for practical applications. Furthermore, reproducing pressure effects of knock—local pressure oscillations—is extremely demanding [25,26,27], further compromising its application to the industry environment.
The main objective of this paper is therefore to develop and validate a robust knock simulation methodology based on 3D CFD modelling that allow to include knock systematically in the design process of future automotive engines. In order to achieve this target, several simplifications should be applied. For example, resorting to single-cycle simulations, using URANS turbulence schemes, perturbing the initial conditions and other strategies based on the experimental observation.
This paper is organised as follows. First, the engine and test cell specifications are briefly described. Then, the methodology is widely explained, along with the details of the CFD model. Subsequently, results from the validation are presented and discussed. A detailed analysis of the knock onset is also included hindsight. Finally, the paper concludes with a summary of the main findings.
2. Experimental Set-Up
The experimental facility already detailed in previous studies [28,29] was used to obtain the required data for the CFD model validation. Since the engine specifications and test cell features are widely described in the literature, only a brief description of them are included in this paper. Nonetheless, full details about the experimental facility can be found in the following documents [16,30].
A research version of a 2-stroke HSDI CI engine was used as baseline engine. The main specifications of the engine and the injector configuration are summarized in Table 1.
The control of the poppet valves relies on a hydraulic cam-driven Variable Valve Timing (VVT) system that allows to modify the opening/closing valve timings. Thanks to its flexibility to adjust the overlap among intake and exhaust periods, and the effective compression-expansion ratios, this system ensures an adequate in-cylinder flow pattern and optimizes the scavenging of burnt gases by reducing the short-circuit losses.
The equipped fuel injection system grants a maximum rail pressure of 110 MPa when operates with RON95 gasoline fuel. This is a prototype Delphi injection system which comes from a common-rail DFI 1.5 system.
The engine was installed in a completely instrumented test cell which supplies all required fluids for the engine operation through multiple auxiliary devices. The installation have independent water and oil cooling circuits and a low EGR system to supply arbitrary levels of cooled exhaust gas in any operating condition.
The in-cylinder pressure was measured with a Kistler 6061B pressure transducer flush-mounted between the intake and exhaust valves. A different piezo-resistive pressure sensor located at the cylinder liner close to Bottom Dead Center (BDC) was used to reference this pressure signal. Instantaneous signals, such as in-cylinder pressure, were sampled using a state-of-the-art acquisition system and recorded during 100 engine cycles for each operation condition.
3. Numerical Methodology
The main limiting aspect of traditional methodologies for the validation of CI engines operation, which are based on reproducing the in-cylinder pressure profile averaged from a given number of recorded cycles using simple turbulence schemes (URANS), is the incapacity to assess the cyclical deviation and its subsequent effects on combustion.
The use of more complex turbulence approaches (LES) and the simulation of several consecutive cycles is currently the standard approach to reproduce the CCV in spark-ignited (SI) engines [31,32] in which the combustion variability due to the larger turbulent scales is traditionally considered as the main cause of the cycle-to-cycle variation [33]. However, the huge increase of computational burden hardly compromises the application of LES modelling in most of the industry cases. Furthermore, it is not clear that pure stochastic fluctuations could explain the whole variation of flow conditions among consecutive cycles in gasoline PPC mode.
Available literature on CCV [34] claims that CCV observed in CI engines is mostly originated from the casuistic variability in fuel mass or trapped-gas conditions, rather than from arising in random variations in the turbulent flow and combustion process.
Therefore, other authors [35,36] employed URANS schemes to analyse CCV sources in several LTC strategies, where CCV is larger than in conventional Diesel engines but still far from SI engines. They investigated the cyclical dispersion from the point of view of the operation uncertainties. The basis of their approach is to perform many parallel URANS simulations in which one or more key operating conditions are perturbed about the reference conditions.
Here, a methodology based on this latter approach was used in an attempt of reproducing the experimental CCV and its effects on the combustion. Therefore, conditions at the intake valves closing (IVC) of a baseline cycle simulated were considered as the reference. These conditions, after being validated to ensure realistic in-cylinder conditions, were artificially modified in order to imitate the variation of the injected fuel, trapped mass, injection timing, etc.
The selection of those parameters that significantly affect the combustion was made by taking into account the conclusions obtained by Klos and Kokjohn [35] to reduce the number of parallel simulations as much as possible. Klos and Kokjohn found clear relationships among the dispersion of three operating parameters (EGR, mean gas temperature at IVC and fuel mass) and the combustion behaviour. Thus, these parameters and their recommended variations were utilized for modifying IVC baseline conditions.
Nonetheless, an additional parameter must be considered in this study since the 2-stroke engine has a particular in-cylinder flow motion. While in traditional CI engines the swirl flow motion is clearly dominant, the tumble motion—characteristic of SI engines—prevails in this particular engine design. As reported by Vermorel et al. [31], the tumble intensity significantly changes among consecutive cycles. They observed from LES simulations data that the magnitude of this rotational velocity could vary up to 25% at IVC. Therefore, this parameter was also included together with the other three determined by Klos. The parameters and their maximum variations used to perturb baseline conditions are displayed in Table 2. Note that EGR value was replaced by the percentage of combustion products within the cylinder at IVC, this is an equivalent parameter that define the amount of inert gases available during the closed-cycle.
In addition to the baseline simulated case, ten parallel closed-cycle simulations were performed whereas the initial conditions at IVC were accordingly perturbed by randomly distributed variations of these four parameters to sample the four-dimensional domain.
This procedure was applied to the operation condition detailed in Table 3. This is defined by a medium speed (1500 rpm) and medium-high engine load (1.04 MPa of indicated mean effective pressure) that shows moderate levels of knock.
Numerical Model Set-Up
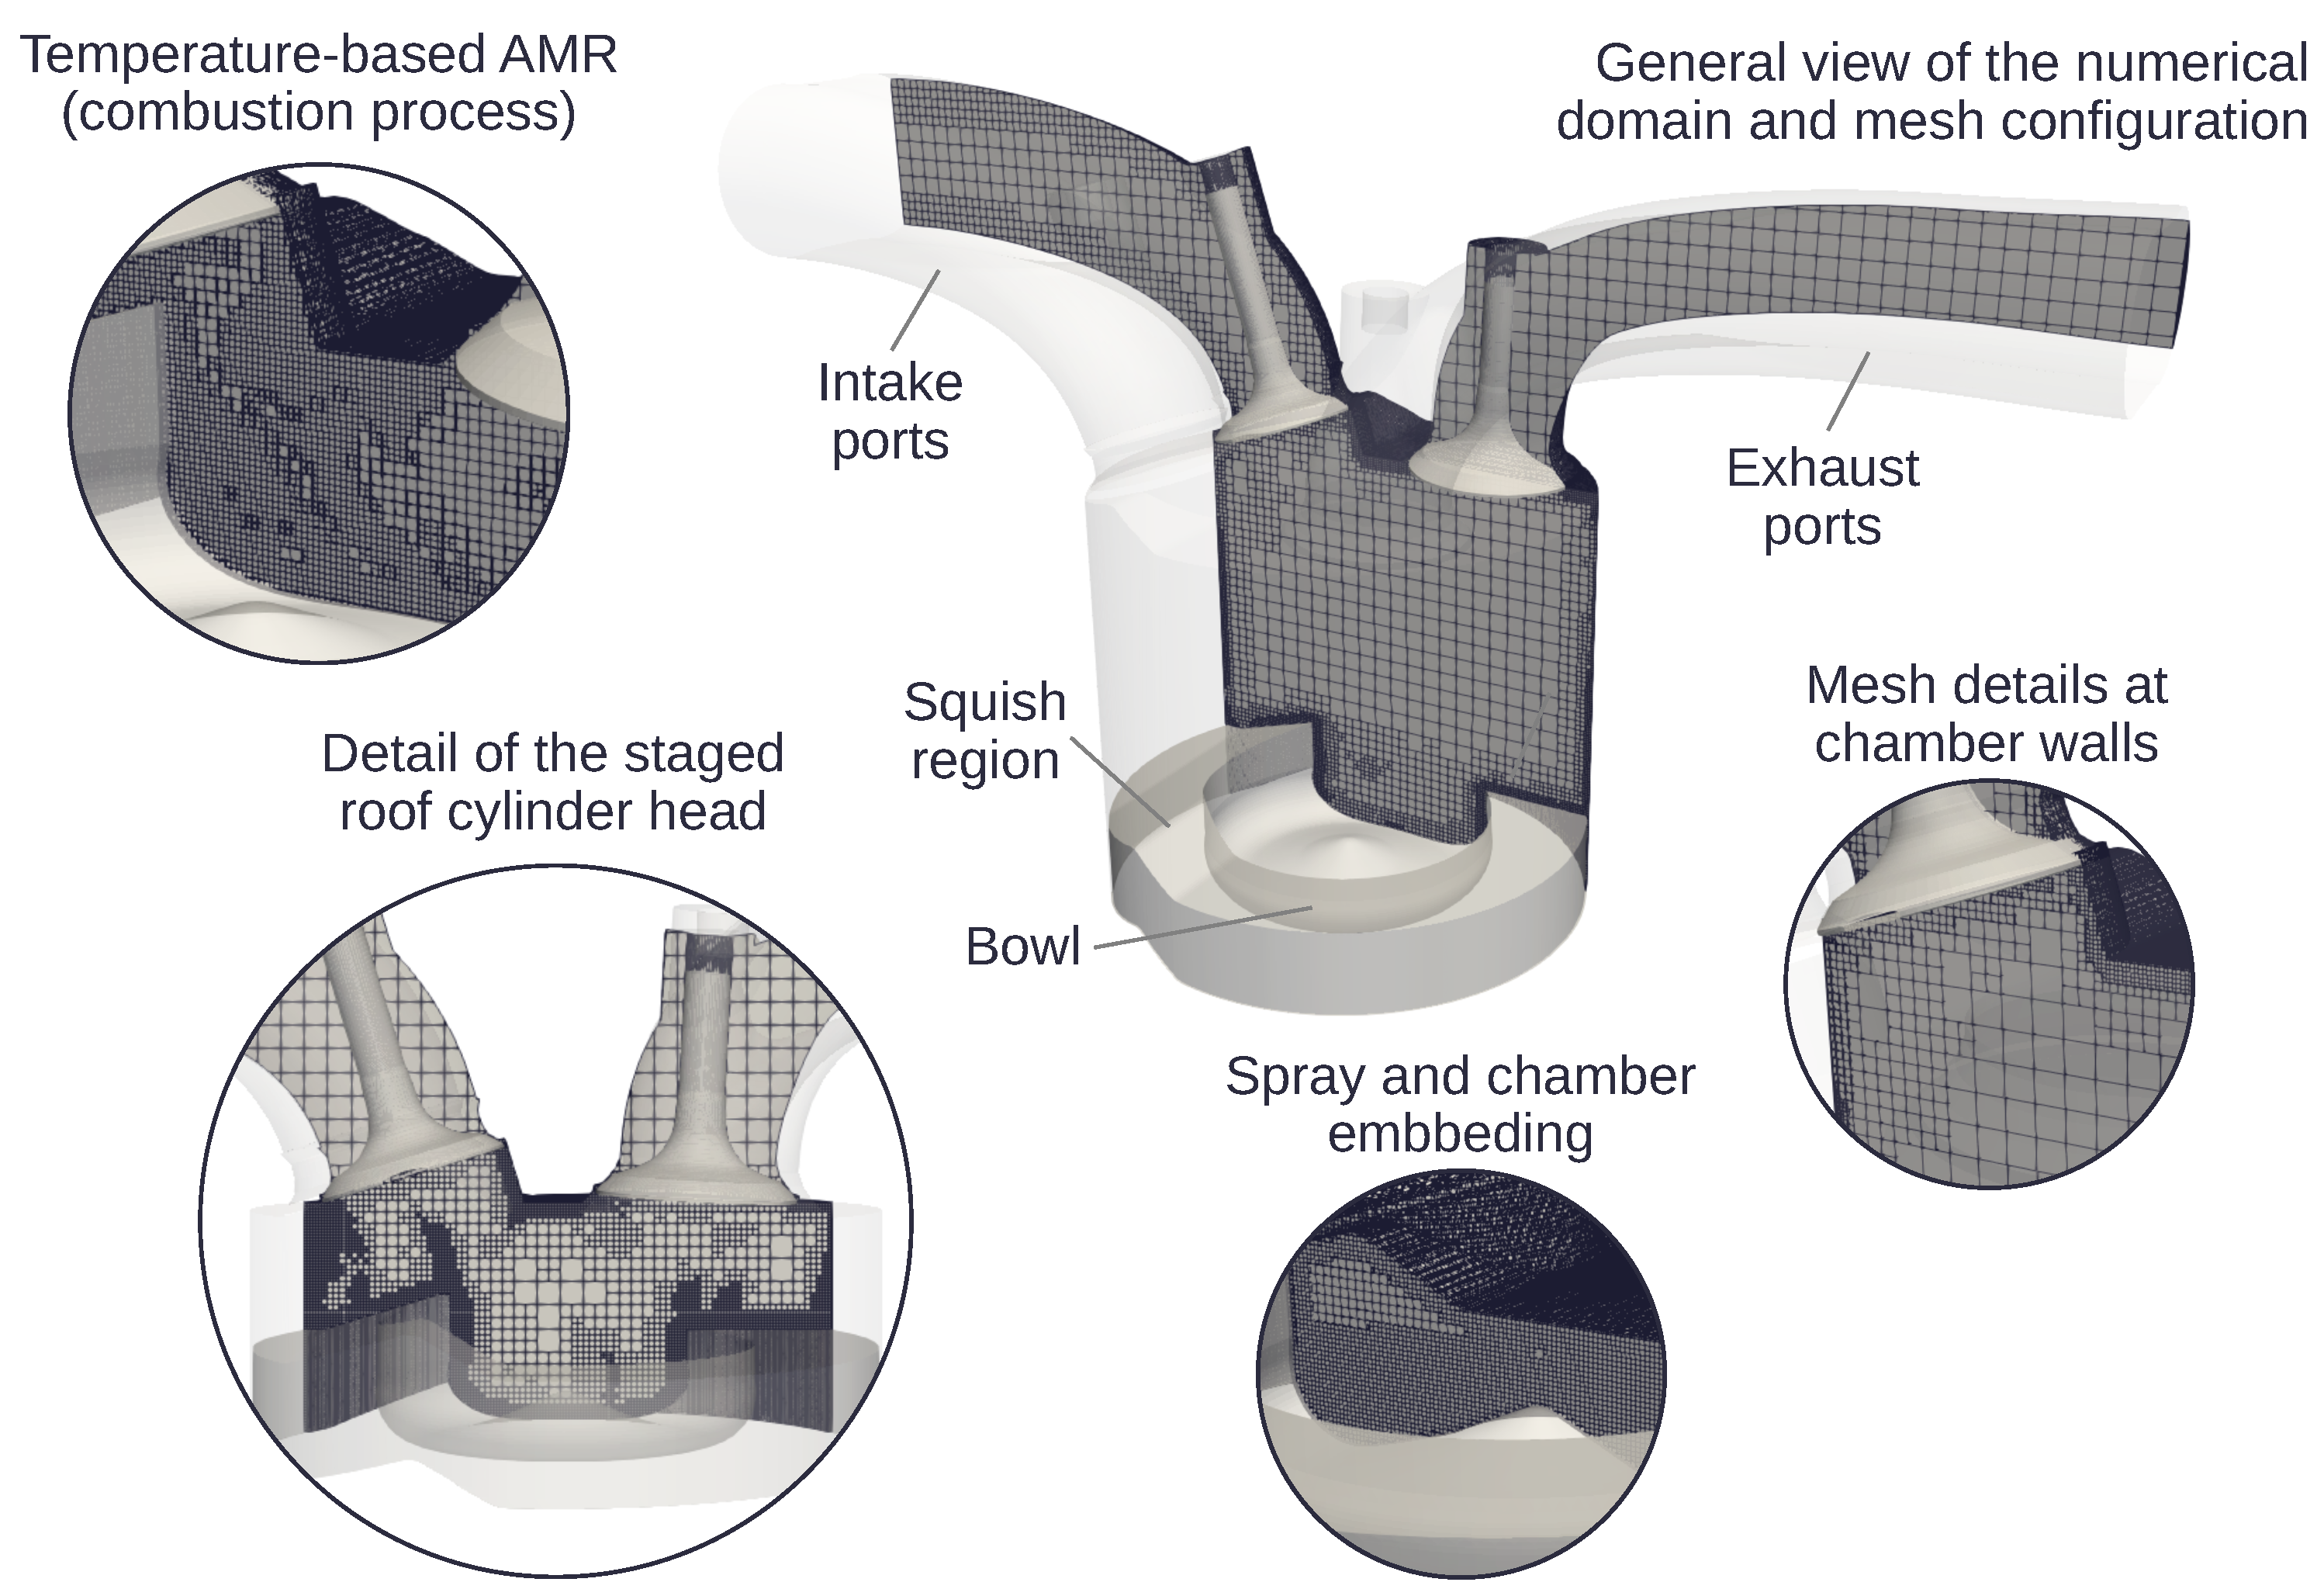
The numerical model of the engine was developed using the commercial CFD code CONVERGE [37]. The numerical domain, as shown in Figure 1, included the complete single cylinder geometry and the intake/exhaust ports, allowing to perform complete cycle simulations.
The mesh discretization was done using the cut-cell Cartesian method available in the code. The base mesh size was 3 mm throughout the domain in the reference grid configuration. Three levels of fixed embedding (0.375 mm of cell size) were added to the walls of the combustion chamber, ports and region near the fuel injector, to improve boundary layer prediction and the accuracy of spray atomization, droplet breakup/coalescence, etc. Mesh size in the chamber was reduced by two levels of embedding (0.75 mm of cell size) after the start of combustion, for an improved recreation of the interaction and reflection of the pressure waves while avoiding undesired spatial aliasing effects. The code also employed adaptive mesh refinement (AMR) to increase grid resolution by three levels of additional refinement (up to 0.375 mm minimum cell size) based on the velocity and temperature sub-grid scales of 1 ms−1 and 2.5 K, respectively. As a result, the total number of cells varied between 1.5 million at BDC and 0.5 million at Top Dead Centre (TDC). This mesh configuration was achieved after a grid sensitivity analysis [27], offering a grid-independent solution when simulating combustion and its produced unsteady pressure field in internal combustion engines.
The Mach Courant-Friedrich-Lewy was set to 1.0 during the combustion in order to properly capture the local pressure oscillations caused by combustion. Thereby, the calculation time-step was gathered between 0.05 and 0.5 s. This value was also obtained from the previously referred work performed by Torregrosa et al. [27], whose demonstrated that the energy of the unsteady pressure field is highly sensitive to CFL Mach number, but also that the energy does not change when this parameter is close to or below one.
The renormalization group (RNG) URANS model [18] coupled with the heat transfer approach proposed by Angelberger et al. [38] was chosen for simulating the turbulent properties of the flow.
For combustion modelling, the SAGE detailed chemistry solver [39] was employed along with a multi-zone (MZ) approach, with bins of 5 K in temperature and 0.05 in equivalence ratio [40]. This combustion model, despite not using an explicit turbulent combustion closure [17], has demonstrated to perform well for simulating spray combustion under URANS schemes in previous works [41]. A reduced chemical kinetic mechanism for primary reference fuels (PRF) based on Brakora et al. [42] was used in this work to account for fuel chemistry. A blend of 5% n-heptane and 95% iso-octane was utilized for predicting the physical properties of the gasoline fuel, being a suitable surrogate for predicting the ignition features of the RON95 gasoline used in experiments. Activating iso-octane reactions, the chemical mechanism resulted in a 45 species and 152 reactions.
Coupled with appropriate turbulence models, Kodavasal et al. [43] demonstrated that a similar combustion approach allows an accurate reproduction of gasoline autoignition, while other researchers [29,44] established realistic rates of heat release under gasoline compression-ignited conditions.
The fuel injection was described by the standard Discrete Droplet Model (DDM) [45] and Kelvin Helmholtz (KH)–Rayleigh Taylor (RT) breakup model was employed to model spray atomization [46]. The injection rate was determined from the experimental injector characterization. This process measures the mass flow rate and spray momentum flux in a specific test rig [47,48] for the injection configurations defined a priori in similar real test conditions, in order to provide the most realistic injection features.
Cylinder wall temperatures were assumed to be constant and estimated using a lumped heat transfer model [49]. The instantaneous pressure signals registered at intake/exhaust manifolds were used to fix the inflow/outflow boundaries located at the end of the intake/exhaust ports. The temperature at these boundaries was considered constant and equal to the time-averaged value registered at the same manifolds.
4. Results and Discussion
In this section, results from the application of the proposed methodology are presented an discussed. First, the validity of the numerical solution is verified. Then, the knocking combustion is visualized and further analysed using several visualization techniques.
4.1. Validation
Following the guidelines depicted during the methodology description in Section 3, a unique engine cycle was calculated and validated prior to run the multiple parallel executions with the modified initial conditions. The target of this preliminary step is to obtain a numerical solution that reproduces the mean behaviour of the experiments.
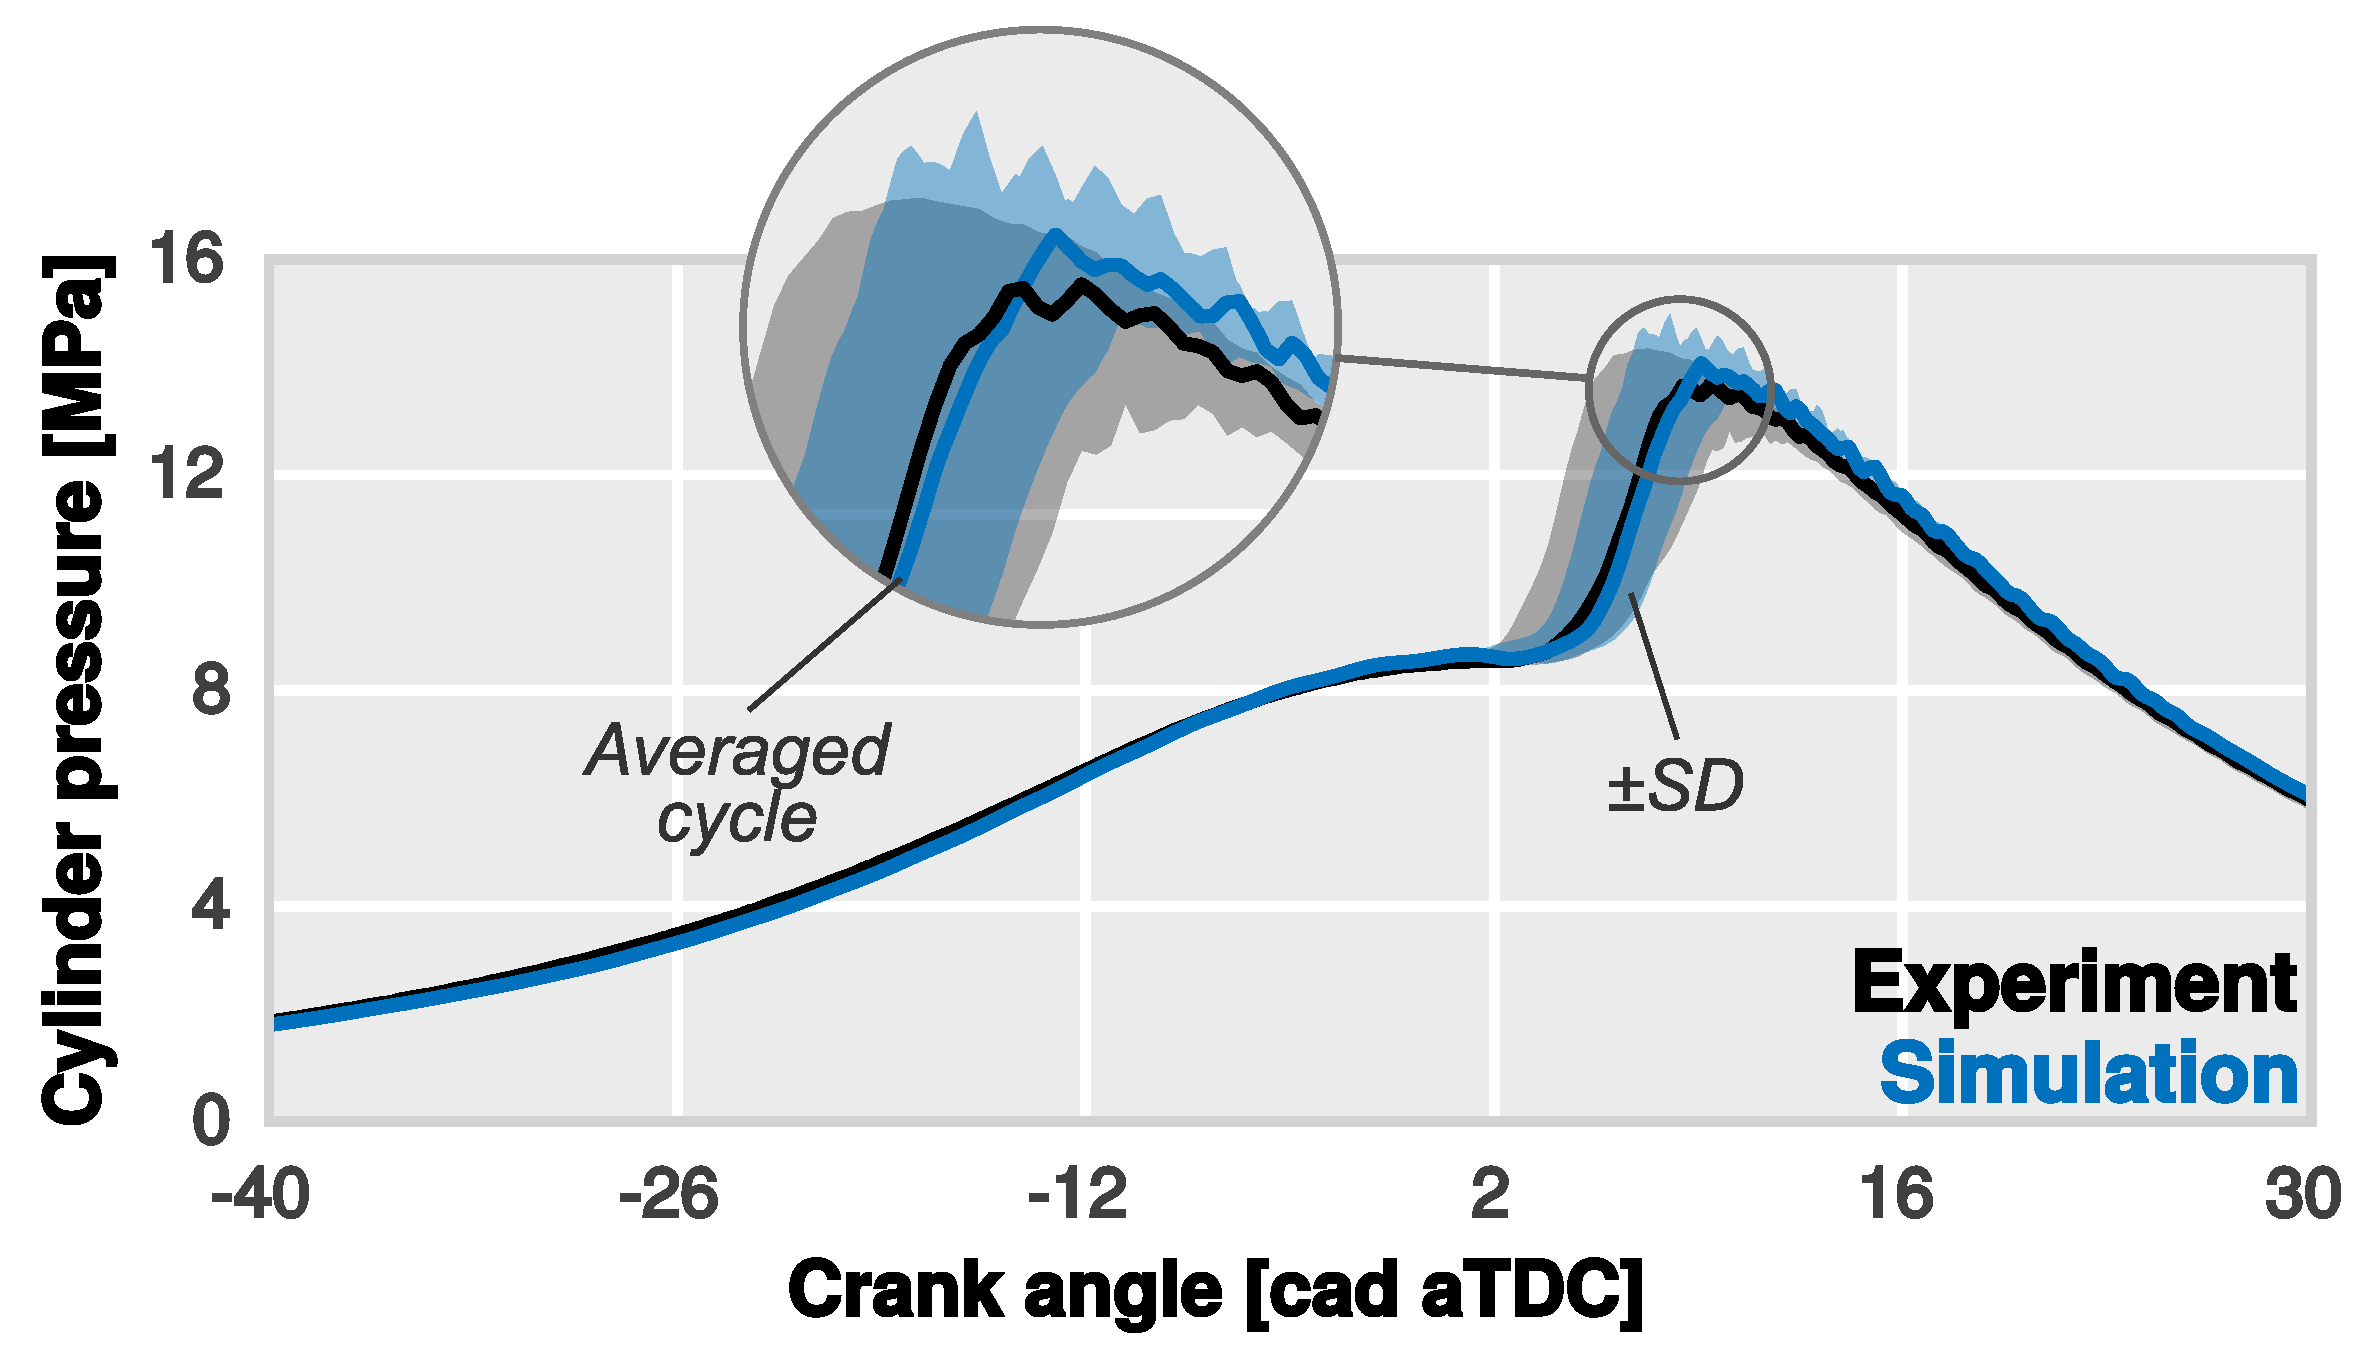
In this way, experimental and simulated cylinder pressure profiles of the baseline simulation are compared in Figure 2. As it can be seen, the CFD model correctly predicts the in-cylinder pressure. Indeed, the predicted pressure shows a similar deviation as measurements dispersion. Although RoHR traces show that the combustion phasing is slightly delayed and its peak value is minimally overestimated, they do not affect the maximum peak pressure in a significant way. Given that the calculation of this parameter depends on material deformations and blow-by losses that the model does not take into account, this effect may be attributed to a minor underestimation of the effective compression ratio.
Once that the baseline simulation can be considered representative of the real operating conditions, ten parallel executions were performed with randomly distributed variations of the IVC conditions. In Figure 3, the same comparison previously done in Figure 2 can be seen but including now the CCV spread of this latter simulations. As can be seen from the graph, the standard deviation of simulations is similar to that observed in the measurements proving the validity of the methodology in this particular case of study.
However, the interest of the analysis is not only to check the performance of the methodology to reproduce a realistic CCV but also to examine the effects of this variability on the traditional combustion/knock parameters. In order to accomplish this target, the maximum pressure rise rate and the Maximum Amplitude Pressure Oscillation (MAPO) are plotted at each measured and simulated engine cycle in Figure 4. The standard deviation is also included to evaluate the capability of the methodology to reproduce CCV effects. Again, comparable results were obtained in terms of mean and dispersion levels for both parameters.
4.2. Knocking Combustion Visualization
After the validation of the methodology, an analysis of the knock onset is performed in this section. The study is conducted for two extreme knocking cases. On the one hand, the simulated cycle number 8, highlighted in Figure 4, is selected as the upper limit since it exhibit the higher MAPO value. And, on the other hand, cycle number 9 is chosen as the lower limit, being the cycle with the slightest knock.
A series of snapshots were conscientiously chosen and plotted together in Figure 5 for studding the combustion process. They were specifically selected considering different stages of combustion to allow a proper visualization of the endgas auto-ignition.
In this figure, the combustion tracking is done by clipping the temperature field at 2000 K and colouring it by the fuel energy release, thus showing the location of the reaction zones. Besides, pressure profiles registered at the transducer position are included to distinguish at which cycle step is located each snapshot while allowing to relate the combustion with its corresponding pressure effects [51,52].
As can be seen in both sequences of snapshots, combustion starts spontaneously as a result of a first auto-ignition event located inside the piston bowl where local temperature and mixing conditions are more favourable. Then, the combustion rapidly progresses by consuming the charge located within the bowl. At this point, the pressure rise due to combustion compresses the unburned gases at the squish region, causing the appearance of additional hot spots as a result of a second auto-ignition event. Looking at the colour scale, the rate of energy released by these hot spots is very localized and noticeably greater than that released during the previous combustion phase.
Examination of the pressure profiles also reveals that the onset of these hot spots coincides with the instant at which pressure oscillations become apparent, showing again that this abnormal combustion event has many similarities with the traditional knocking combustion in SI engines. Furthermore, it is possible to see that the knock intensity decreases as combustion is shifted towards the expansion stroke.
Besides the visualization of the combustion progress, Figure 5 shows a comparison between two cycles with heavy and slight knocking conditions. It is clear from this figure that, while the ignition is produced 2 cad after TDC in the cycle with heavy knock, combustion is delayed almost 2 cad in the slight knock cycle. Moreover, the burning rate is significantly higher in the former case since temperature iso-volumes grow faster. Thereby, the endgas auto-ignition is produced closer to the TDC, contributing to increase the pressure rise and its associated local oscillations to a greater extent. However, despite these differences, it is important to note that spatial patterns are quite similar at the knock onset.
5. Conclusions
In view of the challenges to manage the gasoline partially premixed combustion in compression-ignited engines, this paper proposes a numerical approach based on multi-dimensional CFD in order to improve the knowledge and understanding of this particular combustion concept. In particular, the presented methodology was specifically developed to capture knocking combustion, allowing an comprehensive analysis of all involved phenomena and their undesired effects.
The proposed methodology allows a realistic estimation of both the cycle-averaged and dispersion values of the main combustion/knock metrics while keeping the computational burden under reasonable values. Thereby it offers the chance to include these parameters in the design process, optimizing them altogether with the rest of relevant emissions and performance metrics.
Combining distinct visualization methods, such as iso-surfaces of temperature and energy release contours, allowed to identify the differences in the combustion process among two extreme cycles, thereby enhancing the understanding the knock phenomenon.
Results revealed that the propensity of the knock onset is reduced as the combustion is delayed towards the expansion stroke. In this sense, cycles with lower burning rates lead to a slight knocking combustion whereas high burning speed cycles tends to significantly increase the knock.
Nonetheless, further efforts must be taken to confirm, through LES simulations, that URANS is capturing all relevant phenomena in the knocking combustion. Moreover, further analysis should be done for providing more insight about the combustion process itself and its related knocking generation mechanisms.
Author Contributions
All authors discussed and agreed on the contents of the manuscript. R.N. managed the work defining the objectives of the proposed methodology, guiding the technical discussion of the results and contributing to the critical review of the manuscript. J.G.-S. conducted the research tasks and leaded the investigation process; developed the methodology, performed the simulations, analysed the results and wrote the initial draft. P.J.M.-H. contributed to the manuscript preparation and presentation. J.R.S. discussed the results, contributed to the manuscript review and provided technical guidance in the design of methodology.
Funding
The work has been partially supported by the Spanish Ministerio de Economía y Competitividad through grant number TRA2016-79185-R. The equipment used in this work has been partially supported by FEDER project funds “Dotación de infraestructuras científico técnicas para el Centro Integral de Mejora Energética y Medioambiental de Sistemas de Transporte (CiMeT), (FEDER-ICTS-2012-06)” from the operational program of unique scientific and technical infrastructure of the Spanish Ministerio de Economía y Competitividad. In addition, J. Gomez-Soriano is partially supported by an FPI contract (FPI-S2-2016-1353) of the “Programa de Apoyo para la Investigación y Desarrollo (PAID-01-16)” of the Universitat Politècnica de València.
Acknowledgments
The authors want to express their gratitude to CONVERGENT SCIENCE Inc. and Convergent Science GmbH for their kind support for the CFD calculations with the CONVERGE software.
Conflicts of Interest
The authors declare no conflict of interest. The founding sponsors had no role in the design of the study; in the collection, analyses or interpretation of data; in the writing of the manuscript; nor in the decision to publish the results.
Abbreviations
The following abbreviations are used in this manuscript:
| AMR | Adaptive Mesh Refinement |
| aTDC | after Top Dead Centre |
| BDC | Bottom Dead Centre |
| cad | Crank Angle Degree |
| CCV | Cycle-to-Cycle Variation |
| CFD | Computational Fluid Dynamics |
| CI | Compression-Ignited |
| DDM | Discrete Droplet Model |
| DI | Direct Injection |
| DNS | Direct Numerical Simulation |
| EGR | Exhaust Gas Recirculation |
| HCCI | Homogeneous Charge Compression Ignition |
| HSDI | High Speed Direct Injection |
| ICE | Internal Combustion Engine |
| IMEP | Indicated Mean Effective Pressure |
| IVC | Intake Valves Closing |
| KH | Kelvin-Helmholtz |
| LES | Large Eddy Simulation |
| LTC | Low Temperature Combustion |
| MAPO | Maximum Amplitude Pressure Oscillation |
| MZ | Multi-Zone |
| NOx | Nitrous Oxides (NO and NO2) |
| PCCI | Premixed Charge Compression Ignition |
| PPC | Partially Premixed Combustion |
| PRF | Primary Reference Fuel |
| RANS | Reynolds-averaged Navier–Stokes |
| RNG | Re-Normalized Group |
| RoHR | Rate of Heat Release |
| RON | Research Octane Number |
| RT | Rayleigh-Taylor |
| SAGE | Detailed Chemistry Solver |
| SD | Standard Deviation |
| SI | Spark-Ignited |
| SoEm | Start of Energizing of the Injector (main injection) |
| TDC | Top Dead Centre |
| URANS | Unsteady Reynolds-averaged Navier–Stokes |
| VVT | Variable Valve Timing |
References
- Serrano, J.R. Imagining the Future of the Internal Combustion Engine for Ground Transport in the Current Context. Appl. Sci. 2017, 7, 1011. [Google Scholar] [CrossRef]
- Bermúdez, V.; Serrano, J.R.; Piqueras, P.; Sanchis, E.J. On the impact of particulate matter distribution on pressure drop of wall-flow particulate filters. Appl. Sci. 2017, 7, 234. [Google Scholar] [CrossRef]
- Takeda, Y.; Keiichi, N.; Keiichi, N. Emission Characteristics of Premixed Lean Diesel Combustion with Extremely Early Staged Fuel Injection; SAE Technical Paper; SAE: Warrendale, PA, USA, 1996. [Google Scholar] [CrossRef]
- Ryo, H.; Hiromichi, Y. HCCI Combustion in a DI Diesel Engine; SAE Technical Paper 2003-01-0745; SAE: Warrendale, PA, USA, 2003. [Google Scholar] [CrossRef]
- Torregrosa, A.J.; Broatch, A.; García, A.; Mónico, L.F. Sensitivity of combustion noise and NOx and soot emissions to pilot injection in PCCI Diesel engines. Appl. Energy 2013, 104, 149–157. [Google Scholar] [CrossRef] [Green Version]
- Torregrosa, A.J.; Broatch, A.; Novella, R.; Gomez-Soriano, J.; Mónico, L.F. Impact of gasoline and Diesel blends on combustion noise and pollutant emissions in Premixed Charge Compression Ignition engines. Energy 2017, 137, 58–68. [Google Scholar] [CrossRef]
- Boyarski, N.J.; Reitz, R.D. Premixed Compression Ignition (PCI) Combustion with Modeling-Generated Piston Bowl Geometry in a Diesel Engine. In Proceedings of the SAE 2006 World Congress & Exhibition, Detroit, MI, USA, 3 April 2006. [Google Scholar] [CrossRef]
- Okude, K.; Mori, K.; Shiino, S.; Moriya, T. Premixed Compression Ignition (PCI) Combustion for Simultaneous Reduction of NOx and Soot in Diesel Engine; SAE Technical Paper 2004-01-1907; SAE: Warrendale, PA, USA, 2004. [Google Scholar] [CrossRef]
- Wang, Z.; Liu, H.; Reitz, R.D. Knocking combustion in spark-ignition engines. Prog. Energy Combust. Sci. 2017, 61, 78–112. [Google Scholar] [CrossRef]
- Hanson, R.; Splitter, D.; Reitz, R. Operating a Heavy-Duty Direct-Injection Compression-Ignition Engine with Gasoline for Low Emissions; SAE Technical Paper 2009-01-1442; SAE: Warrendale, PA, USA, 2009. [Google Scholar] [CrossRef]
- Manente, V.; Johansson, B.; Tunestal, P.; Cannella, W. Effects of Different Type of Gasoline Fuels on Heavy Duty Partially Premixed Combustion. SAE Int. J. Engines 2009, 2, 71–88. [Google Scholar] [CrossRef]
- Lewander, M.; Johansson, B.; Tunestål, P. Investigation and Comparison of Multi Cylinder Partially Premixed Combustion Characteristics for Diesel and Gasoline Fuels; SAE Technical Paper 2011-01-1811; SAE: Warrendale, PA, USA, 2011. [Google Scholar] [CrossRef]
- Tribotte, P.; Ravet, F.; Dugue, V.; Obernesser, P.; Quechon, N.; Benajes, J.; Novella, R.; De Lima, D. Two Strokes Diesel Engine—Promising Solution to Reduce CO2 Emissions. Procedia 2012, 48, 2295–2314. [Google Scholar] [CrossRef]
- Laget, O.; Ternel, C.; Thiriot, J.; Charmasson, S.; Tribotté, P.; Vidal, F. Preliminary Design of a Two-Stroke Uniflow Diesel Engine for Passenger Car; SAE Technical Paper 2013-01-1719; SAE: Warrendale, PA, USA, 2013. [Google Scholar] [CrossRef]
- Benajes, J.; Novella, R.; De Lima, D.; Tribotté, P.; Quechon, N.; Obernesser, P.; Dugue, V. Analysis of the combustion process, pollutant emissions and efficiency of an innovative 2-stroke HSDI engine designed for automotive applications. Appl. Therm. Eng. 2013, 58, 181–193. [Google Scholar] [CrossRef] [Green Version]
- Benajes, J.; Molina, S.; Novella, R.; De Lima, D. Implementation of the Partially Premixed Combustion concept in a 2-stroke HSDI diesel engine fueled with gasoline. Appl. Energy 2014, 122, 94–111. [Google Scholar] [CrossRef] [Green Version]
- Pal, P.; Keum, S.; Im, H.G. Assessment of flamelet versus multi-zone combustion modeling approaches for stratified-charge compression ignition engines. Int. J. Engine Res. 2016, 17, 280–290. [Google Scholar] [CrossRef]
- Yakhot, V.; Orszag, S. Renormalization group analysis of turbulence. J. Sci. Comput. 1986, 1, 3–51. [Google Scholar] [CrossRef]
- Wilcox, D.C. Formulation of the k-w turbulence model revisited. AIAA J. 2008, 46, 2823–2838. [Google Scholar] [CrossRef]
- Chen, J.H.; Hawkes, E.R.; Sankaran, R.; Mason, S.D.; Im, H.G. Direct numerical simulation of ignition front propagation in a constant volume with temperature inhomogeneities: I. Fundamental analysis and diagnostics. Combust. Flame 2006, 145, 128–144. [Google Scholar] [CrossRef]
- Pope, S.B. Ten questions concerning the large-eddy simulation of turbulent flows. New J. Phys. 2004, 6, 35. [Google Scholar] [CrossRef]
- Pillai, A.L.; Kurose, R. Numerical investigation of combustion noise in an open turbulent spray flame. Appl. Acoust. 2018, 133, 16–27. [Google Scholar] [CrossRef]
- Misdariis, A.; Vermorel, O.; Poinsot, T. LES of knocking in engines using dual heat transfer and two-step reduced schemes. Combust. Flame 2015, 162, 4304–4312. [Google Scholar] [CrossRef] [Green Version]
- Broatch, A.; López, J.J.; García-Tíscar, J.; Gomez-Soriano, J. Experimental Analysis of Cyclical Dispersion in Compression-Ignited Versus Spark-Ignited Engines and Its Significance for Combustion Noise Numerical Modeling. J. Eng. Gas Turbines Power 2018, 140, 102808. [Google Scholar] [CrossRef]
- Pal, P.; Kolodziej, C.; Choi, S.; Broatch, A.; Gomez-Soriano, J.; Wu, Y.; Lu, T.; See, Y.C.; Som, S. Development of a Virtual CFR Engine Model for Knocking Combustion Analysis; SAE Technical Paper 2018-01-0187; SAE: Warrendale, PA, USA, 2018. [Google Scholar] [CrossRef]
- Broatch, A.; Novella, R.; Gomez-Soriano, J.; Pal, P.; Som, S. Numerical Methodology for Optimization of Compression-Ignited Engines Considering Combustion Noise Control; SAE Technical Paper 2018-01-0193; SAE: Warrendale, PA, USA, 2018. [Google Scholar] [CrossRef]
- Torregrosa, A.J.; Broatch, A.; Gil, A.; Gomez-Soriano, J. Numerical approach for assessing combustion noise in compression-ignitied Diesel engines. Appl. Acoust. 2018, 135, 91–100. [Google Scholar] [CrossRef]
- Benajes, J.; Broatch, A.; Garcia, A.; Muñoz, L.M. An Experimental Investigation of Diesel-Gasoline Blends Effects in a Direct-Injection Compression-Ignition Engine Operating in PCCI Conditions; SAE Technical Paper; SAE: Warrendale, PA, USA, 2013. [Google Scholar] [CrossRef]
- Benajes, J.; Novella, R.; De Lima, D.; Tribotte, P. Investigation on multiple injection strategies for gasoline PPC operation in a newly designed 2-stroke HSDI compression ignition engine. SAE Int. J. Engines 2015, 8, 758–774. [Google Scholar] [CrossRef]
- Benajes, J.; García, A.; Domenech, V.; Durrett, R. An investigation of partially premixed compression ignition combustion using gasoline and spark assistance. Appl. Therm. Eng. 2013, 52, 468–477. [Google Scholar] [CrossRef]
- Vermorel, O.; Richard, S.; Colin, O.; Angelberger, C.; Benkenida, A.; Veynante, D. Towards the understanding of cyclic variability in a spark ignited engine using multi-cycle LES. Combust. Flame 2009, 156, 1525–1541. [Google Scholar] [CrossRef]
- Vermorel, O.; Richard, S.; Colin, O.; Angelberger, C.; Benkenida, A.; Veynante, D. Multi-Cycle LES Simulations of Flow and Combustion in a PFI SI 4-Valve Production Engine; SAE Technical Paper 2007-01-0151; SAE: Warrendale, PA, USA, 2007. [Google Scholar] [CrossRef]
- Granet, V.; Vermorel, O.; Lacour, C.; Enaux, B.; Dugué, V.; Poinsot, T. Large-Eddy Simulation and experimental study of cycle-to-cycle variations of stable and unstable operating points in a spark ignition engine. Combust. Flame 2012, 159, 1562–1575. [Google Scholar] [CrossRef] [Green Version]
- Fansler, T.D.; Wagner, R.M. Cyclic dispersion in engine combustion-Introduction by the special issue editors. Int. J. Engine Res. 2015, 16, 255–259. [Google Scholar] [CrossRef]
- Klos, D.; Kokjohn, S.L. Investigation of the sources of combustion instability in low-temperature combustion engines using response surface models. Int. J. Engine Res. 2015, 16, 419–440. [Google Scholar] [CrossRef]
- Jia, M.; Dempsey, A.B.; Wang, H.; Li, Y.; Reitz, R.D. Numerical simulation of cyclic variability in reactivity-controlled compression ignition combustion with a focus on the initial temperature at intake valve closing. Int. J. Engine Res. 2015, 16, 441–460. [Google Scholar] [CrossRef]
- CONVERGENT SCIENCE Inc. CONVERGE 2.2 Theory Manual; CONVERGENT SCIENCE Inc.: Madison, WI, USA, 2015. [Google Scholar]
- Angelberger, C.; Poinsot, T.; Delhay, B. Improving Near-Wall Combustion and Wall Heat Transfer Modeling in SI Engine Computations; SAE Technical Paper 2003-01-0542; SAE: Warrendale, PA, USA, 1997. [Google Scholar] [CrossRef]
- Senecal, P.K.; Pomraning, E.; Richards, K.J.; Briggs, T.E.; Choi, C.Y.; McDavid, R.M.; Patterson, M.A. Multi-Dimensional Modeling of Direct-Injection Diesel Spray Liquid Length and Flame Lift-off Length Using CFD and Parallel Detailed Chemistry; SAE Technical Paper 2003-01-1043; SAE: Warrendale, PA, USA, 2003. [Google Scholar] [CrossRef]
- Babajimopoulos, A.; Assanis, D.N.; Flowers, D.L.; Aceves, S.M.; Hessel, R.P. A fully coupled computational fluid dynamics and multi-zone model with detailed chemical kinetics for the simulation of premixed charge compression ignition engines. Int. J. Engine Res. 2005, 6, 497–512. [Google Scholar] [CrossRef]
- Pal, P.; Probst, D.; Pei, Y.; Zhang, Y.; Traver, M.; Cleary, D.; Som, S. Numerical Investigation of a Gasoline-Like Fuel in a Heavy-Duty Compression Ignition Engine Using Global Sensitivity Analysis. SAE Int. J. Fuels Lubr. 2017, 10, 56–68. [Google Scholar] [CrossRef]
- Brakora, J.; Reitz, R.D. A Comprehensive Combustion Model for Biodiesel-Fueled Engine Simulations; SAE Technical Paper 2013-01-1099; SAE: Warrendale, PA, USA, 2013. [Google Scholar] [CrossRef]
- Kodavasal, J.; Kolodziej, C.P.; Ciatti, S.A.; Som, S. Computational fluid dynamics simulation of gasoline compression ignition. J. Energy Resour. Technol. 2015, 137, 032212. [Google Scholar] [CrossRef]
- Benajes, J.; Novella, R.; Lima, D.D.; Thein, K. Impact of injection settings operating with the gasoline Partially Premixed Combustion concept in a 2-stroke HSDI compression ignition engine. Appl. Energy 2017, 193, 515–530. [Google Scholar] [CrossRef]
- Dukowicz, J.K. A particle-fluid numerical model for liquid sprays. J. Comput. Phys. 1980, 35, 229–253. [Google Scholar] [CrossRef]
- Reitz, R.D.; Beale, J.C. Modeling spray atomization with the Kelvin-Helmholtz/Rayleigh-Taylor hybrid model. Atomization Sprays 1999, 9, 623–650. [Google Scholar] [CrossRef]
- Payri, R.; García, J.M.; Salvador, F.; Gimeno, J. Using spray momentum flux measurements to understand the influence of diesel nozzle geometry on spray characteristics. Fuel 2005, 84, 551–561. [Google Scholar] [CrossRef]
- Payri, R.; Salvador, F.J.; Gimeno, J.; Bracho, G. A new methodology for correcting the signal cumulative phenomenon on injection rate measurements. Exp. Tech. 2008, 32, 46–49. [Google Scholar] [CrossRef]
- Torregrosa, A.J.; Olmeda, P.; Degraeuwe, B.; Reyes, M. A concise wall temperature model for DI Diesel engines. Appl. Therm. Eng. 2006, 26. [Google Scholar] [CrossRef]
- Torregrosa, A.J.; Broatch, A.; Margot, X.; Gomez-Soriano, J. Towards a Predictive CFD Approach for Assessing Noise in Diesel Compression Ignition Engines. Impact of the Combustion Strategies. In Proceedings of the 9th COMODIA International Conference on Modeling and Diagnostics for Advanced Engine systems, Okayama, Japan, 25 July 2017. [Google Scholar]
- Torregrosa, A.J.; Broatch, A.; García-Tíscar, J.; Gomez-Soriano, J. Modal decomposition of the unsteady flow field in compression-ignited combustion chambers. Combust. Flame 2018, 188, 469–482. [Google Scholar] [CrossRef]
- Broatch, A.; Margot, X.; Novella, R.; Gomez-Soriano, J. Impact of the injector design on the combustion noise of gasoline partially premixed combustion in a 2-stroke engine. Appl. Therm. Eng. 2017, 119, 530–540. [Google Scholar] [CrossRef]
Figure 1.
Numerical domain and mesh features of the engine.

Figure 2.
Comparison between measured and CFD calculated results of baseline test, measurements dispersion is represented by their standard deviation (SD).
Figure 2.
Comparison between measured and CFD calculated results of baseline test, measurements dispersion is represented by their standard deviation (SD).

Figure 3.
Comparison between measured and CFD calculated in-cylinder pressure traces of baseline test, dispersion due to CCV is represented by their standard deviation value.
Figure 3.
Comparison between measured and CFD calculated in-cylinder pressure traces of baseline test, dispersion due to CCV is represented by their standard deviation value.

Figure 4.
Comparison between measured and CFD calculated results of baseline test, dispersion due to CCV is represented by their standard deviation value. The maximum pressure rise rate and MAPO are plotted to compare experimental and simulation results.
Figure 4.
Comparison between measured and CFD calculated results of baseline test, dispersion due to CCV is represented by their standard deviation value. The maximum pressure rise rate and MAPO are plotted to compare experimental and simulation results.

Figure 5.
Visualization of the combustion process. A sequence of snapshots is depicted in order to identify the differences between two extreme cases with a remarkable knock level variation. The combustion process is visualized by clipping the temperature field at 2000 K and colouring it by the fuel energy release.


Table 1.
Main engine specifications of the engine.
| Engine | 2-Stroke HSDI CI |
|---|---|
| Fuel (-) | RON95 gasoline |
| Number of cylinders (-) | 1 |
| Displacement (cm3) | 365 |
| Bore–Stroke (mm) | 76.0–80.5 |
| Compression ratio (geometric) | 17.8:1 |
| Compression ratio (effective) | from 13.0:1 to 8.8:1 |
| Number of valves (-) | 2 intake and 2 exhaust |
Table 2.
Baseline operation parameters and ranges of variation for the alteration of the IVC conditions.
Table 2.
Baseline operation parameters and ranges of variation for the alteration of the IVC conditions.
| Parameter | Baseline | ± | [%] |
|---|---|---|---|
| Combustion products (%) | 36.70 | 1.0 | 2.7 |
| Temperature (K) | 406.30 | 2.0 | 0.5 |
| Tumble intensity (-) | 4.31 | 1.1 | 25.0 |
| Fuel mass (mg/cyc) | 19.07 | 0.191 | 1.0 |
Table 3.
Operating settings used for the model validation.
| Engine speed (rpm) | 1500 |
| Torque (Nm) | 49.9 |
| IMEP (MPa) | 1.04 |
| Number Injections (-) | 3 (pilot + main + post) |
| SoEmain (cad aTDC) | −42.0 |
| Injection pressure (MPa) | 85 |
| Intake pressure (MPa) | 0.275 |
| EGR (%) | 43.66 |
© 2018 by the authors. Licensee MDPI, Basel, Switzerland. This article is an open access article distributed under the terms and conditions of the Creative Commons Attribution (CC BY) license (http://creativecommons.org/licenses/by/4.0/).
Share and Cite
MDPI and ACS Style
Serrano, J.R.; Novella, R.; Gomez-Soriano, J.; Martinez-Hernandiz, P.J. Computational Methodology for Knocking Combustion Analysis in Compression-Ignited Advanced Concepts. Appl. Sci. 2018, 8, 1707. https://doi.org/10.3390/app8101707
AMA Style
Serrano JR, Novella R, Gomez-Soriano J, Martinez-Hernandiz PJ. Computational Methodology for Knocking Combustion Analysis in Compression-Ignited Advanced Concepts. Applied Sciences. 2018; 8(10):1707. https://doi.org/10.3390/app8101707
Chicago/Turabian StyleSerrano, José Ramón, Ricardo Novella, Josep Gomez-Soriano, and Pablo José Martinez-Hernandiz. 2018. "Computational Methodology for Knocking Combustion Analysis in Compression-Ignited Advanced Concepts" Applied Sciences 8, no. 10: 1707. https://doi.org/10.3390/app8101707
Note that from the first issue of 2016, this journal uses article numbers instead of page numbers. See further details here.