Electricity Production from Marine Water by Sulfide-Driven Fuel Cell


Institute of Chemical Engineering, Bulgarian Academy of Sciences, 1113 Sofia, Bulgaria
*
Author to whom correspondence should be addressed.
Appl. Sci. 2018, 8(10), 1926; https://doi.org/10.3390/app8101926
Submission received: 6 August 2018
/
Revised: 18 September 2018
/
Accepted: 29 September 2018
/
Published: 15 October 2018
(This article belongs to the Special Issue Electro-membrane Processes for Clean Water and Sustainable Energy)
Abstract
:Featured Application
There is an enormous amount of hydrogen sulfide in the Black Sea for a potential use as a fuel in the proposed fuel cell. Hydrogen sulfide is frequently met in nature, particularly in closed water ponds as well as in some mineral water springs, some waste streams, etc. The practical development of the proposed fuel cell can lead to the hydrogen sulfide utilization as energy combined with remediation of the environment.
Abstract
While there is a universal trend to replace fossil fuels at least partially, renewable fuels seem to impose new solutions. Hydrogen sulfide, typical for closed water ponds such as the Black Sea, seems to offer one namely, a new sulfide-driven fuel cell providing for exchange of OH− anions across the membrane by use of hydrogen sulfide in natural marine water. When tested in batch and continuous operation modes, this solution showed that the initial sulfide concentration needed to achieve results of practical value was within 200 to 300 mg dm−3. The predominating final products of the energy production process were sulfite and sulfate ions. Very low overpotentials and mass transfer resistances were observed. The mass balance and the electrochemical parameters showed about 30% efficiency in sulfate ions as the final product. Efforts should be made to enhance sulfide to sulfate conversion. The observed current and power density were comparable and even better than some of the results so far reported for similar systems. Three types of ion exchange membranes were tested. Comparison of their ion conductivity to literature data shows good performance. At higher initial sulfide concentrations polysulfides and thio-compounds were formed with considerably low current yield.
1. Introduction
The idea behind the research presented here took shape some years ago after discussions about the enormous resources of hydrogen sulfide accumulated in the Black Sea waters at huge depths. Hydrogen sulfide was detected in the Black Sea at 150 m depth reaching 22 mg dm−3 in the deepest water, i.e., 2200 m [1]. Its amount was estimated to be about 4.6 billion tons [2] with annual additions of at least 5 million tons [3]. Having in mind that the enthalpy of oxidation of hydrogen sulfide to sulfate is 833.6 kJ/mole at 25 °C, one can calculate that the total amount of hydrogen sulfide for the Black Sea is equivalent to 33,000 TWh electric energy. The annual increase due to 5 million tons is equivalent to 36 TWh. This amount is comparable to the annual electricity demand of Bulgaria. A comparison of thermodynamic data to the energy capacity of some better known fuels can be found in Table 1.
One can see that hydrogen sulfide has mass energy capacity comparable to all typical energy sources, except hydrogen. There have been different ideas for hydrogen sulfide utilization. Efforts have been made to split hydrogen sulfide into hydrogen and sulfur and to recover the produced hydrogen as an energy source [3,4,5,6,7,8,9,10]. The setback was the higher amount of energy that would be needed to split hydrogen sulfide as compared to the energy yield resulting from the produced hydrogen. Another setback would be the waste of sulfur obtained in colloidal state. Hydrogen sulfide destruction by plasma method was also proposed [11], as well as a process and equipment for H2S extraction from sea water [12]. In a recent paper, Ipsakis et al. [13] proposed an electro-catalytic membrane reactor for hydrogen sulfide oxidation in aqueous media using solid electrolyte membrane [13].
There are some studies on hydrogen sulfide processing in solid oxide fuel cells (SOFC) operating in gaseous phase at very high temperatures giving sulfur and sulfur dioxide as final products. Those are the works of Kirk and Winnick [14] and Aguilar et al. [15]. There had also been other efforts to use hydrogen sulfide in a fuel cells in gaseous phase [16], but elemental sulfur proved to be the only product of oxidation.
Although high current and power density was obtained, the fuel cells in question prove unsuitable for treatment of aqueous solutions.
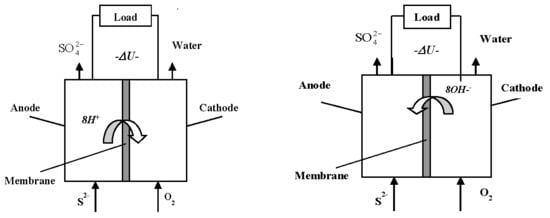
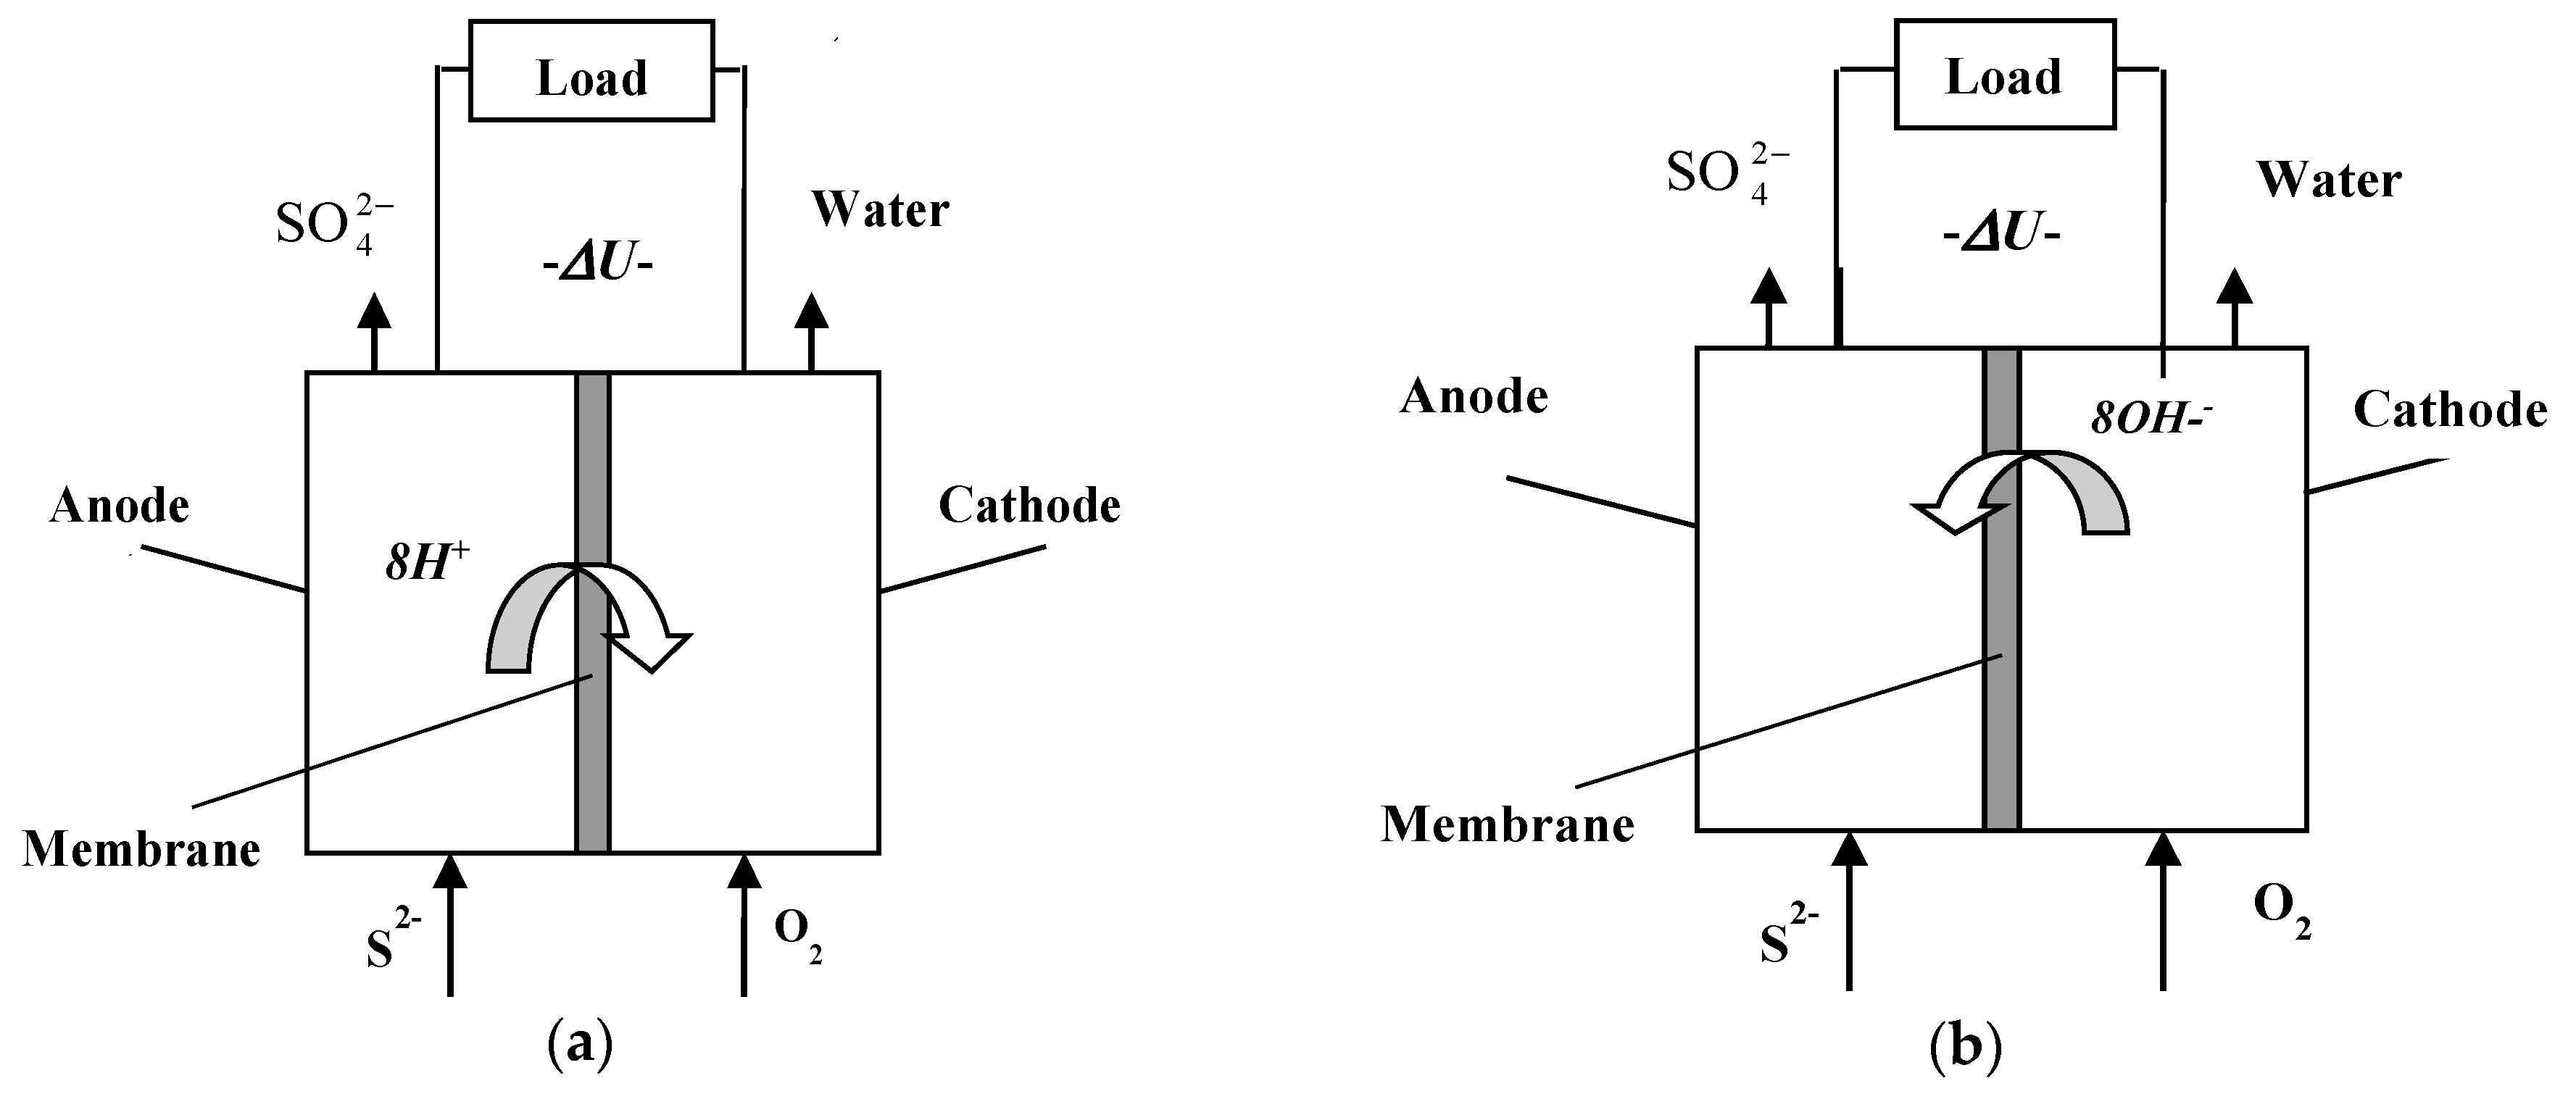
Our idea is to use hydrogen sulfide directly as electric energy generating electromotive force in a specially constructed sulfide-driven fuel cell (SDFC) [17,18]. The principle of this type of fuel cell is shown in Figure 1, the stages of the proposed technology being: (1) pumping sea water from adequate depths (e.g., 1000 m) to a rig on the sea surface where the equipment is installed; (2) enrichment to achieve suitable sulfide inlet concentration: and (3) passing the enriched sulfide solution through the fuel cell. The advantages of the proposed technology from environmental and operational point of view are demonstrated in Table 2.
Some estimates of the capital and operational costs for energy production by different methods and facilities are also shown here. One can see that alongside environmental advantages, the capital and operational costs for the SDFC-based method are comparable to those of wind and solar facilities, and even lower than those of nuclear power plants.
In a previous paper [21], a similar fuel cell operating in aqueous phase was considered, but the oxidation yielded only elemental sulfur, which blocked the electrodes. The apparent electrode surfaces were enhanced by adding graphite beads. Additionally, Zhai et al. [22] applied a fuel cell to oxidize sulfide to sulfur by ferric tons, but at very low current densities.
There is a paper by Kim and Han [23] demonstrating best current densities in a sulfide-driven fuel cells operating in liquid phase, but in a strongly alkaline medium (3 M NaOH). This medium is inadmissible for sea water because of the threat of pollution and damage to aquatic life. In a recent work, Iordache et al. [24] tested a sulfide fuel cell with proton exchange membrane and platinum/rutenium catalyst, but very low current and power densities were reached.
Some studies propose simultaneous production of hydrogen and electricity generation in a membrane electolyzer [25] and by hydrogen sulfide decomposition, cf. Fukuzumi et al. [26].
The subject of this presentation is the experimental study of the performance of a sulfide-driven fuel cells operating under environmentally-friendly conditions. Parameters such as inlet sulfide concentration, fuel cell geometry and size, aeration type, effect of the separation membrane and cell efficiency were verified and tested under conditions compatible with those in genuine marine water in the Black Sea.
2. Experimental Part
2.1. Methodology
In the case under consideration, i.e., where in situ energy production from the hydrogen sulfate present in marine water is anticipated, the following restrictions were kept in mind:
- No discharge of any toxic or environmentally unfriendly waste into the sea. Therefore, no use of chemical oxidizers for the cathode processes (e.g., hexacyanoferrate, etc.) instead of oxygen is admissible;
- No use of any other supporting electrolytes but marine water (no sodium or potassium hydroxides);
- Use of HS− or S2− as substrates only;
- No metal parts in the fuel cell design;
- Metal electrodes are undesired.
The experiments consisted in parallel measurements of the cell potential (in an open circuit and with a load) and the current in specially designed sulfide-driven fuel cells under batch and continuous conditions. From these results voltammetric polarization curves were constructed. From the slope of the linear part of the curves the cell Ohmic resistance was determined and subsequently the power density was calculated.
Afterwards, cell discharge through a selected Ohmic resistance in batch or continuous mode was accomplished, accompanied by sampling from the inlet and outlet streams in the continuous experiments or periodically during the batch ones. Electric current and cell potentials were measured and monitored continuously during all of the runs.
The results of the analyses for the sulfide electrochemical oxidation were compared to the ones calculated from the current values according to Faraday’s law:
where:
- i—electric current, A;
- m—mass of reacting substance, g;
- t—time, s;
- M—molar mass of reacting substance, g;
- n—number of exchanged electrons;
- F = 96,484 C mol−1, Faraday constant.
One must have in mind that there are many sulfide oxidation reactions incorporating one to eight exchanged electrons. Short excerpt of a list of sulfide redox reactions [27] relevant to the studied process is shown in Table 3. Both proton and hydroxide ion exchange processes are possible.
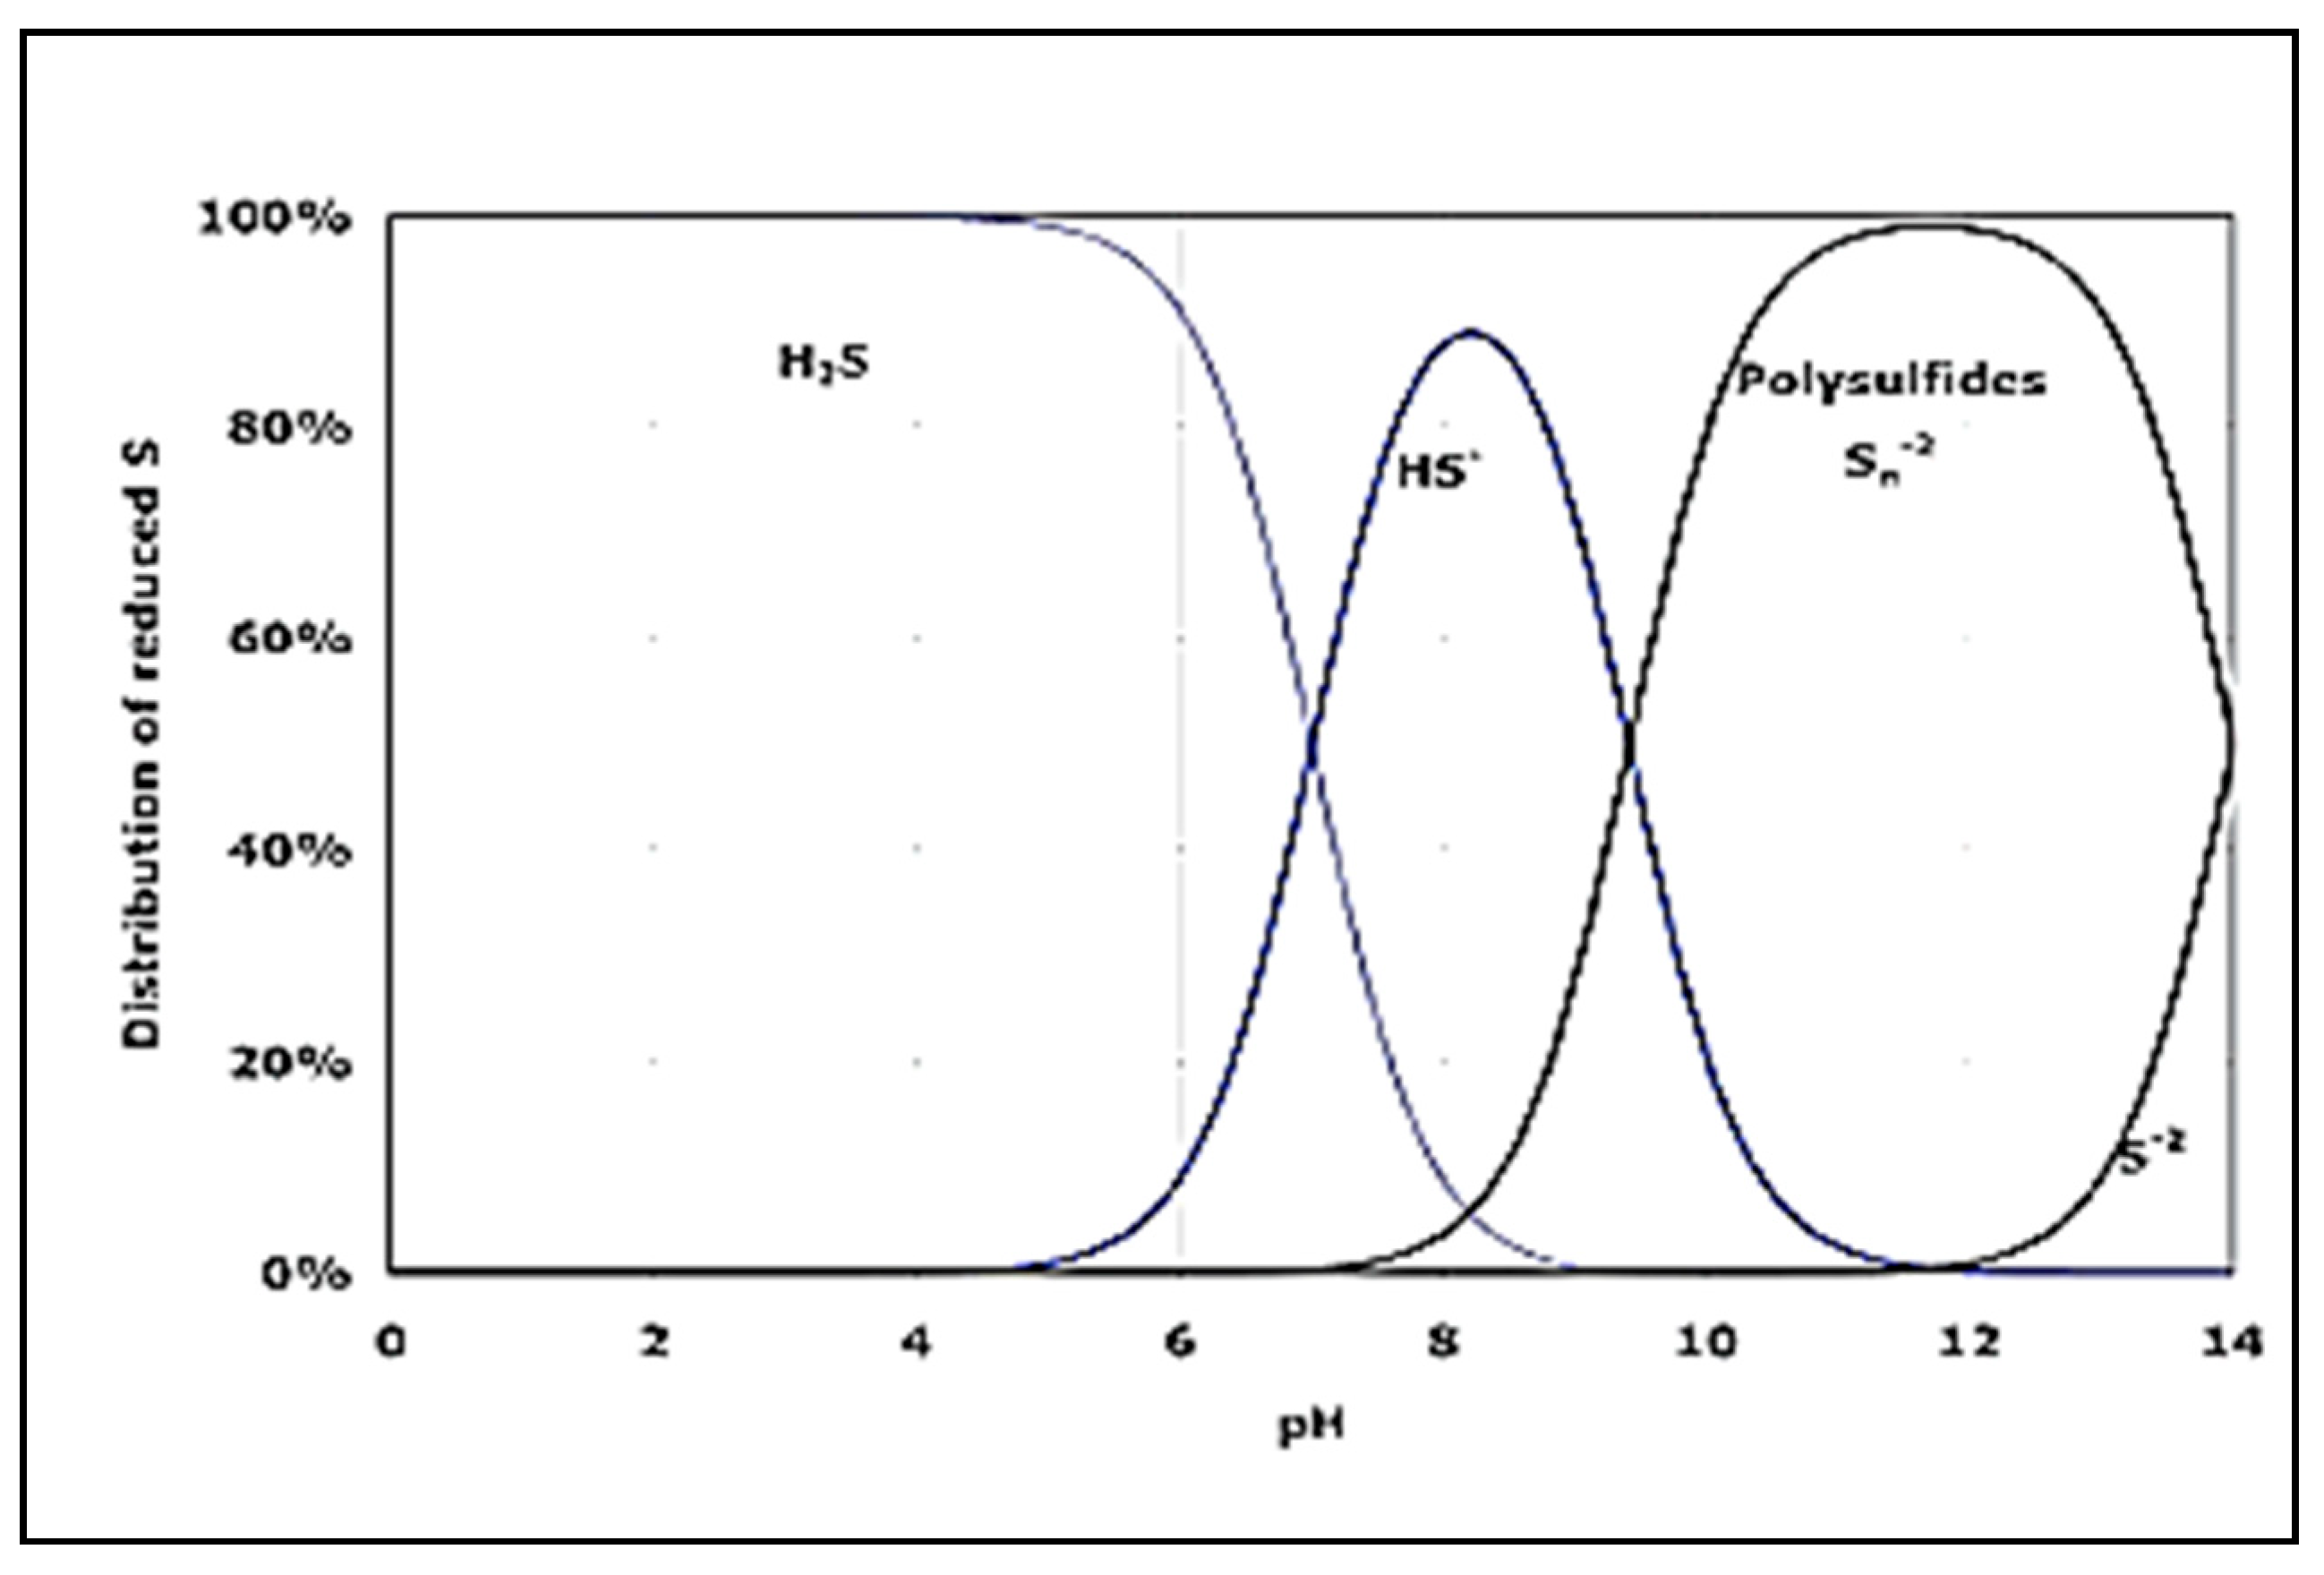
Other reactions are also possible with polysulfide ions as an end-product. The latter are observed at higher sulfide concentrations over a certain pH range, cf. Figure 2. One can see that over the pH range of 7–9 hydrosulfide anions are predominant. Such is the case in the Black Sea water.
Among the various redox reactions, in which sulfur-containing compounds and ions are involved, is the formation and oxidation of thiosulfate and other thio-anions, cf. Table 3. Thiosulfate is stable in neutral and alkaline media, as also demonstrated in our case. That is why by measuring the electric current one must be aware that parallel reactions with a different number of exchanged electrons are possible. Moreover, redox reactions in the bulk competing with the target electrochemical reactions are also possible. That is why Equation (1) will be used very cautiously to help estimate the obtained numerical results for the electric current.
According to the theory, the reversible electromotive force (EMF) of a net electrochemical reaction in fuel cells is given by the well-known Nernst equation [29]:
where:
E0 is the standard EMF at unit activity and 1 bar pressure; i and j are the numbers of reactants and product species; ai,j are the activities of the species and ci,j are the stoichiometric coefficients in the net reaction; R is the universal gas constant, and T is the temperature. In the case of various possible reactions (as shown in Table 3) the calculation of the reversible EMF becomes quite uncertain.
The operation of an electrochemical system, such as the fuel cells, is associated with electric currents, i.e., with irreversible processes and certain losses in cell efficiency [29], like:
- Activation losses, expressed by the measured overpotential at the electrochemical reactions;
- Concentration (or mass transfer) losses;
- Losses due to incomplete conversion of reactants to products;
- Ohmic losses and;
- Losses due to fuel crossover and internal current.
The latter are strongly influenced by the ionic conductivity of the separation membrane.
Nevertheless, the open circuit electromotive force of the cell is considered as its reversible thermodynamic potential.
The output (load) voltage V of the fuel cell is related to the Nernst EMF and the cell Ohmic resistance r by the equation [29]:
where iFC is the electric current. The voltage fuel cell efficiency is given by the ratio:
The real fuel cell efficiency comprises the reversible thermodynamic efficiency, the voltage efficiency and the fuel utilization one [30].
2.2. Fuel Cell Design
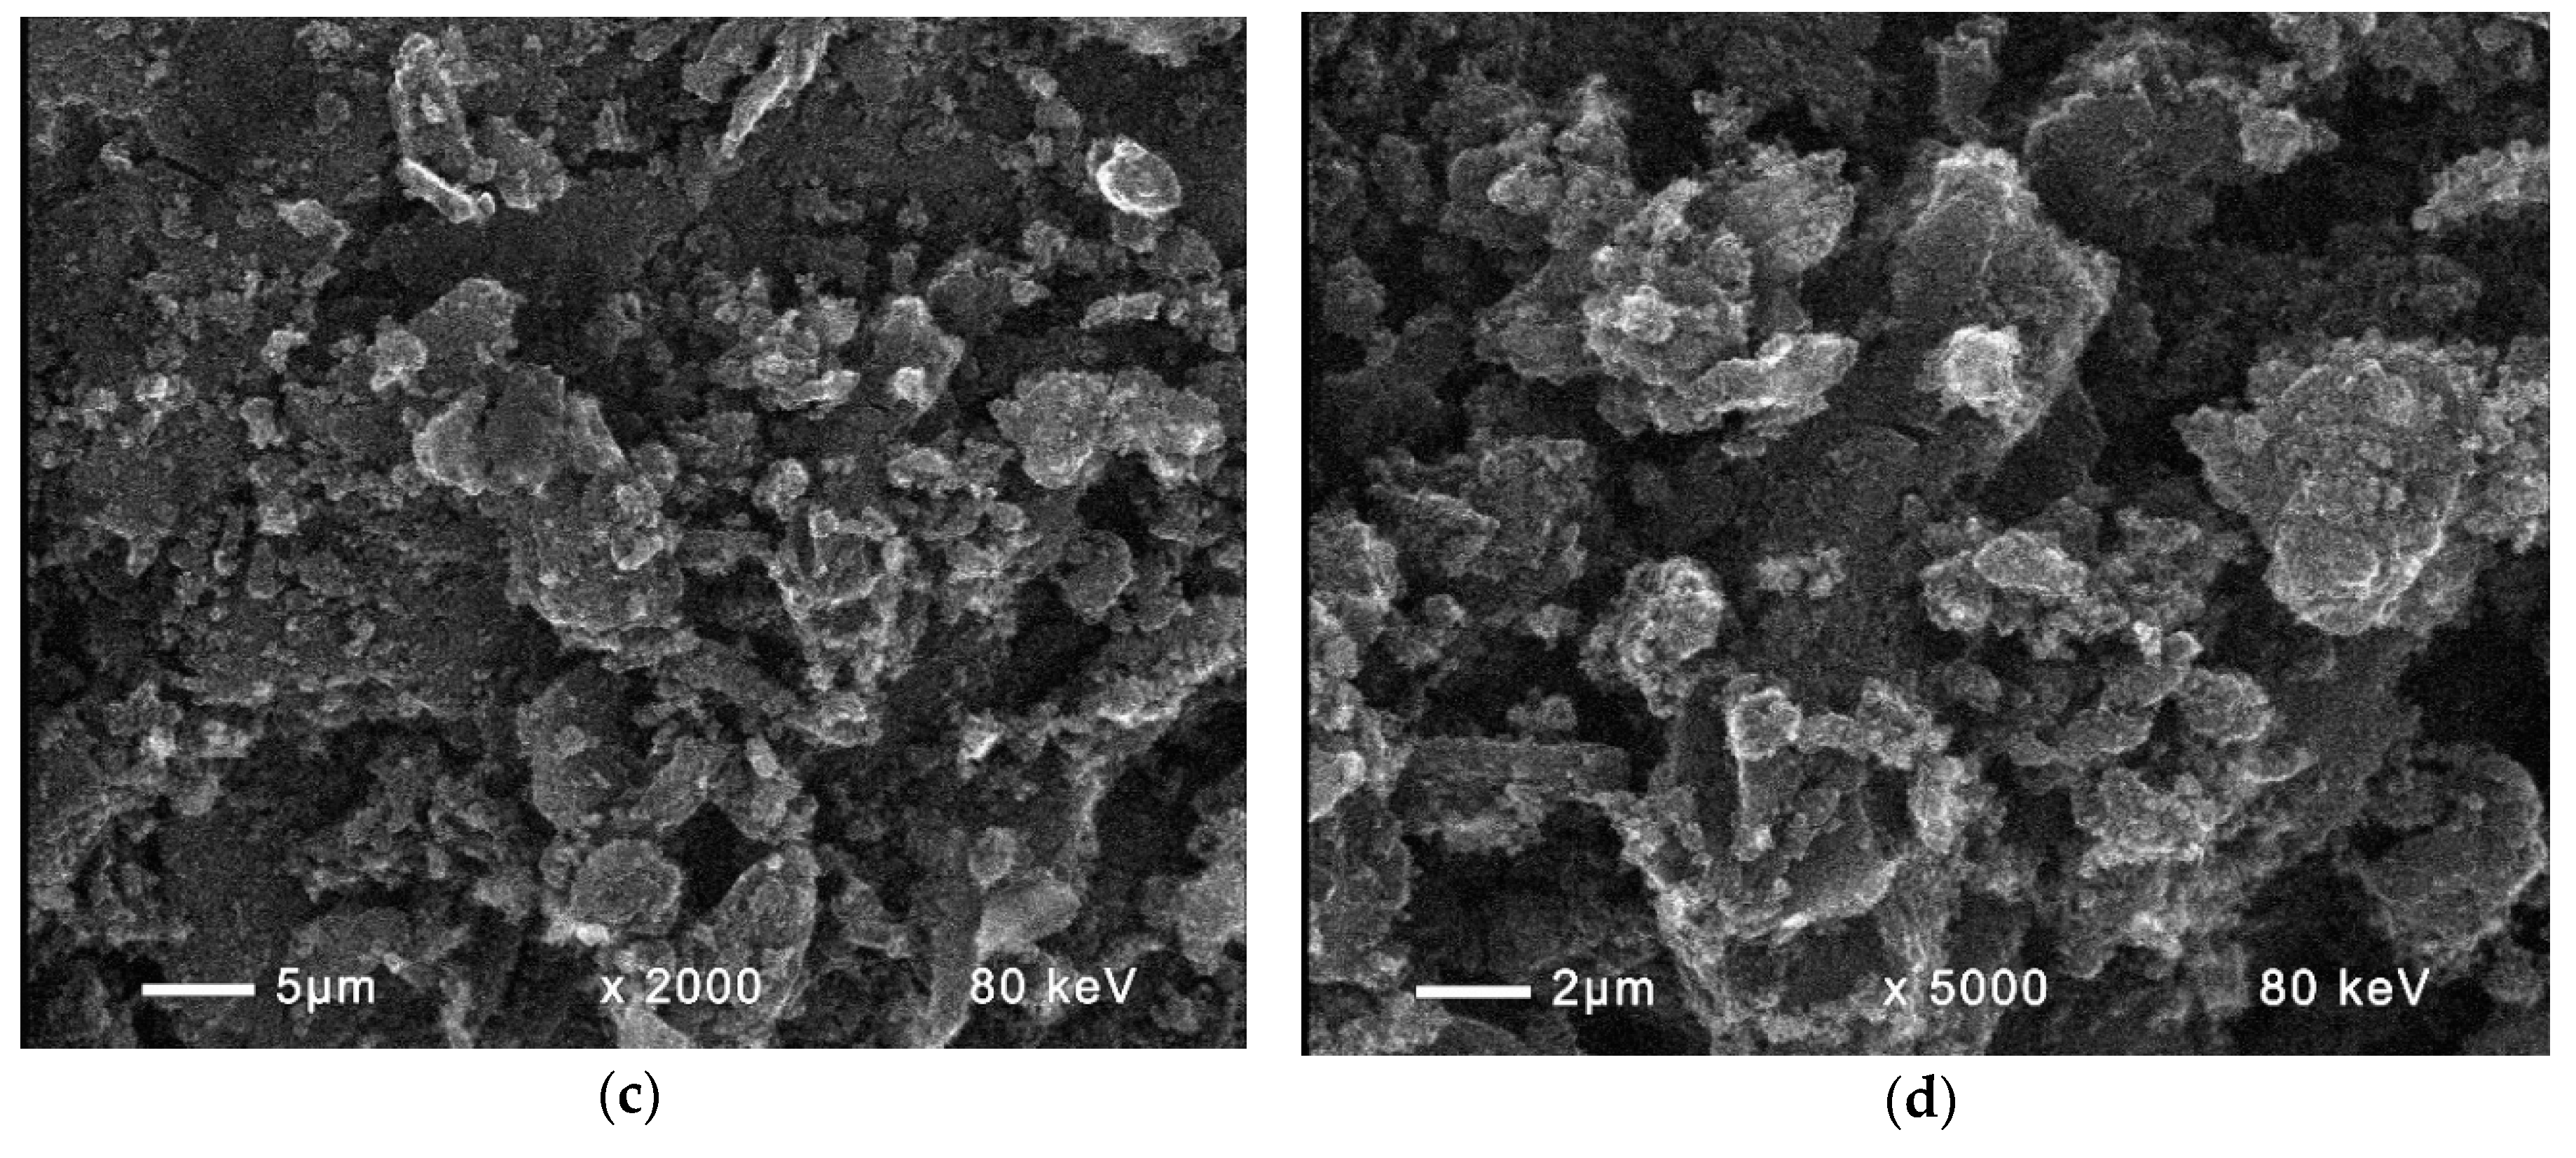
Three different fuel cells were tested. The first one consisted of two co-centric glass cylinders with i.d. of 3 cm and o.d. of 3.8 cm for the inner one and i.d. 3.8 and 5 cm for the annulаr space between the cylinders. The two compartments were separated by a membrane with diameter of 3 cm and area of 7 sq. cm. Graphite rods of spectroscopic purity were used as electrodes. In order to increase the cathode surface the space of the inner cylinder was packed with granulated activated carbon (Fujikasui, Tokyo, Japan) with a specific area of 680 m2 g−1 and particle size 4 to 6 mm. The re-distribution of the air bubbles by the bed of carbon particles has additional beneficial effect on the oxygen mass transfer in the cathode space. The images of the used activated carbon at different magnifications are shown in Figure 3a–d. A transmission electron microscope JEOL JEM V-200 (JEOL, Tokyo, Japan) with scanning attachment EM-ASID-3D was used.
Air was blown in the cathode space with a flow rate of 6 L/min. The useful volume of the anode compartment was 80 mL and of the cathode one, 40 mL. The experiments in this cell were carried out in a batch or continuous mode. The electric current and the cell voltage were measured and monitored during the runs. Samples from the anode space were taken periodically and analyzed quantitatively for sulfide and qualitatively for sulfate, sulfite, thiosulfate, and polysulfide. Preliminary cyclic voltammetry carried out at different temperatures (15, 20, 23, and 25 °C) has shown that there are no significant differences in the obtained electrochemical data for this temperature range. The experiments were therefore mostly performed at 20 °C.
Three different membranes were tested as separators: Celgard 3501, Fumapem* FAA-3-PK-75 (OH−form), and Neosepta* AFN. The latter two are typical anion exchange ones, whereas Celgard 3501, made out of polypropylene, conducts both H+ and OH− ions. The membranes have been selected because of their relatively high ionic conductivity [31].
Various sulfide concentrations were tested starting with 10 mg dm−3 and reaching to 2000 mg dm−3. The initial pH values of the feed solutions varied between 7.9 (for lower sulfide concentrations, from 60 mg dm−3) up to pH 12.65 for 1000 mg dm−3 sulfide concentration.
Two other fuel cell constructions were also tested. The first was assembled as a two-cell stack designed to operate simultaneously or separately. The electrodes were rectangular plates of sintered graphite (manufactured by Cometech OOD, Sofia, Bulgaria) size 500 × 130 × 5 mm with a cross-section area of 650 sq.cm. The SEM images of the sintered graphite at different magnifications are shown in Figure 4. They were taken by the same equipment as in Figure 3.
The SEM energy dispersive spectroscopy investigation was performed at 15 kV acceleration voltages using a ZEISS EVO LS25 (Carl Zeiss, Oberkochen, Germany) scanning electron microscope equipped with an EDAX Trident analytical system for energy dispersive X-ray analysis. The energy dispersive X-ray (EDX) spectrum of the sintered graphite shows silicon as a main contamination, whereas the other elements were in very low concentrations, cf. Figure 5.
The void volume of the entire electrode space was 800 mL. In this case, a Celgard 3501 membrane with the same cross-section was used as a separator.
2.3. Experimental Conditions
Experiments were carried out in batch or continuous mode. During the continuous processes the sulfide solution was fed into the anodic space by a dosage pump with a flow rate of 0.02 or 0.4 l/h. The cathodic space was either void or packed with granulated activated carbon in order to increase the cathode interfacial area. Oxygen was introduced by direct aeration passing air through the solution filling the cathode space with a flow rate of 500 L/h or by passing through the fuel cells a solution of supporting electrolyte previously saturated by oxygen in a Venturi tube ejector.
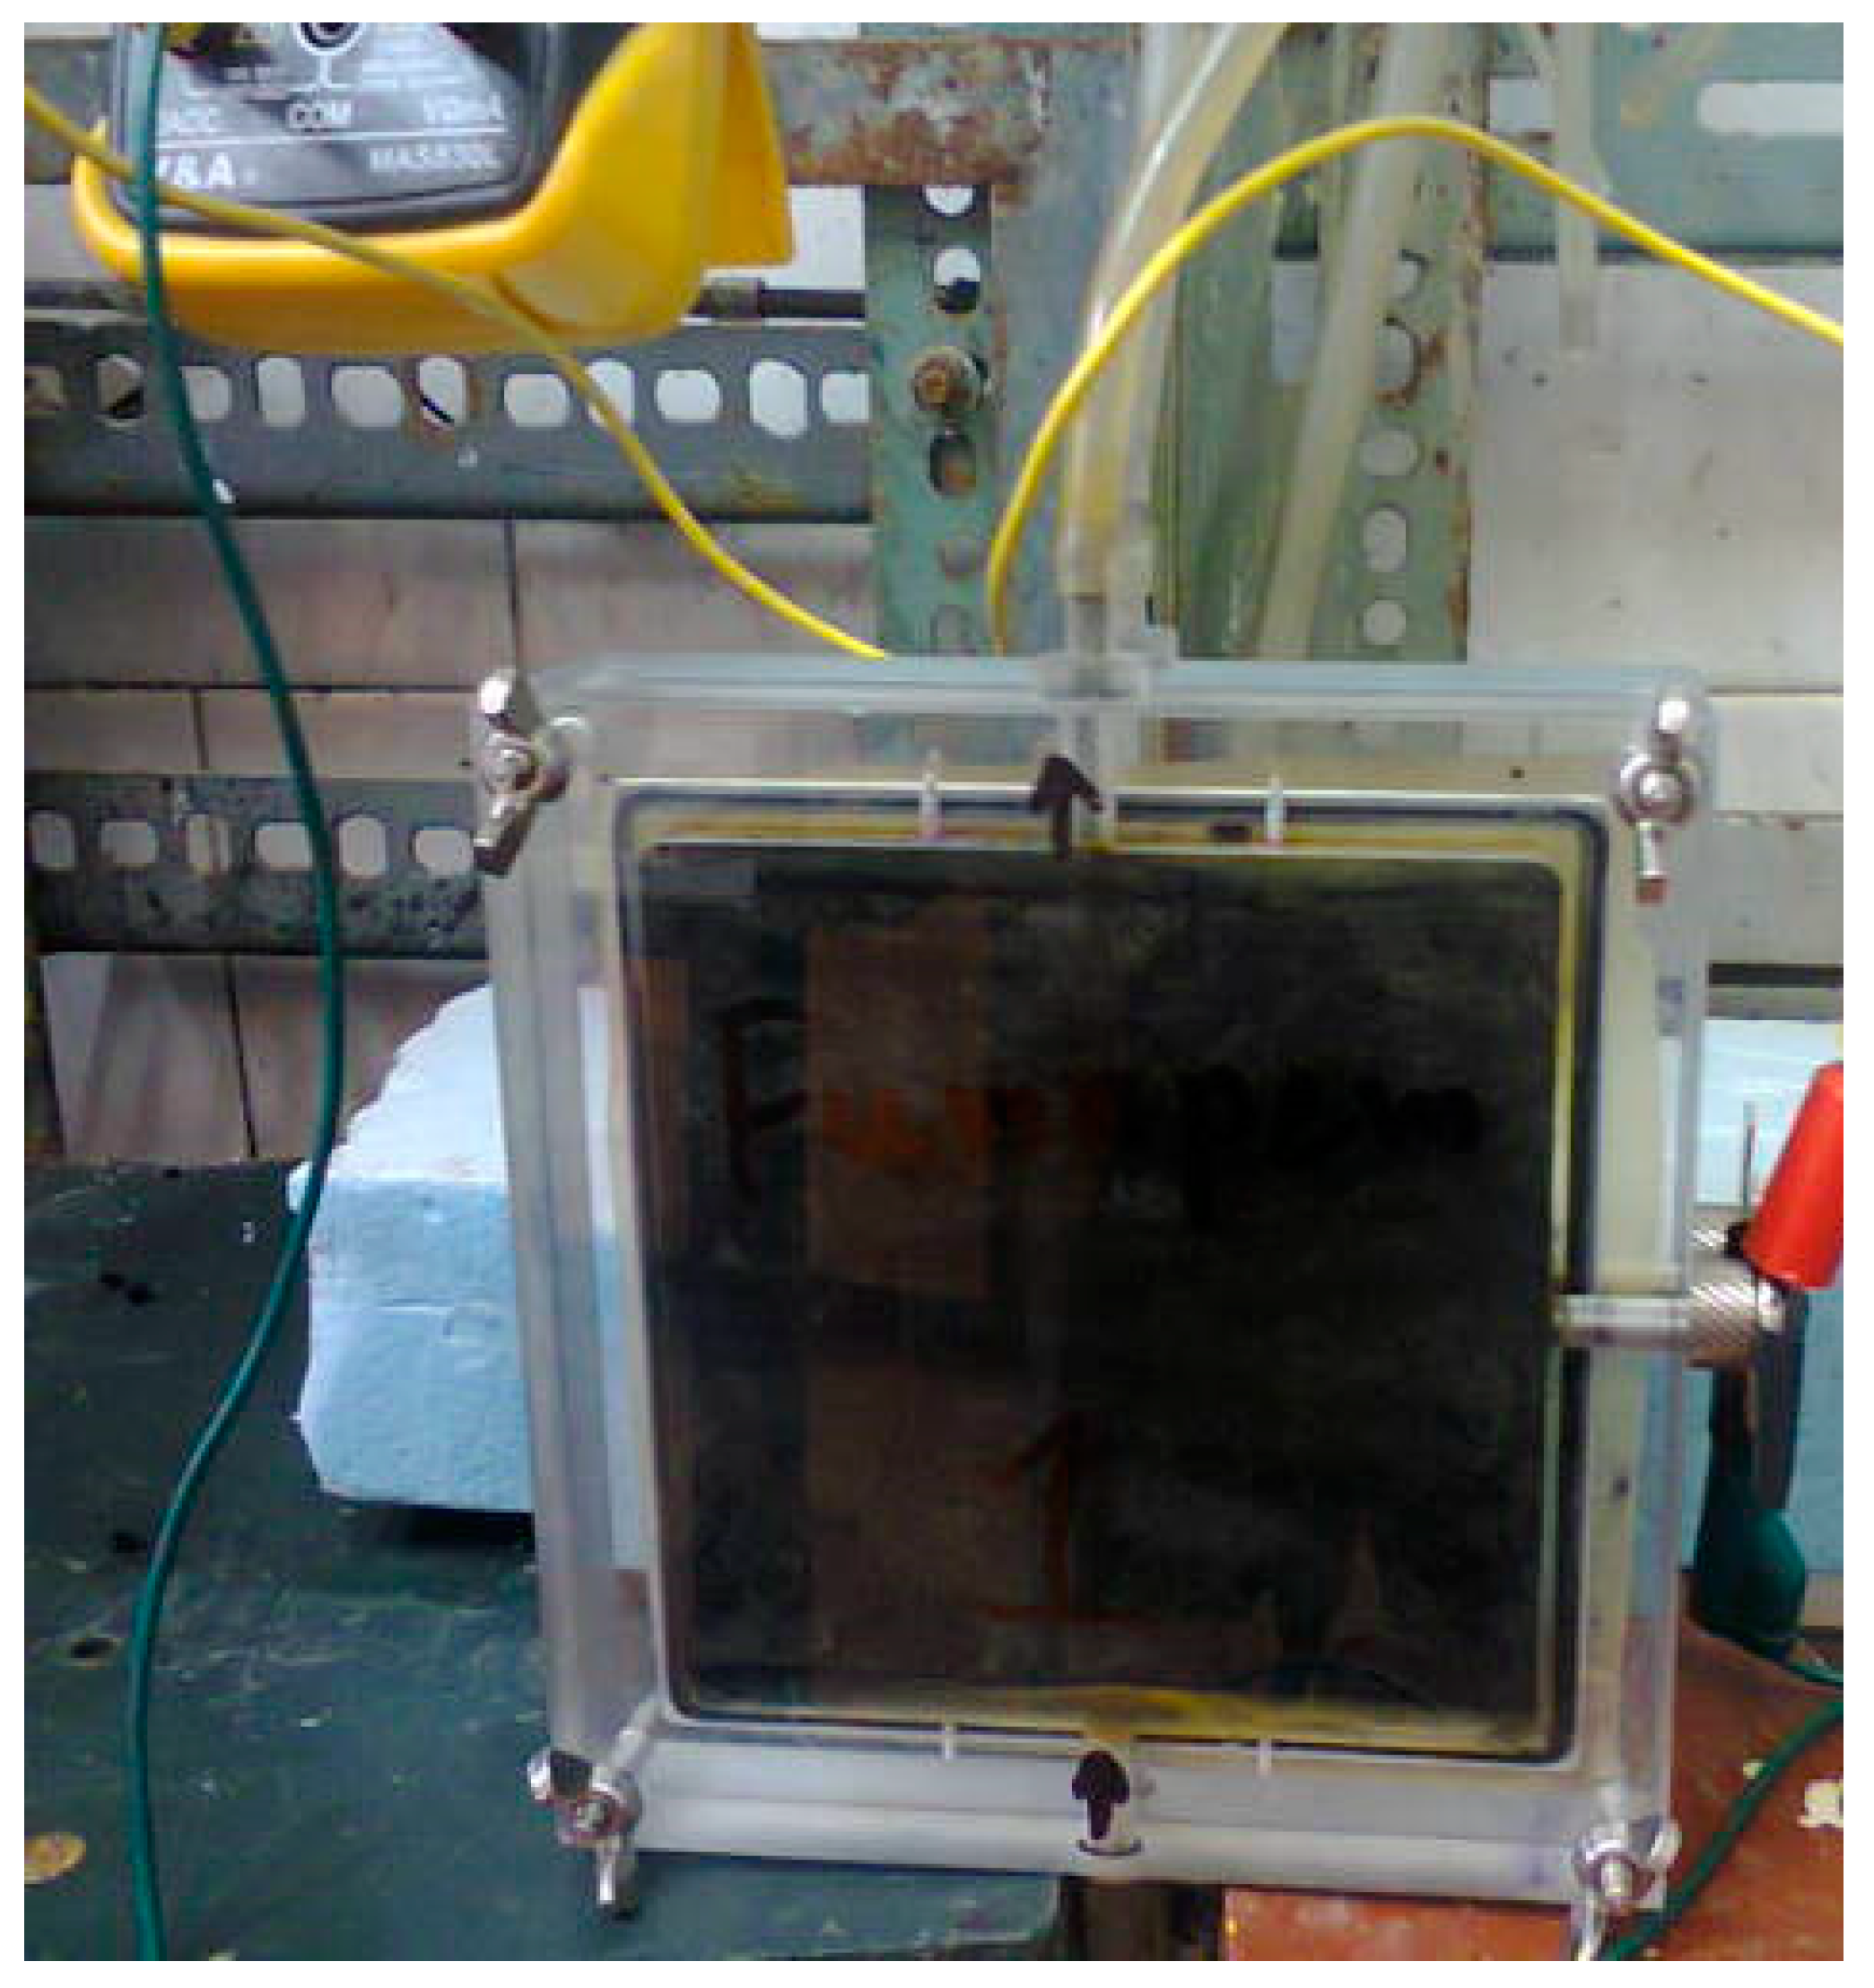
The fuel cell shown in Figure 6 has a cross section of 100 sq/cm. The electrodes are 10 × 10 cm square-shaped plates of sintered graphite (a Cometech OOD production). The operating volume for the anode space was 20 mL, whereas for the cathode one it was 50 mL. The cathodic space was packed with granulated activated carbon to increase the cathode area as mentioned above.
2.4. Chemicals
A sodium chloride solution was used as a supporting electrolyte for both compartments. The sodium chloride concentration resembled that in the Black Sea water, i.e., 16 g dm−3. The tests with higher NaCl concentrations did not give considerably better results for the current efficiency. Distilled water was used for preparation of the solutions.
Sodium sulfide nanohydrate, >98% purity, was purchased from Fluka. All other chemicals used for the experimental runs and for analyses were of p.a. grade.
2.5. Analyses
The quantitative analysis for sulfide was made photometrically with N,N-dimethyl-n-phenylenediamine in the presence of Fe(III) to form methylene blue [32]. Sulfate and sulfite were qualitatively proven by the addition of barium chloride. Barium sulfite is soluble in acid medium whereas barium sulfate is not. The presence of thiosulfate was checked by the addition of ferric salts leading to purple color. Polysulfides give a colored clear solution (yellow for S22−) with deposition of colloidal sulfur in acid medium.
In some cases, sulfide and sulfite were simultaneously determined by iodometric titration. Sulfate was determined after precipitation with barium chloride and complexometric back-titration with EDTA using Eriochrome Black T as an indicator.
During all batch experiments the acidity of the medium was monitored by measuring the pH prior to and during the run. In the case of continuous experiments pH was measured at the inlet and the outlet positions of the fuel cell. A glass electrode coupled with a Seven easy pH-meter (Mettler Toledo) was used.
3. Results and Discussion
3.1. Initial Sulfide Concentrations
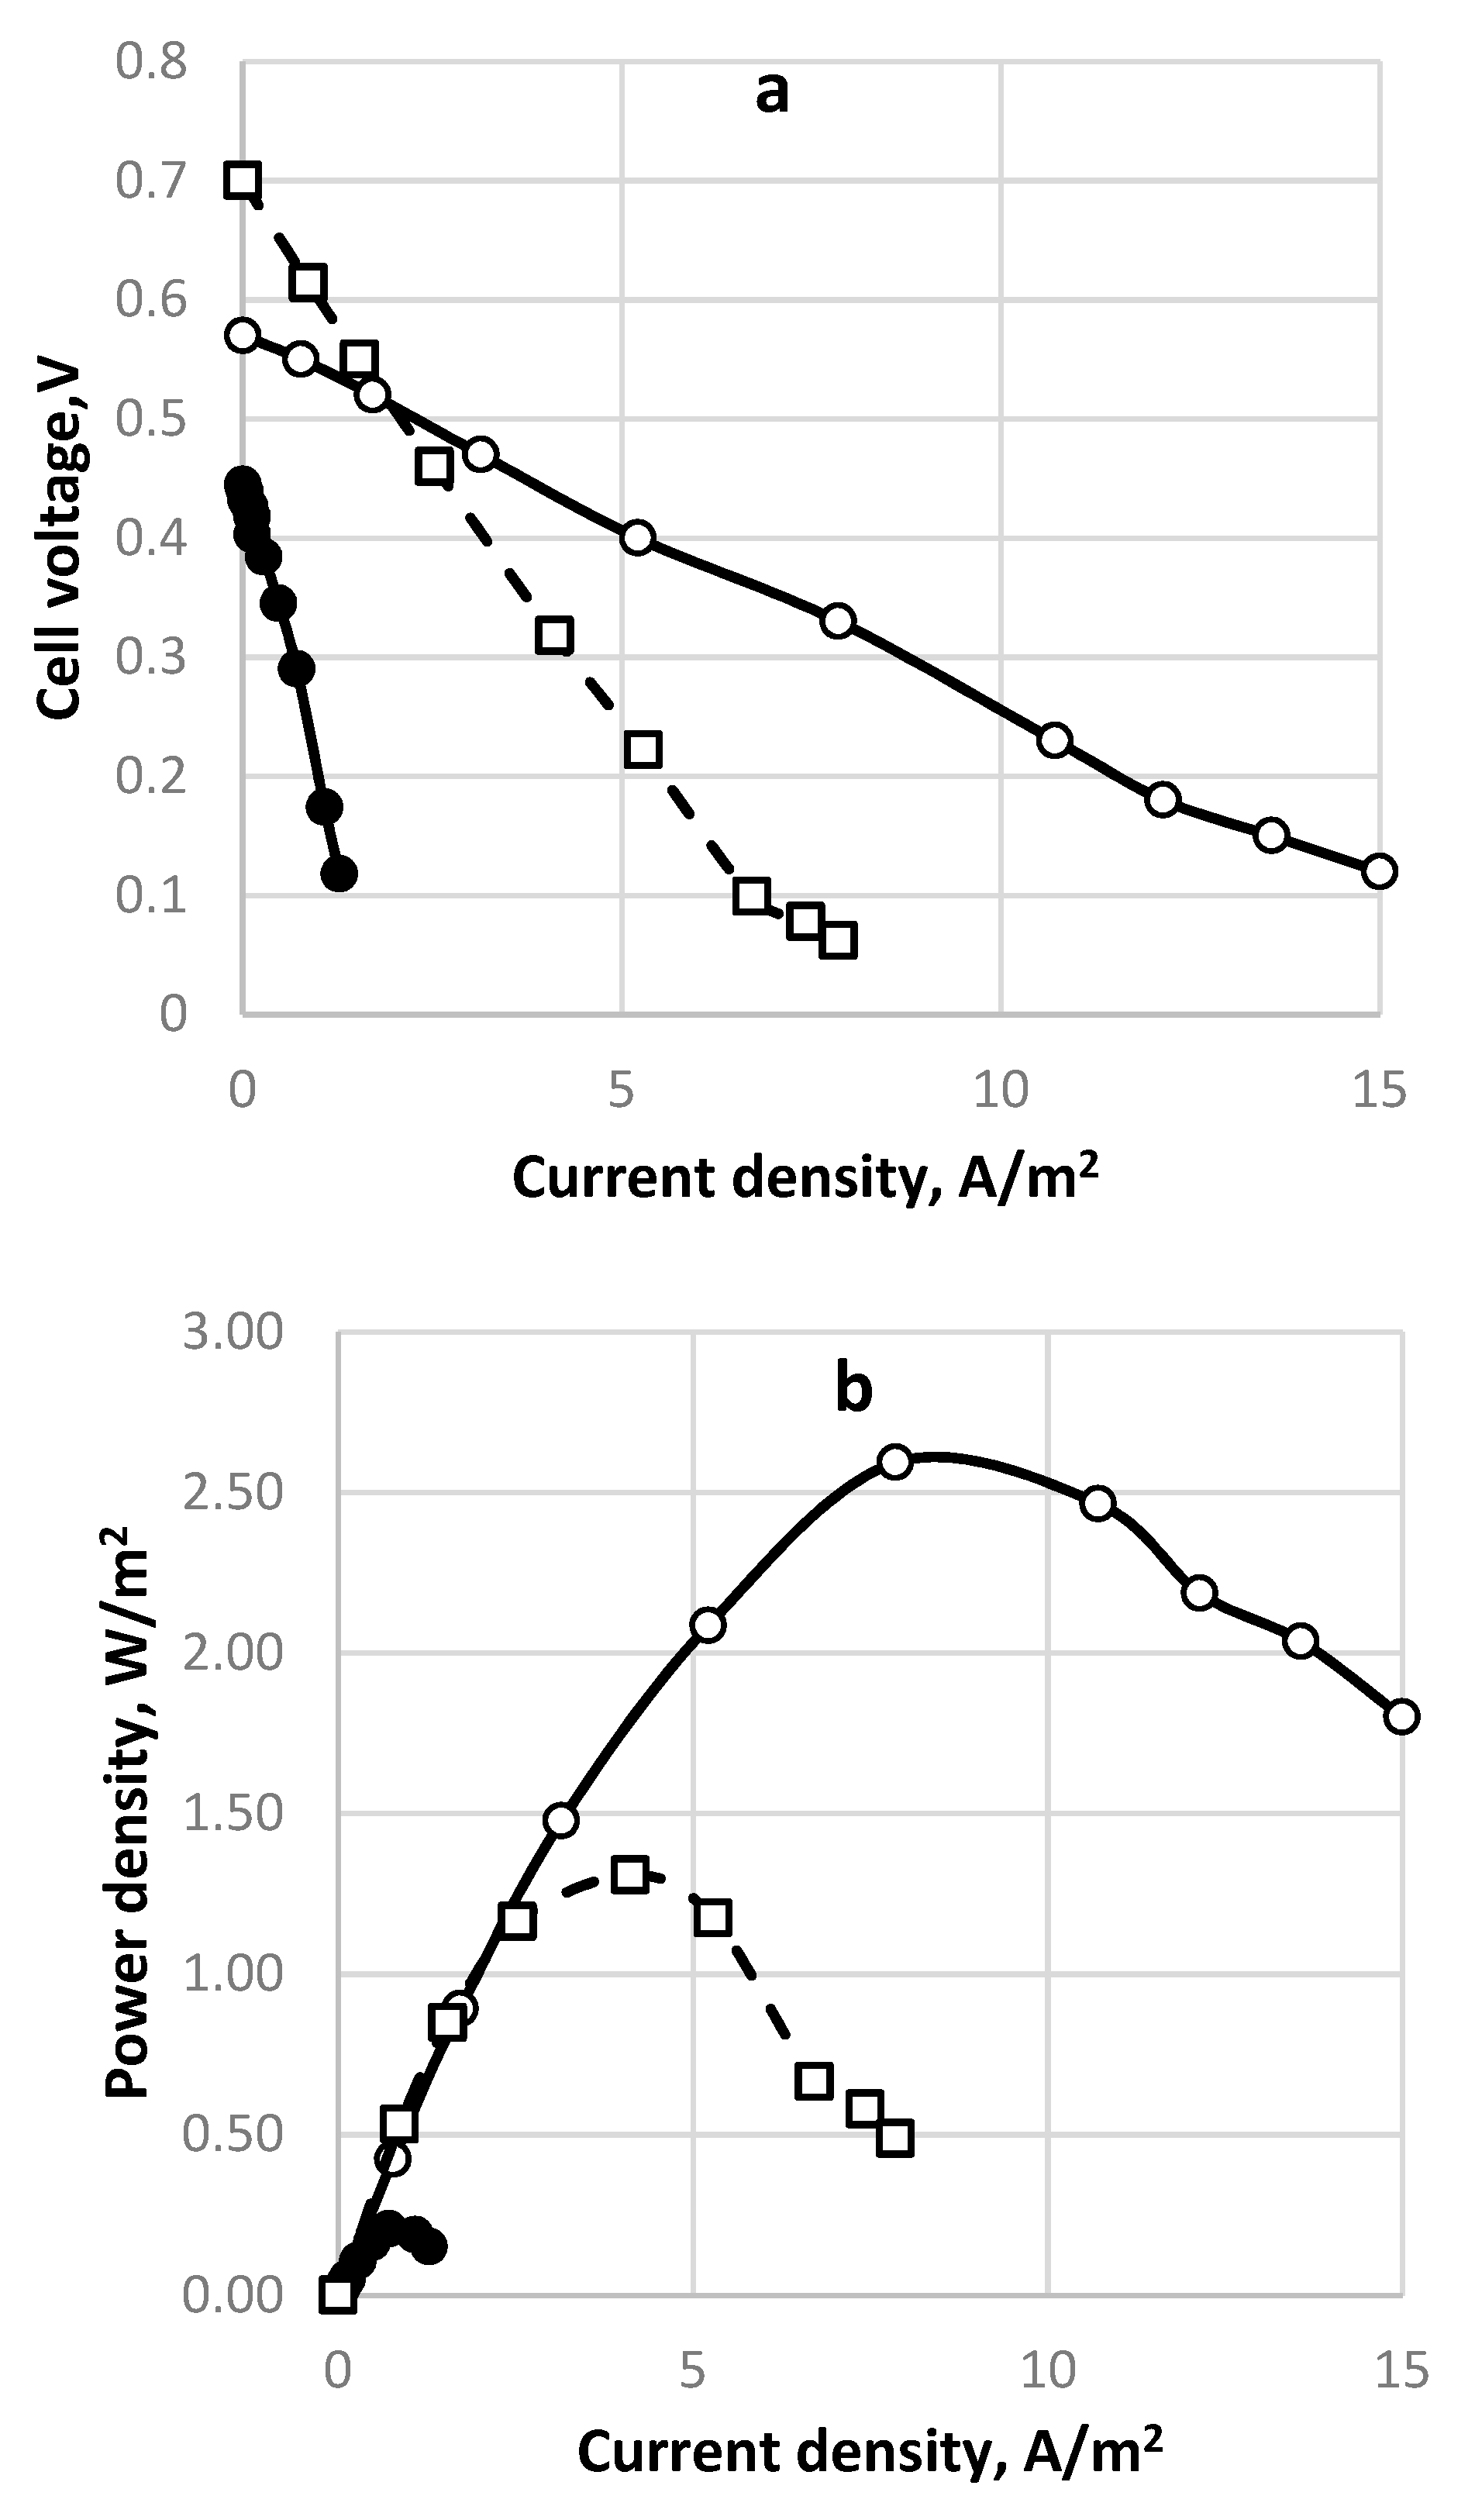
The electrochemical data were compared to those from the chemical analyses for different redox reactions with a different number of exchanged electrons, cf. Table 3. In addition, they were compared to the results of qualitative chemical analyses. It appeared that there was a range of optimum sulfide concentrations in which the current and power densities have maximum values. This is the range of 200–300 mg dm−3 sulfide concentration. At lower concentrations the electrochemical potential of the tested solution is low, although the sulfide to sulfate conversion is satisfactory. At higher concentrations parallel and not desired reactions like polysulfide and thio-compounds formation occur leading to reactions with a small number of exchanged electrons and therefore to a low current yield. These results are demonstrated in Figure 7. The superiority of the concentration of 240 mg dm−3 is evident.
Another interesting observation was that the pH of the outlet flow was lower than that of the inlet sulfide solution. The same effect was observed for the batch experiments, where the pH dropped during the process, signifying a pH drops inside the fuel cell owing to consumption of hydroxyl ions, i.e., the cell operation is accompanied by OH− exchange through the separation membrane, cf. Figure 1b.
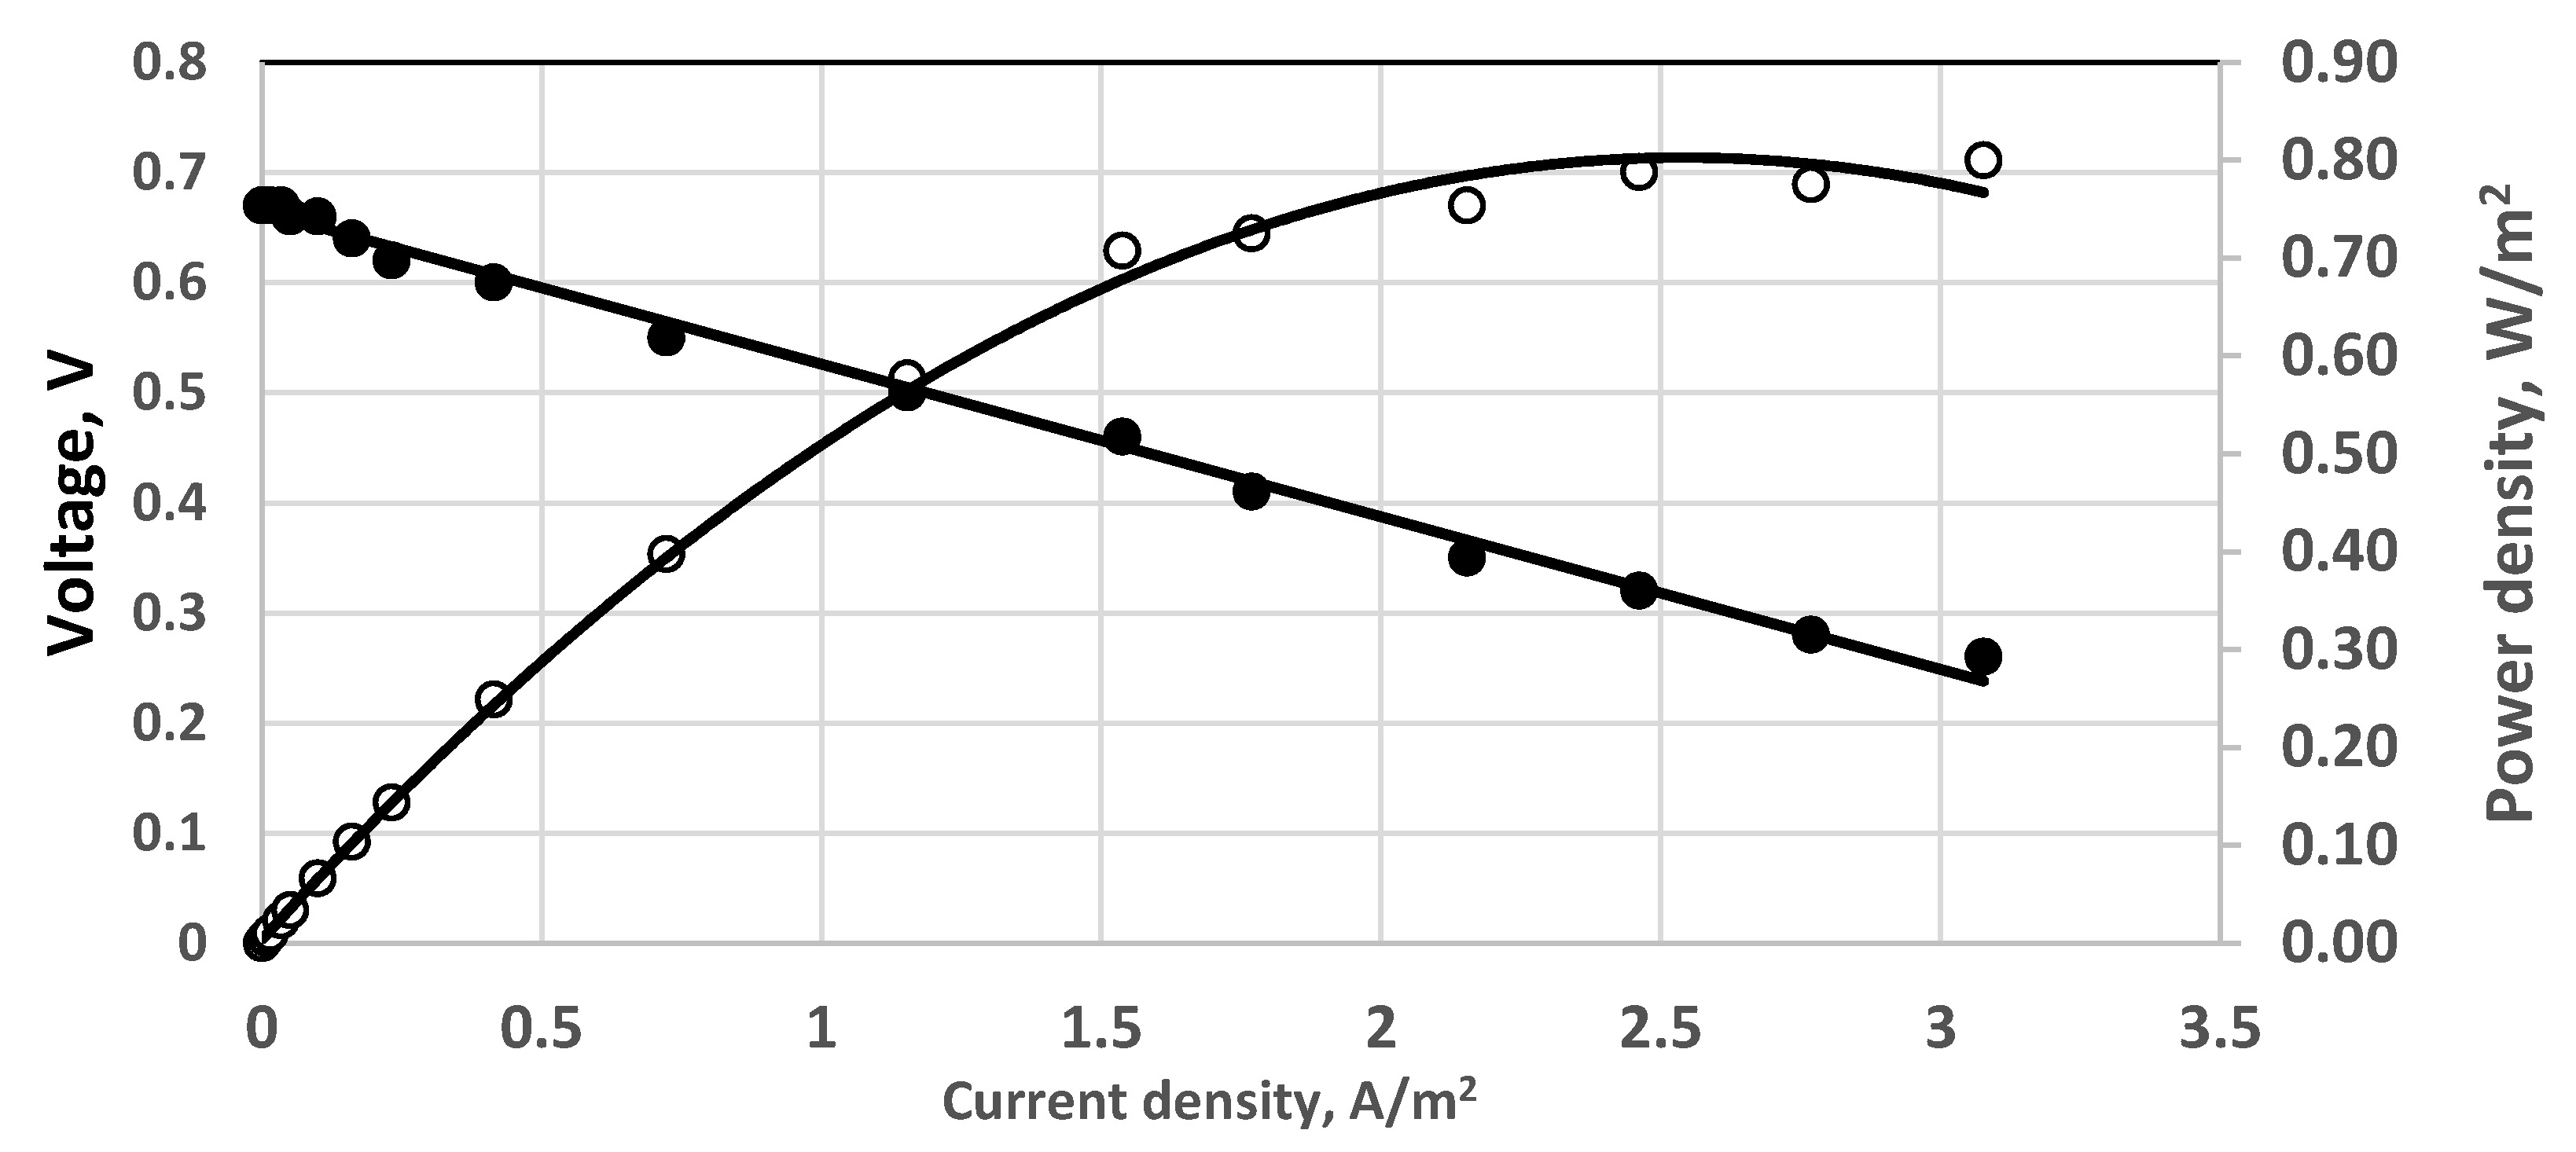
The polarization curve for a continuously operating SDFC is shown in Figure 8a. The time profile of a cell discharging at 10 Ohms external resistance is demonstrated in Figure 8b. The sulfide consumption calculated from the chemical analytical data is considered as 100% and is compared to the ones calculated by Faraday’s law from the measured electric currents for different numbers of exchanged electrons (Figure 9). In this case the fuel cell operated as a continuous stirred tank reactor (CSTR). In the specific situation, if SDFC operates with complete sulfide-to-sulfate oxidation the cell efficiency is 34%; if the product is only sulfite, it is 46%; if the oxidation product is only thiosulfate, the efficiency is 69%. Options of total sulfide-to-sulfur oxidation (with two exchanged electrons) and polysulfide formation (one exchanged electron) are unrealistic because the calculated current efficiencies are much higher than 100%. The open circuit potential in this case was 0.622 V. The qualitative analyses of the outlet samples show that there are predominantly sulfite and sulfate anions. At higher initial concentrations of sulfide (1000 mg/L and above) thiosulfate and polysulfide were also observed.
Of course, many redox reactions, including various numbers of exchanged electrons, are possible. However, the voltammetric data show that the maximum power density is attained at an electromotive force of about 0.3 V corresponding to efficiency of 29% with respect to the theoretical value (1.08 V), i.e., almost coinciding with the current efficiency for sulfide to sulfate oxidation. Another interesting aspect of the results is the linear dependence between the current density and the cell voltage, i.e., the Ohmic resistance prevails over the whole range of current densities. This means that the resistances due to overpotential and mass transfer are small.
A comparison of current densities as demonstrated in this presentation, to data supplied by other authors can be found in Table 4. The comparison shows modest values in comparison to the ones measured for a fuel cell with gas oxygen electrode and 3 M NaOH as supporting electrolyte in the anode compartment [23]. This is explained by the fact that the processes in the present study are in liquid phase, with solute diffusivities of a much lower value than in gaseous phase. Hence the higher mass transfer resistances. On the other hand, however, in the present case the use of sodium hydroxide as a supporting electrolyte is out of the question owing to the sensitive environment of marine water.
Our results prove comparable, sometimes better than those presented by Iordache et al. [24]. In referent literature quoted here, all but one (paper [21]) report on sulfide to sulfur conversion only.
Dutta et al. [21] use a fuel cell to oxidize sulfide to sulfur with potassium hexacyanoferrate (III) as electron acceptor. Their results are related in terms of current and power densities to unit volume. The comparison to our results along those lines shows the following:
In the present work (fuel cells with 100 sq. cm cross-section area):
Conditions: 250 mg dm−3 sulfide, 16 mg dm−3 sodium chloride; oxygen as electron acceptor: GAC particles in the cathode compartment.
Current density per cubic meter; 3000 A/m3 (for the total anodic compartment);
Power density per cubic meter under the same conditions: 810 W/m3 (for the total anodic compartment).
By Dutta et al. [21]:
Conditions: 100 mg dm−3 sulfide, phosphate buffer as electrolyte; potassium hexacyanoferrate (III) as electron acceptor. Graphite granules in both fuel cell compartments.
Current density per cubic meter: 400 A/m3 (for the net anodic compartment);
Power density per cubic meter under the same conditions: 160 W/m3 (for the net anode compartment).
3.2. Overpotential Measurements
The overpotentials were estimated from the difference between the voltage intercept on the ordinate at linear extrapolation and the measured open circuit potential. To this end, the linearized Butler-Volmer equation, valid for very low overpotentials, was used. The polarization curves show that overpotentials are modest, even low, i.e., less than 10 mV in any case. One polarization curve obtained at 230 mg dm−3 initial concentrations of sulfide is presented in Figure 10. The open circuit potential extrapolated from the experimental data is 0.665 V, which is lower than the measured one, i.e., 0.67 V. The overpotential in this case is 0.005 V. The overpotential of 0.0155 V is the highest one observed in the present work.
3.3. Effect of Aeration Type
The effect of preliminary saturation by air in an ejector of Venturi type is shown in Figure 11. In terms of power density, the results seem better than those obtained by direct aeration, cf. Figure 10. Both experiments were carried out under the same conditions in the same fuel cell.
The situation in the small-size cylindrical fuel cell was different. Some results obtained by simple direct aeration in the cathode space of this fuel cell are shown in Figure 12. Obviously, in this case direct aeration was better than the sophisticated Venturi tube because two times higher power density was attained. However, the direct aeration was accomplished in a small-scale fuel cell, i.e., cathode space of 80 cm3.
3.4. Study with Different Membranes
In this work three types of membranes have been tested as separators in the fuel cell. Two of them are strictly anion-exchange ones (Fumapem* FFA-3-PK-75 (OH−form) and Neosepta* AFN). The third one, Celgard 3501 has been found suitable to conducting either protons or OH− anions.
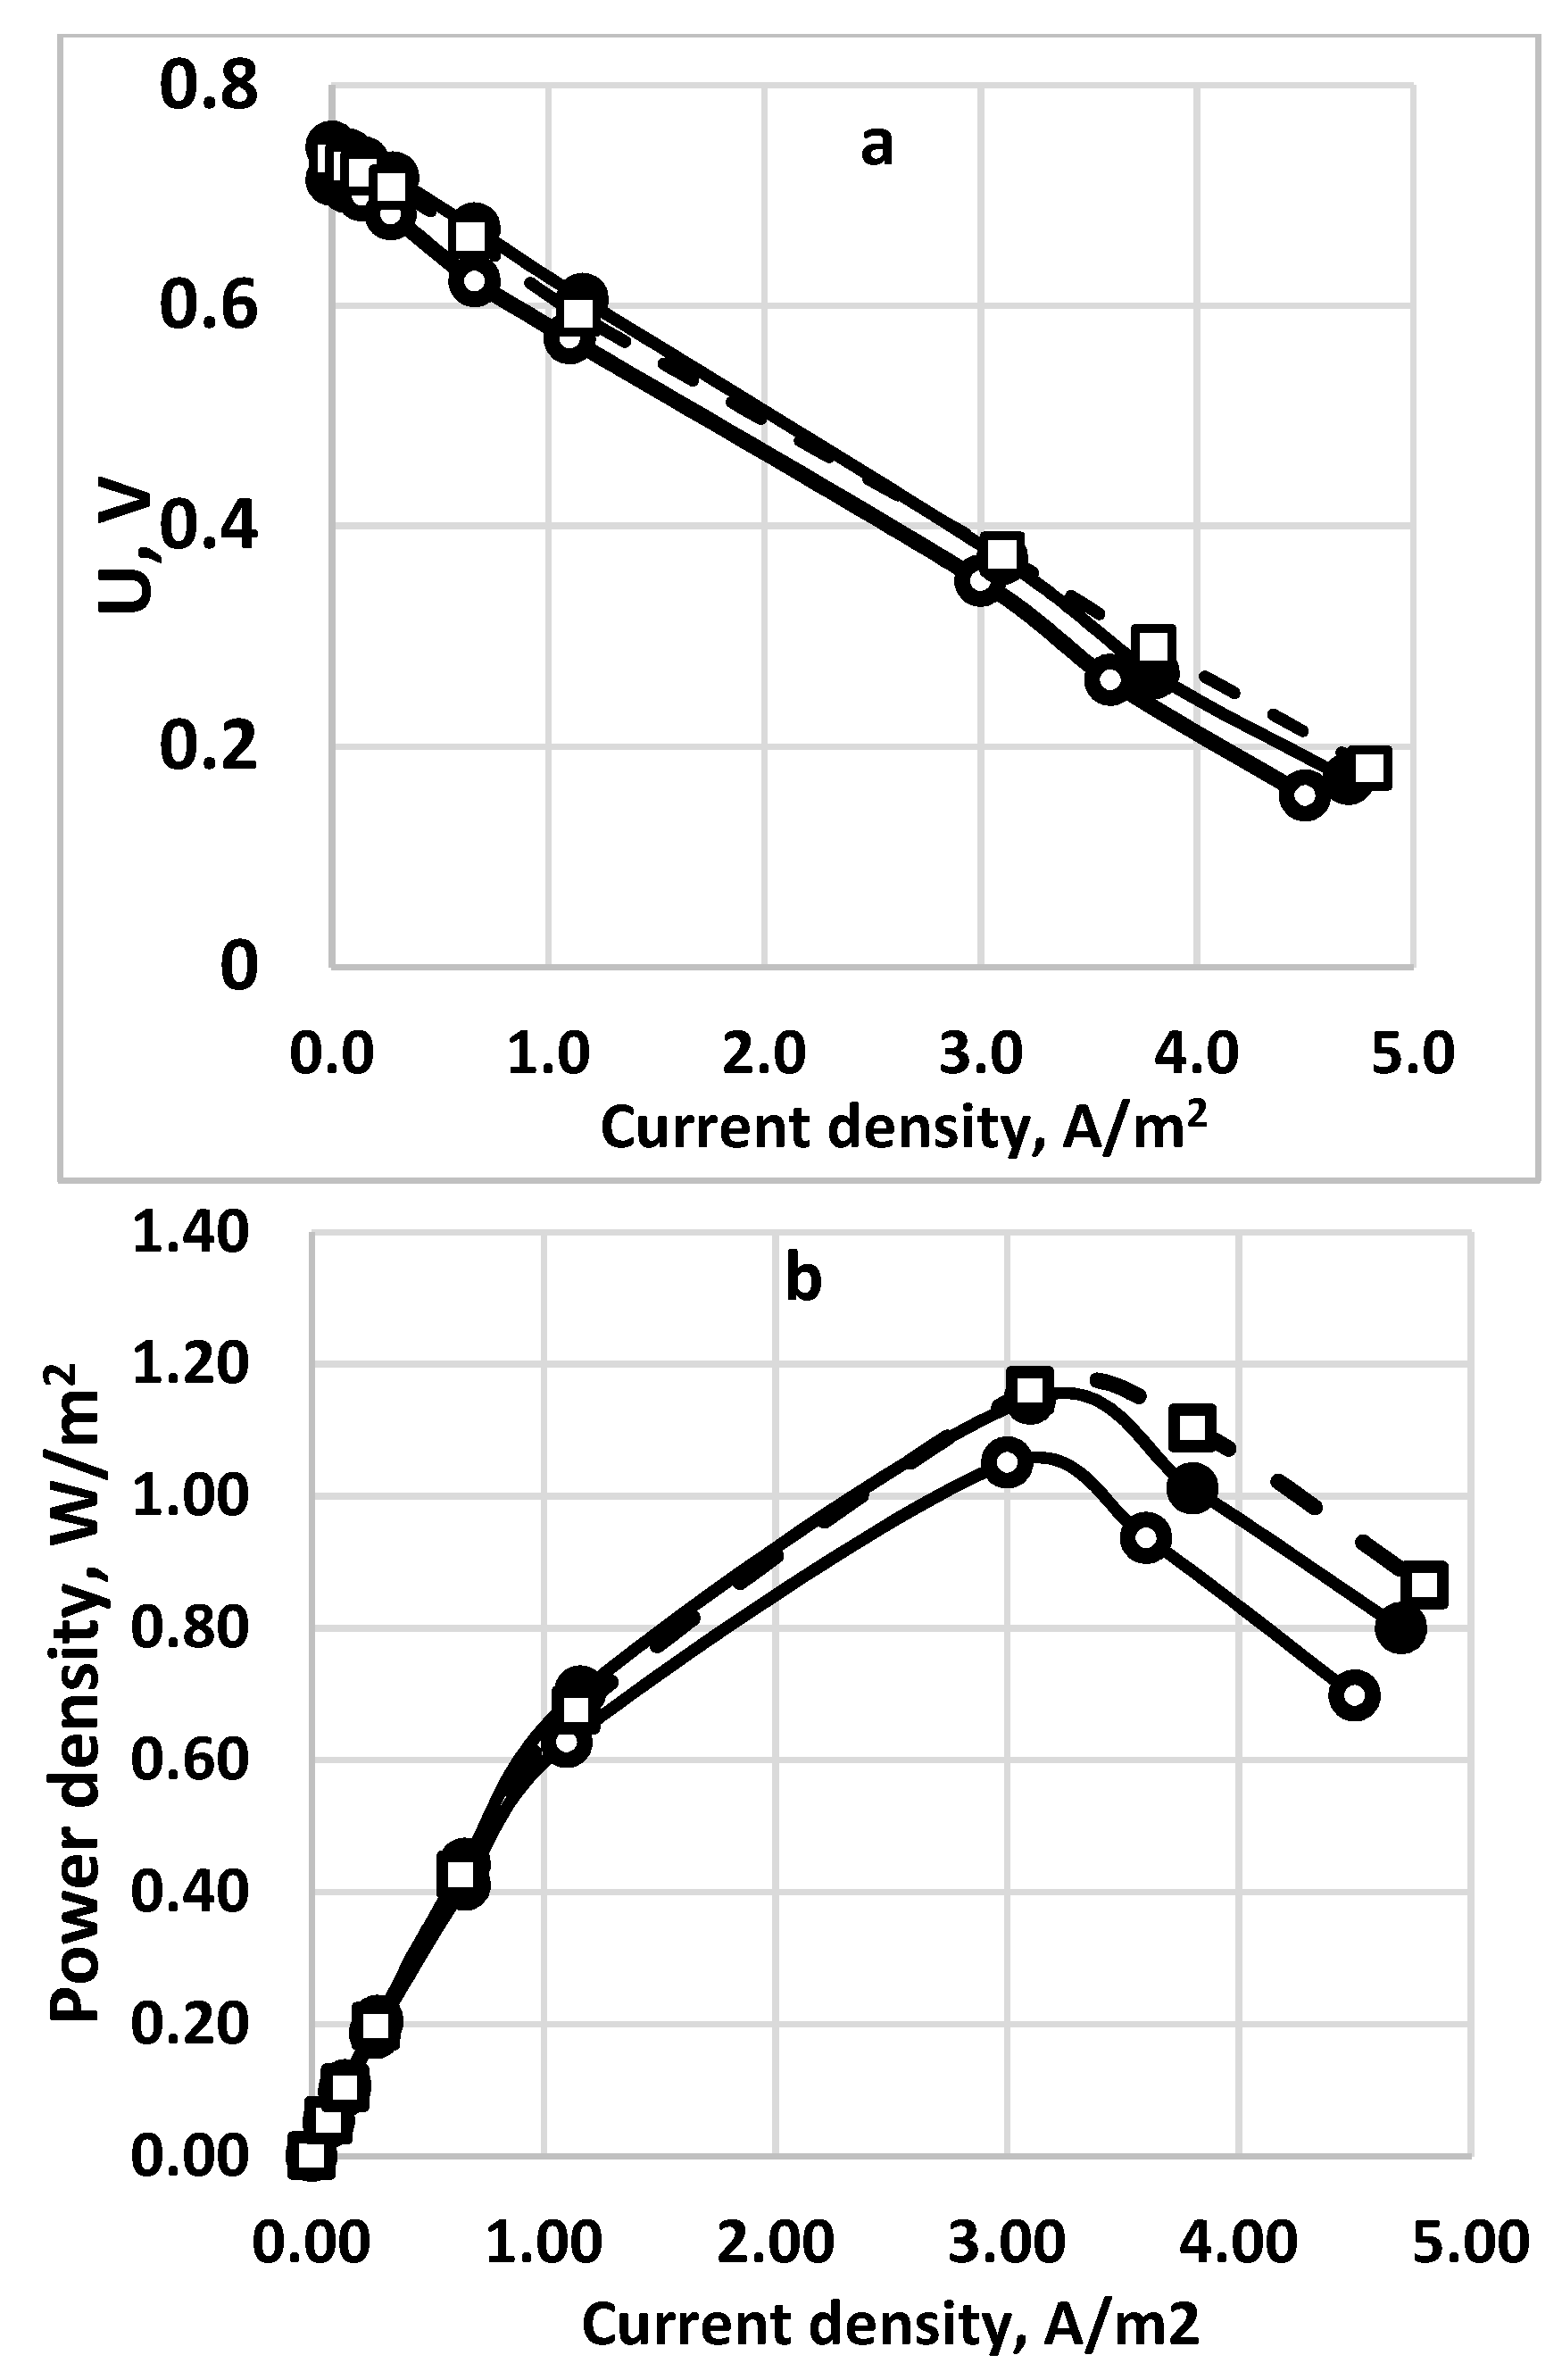
The experiments have been carried out in a rectangular fuel cell with a cross-section of 100 sq. cm. The polarization curves with the power density data are shown in Figure 13a,b. All three membranes show similar results with a slight superiority of the Fumapem one.
Importantly, this type of membranes is characterized by their ionic conductivity σ. It is reciprocal to the specific material resistance. The temperature dependence of the membranes has the following exponential form [31]:
σT ~ exp(−Ea/RT), [σT] = mS·cm−1 K
The conductivity of the tested membranes was estimated from the polarization curves, taking the total Ohmic resistance of the fuel cell and then calculating its specific conductivity at a certain temperature. Of course, such calculation gives the total fuel cell resistance including the solution resistance, as well as the one of the electrodes, due to mass transfer, etc. However, in our case it also gives an idea about the applicability of each membrane.
A comparison of the membrane conductivities with those obtained for solid membranes operating in fuel cells with hydrogen and oxygen is gaseous phase is shown in Figure 14 in an Arrhenius logarithmic plot. (The reference data are taken from Reference [30], pp. 154–196). They deal with gadolinium doped ceria and ytria doped zirconia for the temperature range of 550–1250 °C.
Although our experiments were carried out at ambient temperature the overall cell conductivity for all of the tested membranes seems better compared to the solid membranes used for gaseous phase fuel cells. The estimated overall fuel cell conductivities for the three membranes are 0.4 ÷ 2.8 mS·cm−1 for the Celgard 3501 membrane; 7.7 mS·cm−1 for the Fumapem membrane and 1.9 mS·cm−1 for the Neosepta membrane. As a reference, the specific electric conductivity of sodium chloride (supporting electrolyte in our case) is about 67 mS·cm−1 for the concentration used [33].
The durability of the tested membranes was assessed by measuring the overall cell conductivities in time. For the Celgard 3501 membrane this conductivity decreased from 2.8 to 0.4 mS.cm−1 after forty experiments.
The other two membranes were sensitive to alkaline media, which explained why their conductivity decreased more rapidly. Thus, the specific cell conductivity for the Fumapem membrane dropped from 35 to 0.4 mS·cm−1, being 7.7 mS·cm−1 on the average.
The optimum pH range for the Neosepta membrane is from 0 to 10. It means that pH values at the edge or out of this range might damage the membrane. That is why, in this type of membrane, repeated runs lead to worse results for cell conductivity.
In the case of Neosepta membrane the estimated overpotential was 4 mV, whereas for the other two it was approximately 1 mV.
3.5. Stack and Consecutive Fuel Cell Performance
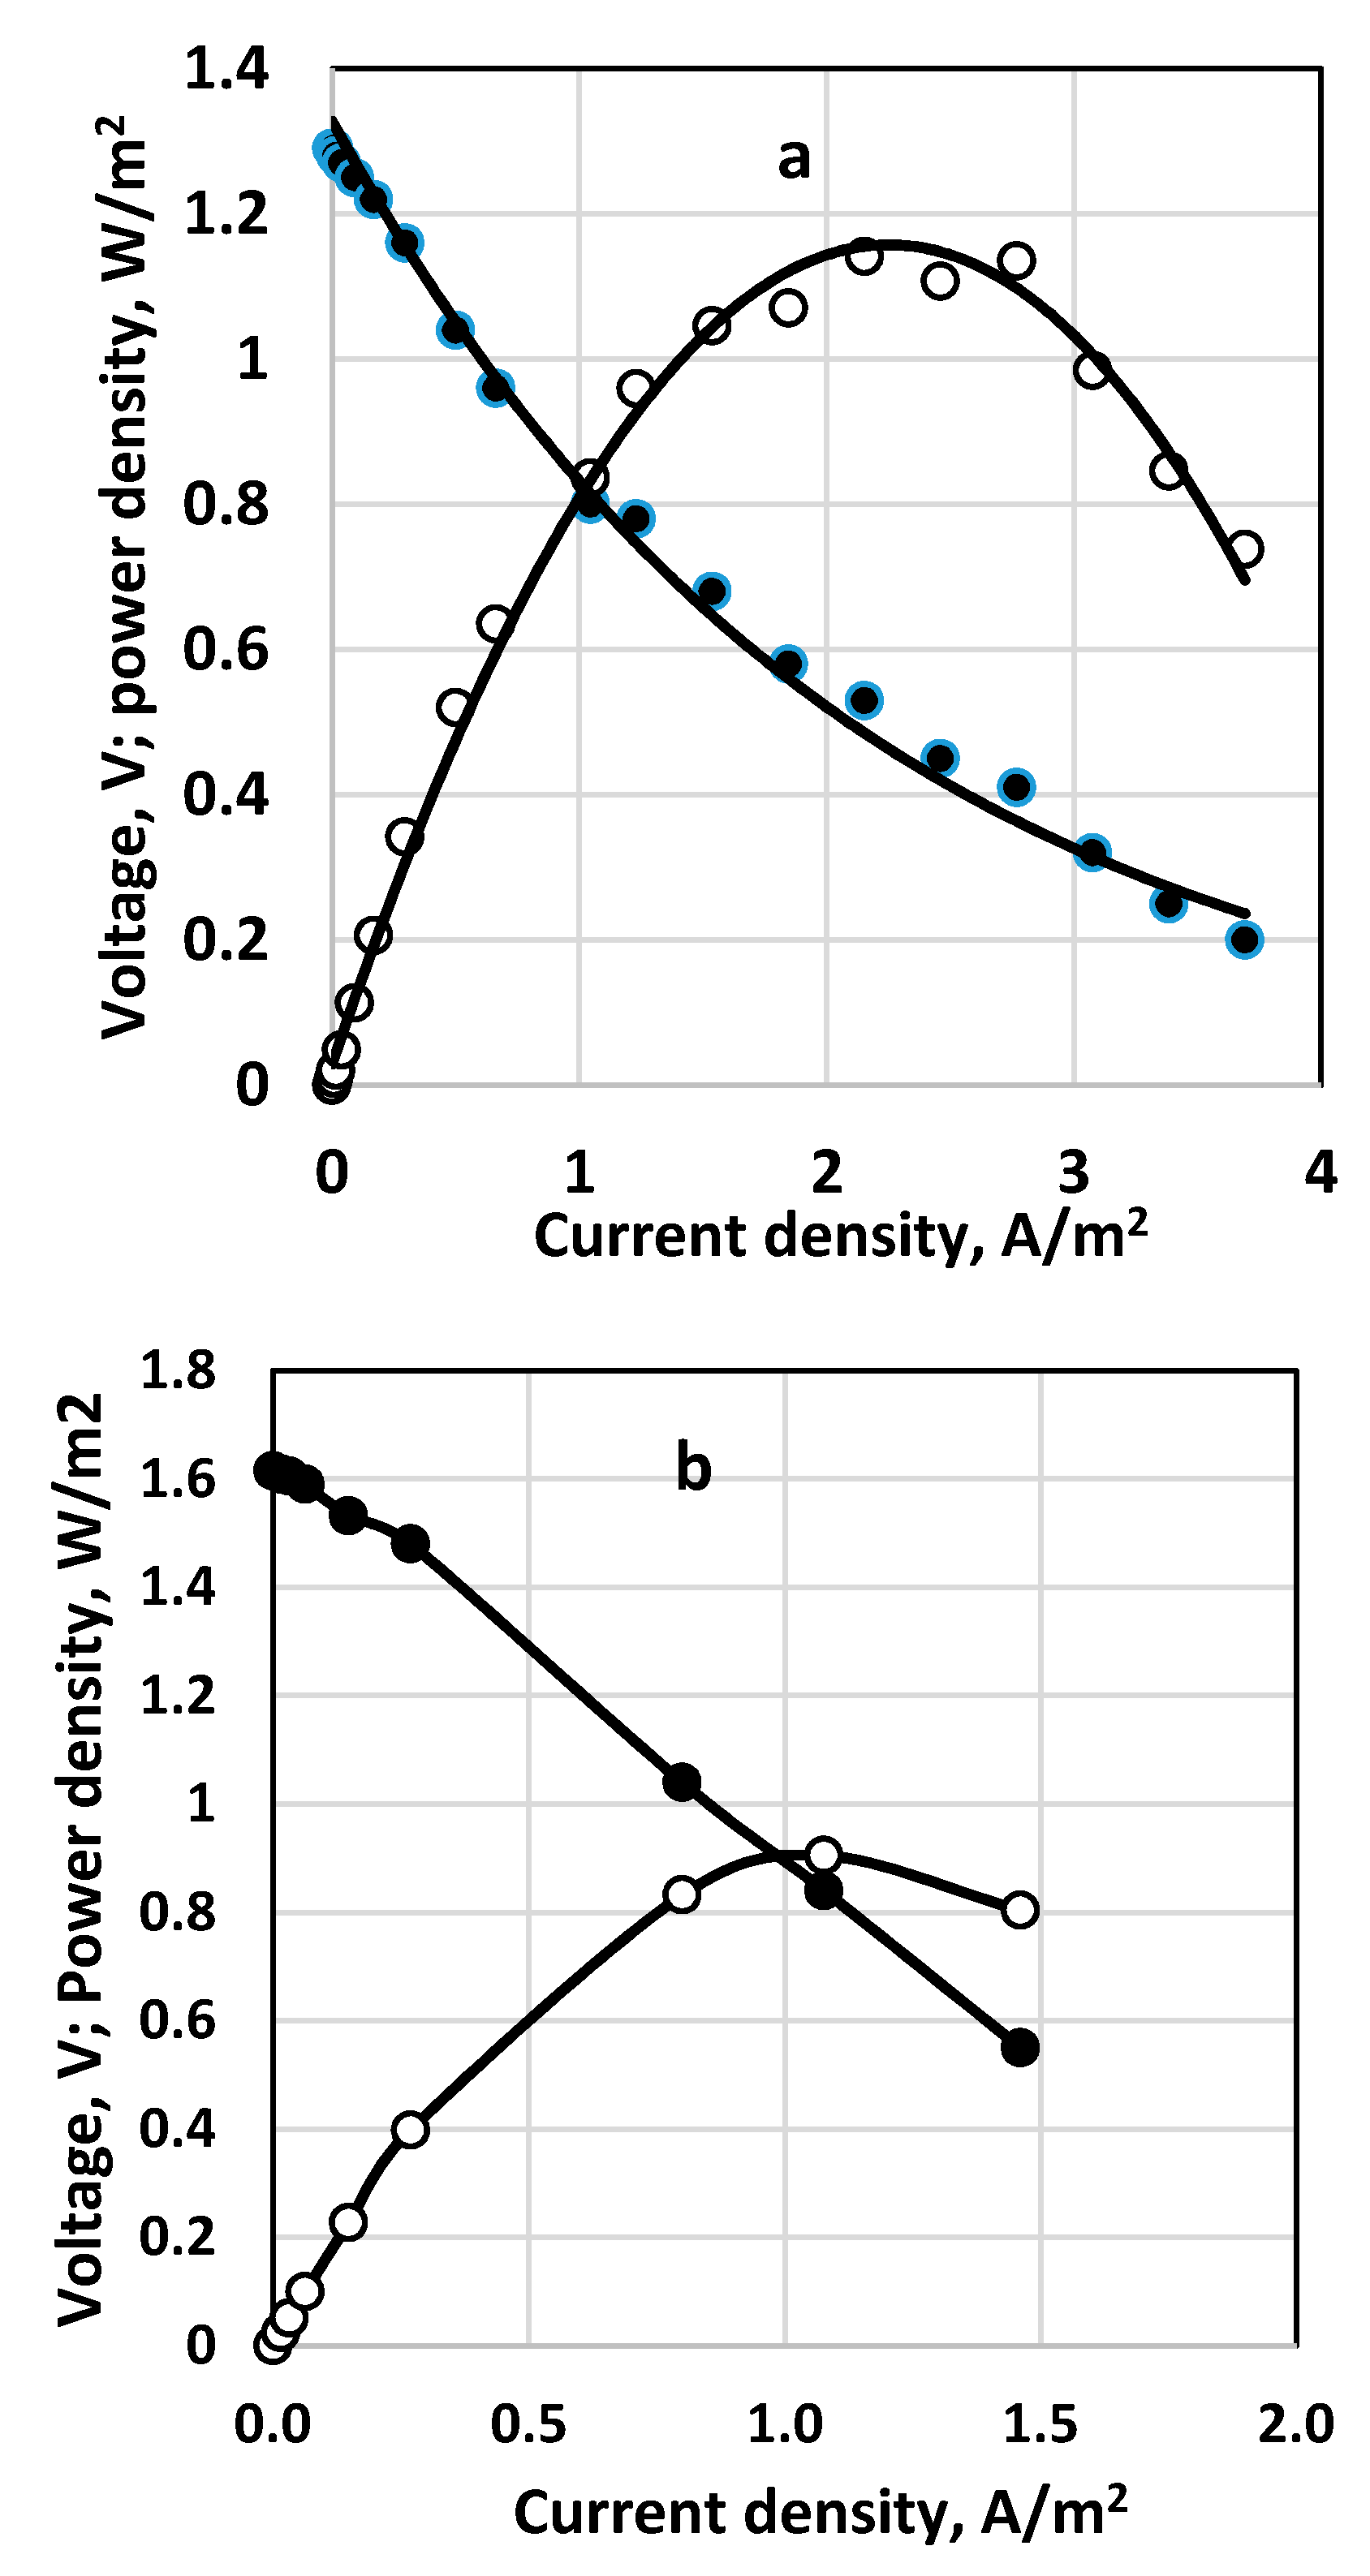
The results for polarization curves obtained for parallel two-stack fuel cells and two consecutively coupled ones are shown in Figure 15a,b, respectively. The parallel coupling of the fuel cells in a stack (Figure 15a) leads to somewhat higher current and power density compared to the consecutively coupled cells (cf. Figure 15b), with residual thiosulfate and polysulfide in the outlet flow. However, at the outlet solution of the second cell of the consecutively coupled fuel cells only sulfate and a small amount of sulfite were detected. In this case complete consumption of sulfide was registered.
For those two experiments the following averaged fuel cell efficiency was estimated (according to Equation (4)). For the stack of two parallel fuel cells: ε = 0.78; for the consecutively coupled fuel cells: ε = 0.36.
As demonstrated by Table 5, the comparison of selected experiments characteristics differing in cell geometry, size, type of aeration and flow organization showed best results in current and power density for the small cylindrical cell. In this case best sulfide consumption was also observed.
Direct aeration shows better performance compared to the aeration by Venturi ejector with comparable cell efficiency.
The stack and cascade assemblies give comparable current and power density values, the cell efficiency for the parallel cell assembly is two times higher than the cascade one.
Theoretically 1 cubic meter of marine water per second containing 20 g m−3 sulfide will yield power of 500 kW. However, the estimated current and power density values in our case are much lower than the ones accepted for traditional hydrogen/oxygen PEMFC at 350 K (i.e., about 0.1 A/cm2 for hydrogen and 10−4 A/cm2 for oxygen reduction) and area-specific resistance ASR = 0.01 Ω cm2 (cf. [30], p. 198). One must keep in mind that traditional cells operate at high temperatures and in gaseous phase, where the diffusivities and the reaction rates are much higher. However, a power density of 10 W/m2 will lead to 1 kW per cubic meter, which seems to be attractive for small scale practical applications. An increase of the current density to 100 A/m2 will lead to power density of 50 W/m2 at voltage cell efficiency of 50%.
Efforts should be made therefore to enhance electrode reactions and minimize parasitic reactions in the bulk; as well as to reduce the overall cell resistance.
4. Conclusions
- Hydrogen sulfide is a prospective fuel, being a substrate of a liquid-phase fuel cell operating in sulfide form in aqueous media. It is suitable to use in water basins rich in hydrogen sulfide, as it can be relied on to simultaneously produce electric energy and cleanse water.
- Operational parameters of the tested fuel cell show reasonable current and power yields especially for sulfide concentrations in the medium range of 200–300 mg dm−3. The concentration of sulfite and sulfate ions provides for the main products of the electrochemical processes. Above this range parasitic reactions take place, i.e., polysulfide and thio-compounds with low power yield are obtained. Conversion rate is relatively low, (around 30%). Therefore, efforts should be made to increase sulfide to sulfate conversion rate. Further minimization of parasitic reactions in the bulk is required.
- Three different ion-exchange membranes were tested. In all cases the total cell resistance was found to be lower than some reference values. Fumapem and Neosepta membranes showed high sensitivity to hydroxyl ions whereas Celgard 3501 showed better durability.
- However, the achieved current and power densities are still low, and cannot compete with the traditional fuel cells. Efforts should be directed to further reduction of cell resistance by different methods such as membrane selection, new catalyst application to speed-up oxidation and reduction processes to improve the aeration system, etc.
Author Contributions
Conceptualization: V.B.; Methodology: V.B., E.R.-V., M.M.; Validation: E.R.-V., M.M., S.S.; Investigation: E.R.-V., M.M., S.S.; Writing—Original Draft Preparation: V.B.; Project Administration & Funding Acquisition: V.B.
Funding
The research and work presentation were supported by the Scientific Research Fund of The Republic of Bulgaria, Grant DN 07/7.
Acknowledgments
The authors are grateful to Maria Stoycheva (Institute of Electrochemistry and Energy Systems, BAS) for the SEM imaging and to M. Tarassov, PhD (Institute of Mineralogy and Crystallography, BAS) for the accomplished EDS analysis.
Conflicts of Interest
The authors declare no conflict of interest.
References
- Rozhdestvenskiy, A. Hydrochemistry of the Bulgarian Sector of the Black Sea (in Bulgarian); Publishing House of the Bulgarian Academy of Science: Sofia, Bulgaria, 1986; pp. 145–150. [Google Scholar]
- Midilli, A.; Ay, M.; Kale, A.; Nejat Veziroglu, T. A parametric investigation of hydrogen energy potential based on H2S in Black Sea deep waters. Int. J. Hydrogen Energy 2007, 32, 117–124. [Google Scholar] [CrossRef]
- Neklyudov, I.K.; Bortz, B.V.; Polevich, O.W.; Tkachenko, V.I.; Shilyaev, B.A. Alternative hydrogen sulfide energetics in the Black Sea. Part I. State of the art, problems and perspectives (in Russian). Int. Sci. J. Altern. Energy Ecol. (ISJAEE) 2006, 12, 23–30. [Google Scholar]
- Ouali, S.; Chader, S.; Belhamel, M.; Benziada, M. The exploitation of hydrogen sulfide for hydrogen production in geothermal areas. Int. J. Hydrogen Energy 2011, 36, 4103–4109. [Google Scholar] [CrossRef]
- Linga Reddy, E.; Biju, V.M.; Challapalli, S. Production of hydrogen and sulfur from hydrogen sulfide assisted by nonthermal plasma. Appl. Energy 2012, 95, 87–92. [Google Scholar] [CrossRef]
- Vasilevsky, V.V.; Gutsevich, E.I.; Rusanov, V.D. Problems of hydrogen sulfide and its treatment in the Black Sea. Khim. Vys. Energy 1995, 25, 382–386. (In Russian) [Google Scholar]
- Mahmadmuratov, A.; Gruzdkov, Y.A.; Savinov, E.N. Photocatalytical decomposition of cadmium and zinc sulfides immobilized on cation-exchange thin film (in Russian). Kinet. Catal. 1986, 27, 133–136. [Google Scholar]
- Diver, R.B.; Fletcher, E.A. Hydrogen and sulfur from H2S—III. The economics of a quench process. Energy 1985, 10, 831–842. [Google Scholar] [CrossRef]
- Beschkov, V.; Razkazova-Velkova, E. Utilization of sulphide from Black Sea water by electrolysis. Int. J. Curr. Chem. 2010, 1, 7–15. [Google Scholar]
- Ipsakis, D.; Kraia, T.; Konsolakis, M.; Marnellos, G. Remediation of Black Sea ecosystem and pure H2 generation via H2S-H2O co-electrolysis in a proton-conducting membrane cell stack reactor: A feasibility study of the integrated and autonomous approach. Renew. Energy 2018, 125, 806–818. [Google Scholar] [CrossRef]
- Bogautdinov, A.Z.; Eremenko, Y.I.; Rusanov, V.D. Testing of plasmochemical unit Orenburg’s bench for H2S-containing gases treatment. VANT 1991, 2, 5–7. [Google Scholar]
- Naman, S.A.; Ture, I.E.; Veziroglu, T.N. Industrial extraction pilot plant for stripping H2S gas from Black Sea water. Int. J. Hydrogen Energy 2008, 33, 6577–6585. [Google Scholar] [CrossRef]
- Ipsakis, D.; Kraia, T.; Marnellos, G.E.; Ouzounidou, M.; Voutetakis, S.; Dittmeyer, R.; Dubbe, A.; Haas-Santo, K.; Konsolakis, M.; Figen, H.E.; et al. An electrocatalytic membrane-assisted process for hydrogen production from H2S in Black Sea: Preliminary results. Int. J. Hydrogen Energy 2015, 40, 7530–7538. [Google Scholar] [CrossRef]
- Kirk, T.J.; Winnick, J. A hydrogen sulfide solid-oxide fuel cell using ceria-based electrolytes. J. Electrochem. Soc. 1993, 140, 3494–3496. [Google Scholar] [CrossRef]
- Aguilar, L.; Zha, S.; Cheng, Z.; Winnick, J.; Liu, M. A solid oxide fuel cell operating on hydrogen sulfide (H2S) and sulfur-containing fuels. J. Power Sources 2004, 135, 17–24. [Google Scholar] [CrossRef]
- Chuang, K.T.; Luo, J.; Sanger, A.R. Evolution of fuel cells powered by H2S-containing gases. Chem. Ind. Chem. Eng. Q. 2008, 14, 69–76. [Google Scholar] [CrossRef]
- Beschkov, V.; Hristov, V.; Petkov, P. Energy Yield from Sulfide Containing Marine Water. B.G. Patent No. 1775/25.11.2013, Ref. No. 2352/14.02.2013.
- Beschkov, V.; Razkazova-Velkova, E.; Vlaev, S.D.; Martinov, M.; Petkov, P.; Raicheff, R. Method of Oxidation of Sulfide Ions in Fuel Cells. B.G. Patent Application Ref. No. 111367/17.12.2012.
- U.S. Energy Information Administration. Capital Cost Estimates for Utility Scale Electricity Generating Plants; U.S. Energy Information Administration: Washington, DC, USA, 2016; pp. 7–8. Available online: https://www.eia.gov/analysis/studies/powerplants/capitalcost/pdf/capcost_assumption.pdf (accessed on 29 August 2018).
- Tarjanne, R.; Kivistö, A. Comparison of Electricity Generation Costs; Lappeenranta University of Technology: Lappeenranta, Finland, 2008; pp. 8–9. [Google Scholar]
- Dutta, P.K.; Rabaey, K.; Yuan, Z.; Keller, J. Spontaneous electrochemical removal of aqueous sulfide. Water Res. 2008, 42, 4965–4975. [Google Scholar] [CrossRef] [PubMed]
- Zhai, L.-F.; Song, W.; Tong, Z.-H.; Sun, M. A fuel-cell-assisted iron redox process for simultaneous sulfur recovery and electricity production from synthetic sulfide wastewater. J. Hazard. Mater. 2012, 243, 350–356. [Google Scholar] [CrossRef] [PubMed]
- Kim, K.; Han, J.-I. Performance of direct alkaline sulfide fuel cell without sulfur deposition of anode. Int. J. Hydrogen Energy 2014, 39, 7142–7146. [Google Scholar] [CrossRef]
- Iordache, S.M.; Ciocanea, A.; Balan, A.; Stamatin, I.; Budea, S.; Ceaus, C.; Trefilov, A.M.I.; Voinea, S. Recovering hydrogen sulfide from sulfurous waters with PEM fuel cells. Energy Procedia 2016, 85, 273–278. [Google Scholar] [CrossRef]
- Petrov, K.; Baykara, S.Z.; Ebrasu, D.; Gulin, M.; Veziroglu, A. An assessment of electrolytic hydrogen production from H2S in Black Sea waters. Int. J. Hydrogen Energy 2011, 36, 8936–8942. [Google Scholar] [CrossRef]
- Fukuzumi, S.; Lee, Y.-M.; Nam, W. Fuel production from seawater and fuel cells using seawater. ChemSusChem 2017, 10, 4264–4276. [Google Scholar] [CrossRef] [PubMed]
- Suhotin, A.M. Guidebook on Electrochemistry (in Russian); Himia: Leningrad, Russia, 1981. [Google Scholar]
- Romero Cotrino, A. Control of Hydrogen Sulfide from Groundwater Using Packed-Bed Anion Exchange and Other Technologies. Master’s Thesis, University of South Florida, Tampa, FL, USA, 2006; p. 8. [Google Scholar]
- Chakraborty, U.K. Reversible and irreversible potentials and an inaccuracy in popular models in the fuel cell literature. Energies 2018, 11, 1851. [Google Scholar] [CrossRef]
- O’Hayre, R.P.; Cha, S.-W.; Colella, W.G.; Prinz, F.B. Fuel Cell Fundamentals, 2nd ed.; John Wiley & Sons, Inc.: Hoboken, NJ, USA, 2009; pp. 59–64. ISBN 978-0-470-25843-9. [Google Scholar]
- Merle, G.; Wessling, M.; Nijmeijer, K. Anion exchange membranes for alkaline fuel cells: A review. J. Membr. Sci. 2011, 377, 1–35. [Google Scholar] [CrossRef]
- Rees, T.D.; Gyllenpetz, A.B.; Docherty, A.C. The determination of trace amounts of sulphide in condensed steam with N-diethyl-P-phenylenediamine. Analyst 1971, 96, 201–208. [Google Scholar] [CrossRef]
- Dobos, D. Electrochemical Data (a Russian edition); Mir: Moscow, Russia, 1980; p. 34. [Google Scholar]
Figure 1.
Working principle of a sulfide-driven fuel cell associated with proton (a) and OH− (b) exchange across the membrane.
Figure 1.
Working principle of a sulfide-driven fuel cell associated with proton (a) and OH− (b) exchange across the membrane.

Figure 2.
Distribution of different forms of sulfide ions depending on the pH value [28].
Figure 2.
Distribution of different forms of sulfide ions depending on the pH value [28].

Figure 3.
SEM images at different magnifications of granulated activated carbon used in the cathode area. (a) Magnification ×500; (b) magnification ×1000; (c) magnification ×2000; (d) magnification ×5000.
Figure 3.
SEM images at different magnifications of granulated activated carbon used in the cathode area. (a) Magnification ×500; (b) magnification ×1000; (c) magnification ×2000; (d) magnification ×5000.
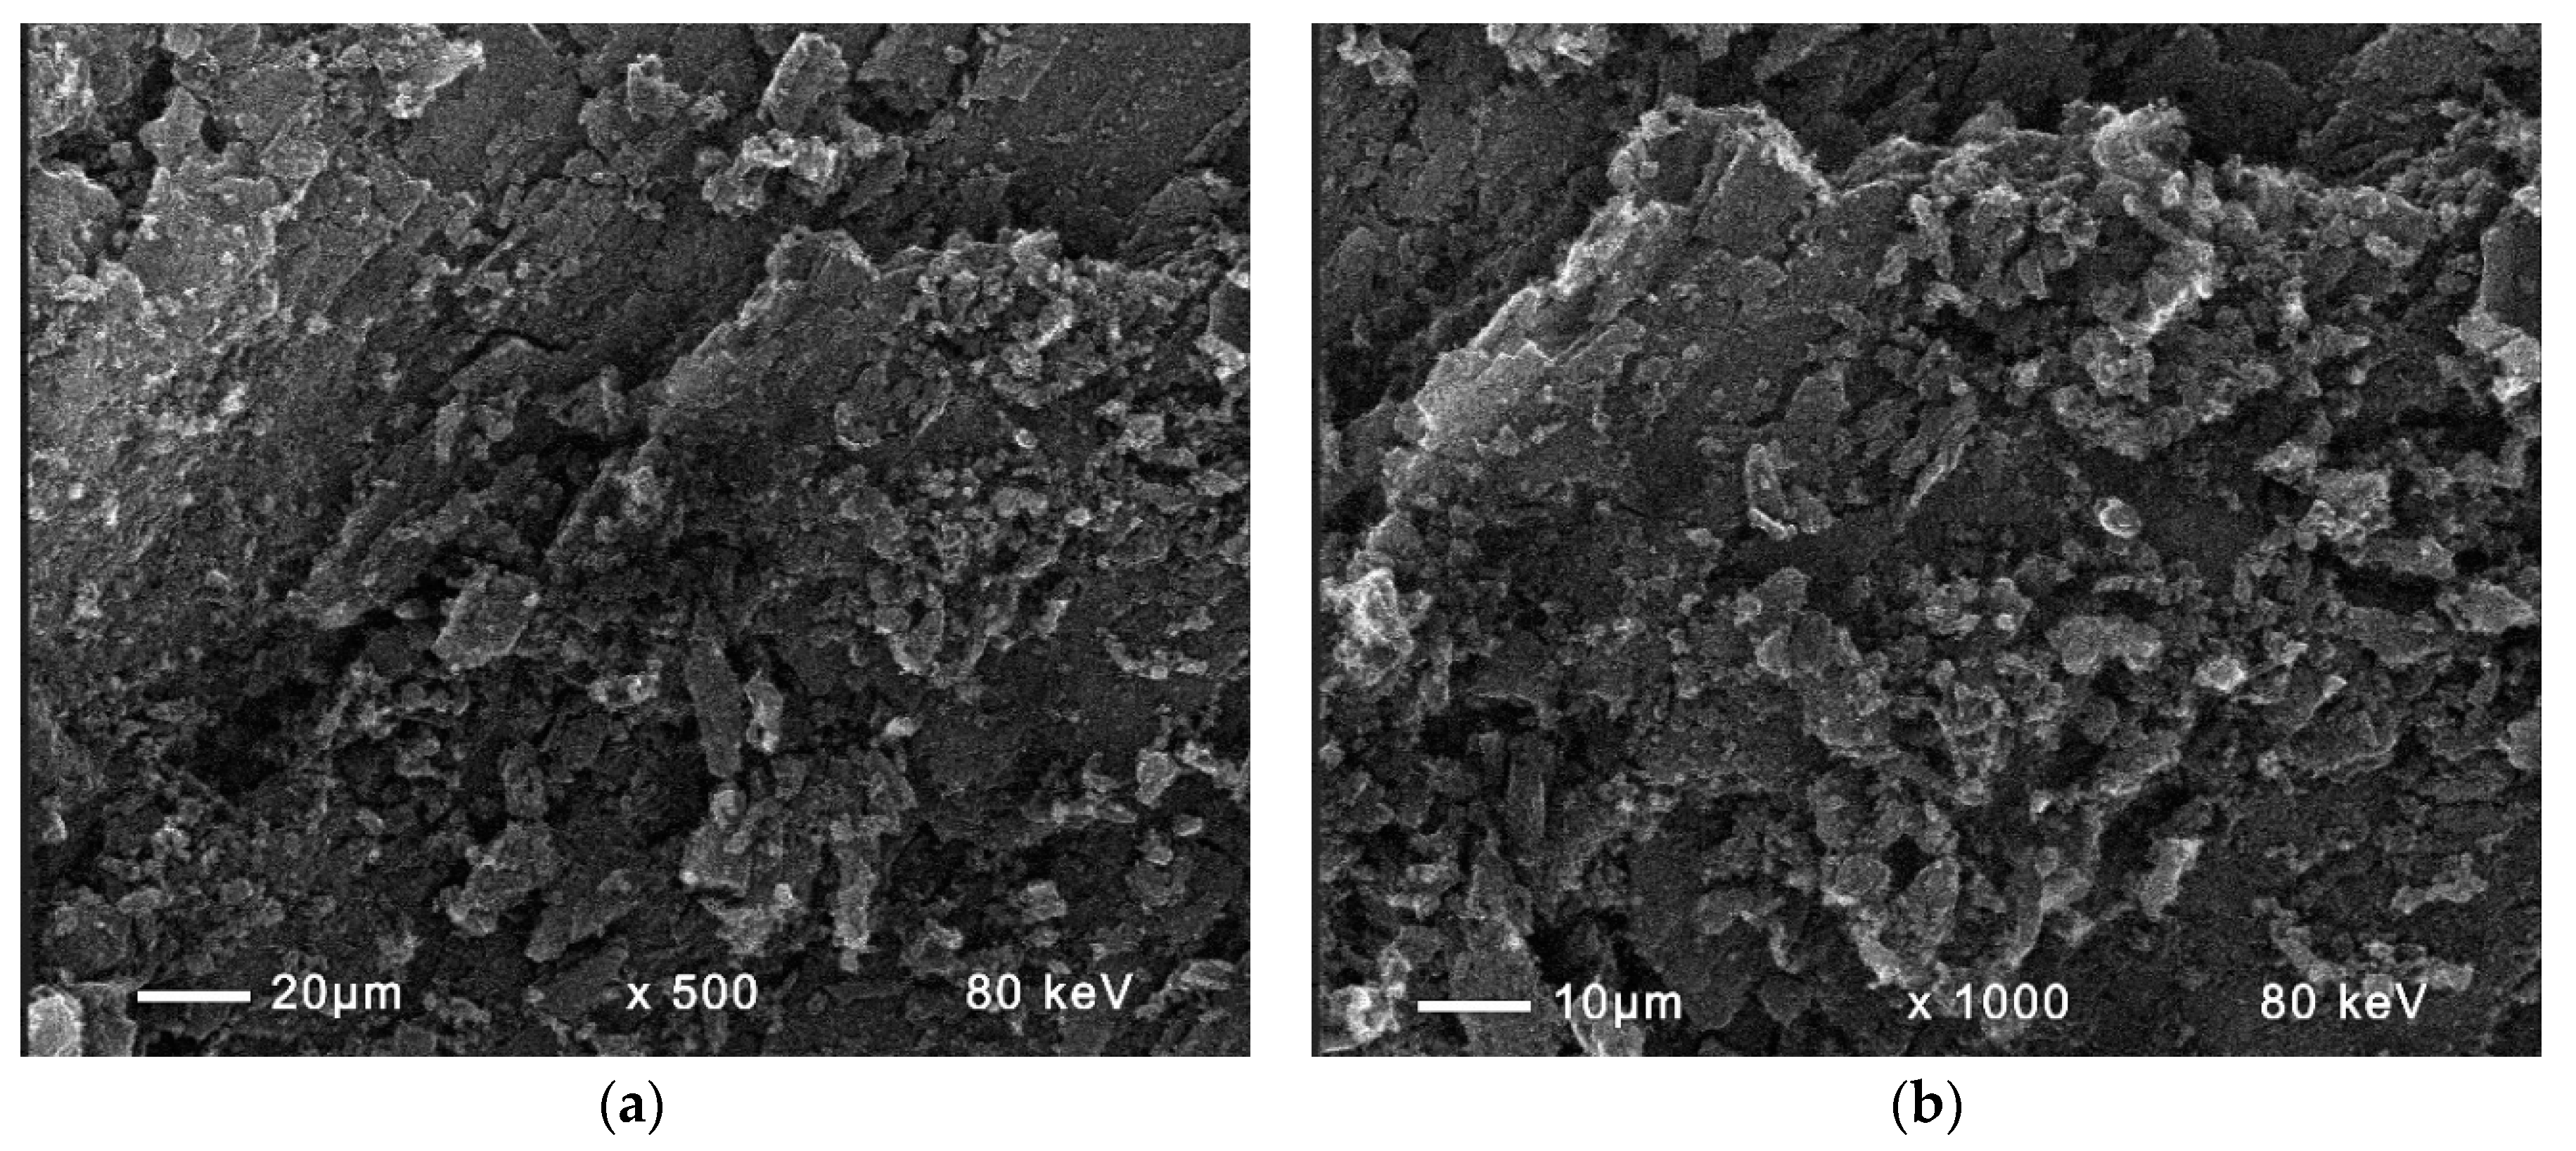

Figure 4.
SEM images at different magnifications of sintered graphite electrode. (a) magnification ×1000; (b) magnification ×5000.
Figure 4.
SEM images at different magnifications of sintered graphite electrode. (a) magnification ×1000; (b) magnification ×5000.
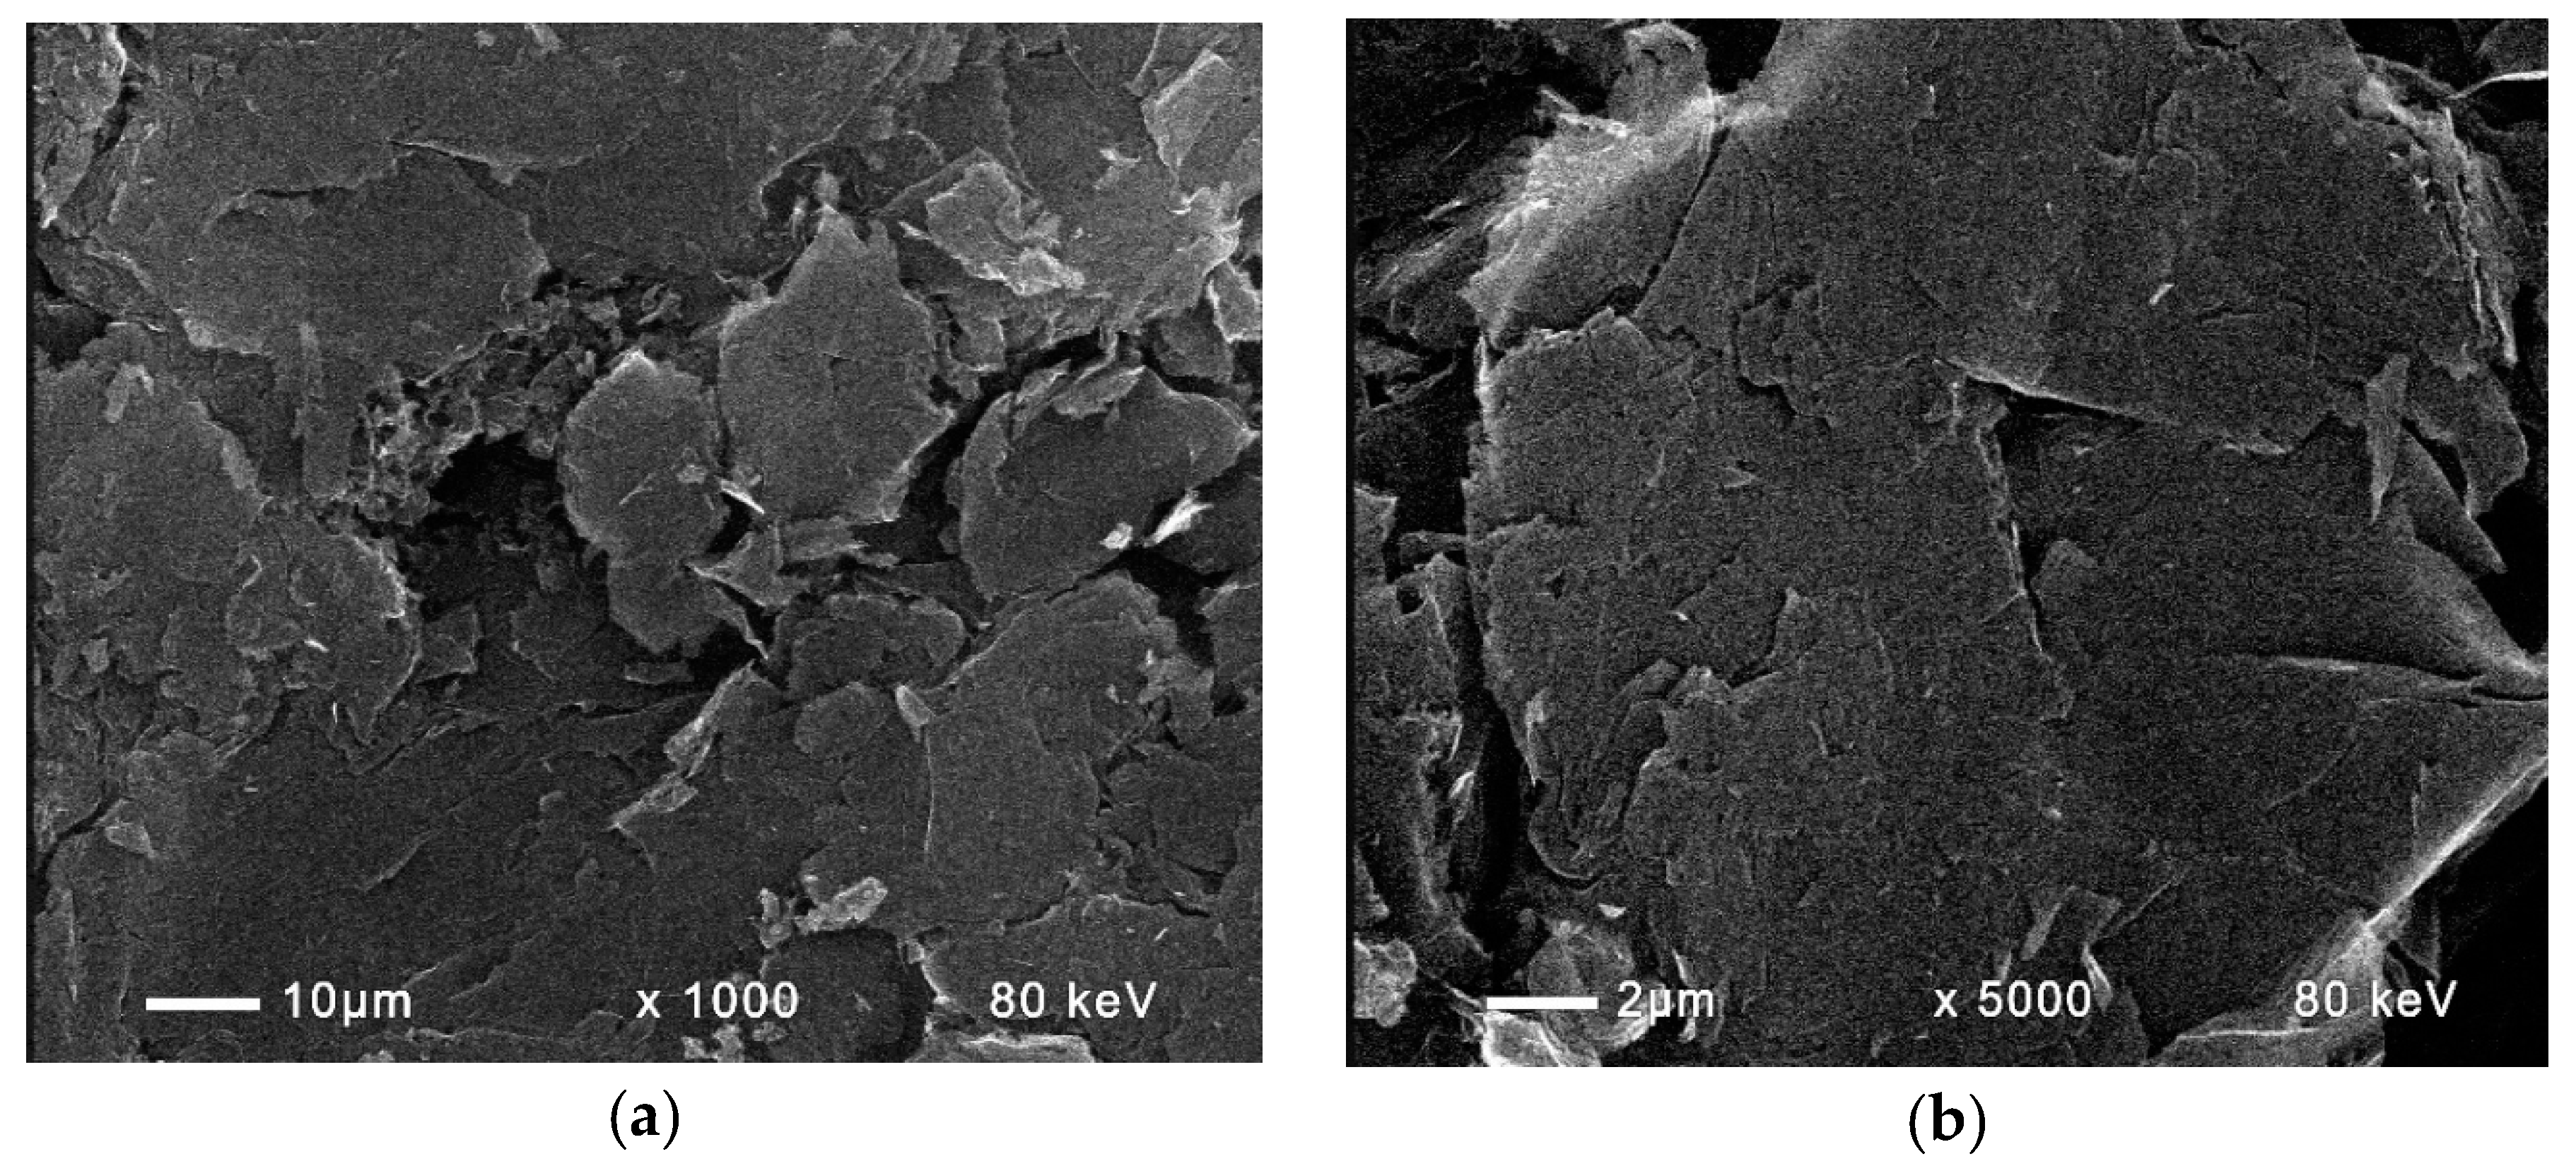
Figure 5.
EDX-spectrum of the sintered graphite electrode.
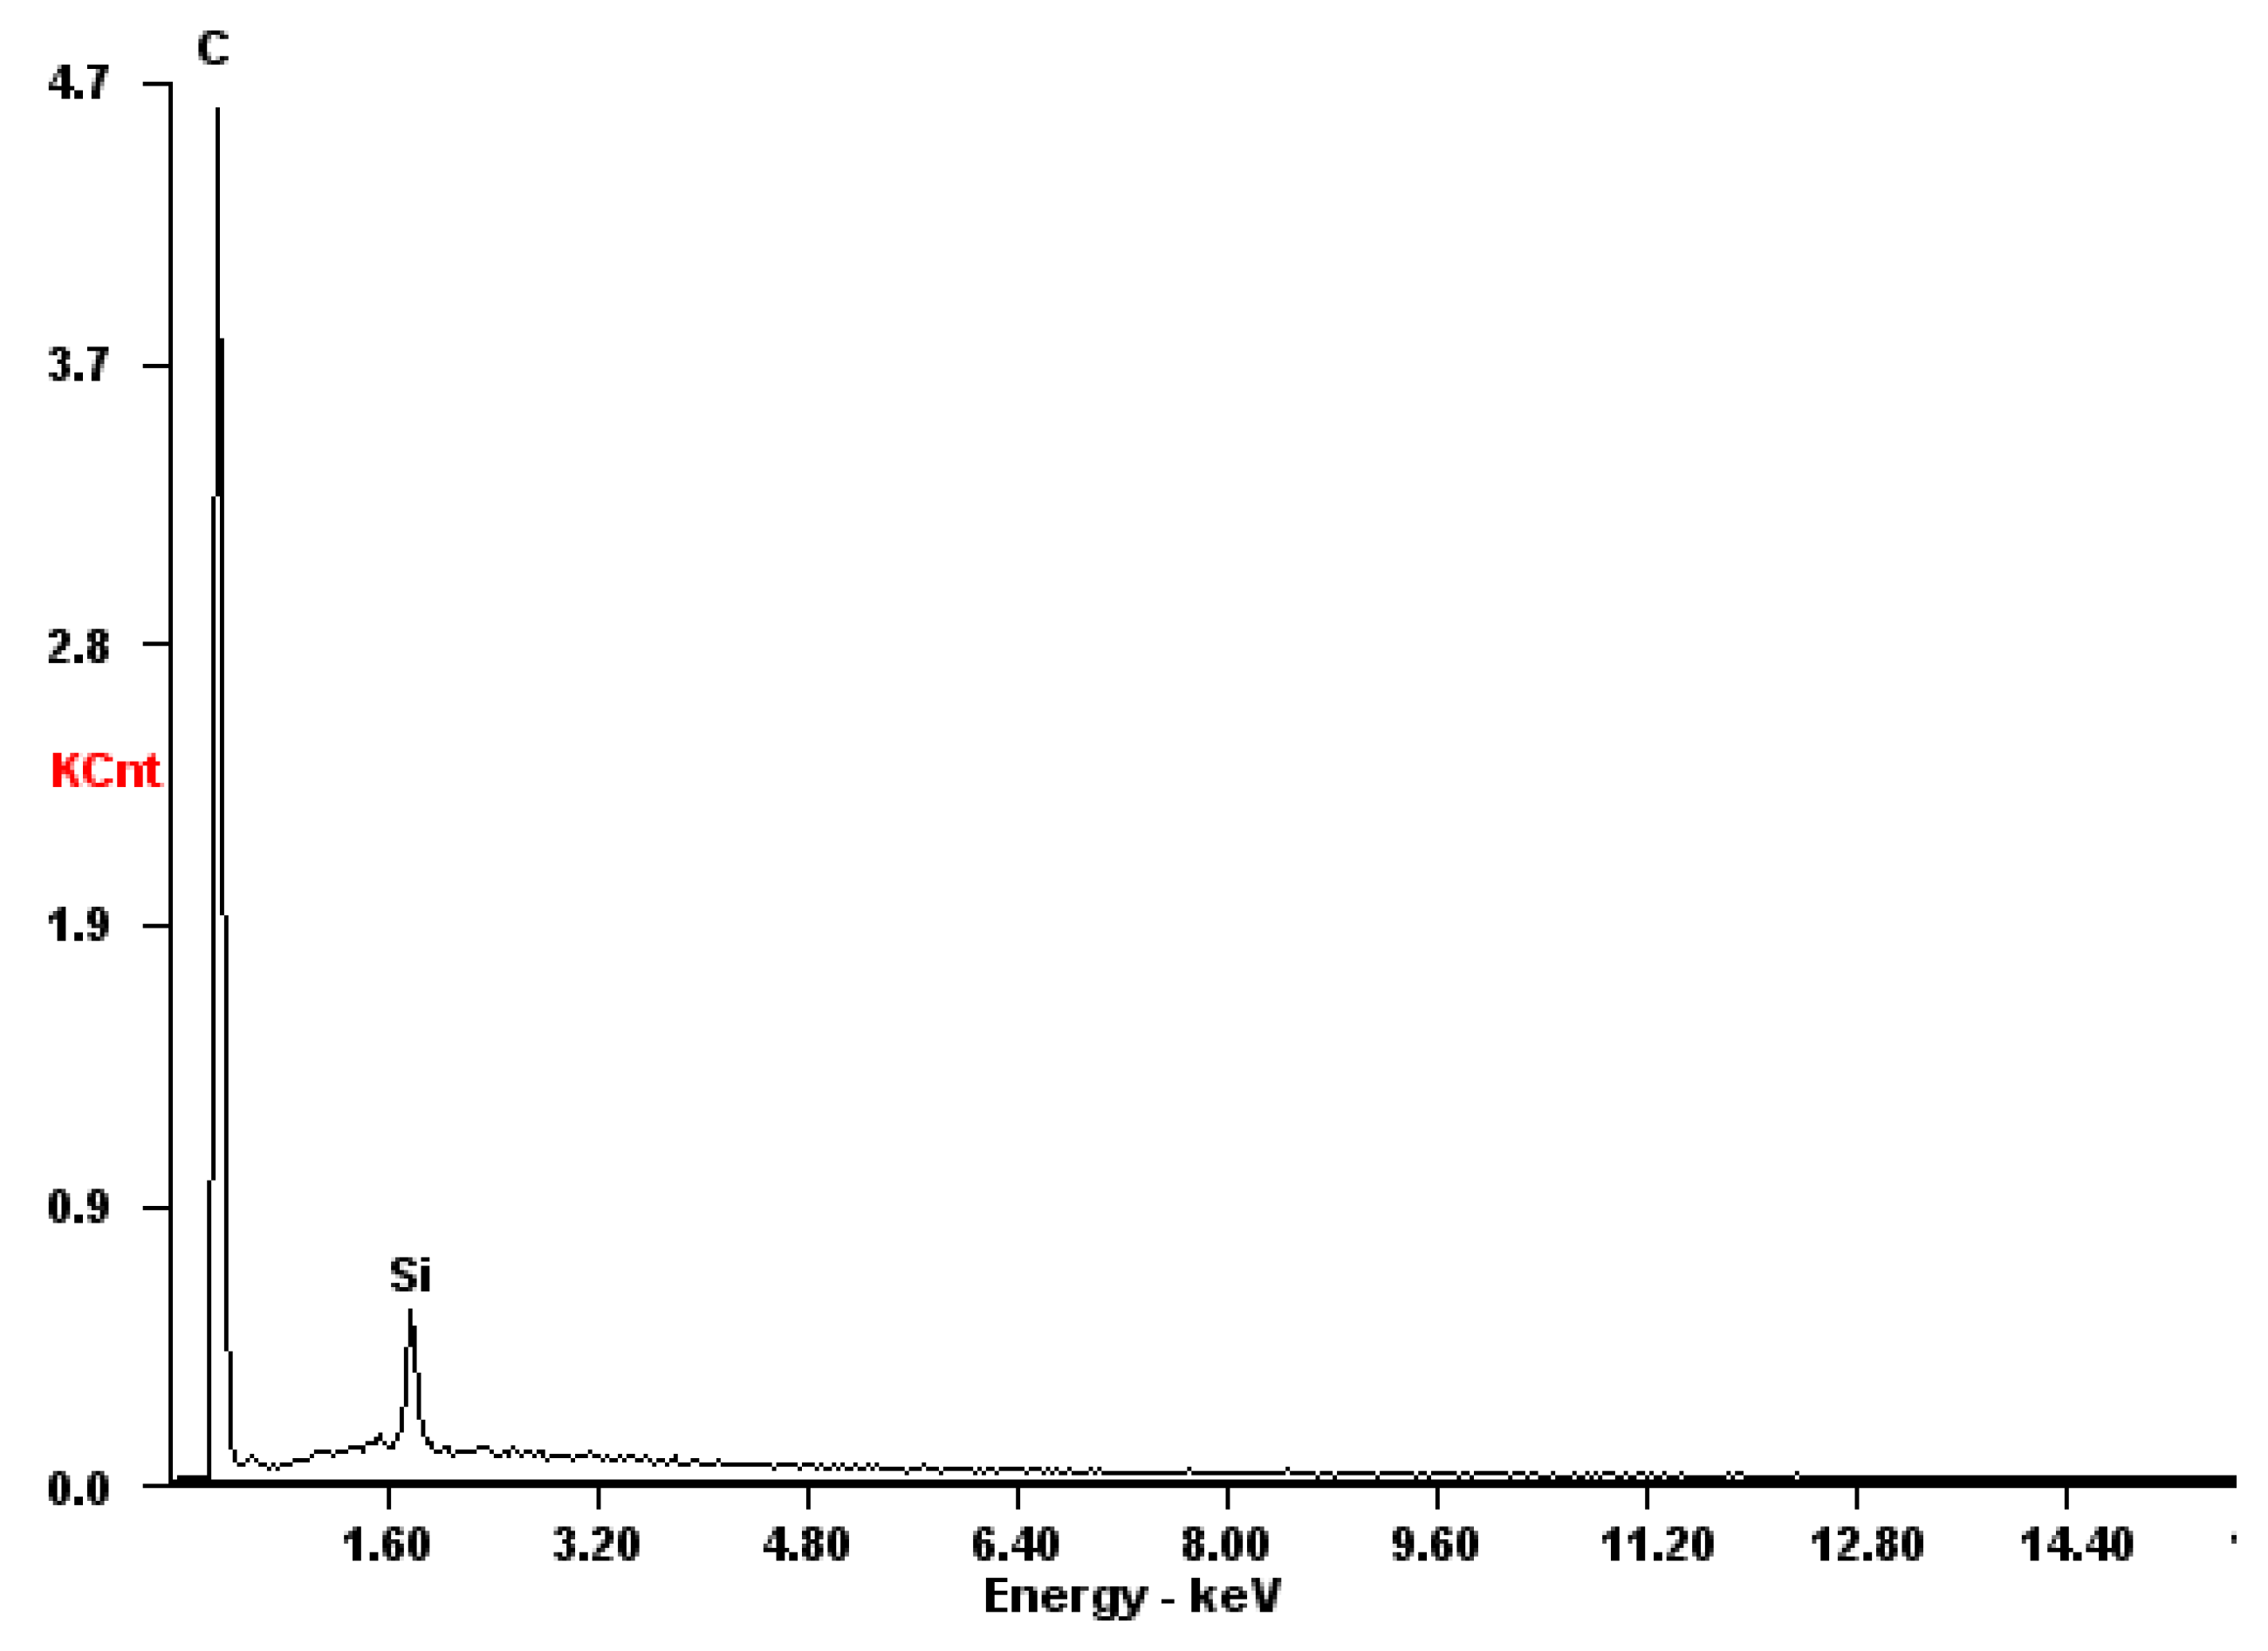
Figure 6.
Experimental set-up of a single rectangular fuel cell with 100 sq/cm electrode and membrane area.
Figure 6.
Experimental set-up of a single rectangular fuel cell with 100 sq/cm electrode and membrane area.

Figure 7.
Polarization curves for three different inlet sulfide concentrations. Membrane Celgard 3501 with 7 sq. cm membrane area. Feed flow rate 0.2 dm3/h. Symbols: (•), solid line—70 mg dm−3; (○), solid line—240 mg dm−3; (□), dashed line—1100 mg dm−3. Supporting electrolyte—16 mg dm−3 NaCl. Anode space volume—800 cm3. (a) Polarization curve; (b) power density vs. current density.

Figure 8.
Electrochemical performance of sulfide-driven fuel cell. Active electrode and membrane area—100 cm2 each. Inlet sulfide concentration—257 mg dm−3. Flow rate 20 cm3/h. Anode space—40 cm3. Cathode space—60 cm−3 packed with GAC. Membrane—Fumapem* FFA-3-PK-75. Temperature 20 °C. (a) Polarization curve for continuous operation. (○) cell voltage; (•)—power density; (b) Time profile for continuous operation SDFC. (○) cell voltage; (•)—power density; (□)—current density.
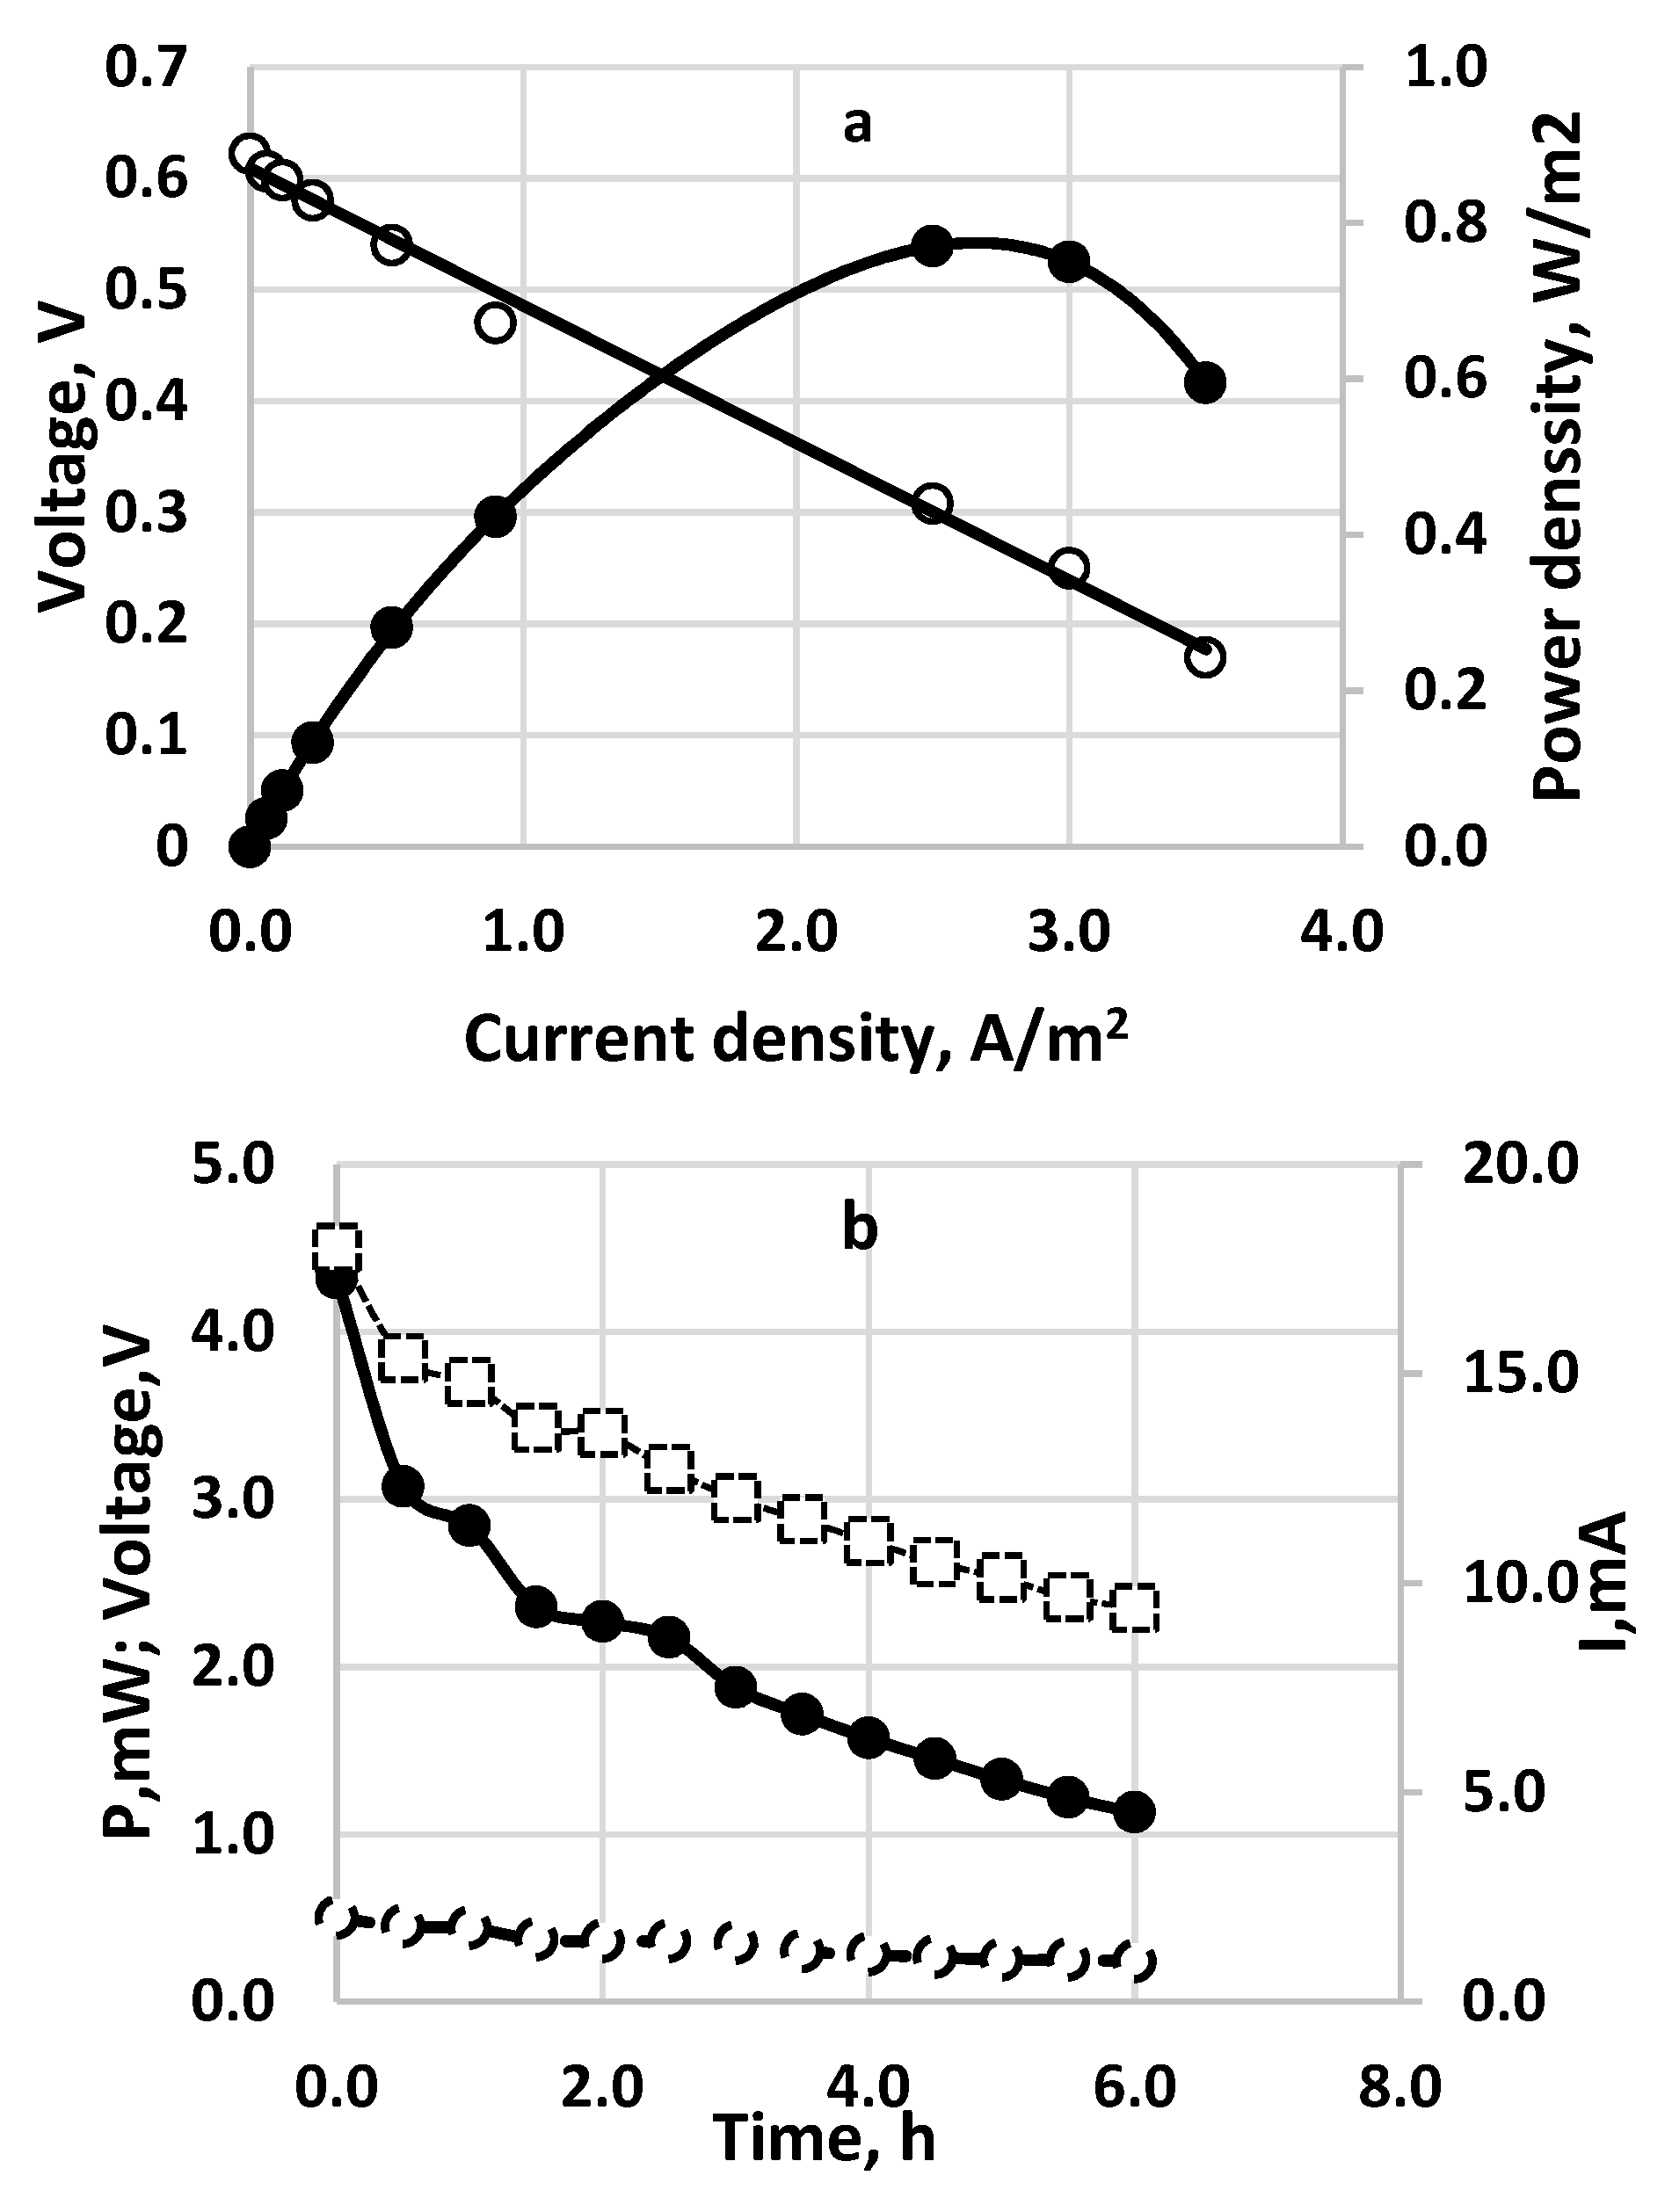
Figure 9.
Comparison of current efficiencies calculated for a different number of exchanged electrons to the analytical data on sulfide depletion (as 100%). Data taken from Figure 7b.
Figure 9.
Comparison of current efficiencies calculated for a different number of exchanged electrons to the analytical data on sulfide depletion (as 100%). Data taken from Figure 7b.
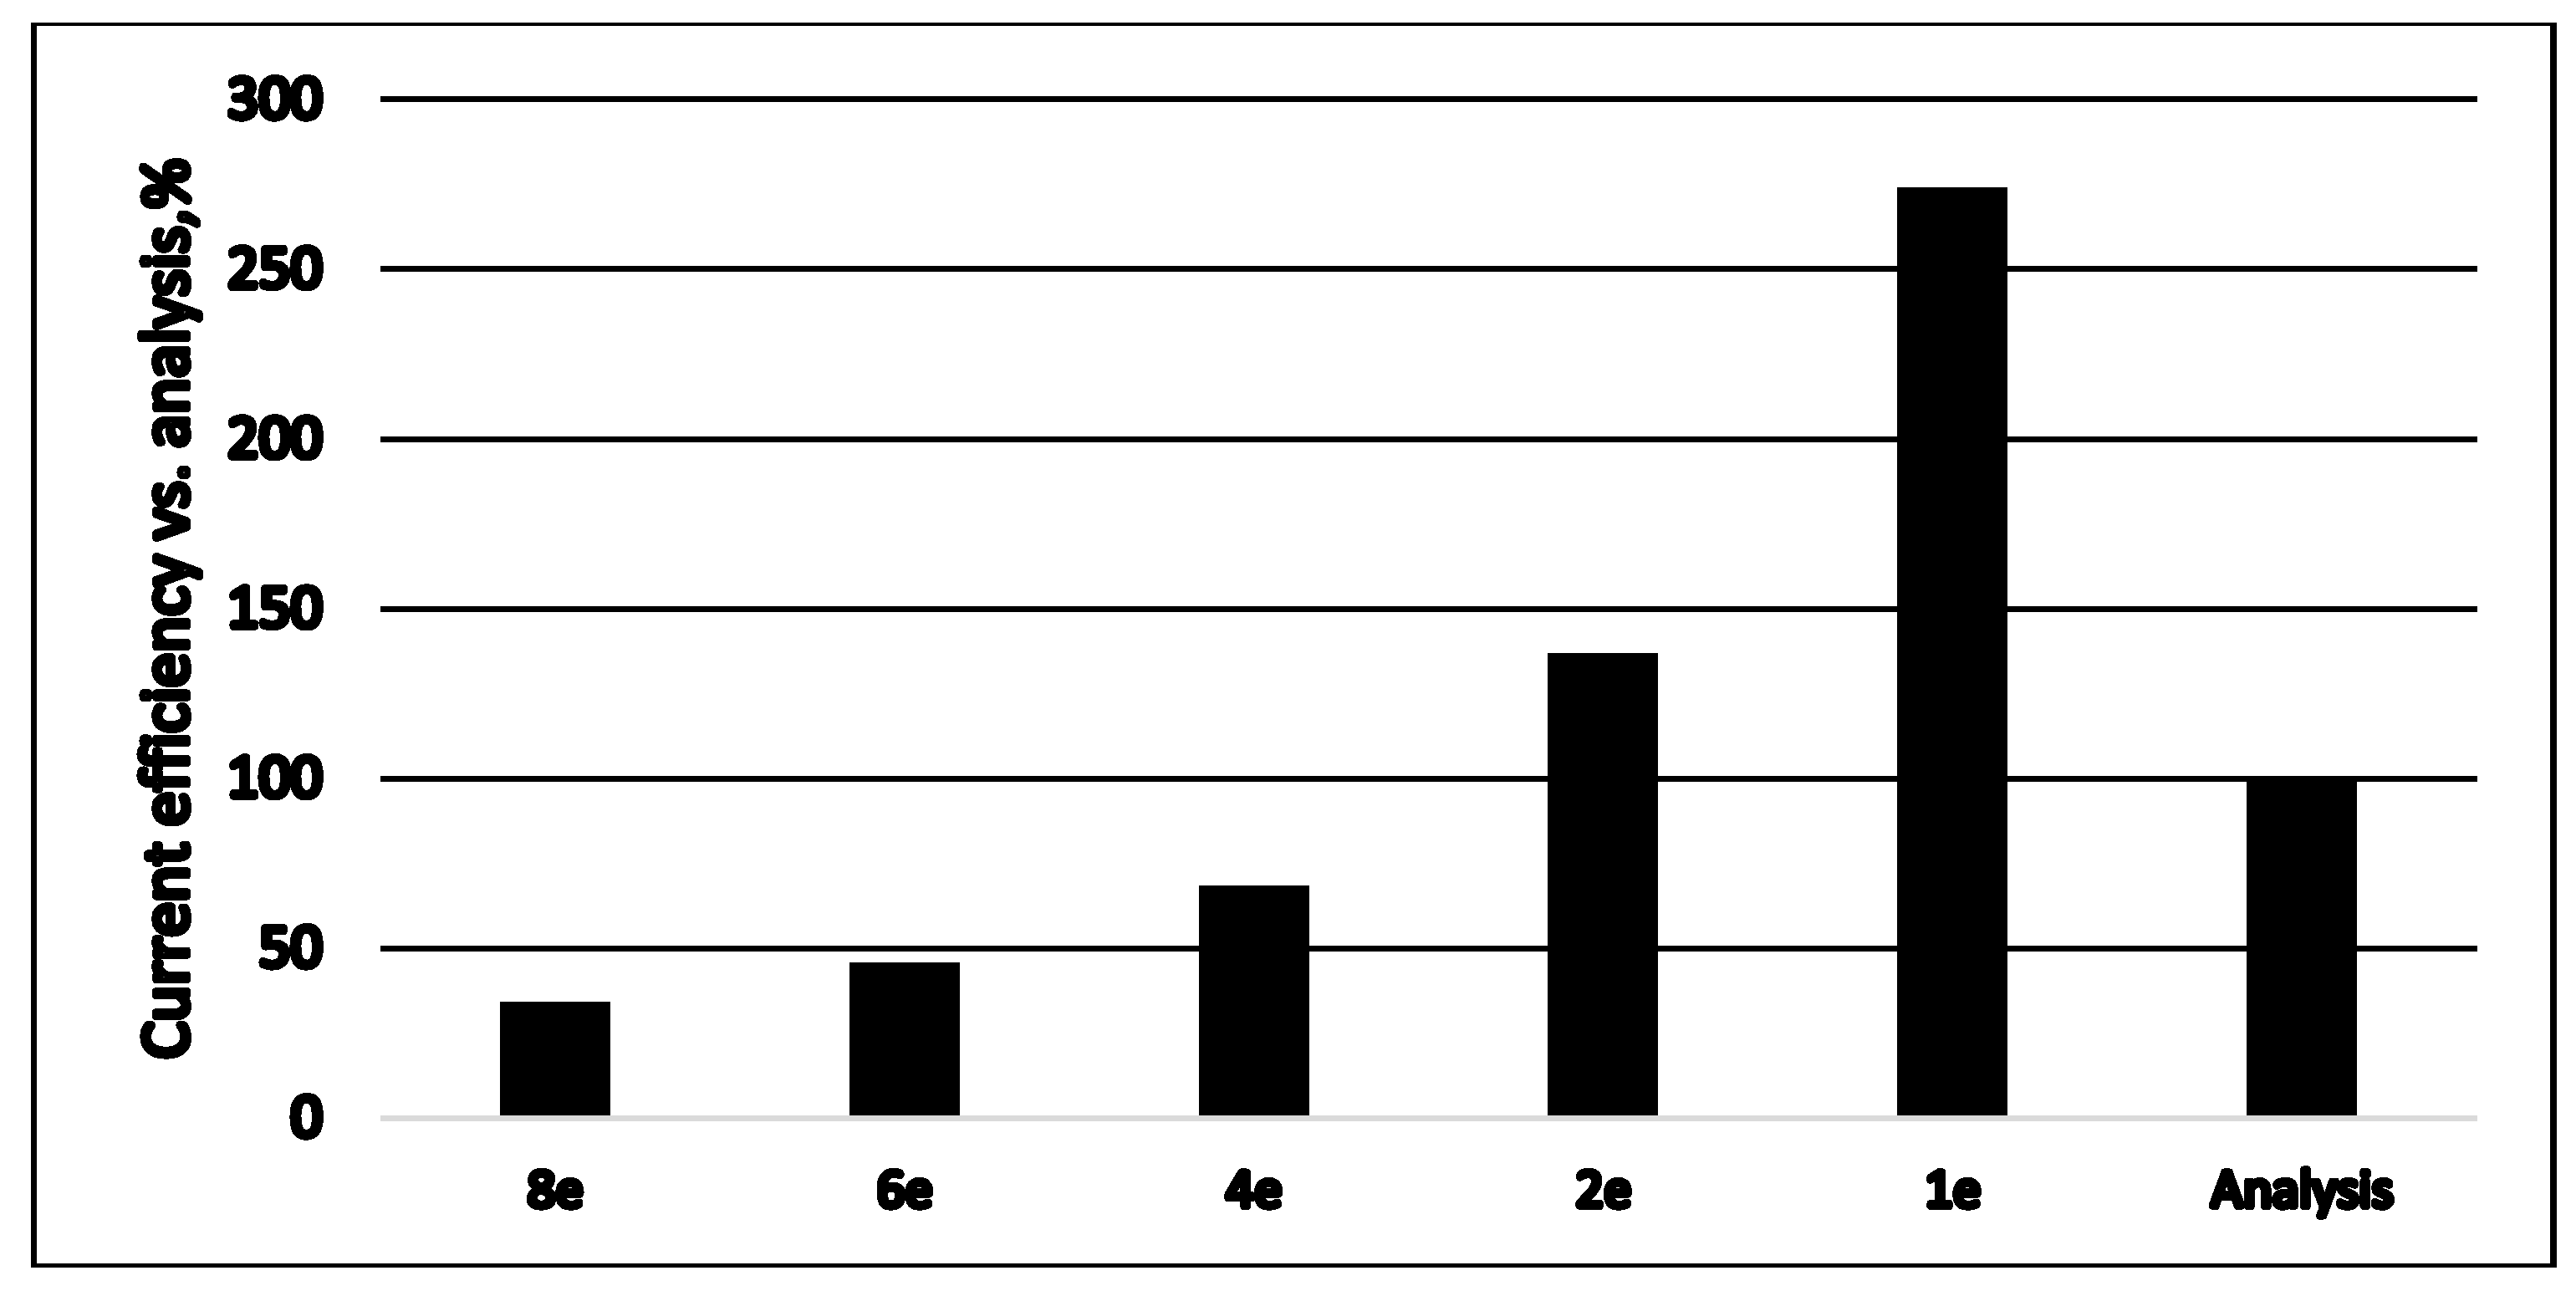
Figure 10.
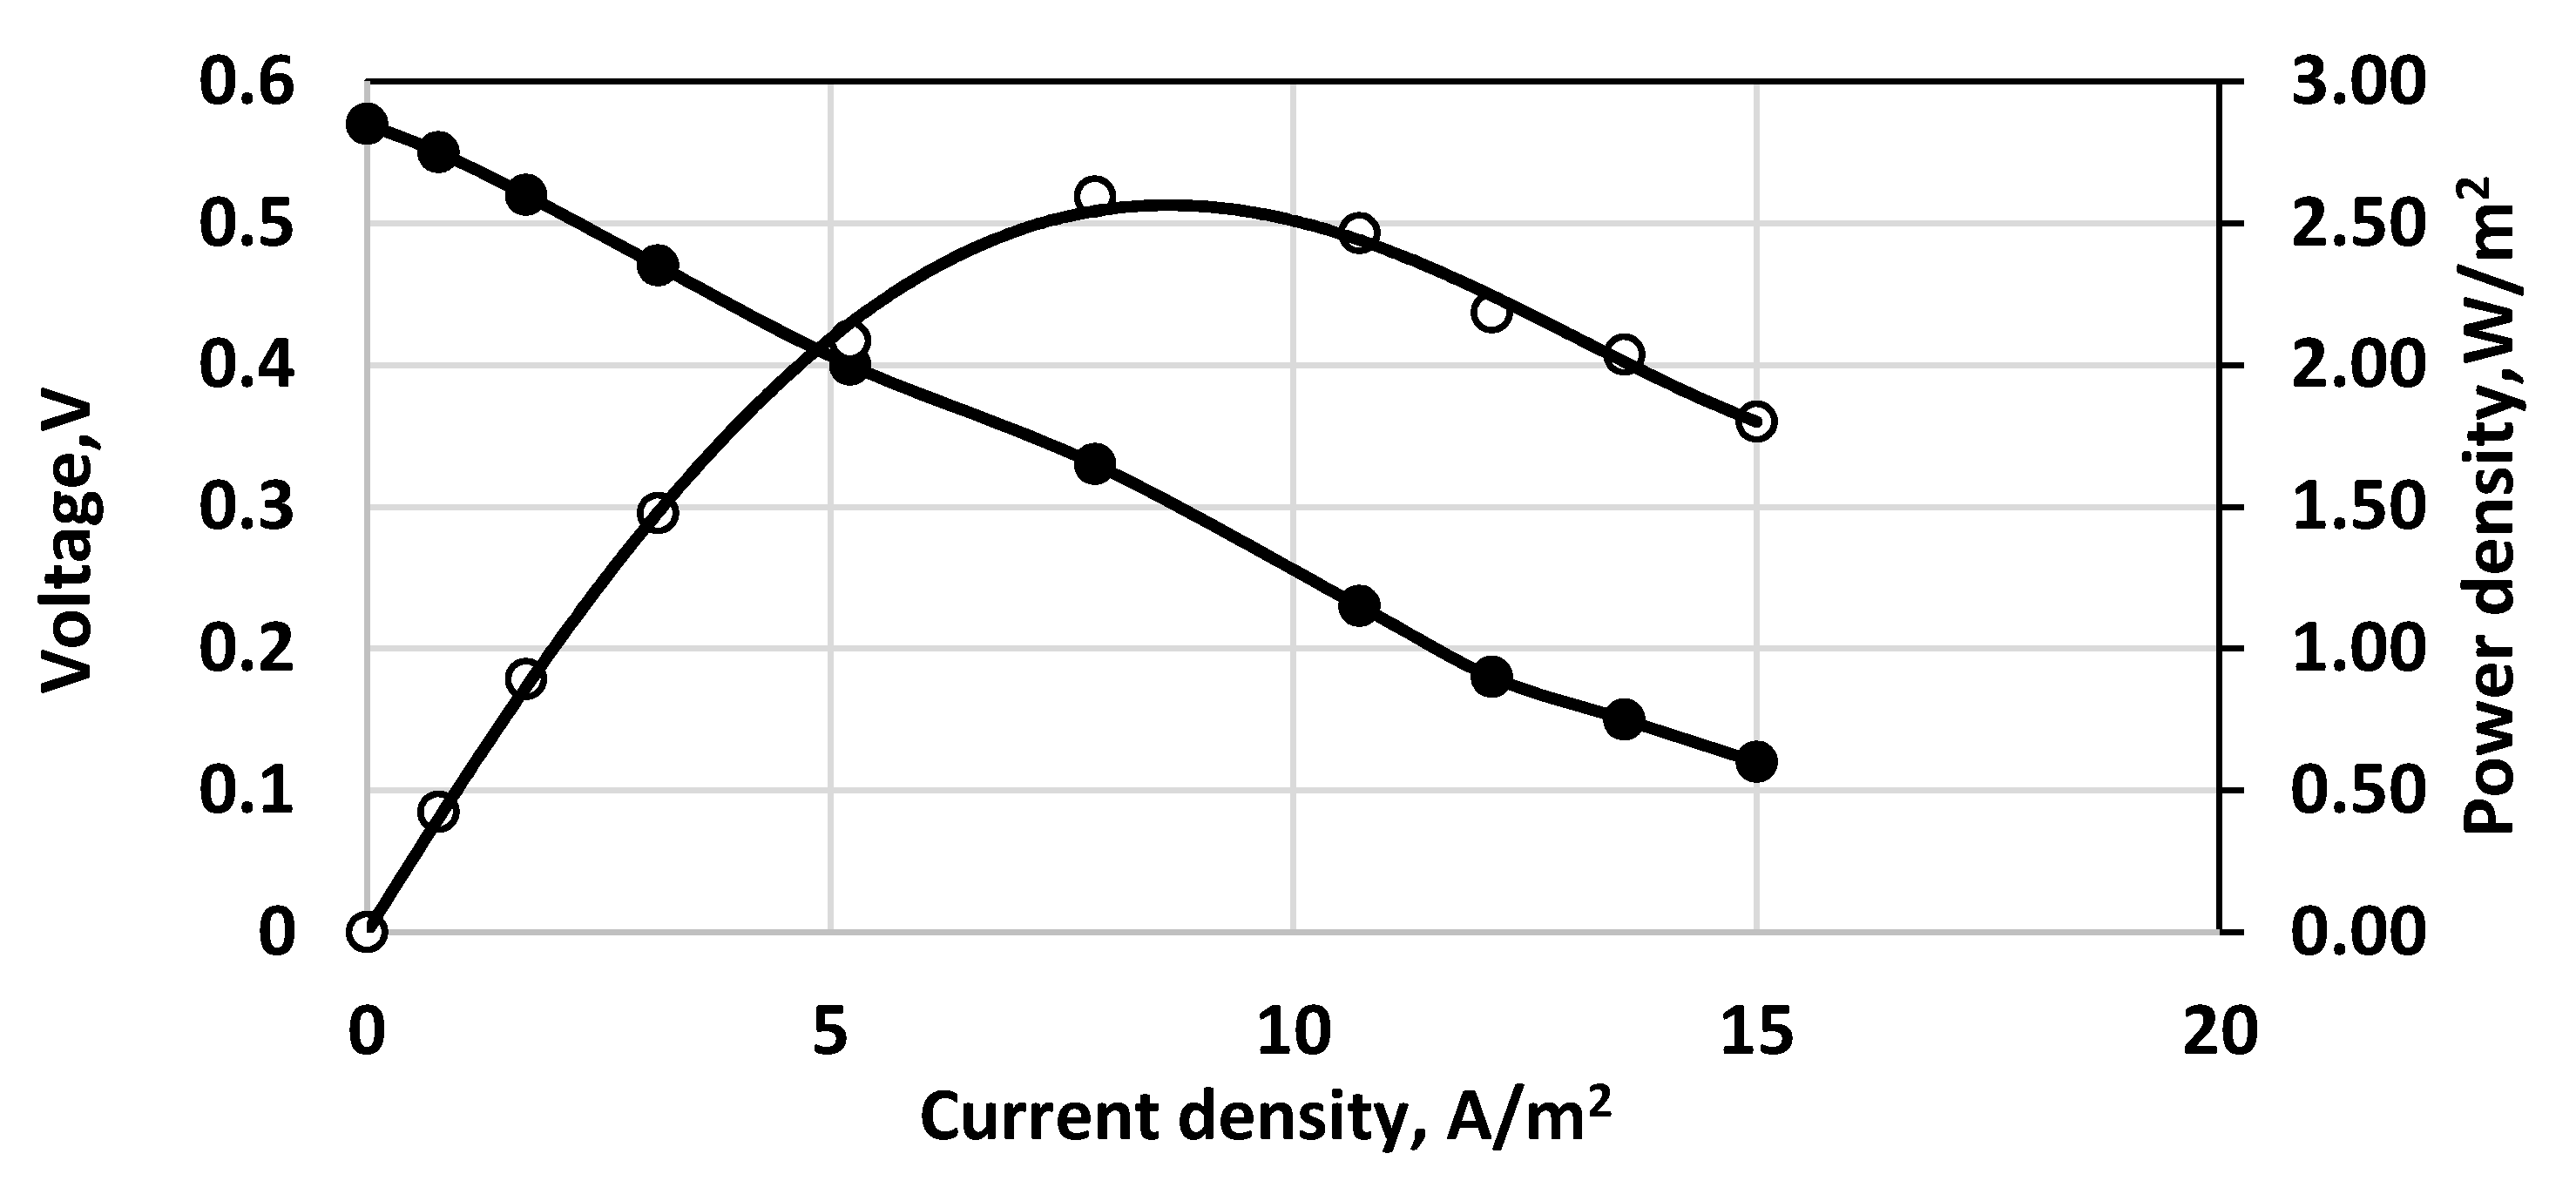
Polarization curve. Membrane Celgard 3501. Single fuel cell. Direct aeration, 0.5 dm3/h. Active electrode and membrane area—650 cm2. Feed flow rate—0.4 dm3/h. Anode volume 800 cm3. (•)—cell voltage; (○) power density; 230 mg dm−3 sulfide solution. Temperature 20 °C.
Figure 10.
Polarization curve. Membrane Celgard 3501. Single fuel cell. Direct aeration, 0.5 dm3/h. Active electrode and membrane area—650 cm2. Feed flow rate—0.4 dm3/h. Anode volume 800 cm3. (•)—cell voltage; (○) power density; 230 mg dm−3 sulfide solution. Temperature 20 °C.

Figure 11.
Effect of aeration by Venturi type ejector; 190 mg dm−3 sulfide solution. Continuous process. Membrane Celgard 3501. Active electrode and membrane area—650 cm2. Feed flow rate—0.2 dm3/h. Anode volume 800 cm3. (•)—cell voltage; (○) power density; temperature 20 °C.
Figure 11.
Effect of aeration by Venturi type ejector; 190 mg dm−3 sulfide solution. Continuous process. Membrane Celgard 3501. Active electrode and membrane area—650 cm2. Feed flow rate—0.2 dm3/h. Anode volume 800 cm3. (•)—cell voltage; (○) power density; temperature 20 °C.
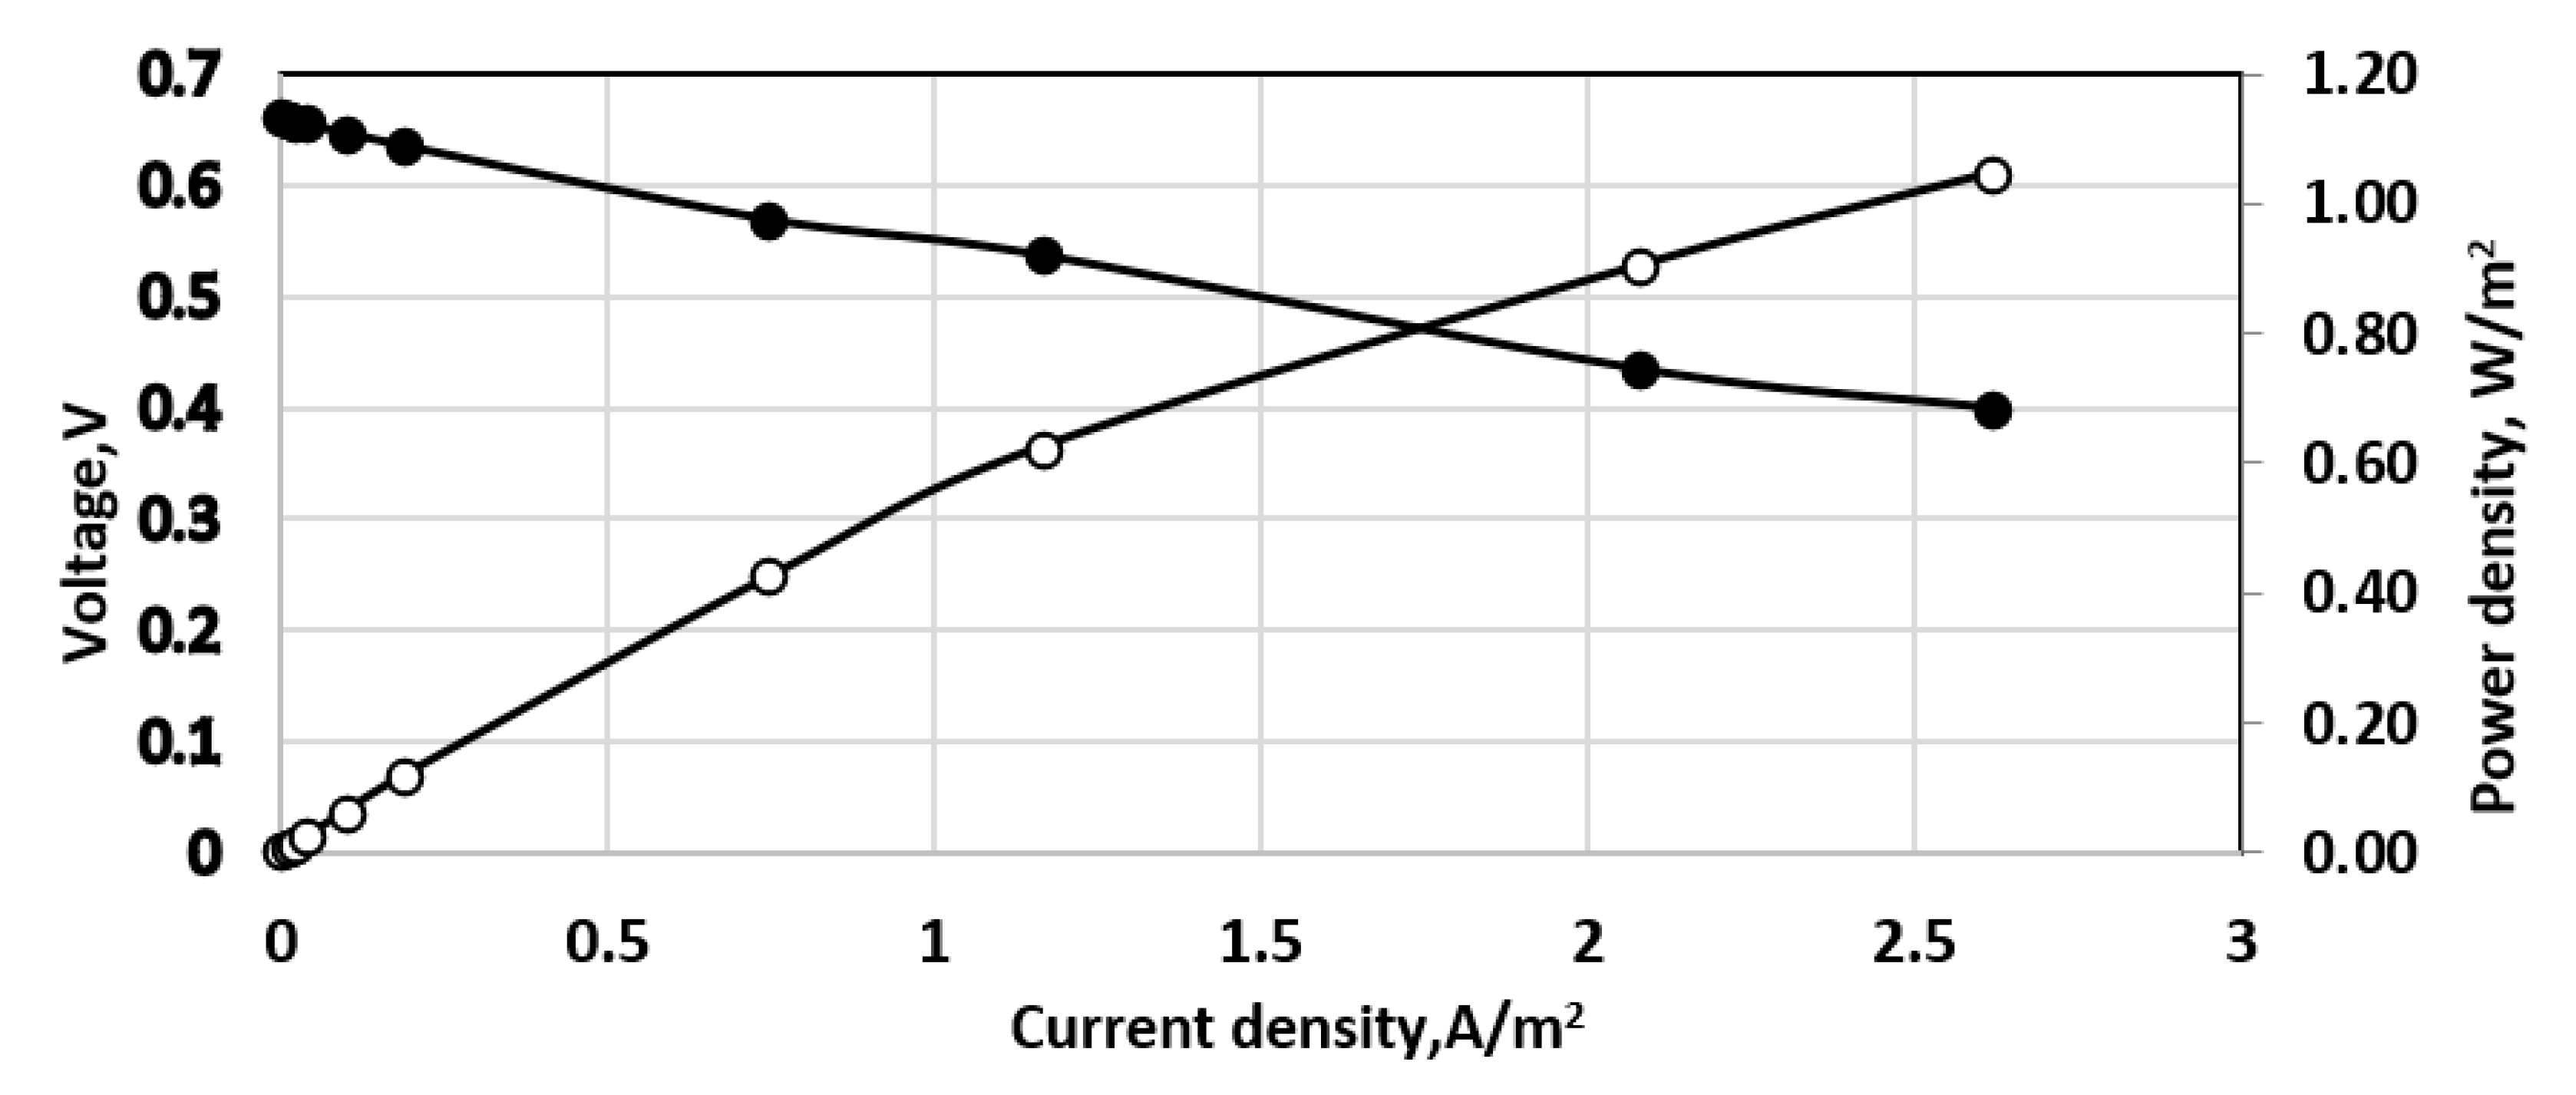
Figure 12.
Effect of direct aeration in the cathode space, 6 L/min; 241 mg dm−3 sulfide solution. Continuous process. Membrane Celgard 3501. Active membrane area—7 sq.cm. Feed flow rate—0.2 dm3/h. Anode volume 80 cm3. (•)—cell voltage; (○) power density. Temperature 20 °C.
Figure 12.
Effect of direct aeration in the cathode space, 6 L/min; 241 mg dm−3 sulfide solution. Continuous process. Membrane Celgard 3501. Active membrane area—7 sq.cm. Feed flow rate—0.2 dm3/h. Anode volume 80 cm3. (•)—cell voltage; (○) power density. Temperature 20 °C.

Figure 13.
Comparison of the polarization curves (a) and the power densities (b) for three different membranes. Sulfide concentration—256 g dm−3. Supporting electrolyte—16 g dm−3. Active electrode and membrane surface—100 sq.cm. Feed flow rate—0.2 dm3/h. (○), solid line—Celgard 3501; (•), solid line—Neosepta*AFN; (□), dashed line - Fumapem* FFA-3-PK-75.

Figure 14.
Comparison of cell conductivity with different ion exchange membranes to solid membrane conductivity (cf. [30], pp. 154–196). Solid line—Gd doped ceria; dashed line—ytria stabilized zirconia. (•)—Celgard 3501; (○)—Fumapem* FFA-3-PK-75.
Figure 14.
Comparison of cell conductivity with different ion exchange membranes to solid membrane conductivity (cf. [30], pp. 154–196). Solid line—Gd doped ceria; dashed line—ytria stabilized zirconia. (•)—Celgard 3501; (○)—Fumapem* FFA-3-PK-75.
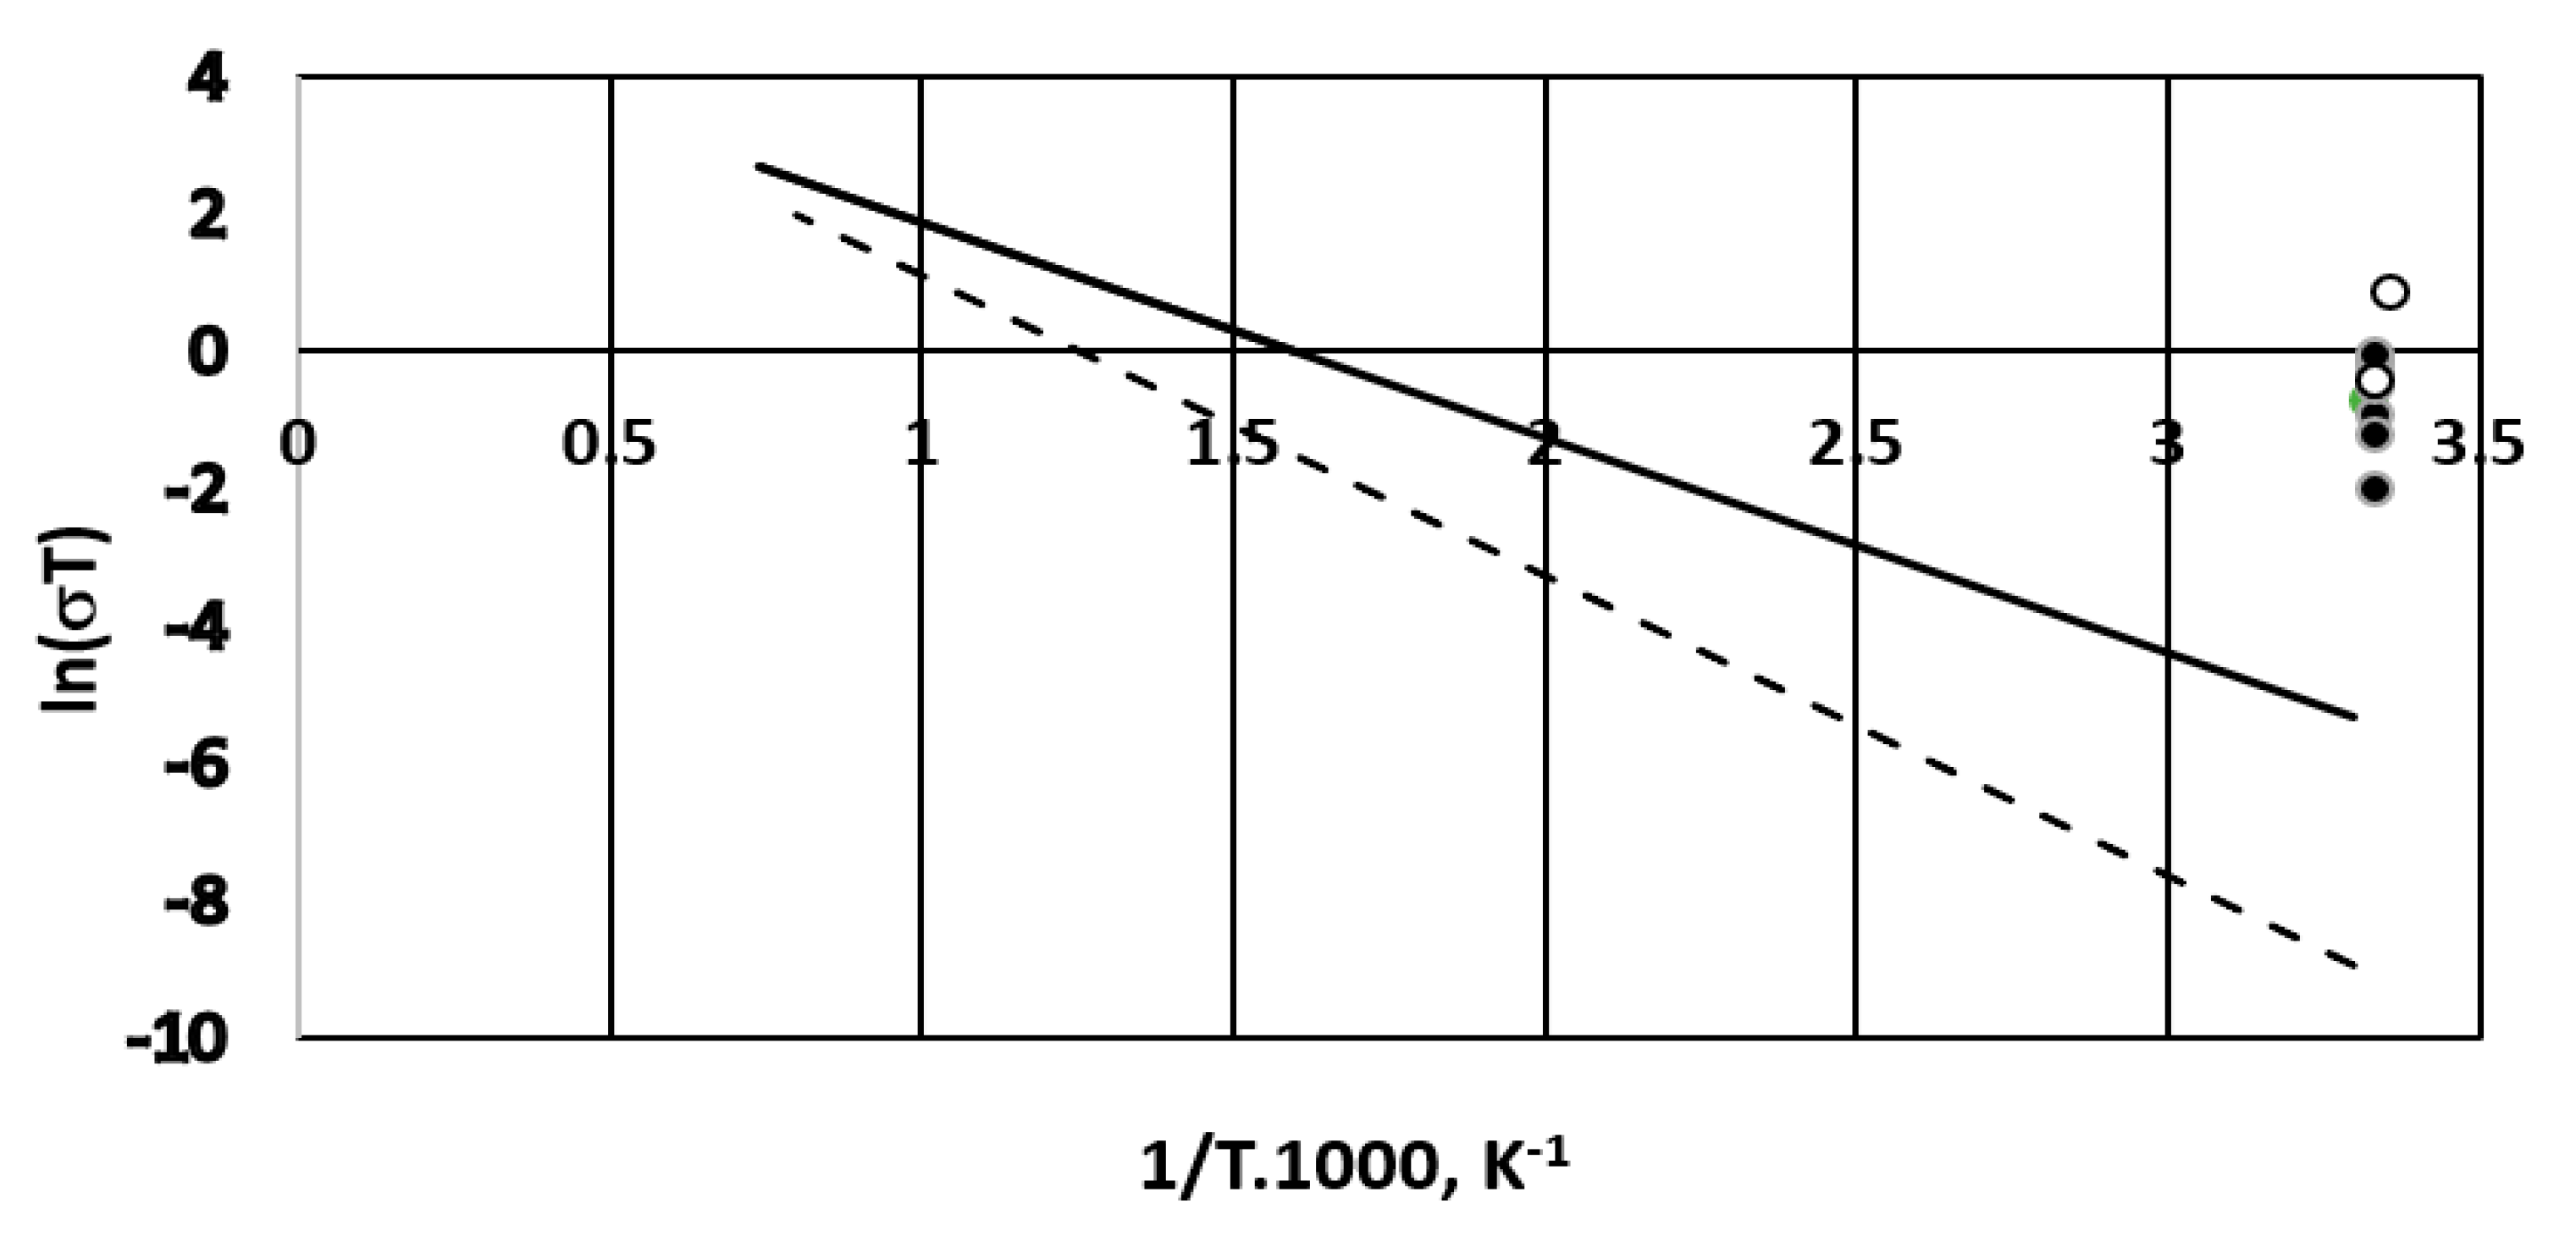
Figure 15.
Polarization curves and power density for two types of fuel cell organization. (a) two parallely coupled fuel cells as a stack; (b) two consecutively coupled fuel cells. Continuous process. Membrane Celgard 3501. Active membrane and electrode area—650 sq. cm. Inlet sulfide concentration 236 g dm−3. Supporting electrolyte—16 g dm−3. Feed flow rate—0.4 dm3/h for each of the parallel cells (a) and for the consecutively coupled ones (b). Anode volume 800 cm3 for each cell. Temperature 20 °C. (•)—cell voltage; (○) power density.


Table 1.
Comparison of the energy capacity of some known energy sources to that of hydrogen sulfide.
Table 1.
Comparison of the energy capacity of some known energy sources to that of hydrogen sulfide.
| Fuel | Energy Capacity, GJ/t |
|---|---|
| Oil equivalent | 41.86 |
| Hydrogen | 143.02 |
| Methane | 56.46 |
| Ethanol | 26.8 |
| Methanol | 19.9 |
| Hydrogen sulfide | 24.52 |
Table 2.
Comparison of sulfide-driven fuel cells and other fuels. Data for capital costs for the known fuels are extracted and extrapolated from References [19] and data for operational costs, from References [20].
| Energy Source | Features | Features/Sulfide-Driven Fuel Cell |
|---|---|---|
| Heat power stations (oil, gas, coal) | Carbon emissions; expensive production; heavy operation; waste handling Capital costs, $500–5000/kW Operational costs, 6–15 €/MWh | Carbon free; less operational costs; easy switch-on/off; no waste Capital costs, ~$2000/kW Operational costs, ~10 €/MWh |
| Nuclear fuel | Expensive fuel production; heavy and hazardous operation; expensive and dangerous waste storage. Capital costs, ~$6000/kW Operational costs, ~15 €/MWh | Less operational costs; easy switch-on/off; no waste |
| Wind | Weather dependent; impact on environment Capital costs, ~$1900/kW Operational costs, 10 €/MWh | Weather independent, positive environmental impact |
| Solar | Weather dependent; environmental hazards (soil and biodiversity degradation) Capital costs, ~$2600/kW Operational costs, 10 €/MWh | Weather independent, positive environmental impact |
Table 3.
Short excerpt of sulfide oxidation reactions, from Reference [27].
Table 3.
Short excerpt of sulfide oxidation reactions, from Reference [27].
| Reversible Redox Anode Reactions (Short Excerpt) | Number of Exchanged Electrons | Standard Electrode Potential [V], 25 °C |
|---|---|---|
| SO42− + H2O + 2e = SO32− + 2OH− | 2 | −0.93 |
| SO32− + 3H2O + 6e = S2− + 6OH− | 6 | −0.66 |
| S22− + 2e = 2S2− | 1 | −0.524 |
| S + 2e = S2− | 2 | −0.48 |
| 2SO42− + 4H++ 2e = S2O62− + 2H2O | 2 | −0.22 |
| S + H+ + 2e = HS− | 2 | −0.065 |
| S2O32− + 6H+ +8e = 2S2− + 3H2O | 4 | −0.006 |
| HSO3− + 5H+ + 4e = S +3H2O | 4 | 0 |
| SO42− + 8H+ + 8e = S2− + 4H2O | 8 | 0.149 |
| S2O32− + 8H+ + 8e = 2HS− + 3H2O | 4 | 0,2 |
Table 4.
Comparison of the measured current and power densities to referent data.
| Sulfide Concentration, g dm−3 | Supporting Electrolyte | Maximum Current Density, A/m2 | Maximum Power Density, W/m2 | Cell Efficiency, % | Reference |
|---|---|---|---|---|---|
| 0.241 | 0.27M NaCl | 8 | 2.6 | 30.5 | This work |
| 0.320 | 3M NaOH | 16 | 15 | 50 | Ref. [23] |
| 70 | Water (?) | 0.075 | 0.025 | 40 | Ref. [24] |
| 150 | Water (?) | 0.5 | 0.031 | 30 | Ref. [24] |
Table 5.
Comparison of selected experiments with different fuel cell geometry, size, feed flow rate, and flow organization. Membrane Celgard 3501.
Table 5.
Comparison of selected experiments with different fuel cell geometry, size, feed flow rate, and flow organization. Membrane Celgard 3501.
| Cell Type | Area cm2 | Inlet Sulfide Concentration mg/dm−3 | OCP, V | Voltage Cell Efficiency, % | Cell Resistivity, Ohms | Current Density, A/m2 | Power Density, W/m2 | Over-Potential, mV | Sulfide Conversion % |
|---|---|---|---|---|---|---|---|---|---|
| Cylindrical cell. Feed 0.2 dm−3/h | 7 | 241 | 0.49 | 54.5 | 45 | 5.5 | 10. | 0.1 | 95.3 |
| Rectangular single cell, direct aeration. Feed 0.4 dm−3/h | 650 | 240 | 0.52 | 49.5 | 1.0 | 4.6 | 1.9 | 0.1 | 57.2 |
| Rectangular single cell, ejector. Feed 0.4 dm−3/h | 650 | 260 | 0.38 | 58 | 1.8 | 2.2 | 0.6 | 0.7 | 37 |
| Rectangular stack, 2 cells; direct aeration. Feed 2 × 0.4 dm−3/h | 650 | 240 | 1.42 | 78 | 11.7 | 1.2 | 0.8 | 0.2 | 76 |
| 2 Rectangular cells, cascade. Feed 0.4 dm−3/h | 650 | 236 | 1.2 | 36 | 11.3 | 1.3 | 0.57 | -3 | 30–100 |
© 2018 by the authors. Licensee MDPI, Basel, Switzerland. This article is an open access article distributed under the terms and conditions of the Creative Commons Attribution (CC BY) license (http://creativecommons.org/licenses/by/4.0/).
Share and Cite
MDPI and ACS Style
Beschkov, V.; Razkazova-Velkova, E.; Martinov, M.; Stefanov, S. Electricity Production from Marine Water by Sulfide-Driven Fuel Cell. Appl. Sci. 2018, 8, 1926. https://doi.org/10.3390/app8101926
AMA Style
Beschkov V, Razkazova-Velkova E, Martinov M, Stefanov S. Electricity Production from Marine Water by Sulfide-Driven Fuel Cell. Applied Sciences. 2018; 8(10):1926. https://doi.org/10.3390/app8101926
Chicago/Turabian StyleBeschkov, Venko, Elena Razkazova-Velkova, Martin Martinov, and Stefan Stefanov. 2018. "Electricity Production from Marine Water by Sulfide-Driven Fuel Cell" Applied Sciences 8, no. 10: 1926. https://doi.org/10.3390/app8101926
Note that from the first issue of 2016, this journal uses article numbers instead of page numbers. See further details here.