Article

Mass Transfer Phenomena during Electrodialysis of Multivalent Ions: Chemical Equilibria and Overlimiting Currents

by
Manuel César Martí-Calatayud
*,
Montserrat García-Gabaldón
and
Valentín Pérez-Herranz
*
IEC Group, Departament d’Enginyeria Quimica i Nuclear, Universitat Politècnica de València, Camí de Vera s/n, 46022 València, Spain
*
Authors to whom correspondence should be addressed.
Appl. Sci. 2018, 8(9), 1566; https://doi.org/10.3390/app8091566
Submission received: 26 July 2018 / Revised: 31 August 2018 / Accepted: 3 September 2018 / Published: 6 September 2018
(This article belongs to the Special Issue Electro-membrane Processes for Clean Water and Sustainable Energy)

Abstract

:

Featured Application

Selective ion transport through polymer electrolytes is crucial for environmental applications, especially in deionization of water for drinking and irrigation purposes and in effluents’ treatment. Ion transport through permselective membranes is relevant in emerging energy applications as well.

Abstract

Electrodialysis is utilized for the deionization of saline streams, usually formed by strong electrolytes. Recently, interest in new applications involving the transport of weak electrolytes through ion-exchange membranes has increased. Clear examples of such applications are the recovery of valuable metal ions from industrial effluents, such as electronic wastes or mining industries. Weak electrolytes give rise to a variety of ions with different valence, charge sign and transport properties. Moreover, development of concentration polarization under the application of an electric field promotes changes in the chemical equilibrium, thus making more complex understanding of mass transfer phenomena in such systems. This investigation presents a set of experiments conducted with salts of multivalent metals with the aim to provide better understanding on the involved mass transfer phenomena. Chronopotentiometric experiments and current-voltage characteristics confirm that shifts in chemical equilibria can take place simultaneous to the activation of overlimiting mass transfer mechanisms, that is, electroconvection and water dissociation. Electroconvection has been proven to affect the type of precipitates formed at the membrane surface thus suppressing the simultaneous dissociation of water. For some electrolytes, shifts in the chemical equilibria forced by an imposed electric field generate new charge carriers at specific current regimes, thus reducing the system resistance.

1. Introduction

Ion transport is relevant in numerous biological and engineering systems [1]. Selective ion transport is the key process in desalination of salt solutions by means of electrodialysis as well as in electrochemical energy conversion systems, such as redox flow batteries or reverse electrodialysis [2,3,4,5]. In the above-mentioned processes, ion-exchange membranes ensure ionic continuity and selective transport of ions between different compartments. Ion-exchange membranes are polymeric films containing fixed charges in their structure, which make them selective for mobile ions with the opposite charge (counter-ions) and impermeable for mobile ions with the same charge (co-ions). Therefore, two main types of ion-exchange membranes exist: anion- and cation-exchange membranes. Ion transport through ion-exchange membranes has been widely studied using electrolytes composed of monovalent salts, since desalination of brackish water was one the first applications of electrodialysis membranes [6]. While transport of monovalent salt solutions across charged membranes has been widely investigated, phenomena involved during the transport of multivalent ions are not as widely understood. Treatment of industrial effluents from mining sites or metal finishing industries, recovery of valuable metals from electronic waste or transport of multivalent ions in redox flow batteries, to name a few, are some of the applications where transport of multivalent ions is involved [7,8,9].
Three are the main properties that are desired in ion-exchange membranes: long-term stability, high selectivity for the counter-ions of interest and high ionic conductivities. Membranes having these properties ensure high faradaic efficiencies and low energy consumption. Nonetheless, selectivity of ion-exchange membranes implicitly entails the development of concentration polarization. When a constant current density is imposed within an electrodialysis cell, ionic current is mainly transported by counter-ions in the membrane phase, whereas both counter- and co-ions contribute to ionic current through diffusion boundary layers (DBLs). Consequently, concentration profiles are developed at the membrane-neighboring solution layers. This phenomenon, known as concentration polarization, is intensified as current density is increased. Ultimately, when the current is increased up to the point that the concentration at the membrane depleting surface approaches zero, the resistance of the membrane system increases substantially. The current density at which this phenomenon occurs is conventionally known as the limiting current density (ilim). After surpassing ilim, the well-known plateau region of current-voltage curves develops. Electrodialysis systems are usually operated below the ilim, in order not to increase energy costs. Contrariwise to pressure-driven membrane processes, flux of ions through the membranes can be further increased beyond the ilim via activation of additional ion transport mechanisms. Among them, electroconvection, water dissociation and natural convection are the most common. Electroconvection is the formation of vortices under strong polarization conditions and an extended space charge layer at the depleting side of the membrane. The created instabilities result in mixing of the DBL and an increased supply of ions from the bulk solution towards the membrane [10]. Opposite to the dissociation of water, in the case of electroconvection, the ions transported through the membrane are the target ones. For this reason, several researchers have investigated different strategies to potentiate electroconvection at low driving forces, that is to reduce the length of the plateau region in order to shift the operation point above the ilim without implying very high increases in energy losses.
Introducing ion-conducting and topographic heterogeneity on the membranes’ surface is the most investigated method for enhancing electroconvection [11,12]. In addition to membrane surface properties, the type of electrolyte has been also demonstrated to be an influencing parameter in the early onset and intensification of electroconvection. Several researchers have concluded from experimental studies that multivalent ions with larger Stokes radii are able to create larger vortices and boost electroconvection [13,14,15]. However, these ions also entail an additional complexity, since they can appear as free ions or combined in the form of complex species. The speciation and distribution of counter-ions can be altered upon application of an electric field and development of concentration polarization. Changes in speciation of electrolyte in the vicinities of the membrane may imply the generation, at an advanced stage of concentration polarization, of new counter-ions from other species with a different charge and thus, turn into changes in membrane selectivity and current efficiency in electromembrane processes. Also, membrane conductivity is influenced by the type of counter-ion equilibrating the membrane or by precipitates formation at the depleting membrane side [14,16]. The aim of the present study is to recapitulate diverse phenomena that can arise during transport of multivalent ions through cation-exchange membranes under intense concentration polarization conditions and improve the understanding on the factors influencing them. These are investigated by means of chronopotentiometric measurements, where the dynamic response of membrane voltage drop upon different perturbation signals are interpreted on the realm of several competing and interrelated phenomena arising at overlimiting currents. Analysis of the current-voltage features is also assessed to obtain the steady state resistance of membrane systems. The different phenomena observed are treated and classified according to the cause for their emergence:
  • Equilibrium shifts in the diffusion boundary layer
  • Overlimiting mass transfer with multivalent metals

2. Materials and Methods

The membranes used for the present study are commercial Nafion 117 (DuPontTM, Wilmington, DE, USA) cation-exchange membranes. These membranes are perfluorosulfonic films with a fixed charge density of 0.9 meq/g and a thickness of 183 µm. A lab scale setup formed by a 3-compartment electrodialysis cell was utilized for conducting chronopotentiometric experiments. The three compartments were filled with the same electrolyte and concentration to avoid concentration gradients other than those arising due to the application of a current density. The membrane under study was placed separating the central and cathodic compartment, while an auxiliary anion-exchange membrane was used to separate the anodic and cathodic compartment and minimize the effect of the anode reaction on the ionic transport taking place through the membrane under study. Two Ag/AgCl reference electrodes immersed in Luggin capillaries were used to measure the voltage drop across the membrane, Um, and a potentiostat/galvanostat Autolab PGSTAT 20 was used as power source. More details and a schematic view of the experimental setup can be found in our previous work [17]. Different metallic sulfate solutions were used as electrolyte with the aim of comparing the transport of ions with different charge and which give rise to a variety of complex species. Na2SO4, NiSO4, Fe2(SO4)3 and Cr2(SO4)3 purchased from Panreac (Castellar del Vallès, Spain) were used to prepare solutions with distilled water.
Among available techniques for the characterization of ion transport through ion-exchange membranes, chronopotentiometry allows for the obtaining of information on the transients of ion transport at different current regimes. Additionally, the steady state values of Um obtained from each current pulse were used to plot the current-voltage curves of the different membrane/electrolyte systems investigated. Figure 1 shows the principle of the chronopotentiometric experiments. The chronopotentiograms evolve differently depending on the level of current density applied. At current densities i < ilim, concentration profiles at the depleting side of the membrane are not fully developed, so that the ionic resistance of the membrane phase is still the predominant one. Consequently, the response of Um is almost plane. When the ilim is approached, the selective transport of counterions through the membrane implies a depletion of ions at the diluted side of the membrane, the concentration of ions approaches zero near the membrane and a sharp increase in resistance is registered. This increased resistance can be tracked by a jump in Um in the chronopotentiograms. If the current density is further increased, the depletion layer near the membrane can increase in thickness. The jump in Um takes place faster and the final membrane resistance increases further. In the present work, the current was applied during 300 s and the relaxation of the membrane potential after switching the current off was further monitored for 150 s.

3. Results and Discussion

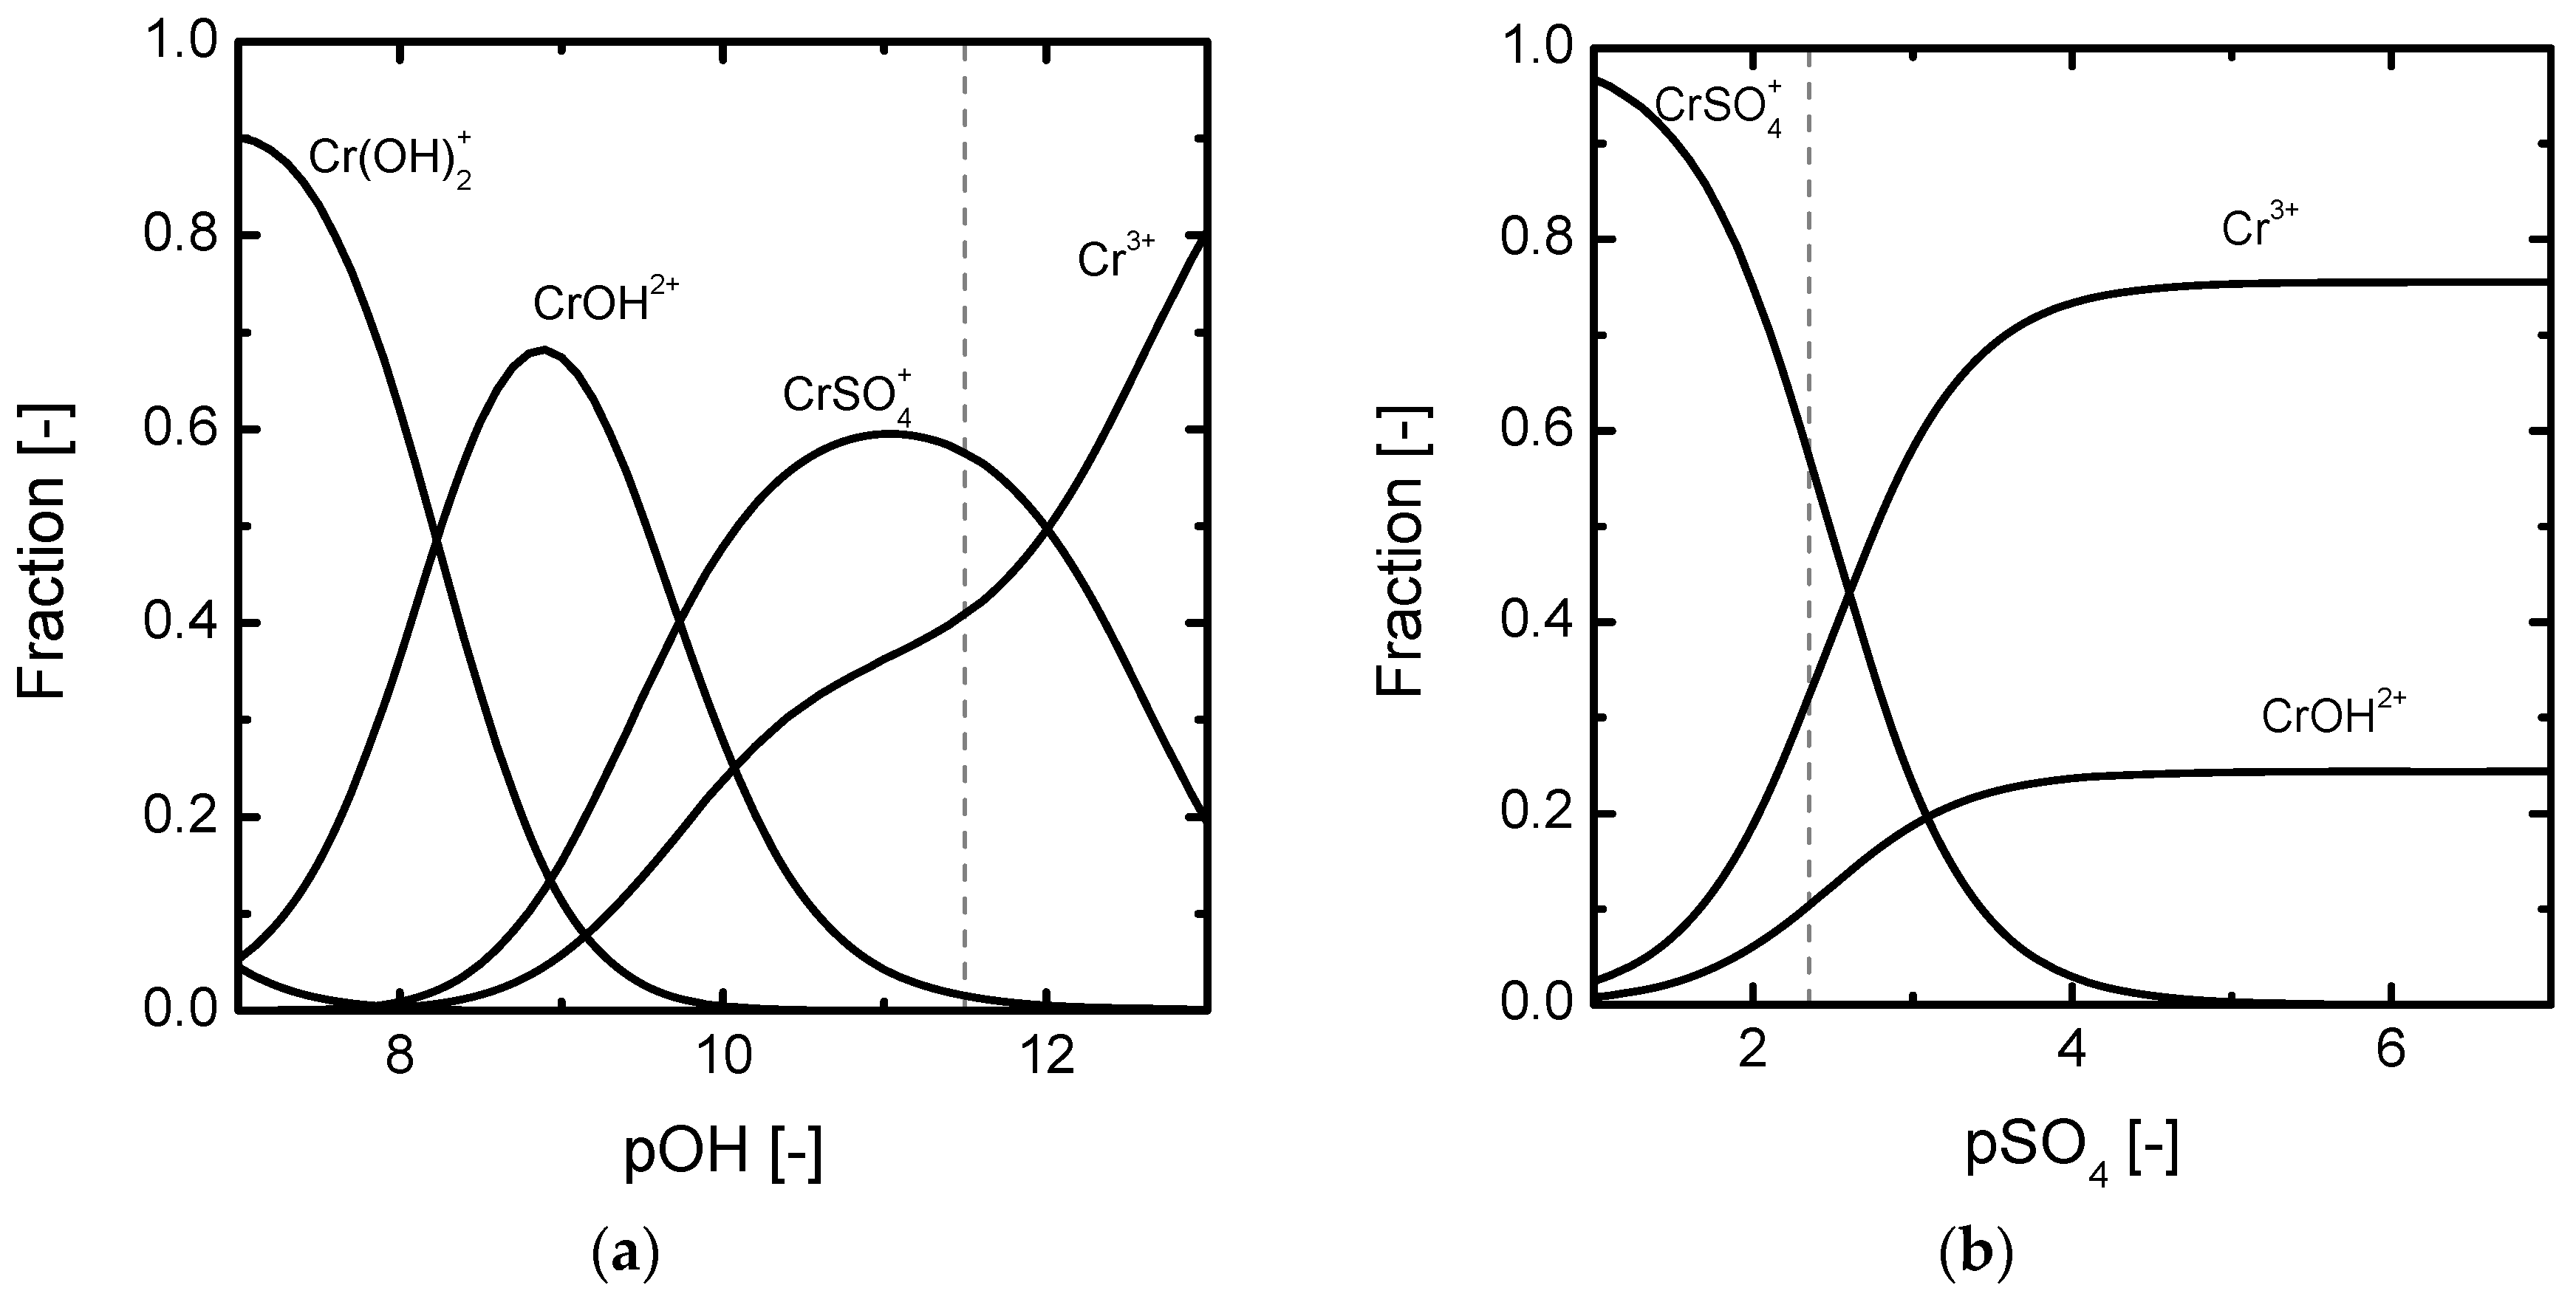
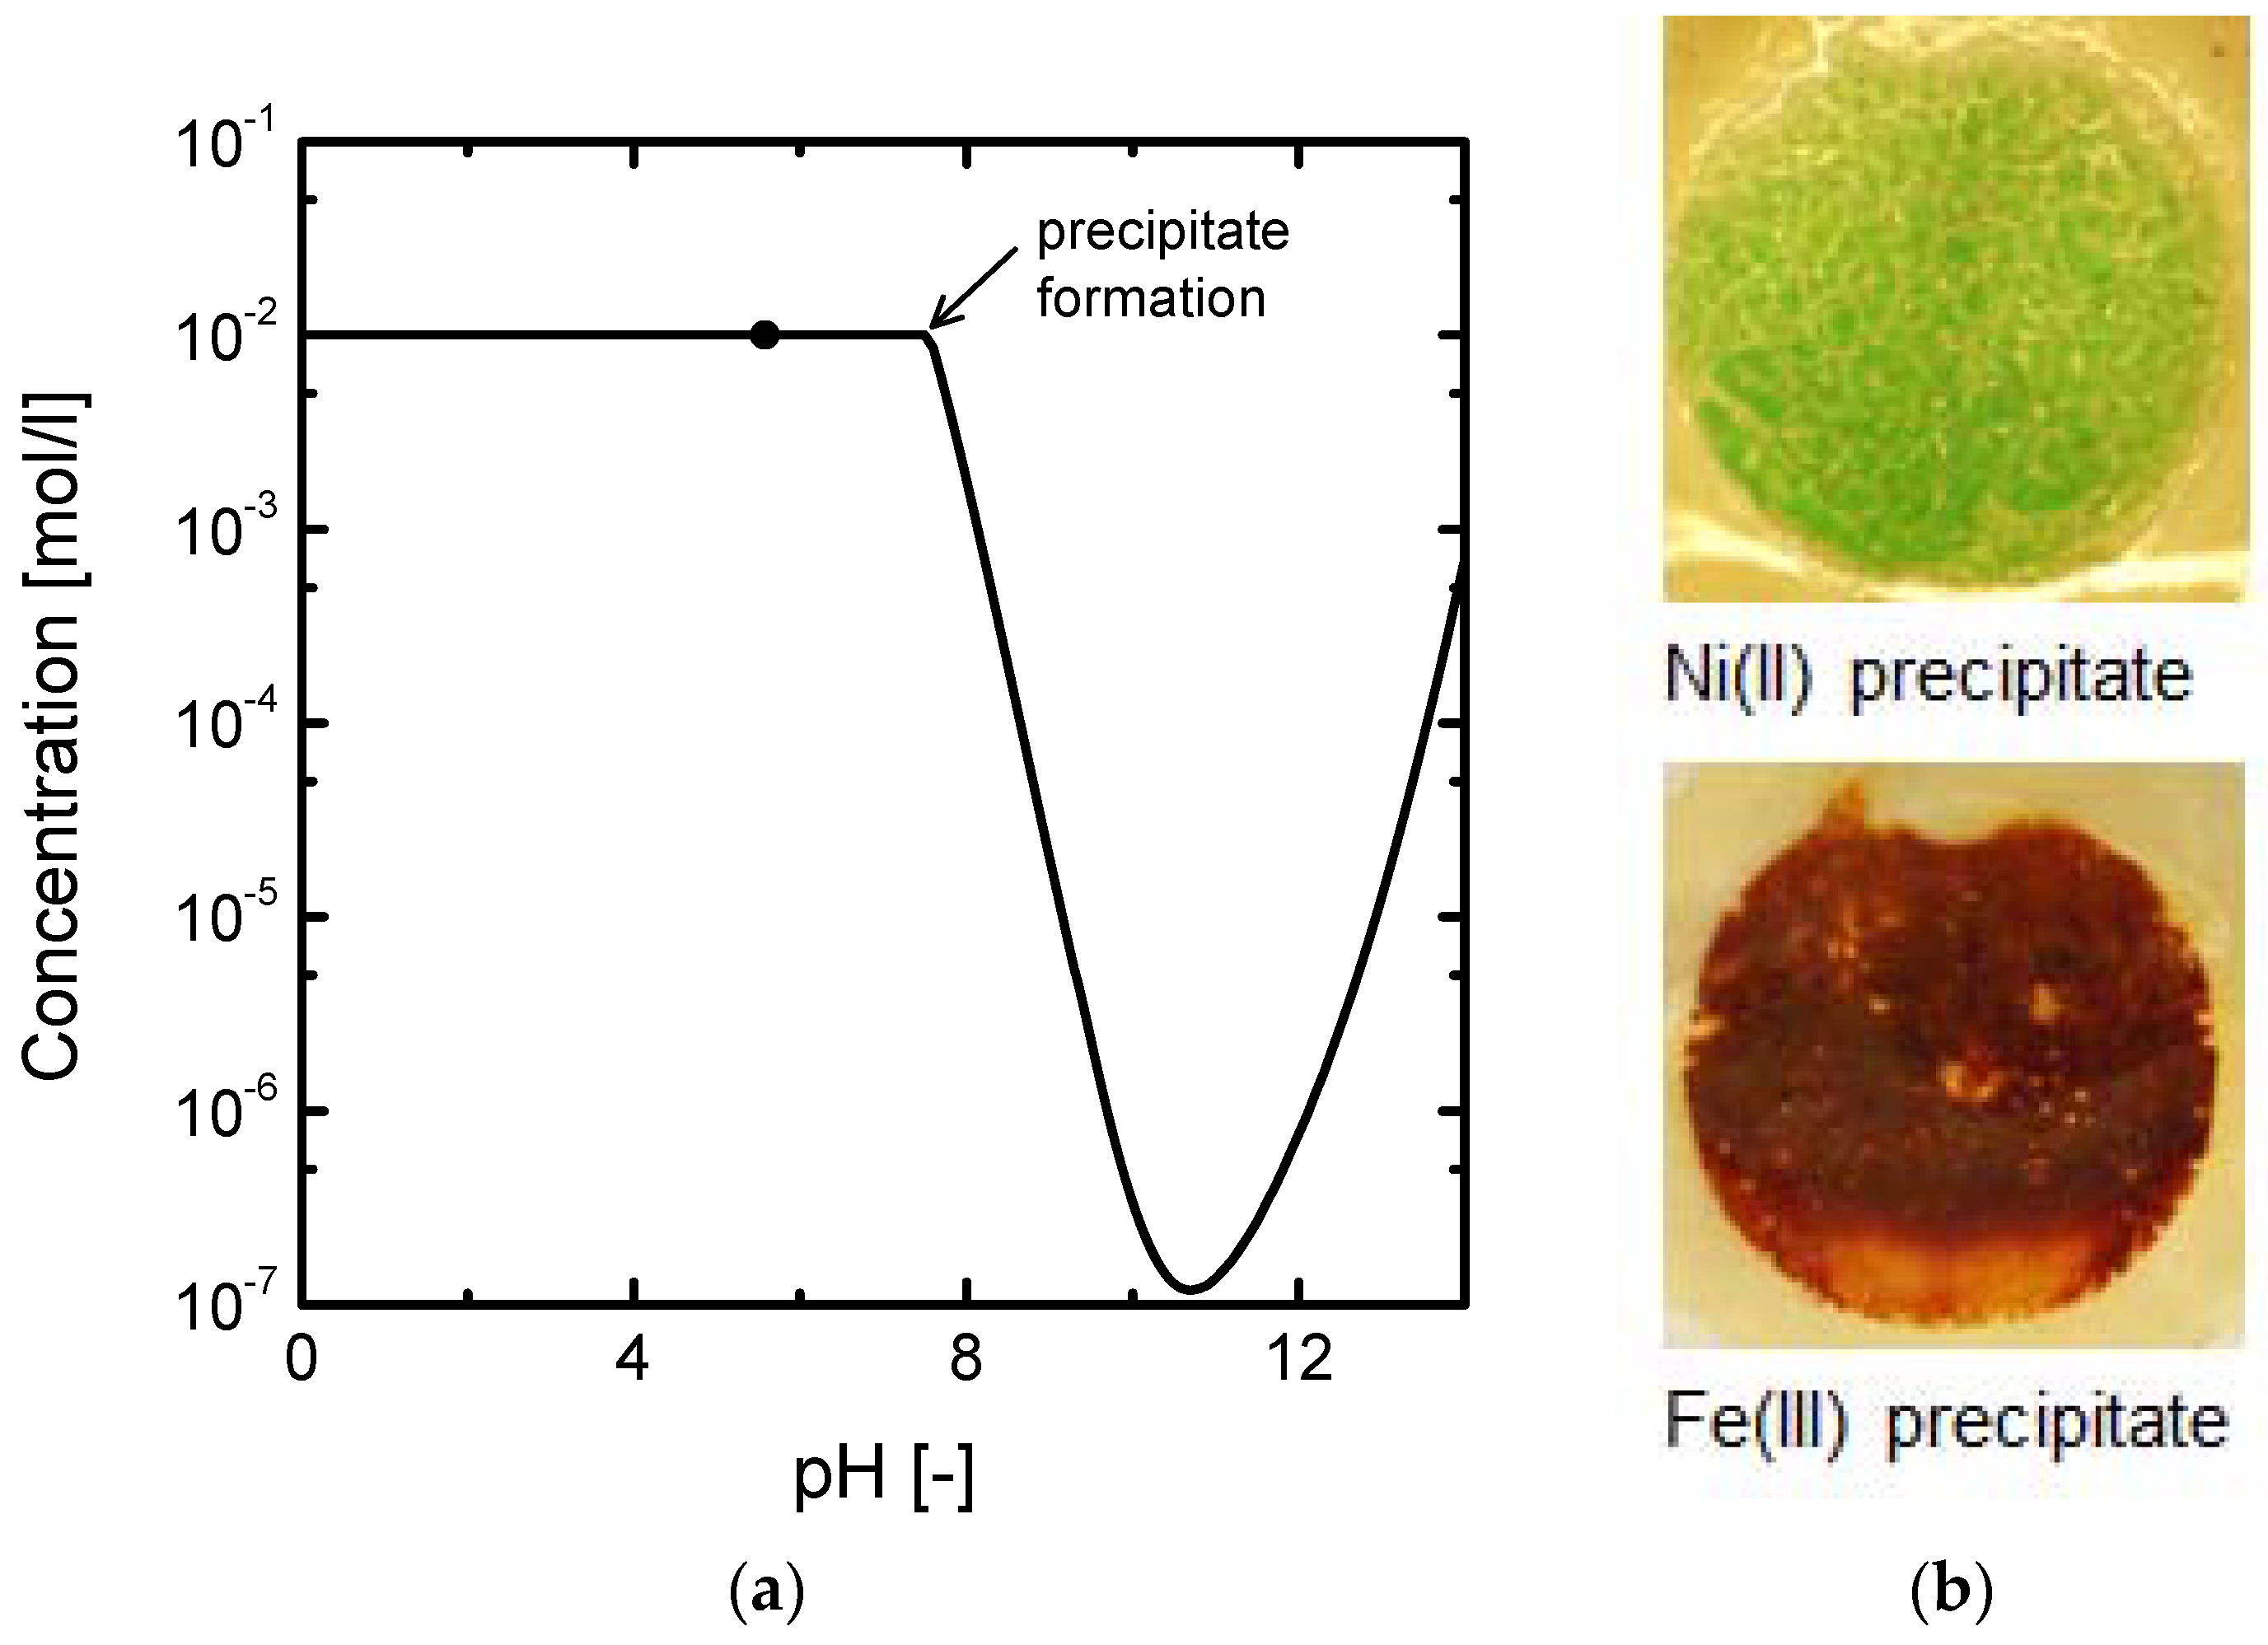
3.1. Phenomena Related to Shifts in Chemical Equilibria during Electrodialysis of Multivalent Ions

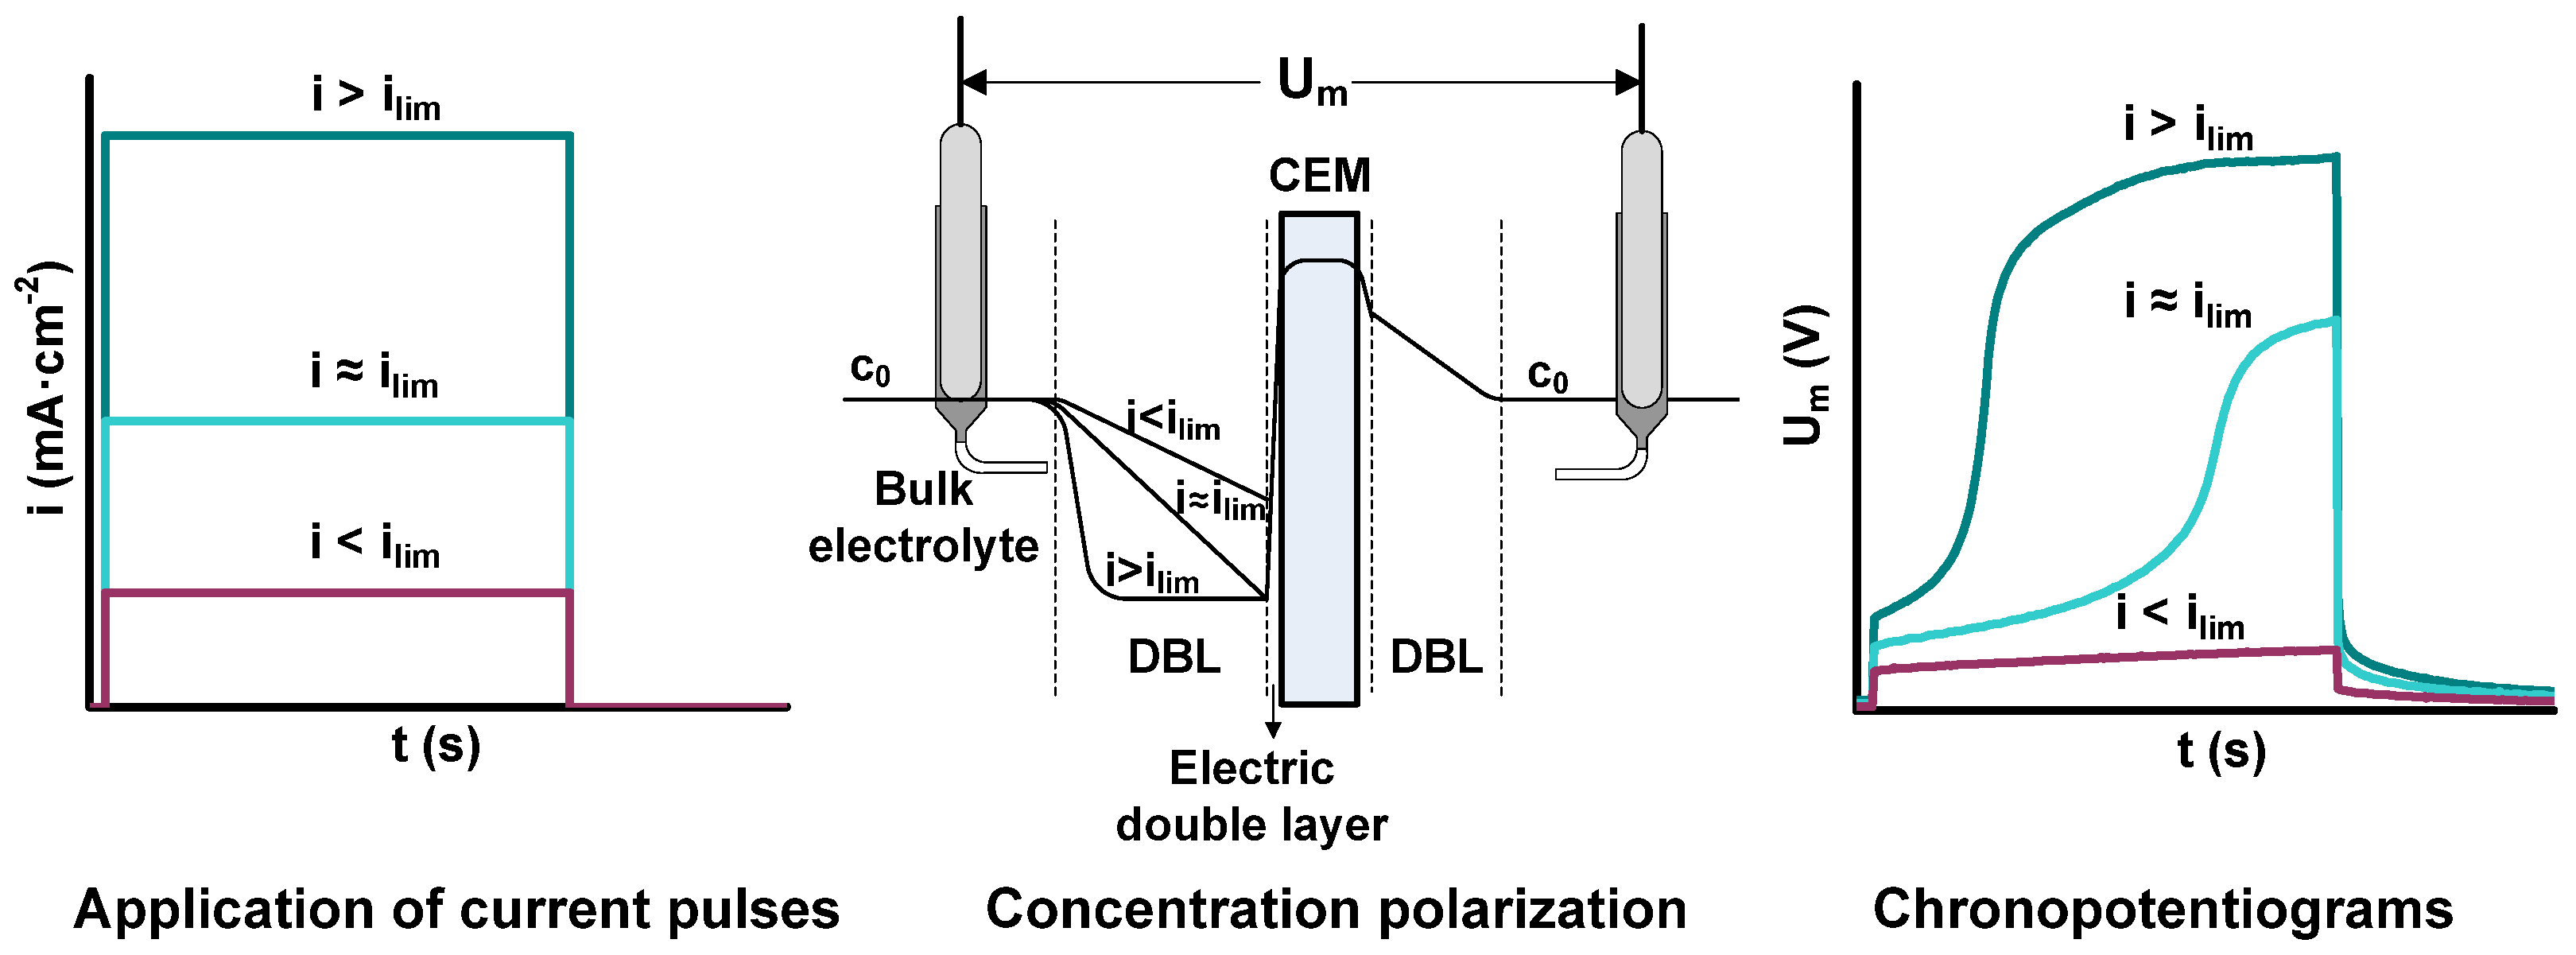
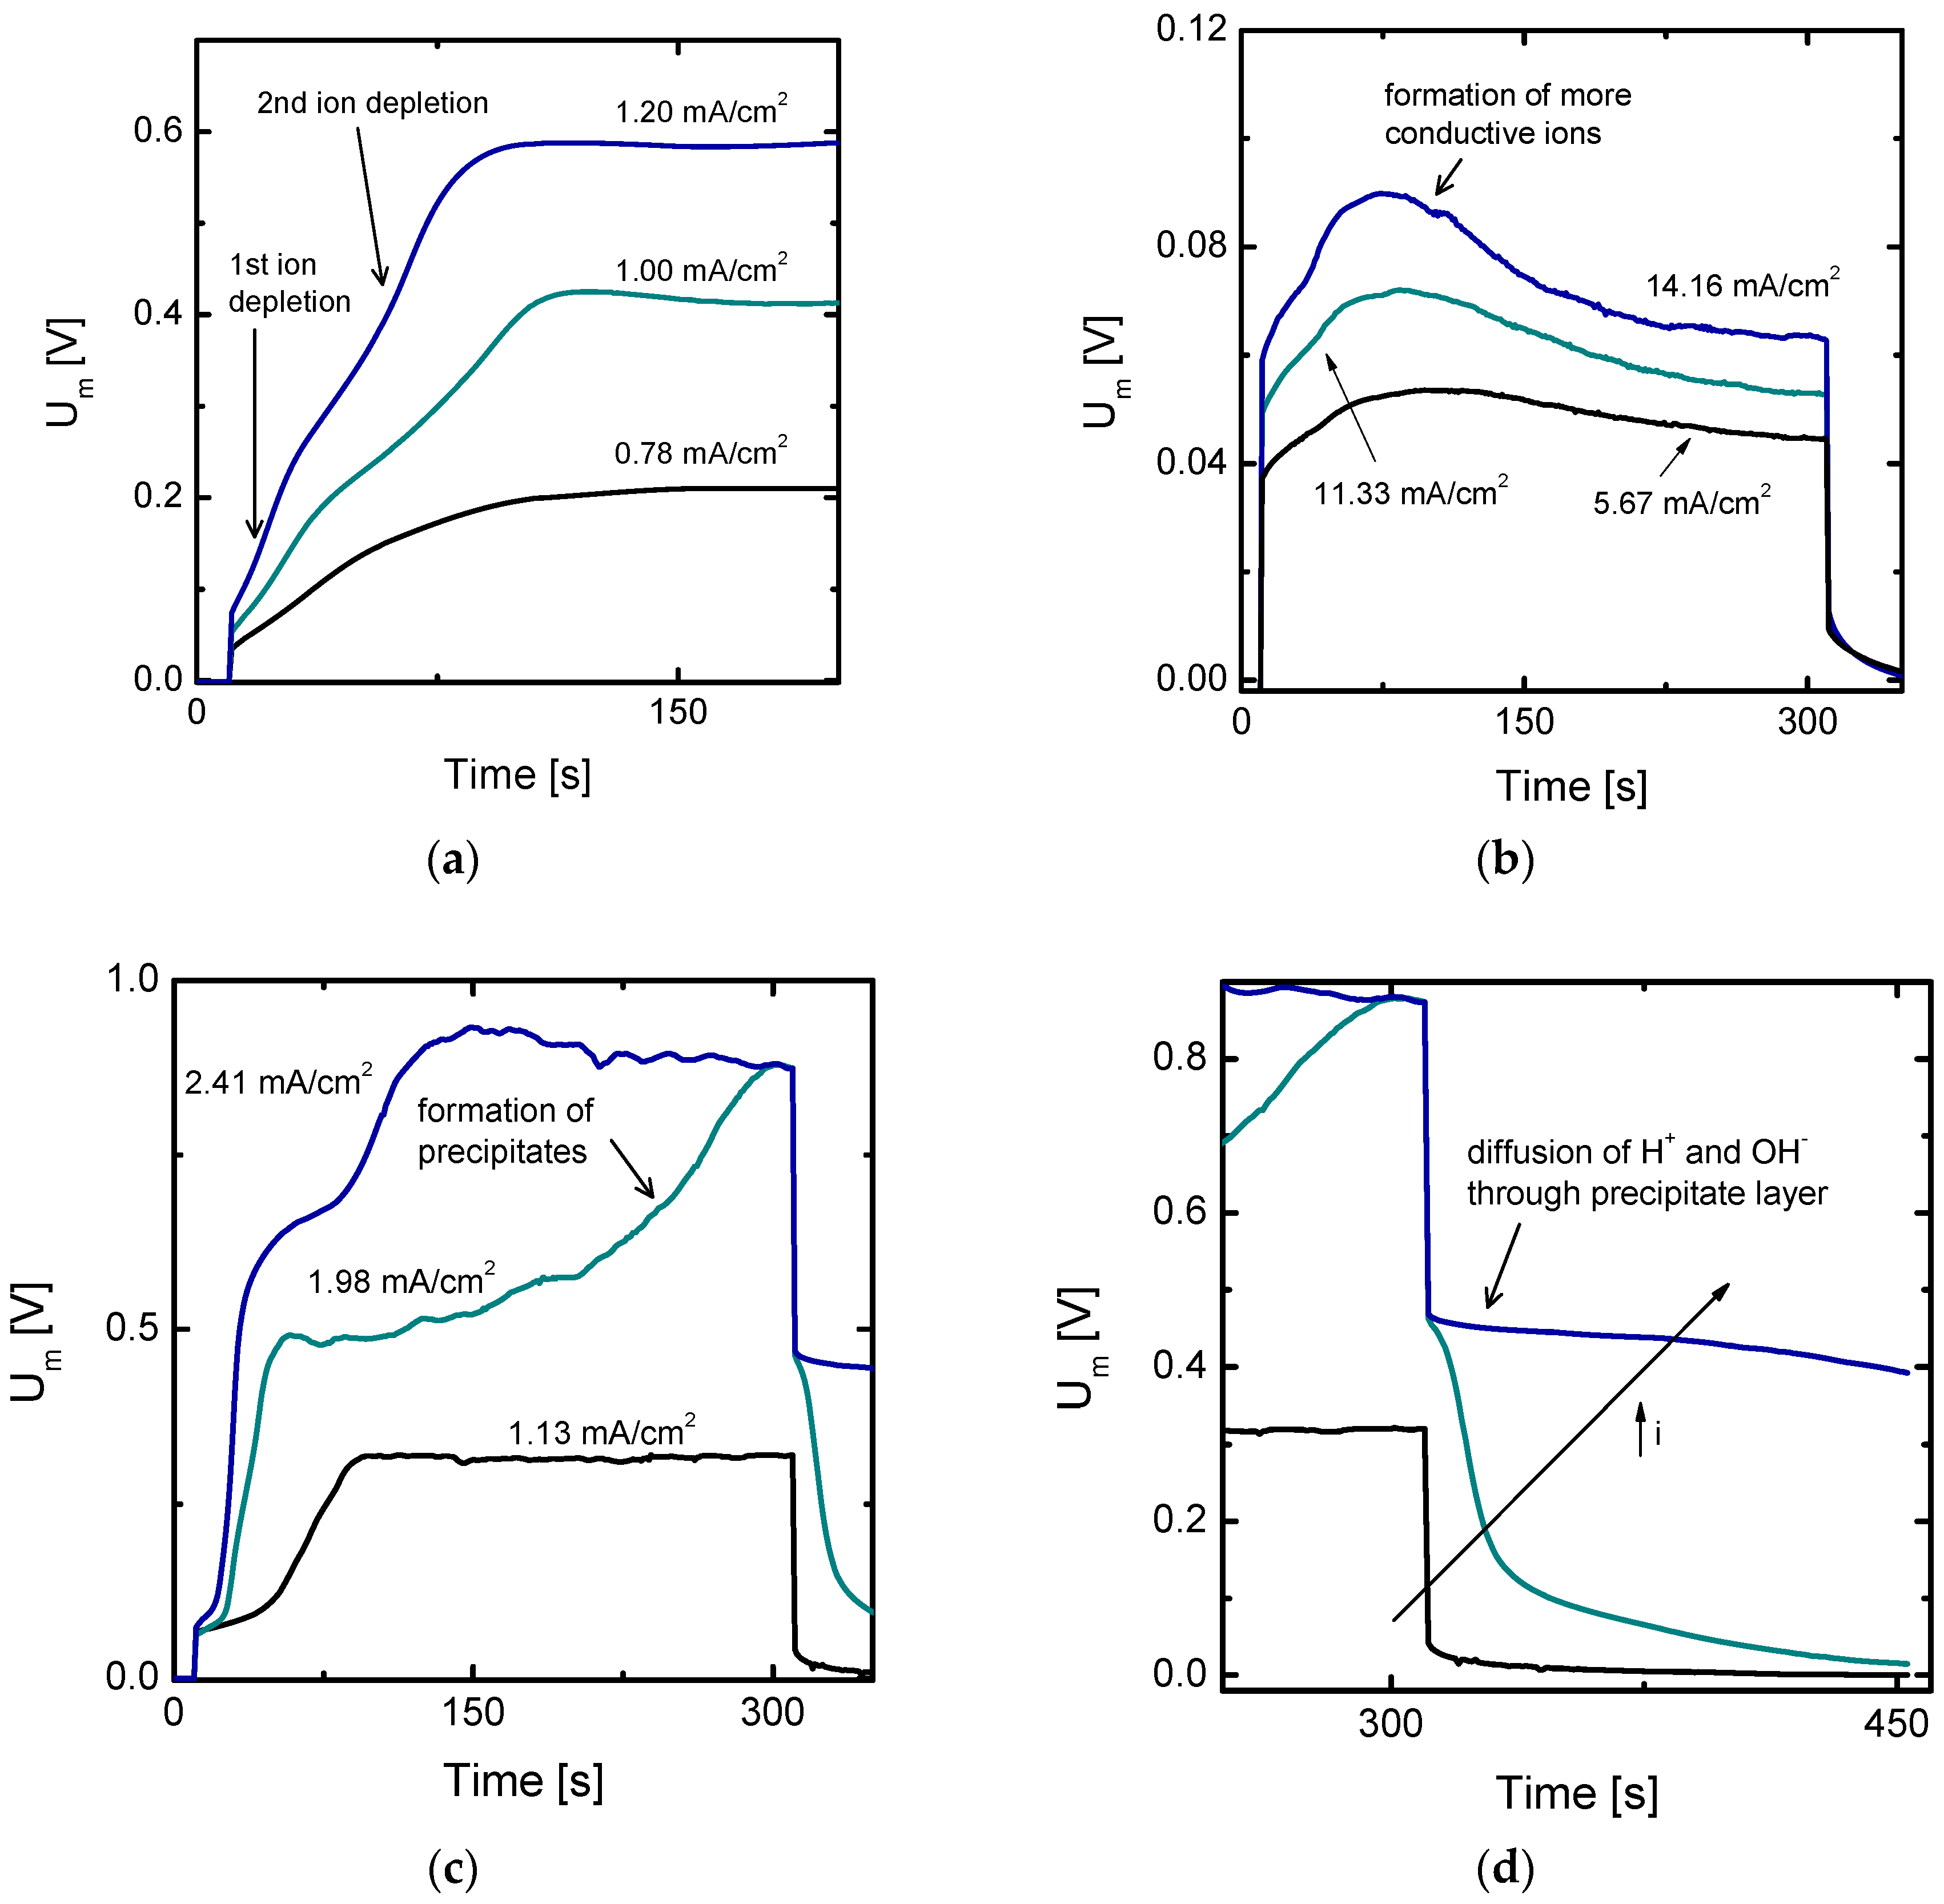
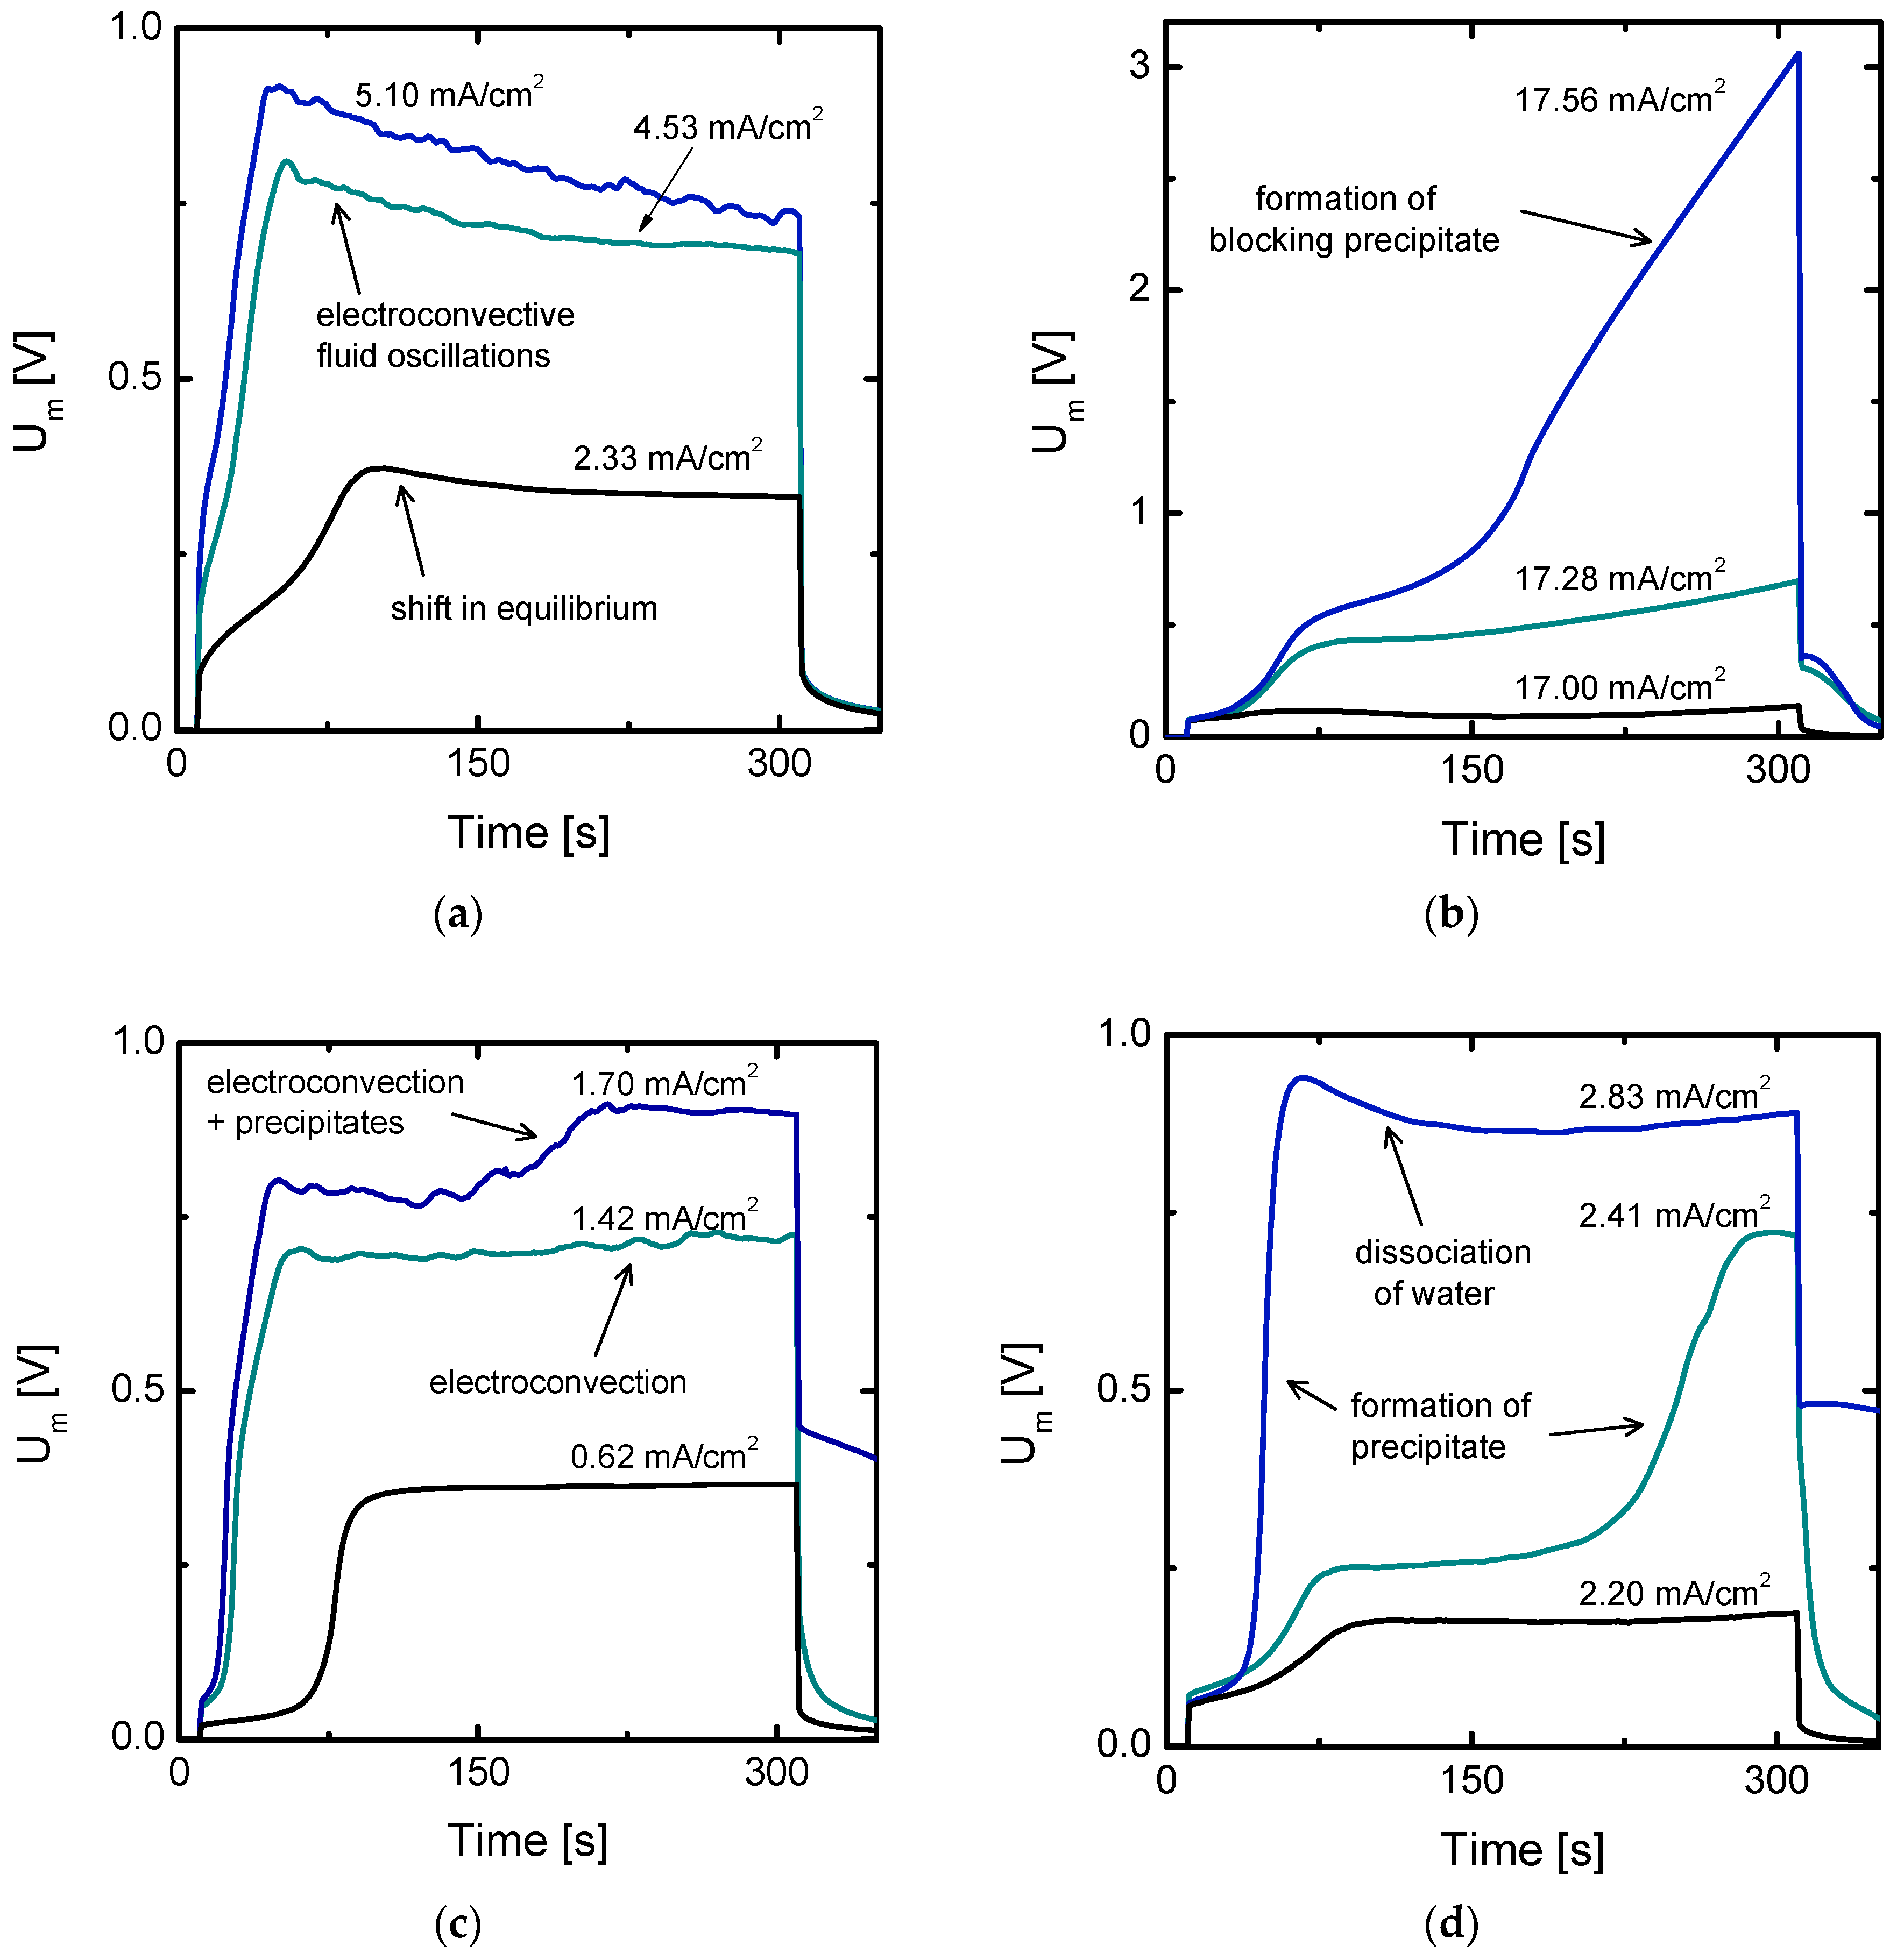
3.1.1. Chronopotentiometric Features

As explained above, chronopotentiometry provides information about different events happening in electrodialysis cells under the influence of an electric field, especially at the diluted diffusion boundary layer. Changes occurring as a consequence of the depletion of ions are manifested in the chronopotentiograms as an increase in the voltage drop of the membrane system [18]. Solutions with multivalent ions which form weak electrolytes give rise to additional events that can be tracked by changes in the ionic resistance of the membrane system. These can be concomitant to the decrease in ionic concentration in the diffusion boundary layer but they can be also caused by shifts in pH or chemical equilibrium. In the following, different chronopotentiograms gained from experiments conducted with metal sulfate solutions are discussed.
Figure 2 shows an overview of different types of peculiar responses obtained from chronopotentiometric measurements using solutions of multivalent cations. These curves differ from those typically obtained with salts of monovalent metals, like the ones schematically shown in Figure 1. Figure 2a shows chronopotentiograms obtained with Cr2(SO4)3 solutions at different current densities. The curve obtained at the lowest current density shows an inflexion point, which indicates that depletion of counter-ions at the membrane surface already occurred at this polarization level. However, as the current is further increased, a second inflection point is observed in the curves. After the first jump, Um levels off for an instant before the registration of a second jump in Um. This response can be explained by a redistribution of species across the DBL and in the membrane phase, which involves formation of new ions and an intermediate increase in membrane conductivity. This intermediate step restrains a continuous and uninterrupted increase in resistance and leads to a multi-step development of concentration polarization. At sufficiently high current densities and long times, a secondary stage of concentration polarization is achieved and Um attains a steady value; from here on the voltage response resembles that achieved with single salt solutions.
Figure 2b shows a different type of evolution of the membrane voltage obtained with solutions containing trivalent iron, Fe2(SO4)3. In this case, after an initial increase in Um, a maximum is reached and the membrane resistance decreases over time until an almost steady state value is registered at the end of the current pulse. This case can be also explained by a shift in the chemical equilibrium during the development of concentration polarization. However, in this case, the new species formed have higher ionic conductivities than the original ones present in the system and predominate over a wider range of currents. Moreover, the changes tracked during the registration of the curves take place slowly and at currents significantly below the ilim. In this case, the subsequent increase in Um only occurs at much higher current densities (not shown in the figure).
Finally, the curves presented in Figure 2c,d correspond to two different phases of the same experiments: the response registered during the application of the current pulse and during the relaxation of the membrane potential once the current is switched off. These curves were obtained with NiSO4 solutions. The curve obtained at the lowest current density in Figure 2c displays an inflexion point, with a shape analogous to that typically obtained for NaCl solutions (see Figure 1), where after the jump in Um, a steady state value is reached. At higher current densities, a second increase in Um is obtained in the curves. In this case, the increase in Um takes place more gradually than in the curves of Figure 2a and includes some rough oscillations. The response obtained once the current application ceases also showcases a different relaxation of the membrane potential depending on the previously applied current density. At the lowest current, the membrane potential evolves very fast during the relaxation process, dropping directly towards a value very close to zero after ceasing application of current and decreasing slowly later, until definitely reaching zero. In the cases where the second increase in Um was registered, the membrane potential drops initially to a value higher than 0.4 V. The relaxation profile of membrane potential is thus connected with the second increase of Um displayed when high currents are applied. After registration of these curves, a Ni(OH)2 precipitate layer was observed at the anodic side of the cation-exchange membrane. Consequently, the second increase in Um can be attributed to the formation of precipitate layers, which builds up an additional resistance to ion transport. The significantly high remaining potential (>0.4 V) seems therefore to be related to a limitation in the restoration of concentration profiles to the initial equilibrium state. This limitation may be caused by a strong polarization process and a hindrance in the re-equilibration of concentration profiles, as it will be analyzed in more detail below.
The obtained responses have been obtained with solutions composed of multivalent metals, like Ni(II), Fe(III) and Cr(III). Except for the case of Figure 2b, the level of polarization at which the peculiar features are observed is significantly above the corresponding ilim. However, in general, oscillations in membrane voltage drop typically associated with electroconvection were not observed. It seems that other processes related to the transport of salts of multivalent cations are responsible for the atypical chronopotentiometric features. Such processes occur even before electroconvective vortices start to be noticeable in the chronopotentiograms. Due to the complicated interplay between chemical equilibria and concentration polarization, the speciation diagrams at different concentrations serve as a helpful tool to explain the obtained responses. To describe the multi-stage concentration polarization process in the case of Cr2(SO4)3 solutions, the fraction of different species at the initial concentration are represented in Figure 3 as a function of pOH and pSO4. The straight lines show the initial equilibrium conditions in the solution. Because of the Donnan exclusion effect for co-ions in the membrane, higher pOH and pSO4 values prevail in the membrane phase. As the level of current density is increased and the DBL adjacent to the membrane gets depleted of ions, Donnan exclusion of co-ions is enhanced, since the difference between the concentration of fixed charges in the membrane and the concentration of ions at the membrane/solution interface increases. Accordingly, a shift in chemical equilibrium inside the membrane at high levels of concentration polarization may cause a decrease in pH (increase in pOH corresponding with a shift towards the right side in Figure 3a) and an increase of pSO4 (shift towards the right side in Figure 3b) inside the membrane phase. Consequently, the dissociation of CrSO4+ is favored:
CrSO4+ → Cr3+ + SO42−
The Cr3+ ions originated through Reaction (1) would initially compensate the membrane fixed charges and then permeate towards the concentrate compartment. The SO42− ions, on the contrary, migrate back to the DBL attracted by the anode. The generation of new current carriers via dissociation of CrSO4+ would therefore explain the stabilization of Um between the first and the second inflexion points detected in the chronopotentiometric curves. The subsequent exhaustion of Reaction (1) inside the membrane and the intensified depletion in the DBL give rise to the second inflection point in Um.
Since the Fe2(SO4)3 electrolyte system is similar to the Cr2(SO4)3 one, a homologous response was expected. On the contrary, the decrease in membrane resistance at increasing current densities obtained for Fe2(SO4)3 solutions can be associated with the generation of more ions (Fe3+) at polarization levels that are significantly below the ilim, before the ultimate ion depletion at the membrane surface takes place. This difference leads to the reduction of Um registered in the chronopotentiograms without a subsequent registration of a second inflexion point. The more differentiated stages of concentration polarization in the case of Fe2(SO4)3 solutions can be more clearly understood from the current-voltage curves explained in the next subsection.
Finally, the formation of precipitates observed with NiSO4 solutions can also be tracked with the help of solubility diagrams. Figure 4 shows the solubility plot for 10−2 M NiSO4 solutions. The dot in the plot represents the initial equilibrium conditions, corresponding to a pH value of 5.58. As current densities above the ilim are applied to the system, the transport of H+ through the membrane is enhanced because of the lack of Ni2+ ions next to the depleting membrane surface. Consequently, the pH in the depleting DBL increases until the formation of precipitates starts to occur (pH of 7.6) and the concentration of soluble species of Ni(II) drops abruptly. A similar phenomenon occurred with Fe2(SO4)3 solutions at overlimiting currents. The Ni(OH)2 and Fe(OH)3 precipitates formed at the membrane surface are shown in Figure 4b.

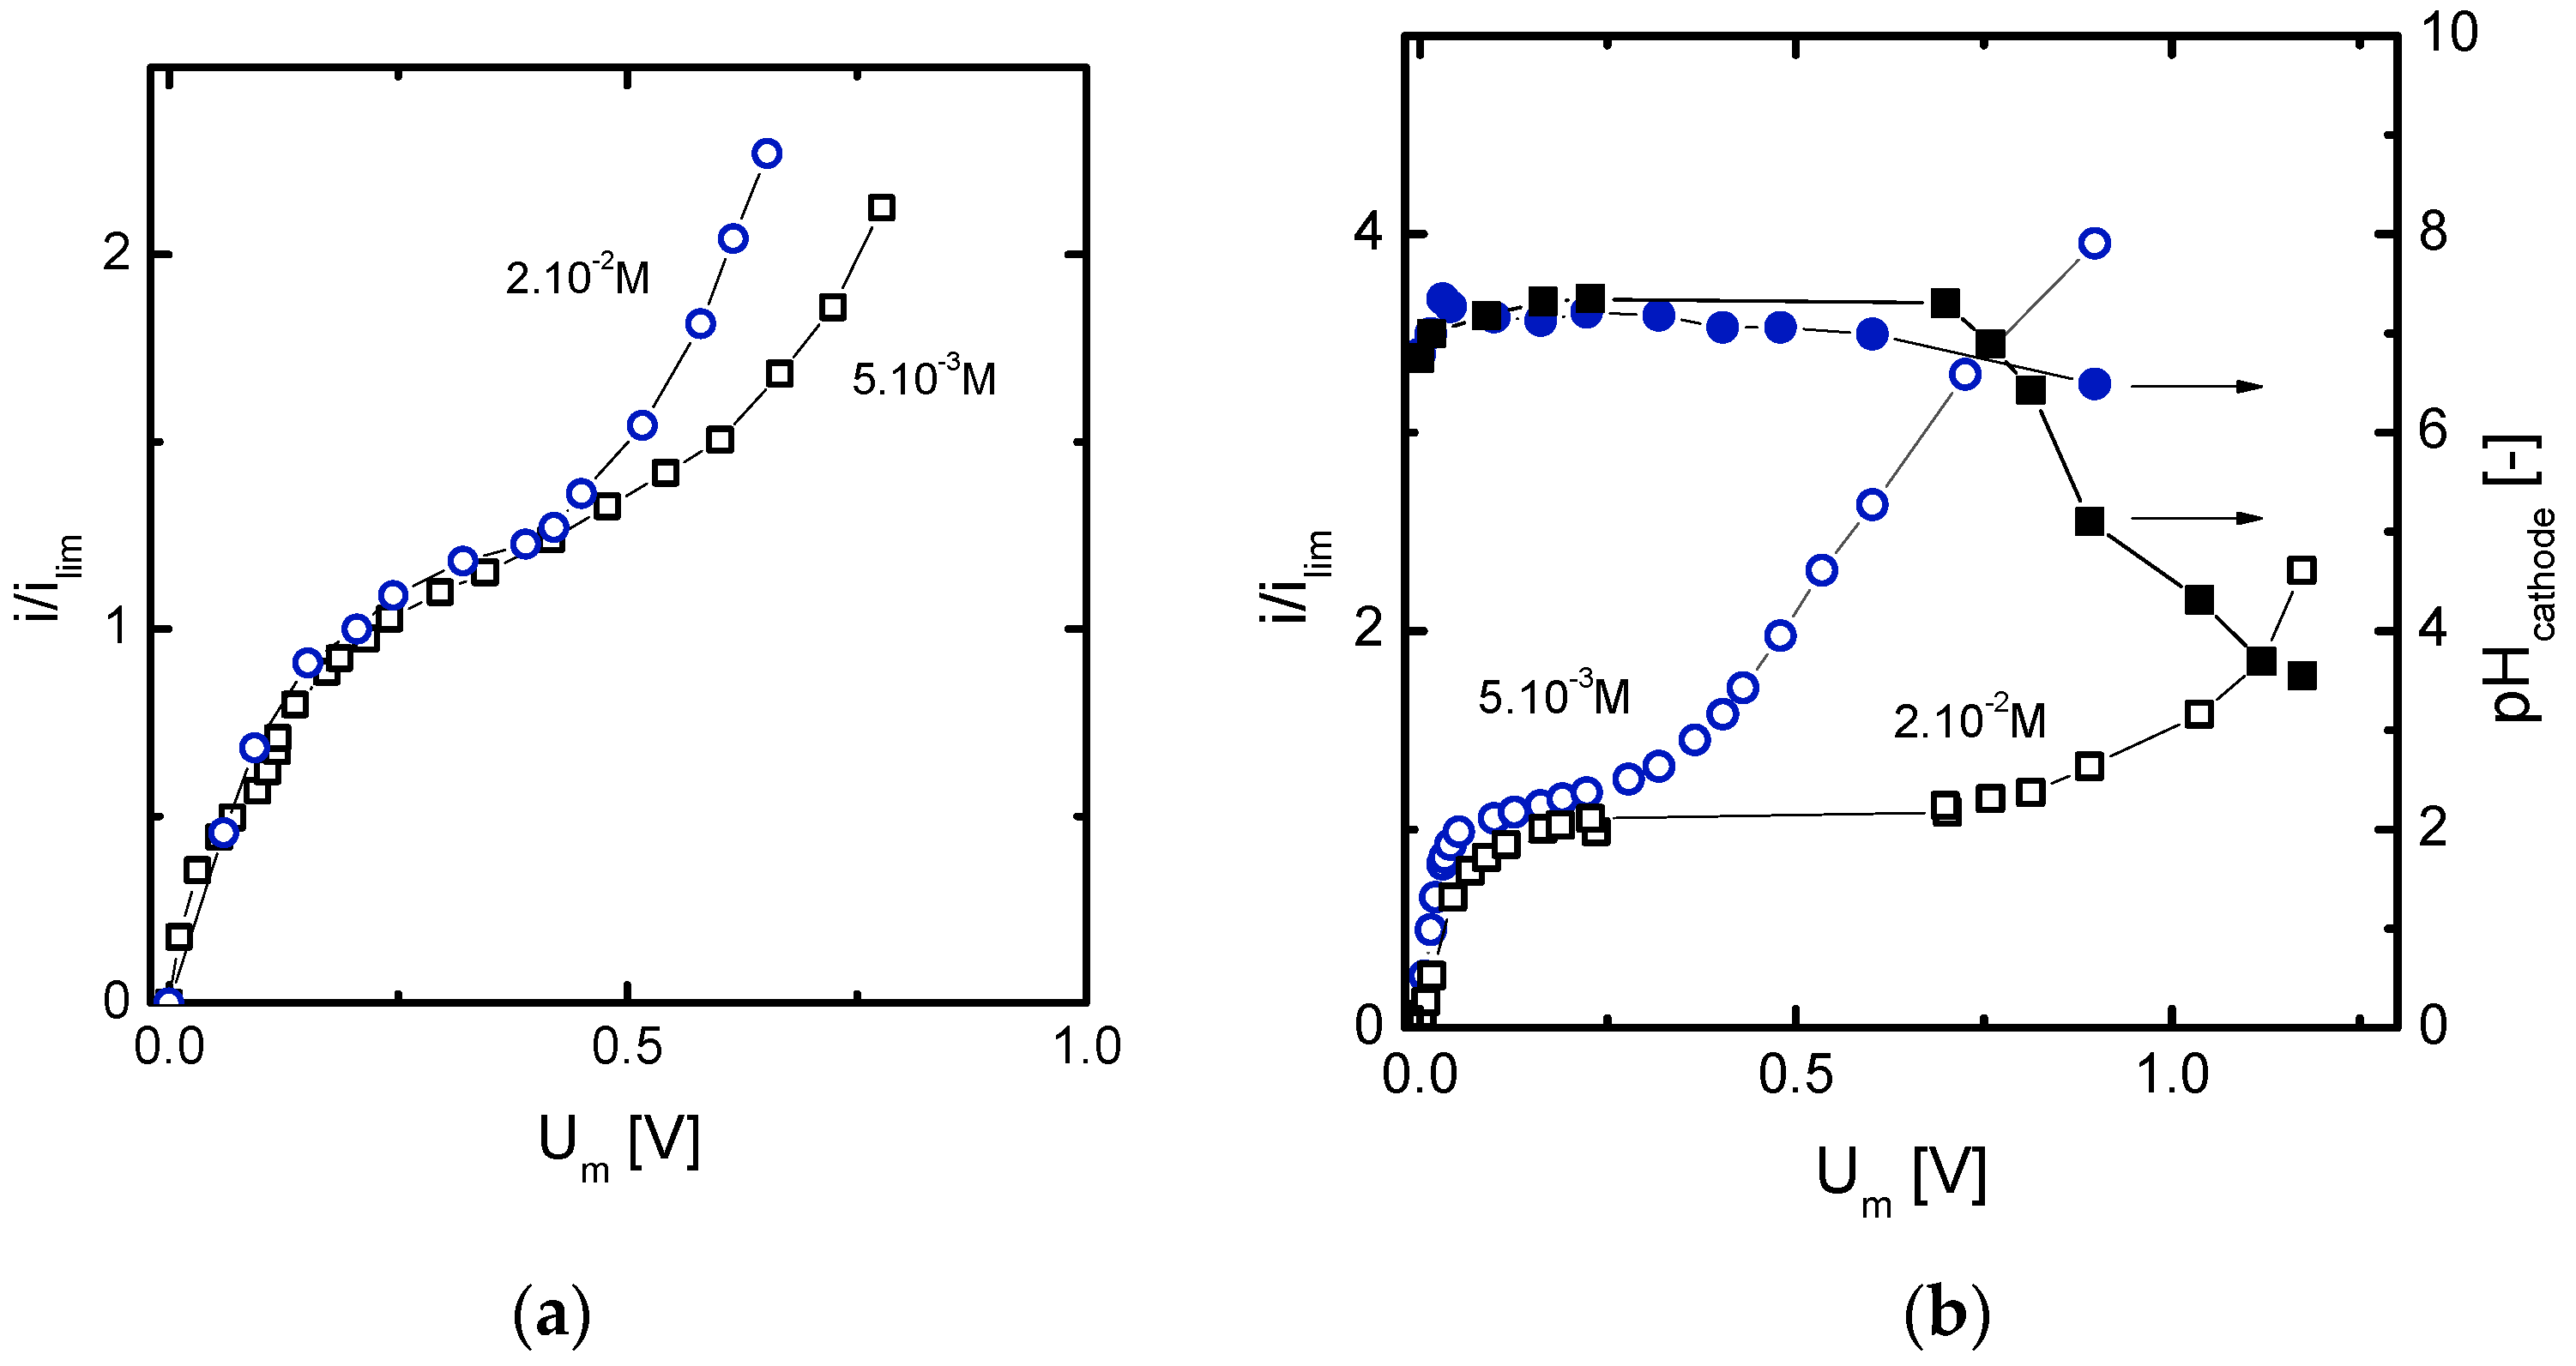
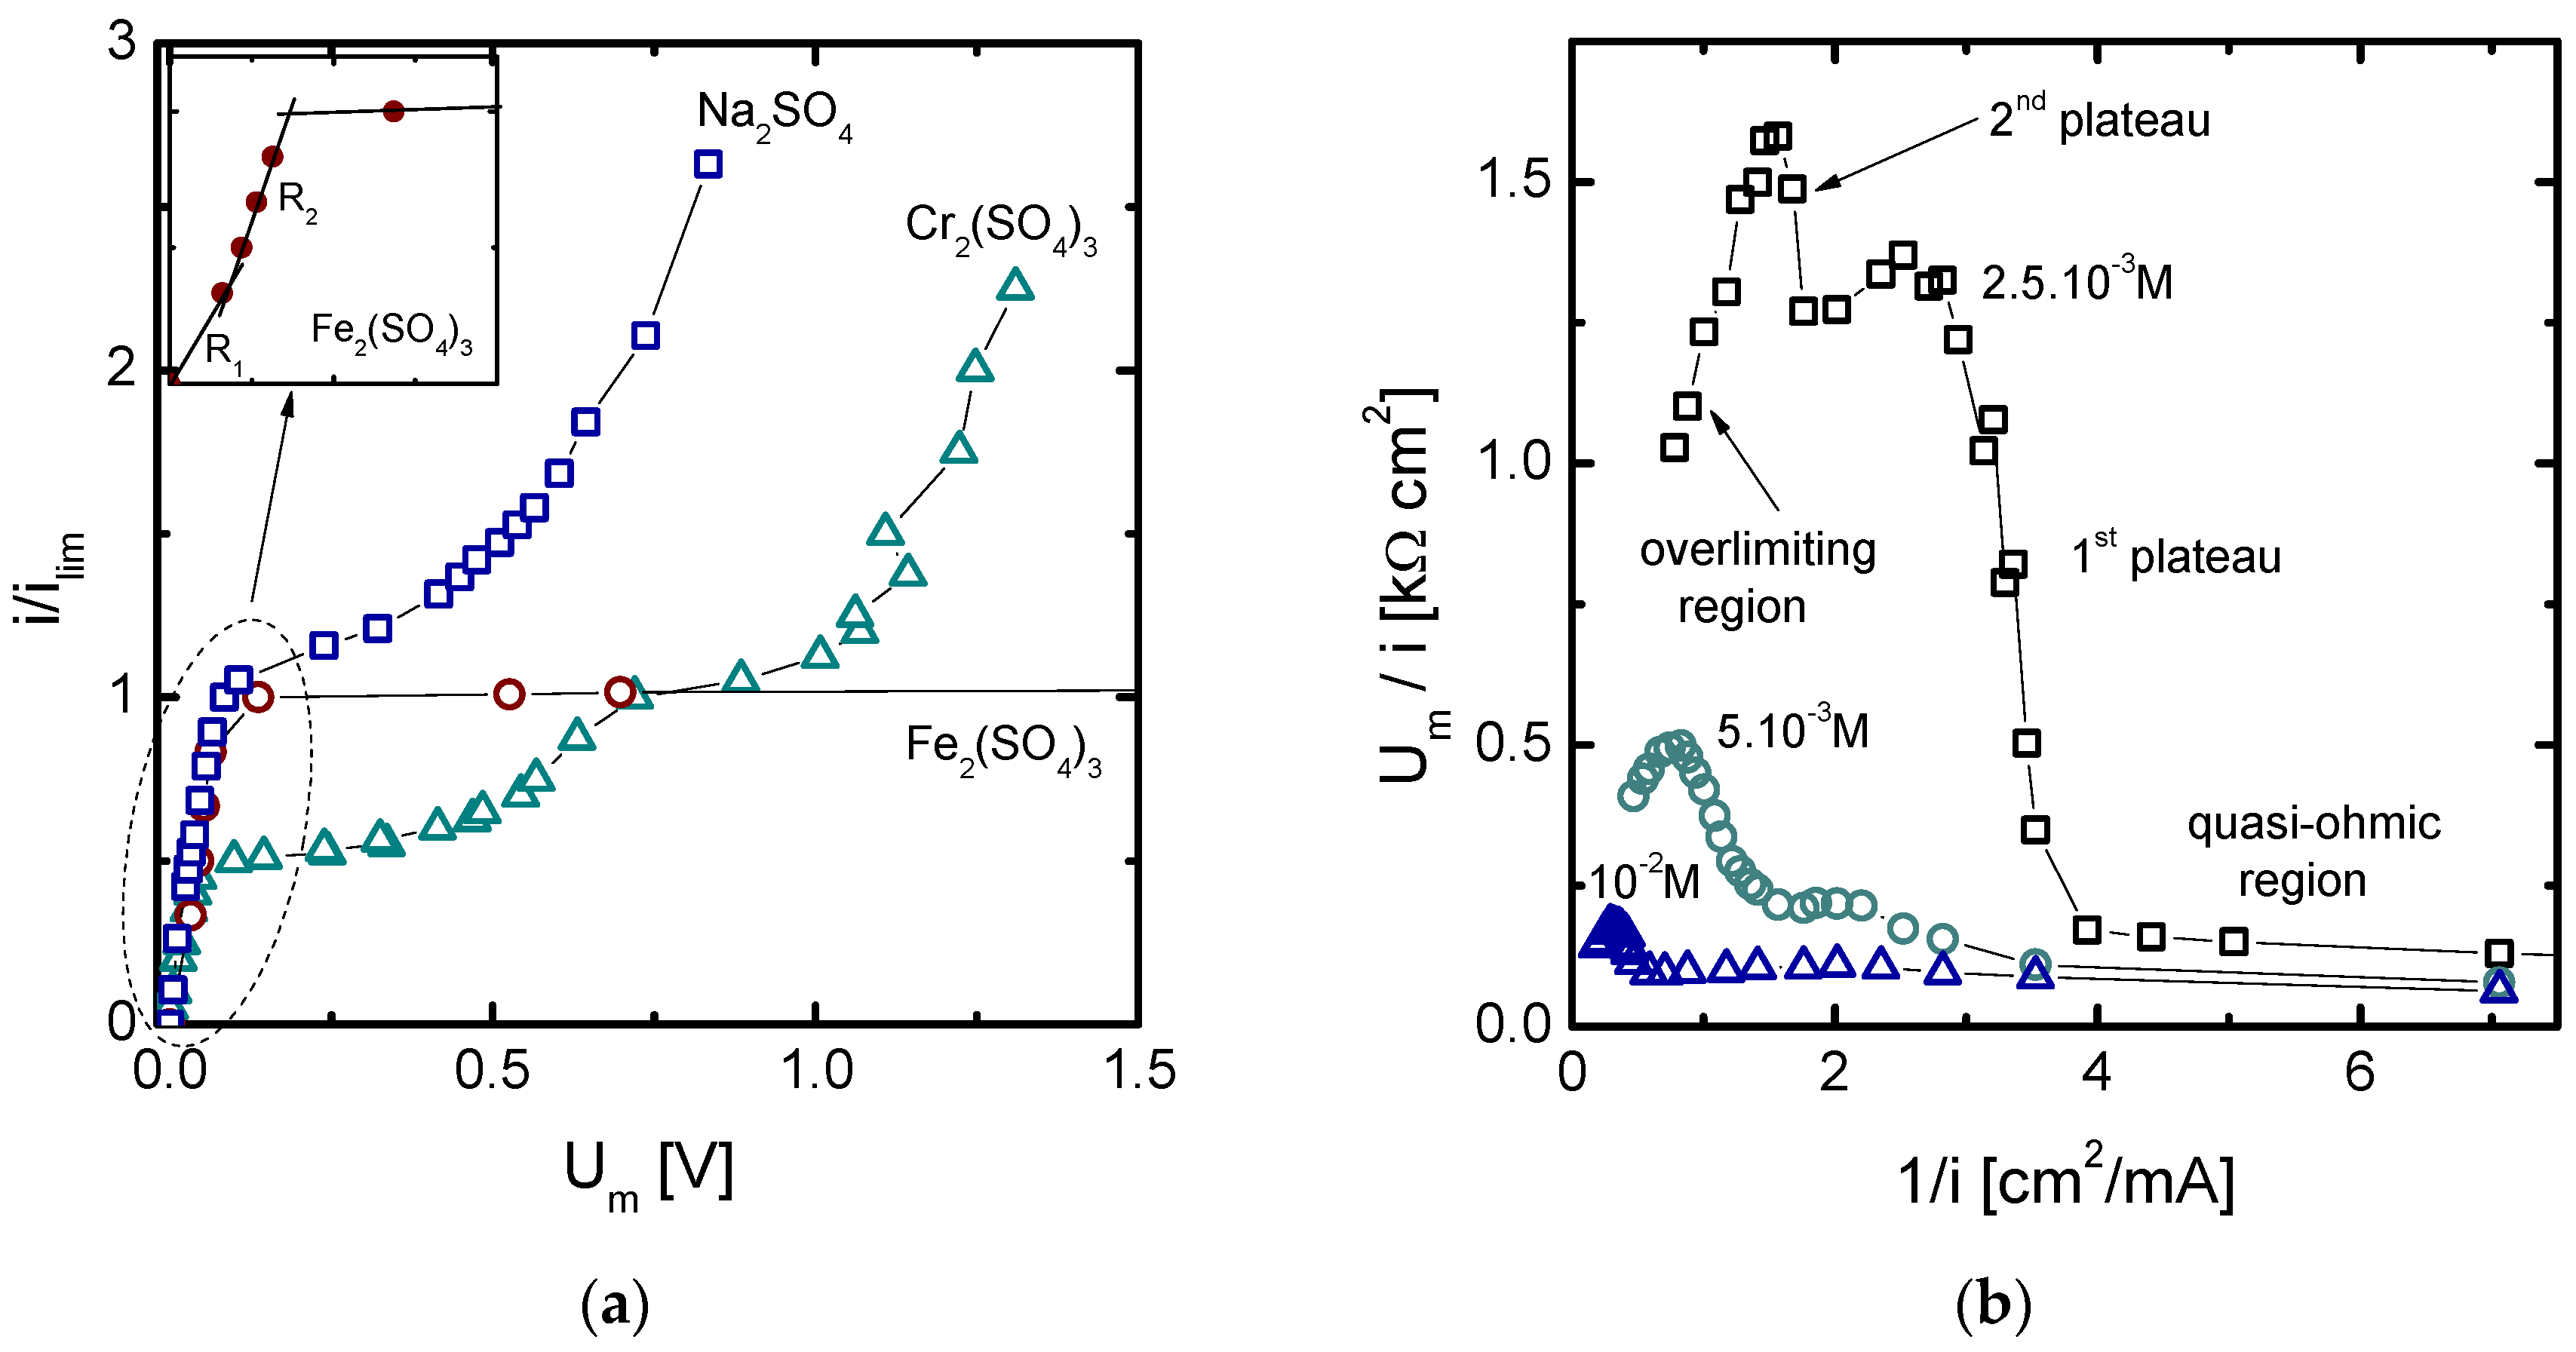
3.1.2. Current-Voltage Curves

Different phenomena related to shifts in the electrolyte speciation at different levels of polarization can also be examined from the current-voltage curves. These curves provide information about the resistance of the membrane system under quasi-steady state conditions and can serve to clearly distinguish between different operational regimes of electrodialysis. Figure 5a shows different current-voltage curves obtained for a strong electrolyte solution (Na2SO4) and for weak electrolytes (Cr2(SO4)3 and Fe2(SO4)3). To facilitate a better comparison of the curves obtained with the different electrolytes, the current densities are normalized by the ilim value corresponding to each system. The curves registered for Na2SO4 correspond with the typical shape obtained with strong electrolytes, where three clearly distinguishable regions are identified. At low membrane voltages, the system displays “quasi-ohmic” behavior, where a proportional linear relationship correlates current density with membrane voltage drop. As concentration polarization is intensified, for the same increase in current density, larger increases in Um are registered as compared to those obtained at lower current densities. The depletion of ions at the membrane surface entails a diffusional limitation of ion transport through the DBL, which leads to a tilted plateau region at current densities around the ilim. When a certain threshold of Um is reached, the plateau region evolves into the third characteristic region. At these intense electric fields, additional mass transfer mechanisms become important, thus giving rise to a further increase in current density. These mechanisms are mostly related to the dissociation of strong polarized water molecules at the membrane/depleting DBL interface or to the formation of electroconvective vortices, as it will be explained below.
In the case of Cr2(SO4)3 solutions, an atypical current-voltage curve having two plateau regions was obtained. Such behavior coincides with the registration of two transition times in the chronopotentiograms obtained at significantly high current densities (in this case, at current densities in between the two ilim values determined). The Cowan-Brown plots obtained at different concentrations of Cr2(SO4)3 solutions are shown in Figure 5b [19]. These plots are based on representing the specific electrical resistance of the system against the inverse of the current density, so that the transition between different regions of a current-voltage curve can be clearly identified. At low values of current density (right side of the plots), the resistance remains practically constant. As the first plateau emerges, the resistance increases notably. However, before reaching the second plateau and the overlimiting region, a region of currents where the system resistance decreases with the inverse of current can be clearly identified in the plots. This phenomenon occurs for different salt concentrations, although it is more marked for the more diluted ones.
Finally, the polarization curve for Fe2(SO4)3 presented in Figure 5a also showcases an atypical shape, where two principal regions were obtained: the quasi-ohmic part predominating at low voltage drops and a very flat plateau emerging after surpassing ilim and not being continued by a further rise of current (overlimiting region). In this case, the formation of precipitates takes place at the anodic side of the membrane, as it happened with the NiSO4 solutions. However, iron hydroxide precipitates seem to form a dense blocking layer which restricts a further rise of current density. If the quasi-ohmic region for Fe2(SO4)3 is analyzed in more detail, it is possible to distinguish two sub-regions of different membrane resistance. Interestingly, the curve becomes more inclined at higher currents, close to the ilim, meaning that the system becomes more ion-conductive at higher current densities. The current-voltage curve is thus in clear agreement with the chronopotentiograms of Figure 2b, where the decrease of Um with time was more marked at increasing current densities. All in all, the dissociation of complex species into more conductive Fe3+ ions causes a decrease in membrane resistance from R1 = 5.27 Ω·cm2 to R2 = 3.35 Ω·cm2 at currents slightly below the ilim. This effect is not reported in the case of strong electrolytes and opens new possibilities for the operation of electrodialysis systems dealing with weak electrolytes, which could offer advantages both in terms of ion flux and energy expenditure.

3.2. Phenomena Related to Overlimiting Mass Transfer Mechanisms

3.2.1. Chronopotentiometric Features

As demonstrated in the previous section, registration of distinctive features in chronopotentiometric curves can be utilized to better understand changes occurring in the membrane phase and within the DBLs as a consequence of concentration polarization. These changes are demonstrated to not only necessarily cause increases in the system resistance but also reduce it when dealing with weak electrolytes. Nonetheless, application of intense polarization levels can also involve the activation of overlimiting mass transfer mechanisms, mainly water dissociation and electroconvection. Figure 6 presents the evolution of different chronopotentiometric curves as the level of current density increases until reaching the overlimiting regime. Except for the case of Fe2(SO4)3 solutions (Figure 6b) where the overlimiting region was suppressed due to the formation of a blocking and isolating precipitate layer, the rest of panels showcase system responses where both shifts in the chemical equilibrium or formation of precipitates coexist with overlimiting mechanisms of mass transfer.
Figure 6a shows an example where a shift in the chemical equilibrium in the membrane system favoring the generation of more conductive ions takes place simultaneous to the formation of electroconvective vortices. First, at the lowest curve in the graph, only a characteristic decrease of Um with time can be seen, whereas no oscillations attributable to electroconvective vortices appear. However, in the two upper curves obtained at currents significantly higher than ilim, both phenomena are present: the decrease and the oscillations of Um over time. This type of evolution proves that electroconvection is not suppressed by shifts in the chemical equilibrium. The coexistence of both phenomena in the same curves could be an indication that dissociation reactions actually predominate in the membrane phase rather than in the DBL, so that the membranes become more conductive when charged with multivalent ions. Sarapulova et al. suggested that the conductivity of the membrane phase increases when the fixed charges are compensated with multiply charged counter-ions [20]. The same effect caused by a shift in the equilibrium condition inside the membrane phase would explain the decrease of Um with time. Moreover, the strong depletion at the diluting DBL would not impede the development of electroconvection. It is also noticeable that the size of the voltage oscillations increases with the current density, which signals the formation of larger vortices.
Figure 6b shows the formation of Fe(III) precipitates during the registration of chronopotentiograms. The formation of a precipitate layer is tracked by the continuous and notorious increase of Um with time at the highest currents. Here it is to be noted that the voltage drop through the membrane reaches a value higher than 3 V. The formation of precipitates at the anodic side of the membrane was visualized after finalization of the experiments (see Figure 4b). As already seen from the current-voltage curve lacking overlimiting region in Figure 5a, the increase in Um is continued, which implies that the precipitate layer blocks ion transport through the membrane, thus suppressing any possible overlimiting mass transfer mechanism. In contrast with the case of Fe2(SO4)3, Figure 6c,d obtained using NiSO4 solutions, are representative of chronopotentiograms where the formation of precipitates and overlimiting mass transfer mechanisms are coupled. In Figure 6c, as the ilim is exceeded, electroconvective vortices take place, thus limiting a continuous increase in Um, such as that observed for Fe2(SO4)3. The simultaneous evolution of electroconvection and formation of precipitates was also observed in Figure 2c. From the evolution of the curves it can be extracted that electroconvection occurs even at currents lower than the current at which formation of precipitates starts. Accordingly, the mixing of the DBL due to electroconvection does not prevent the formation of precipitates. This could be caused by the slight difference between the electrolyte pH at the beginning of the experiments and the pH where precipitation starts. It can be also observed that the electroconvective vortices do not cease after the formation of precipitates, which would indicate that the extended space charge region still prevails after formation of precipitates. In Figure 2c a decrease of Um associated with electroconvection is observed even after the formation of precipitates. In the case of NiSO4 solutions, the formation of electroconvective vortices is probably impeding the formation of a more compact and blocking precipitate layer, thus limiting the increase in membrane resistance associated with the deposited precipitates. The advantages of electroconvection are therefore not only related to the mixing of the DBL but also to the limitation of the growth of precipitates, as well as to its contribution to create a reversible and less compact precipitate layer.
Finally, Figure 6d shows another example where overlimiting mass transfer is coupled with the formation of precipitates. Here, at the intermediate current density, the typical increase of Um related to the precipitate deposition is very defined. As higher current densities are applied, the jump in Um due to ion depletion and the jump due to the formation of precipitates are overlapped. Then, a maximum is reached and Um decreases afterwards. In contrast with the decrease of Um reported in the previous curves, the pH of the bulk solution changed significantly during the chronopotentiometric measurements. The formation of a precipitate layer creates in this case a bipolar structure, which promotes the dissociation of water [21]. It has been demonstrated in previous works, that d-metal hydroxides, like Ni(OH)2 can catalyze the dissociation of water in electrodialysis systems [22]. Curiously, although the same salt was used in the experiments of Figure 6c,d, the overlimiting mass transfer phenomena arising are different. The higher concentration of Ni2+ ions in Figure 6d implies that precipitation of Ni(OH)2 starts at lower pH values, as can be deduced from the solubility plot of Figure 4. At this stage, it is important to highlight the sensitivity of the predominating mass transfer phenomena during electrodialysis on the concentration and type of electrolyte, as well as on the level of polarization applied to the system. On the contrary, the activation of electroconvection in the case of Figure 6c mixes the solution layer adjacent to the membrane surface, probably impeding the registration of uniform high local pH values near the membrane and generating a less compact precipitate layer, which has a gel-like structure. Moreover, as it can be seen in Figure 4b, the precipitate layer has an uneven thickness showcasing hill and valley regions, probably created during the evolution of the electroconvective vortices.

3.2.2. Current-Voltage Curves

Different current-voltage curves showcasing the predominance of different mass transfer mechanisms are presented in Figure 7. More specifically, Figure 7a highlights the effect of salt concentration on the threshold membrane voltage drop at which activation of electroconvection occurs. In congruence with the evolution of the chronopotentiograms obtained for Cr2(SO4)3 (see Figure 6a), overlimiting currents in these curves are caused by electroconvection. An earlier onset of electroconvection is desired in order to reduce energy losses associated with the operation at overlimiting currents. The results obtained indicate that higher concentrations of multivalent ions can reduce the length of the plateau region, which is in congruence with the findings of previous studies [13,14,23]. However, the simultaneous development of shifts in the speciation within the membrane system makes difficult to extrapolate this conclusion to all type of electrolytes and concentration ranges. Figure 7b shows an example where the contrary effect is observed: the plateau length is shorter for the more diluted solutions. In this case, the easier formation of precipitates at higher concentrations implies extended plateaus. The measurement of the pH at the cathodic compartments also proves that the type of overlimiting mass transfer mechanism can differ depending on the salt concentration. The pH at the cathodic compartment remained almost constant during the experiments conducted with 5 × 10⁻³ M NiSO4, which is in agreement with the predominant role of electroconvection observed in Figure 6c. On the contrary, after the first deposition of precipitates taking place with 2 × 10⁻² M NiSO4, the high transmembrane voltage drop, resulting from the precipitate layer, promotes the dissociation of water and the pH in the cathodic compartment drops abruptly. These results also indicate that an early onset of electroconvection does not avoid the formation of precipitates but can induce a change in the structure of the deposited precipitates which suppresses the dissociation of water molecules at the membrane/precipitate junction.

4. Conclusions

This work presented a qualitative analysis of the evolution of resistances to ion transport during electrodialysis of weak salts composed of multivalent metals. Results have shown that polarization of the membrane system can promote the dissociation of complex ionic species formed by the multivalent metals and lead to the generation of more mobile species. In the case of Fe2(SO4)3 solutions, this phenomenon takes place at currents below ilim and causes a decrease of Um during the course of the chronopotentiometric measurements. A quasi-ohmic region subdivided in two parts was also obtained in the current-voltage curves, being the region closest to the ilim more conductive than the region at lower currents. In the case of Cr2(SO4)3 solutions, a similar effect was identified, although at currents much closer to the ilim. Consequently, two different transition times were obtained in the chronopotentiograms and two plateau regions were identified in the current-voltage curves. The results obtained open the possibility to operate at high current densities with reduced system resistances, given the case that uncharged species or species with low mobility dissociate into more mobile counter-ions. However, the convenience of operating at such current density regimes should be evaluated during long-term experiments in future works.
This work showed experimentally for the first time that overlimiting mechanisms of mass transfer and shifts in chemical equilibrium at intense current density regimes can evolve simultaneously during electrodialysis of weak electrolytes. This finding is especially relevant, since it implies that electroconvective vortices are not suppressed by the generation of new species, even when precipitates are formed at the depleting membrane/solution interface. The development of electroconvective vortices seems to affect the precipitate structure, in a way that it prevents the formation of a homogeneous and compact bipolar structure where catalytic dissociation of water is activated. The cases in which electroconvection predominates as the overlimiting mass transfer mechanism coincide with current-voltage curves with shorter plateaus and minimal variations of the electrolyte pH. Therefore, intensified electroconvection also emerges as a promising phenomenon for preventing the formation of very dense precipitates which would cause an irreversible fouling of the membranes and very high membrane potential drops.

Author Contributions

Investigation, M.C.M.-C.; Writing-Original Draft Preparation, M.C.M.-C.; Writing-Review & Editing, M.C.M.-C., M.G.-G. and V.P.-H.; Supervision, V.P.-H.

Funding

Manuel César Martí-Calatayud acknowledges the funding received from Generalitat Valenciana (ASPOSTD/2017/059).

Conflicts of Interest

The authors declare no conflict of interest. The funders had no role in the design of the study; in the collection, analyses, or interpretation of data; in the writing of the manuscript and in the decision to publish the results.

References

  1. Barry, E.; McBride, S.P.; Jaeger, H.M.J.; Lin, X.-M.L. Ion transport controlled by nanoparticle-functionalized membranes. Nat. Commun. 2014, 5, 5847. [Google Scholar] [CrossRef] [PubMed] [Green Version]
  2. Ran, J.; Wu, L.; He, Y.; Yang, Z.; Wang, Y.; Jiang, C.; Ge, L.; Bakangura, E.; Xu, T. Ion exchange membranes: New developments and applications. J. Membr. Sci. 2017, 522, 267–291. [Google Scholar] [CrossRef]
  3. Zhao, W.-Y.; Zhou, M.; Yan, B.; Sun, X.; Liu, Y.; Wang, Y.; Xu, T.; Zhang, Y. Waste conversion and resource recovery from wastewater by ion exchange membranes: State-of-the-art and prospective. Ind. Eng. Chem. Res. 2018, 57, 6025–6039. [Google Scholar] [CrossRef]
  4. Feng, J.; Graf, M.; Liu, K.; Ovchinnikov, D.; Dumcenco, D.; Heiranian, M.; Nandigana, V.; Aluru, N.R.; Kis, A.; Radenovic, A. Single-layer MoS2 nanopores as nanopower generators. Nature 2016, 536, 197–200. [Google Scholar] [CrossRef] [PubMed]
  5. Zhu, X.; Hatzell, M.C.; Cusick, R.D.; Logan, B.E. Microbial reverse-electrodialysis chemical-production cell for acid and alkali production. Electrochem. Commun. 2013, 31, 52–55. [Google Scholar] [CrossRef]
  6. Strathmann, H. Electrodialysis, a mature technology with a multitude of new applications. Desalination 2010, 264, 268–288. [Google Scholar] [CrossRef]
  7. Martí-Calatayud, M.C.; Buzzi, D.C.; García-Gabaldón, M.; Ortega, E.; Bernardes, A.M.; Tenório, J.A.S.; Pérez-Herranz, V. Sulfuric acid recovery from acid mine drainage by means of electrodialysis. Desalination 2014, 343, 120–127. [Google Scholar] [CrossRef] [Green Version]
  8. Chen, D.; Hickner, M.A.; Agar, E.; Kumbur, E.C. Selective anion exchange membranes for high coulombic efficiency vanadium redox flow batteries. Electrochem. Commun. 2013, 26, 37–40. [Google Scholar] [CrossRef]
  9. Hou, L.; Wu, B.; Yu, D.; Wang, S.; Shehzad, M.A.; Fu, R.; Liu, Z.; Li, Q.; He, Y.; Afsar, N.U.; et al. Asymmetric porous monovalent cation perm-selective membranes with an ultrathin polyamide selective layer for cations separation. J. Membr. Sci. 2018, 557, 49–57. [Google Scholar] [CrossRef]
  10. Pham, S.V.; Kwon, H.; Kim, B.; White, J.K.; Lim, G.; Han, J. Helical vortex formation in three-dimensional electrochemical systems with ion-selective membranes. Phys. Rev. E 2016, 93, 033114. [Google Scholar] [CrossRef] [PubMed]
  11. Belashova, E.D.D.; Melnik, N.A.A.; Pismenskaya, N.D.D.; Shevtsova, K.A.A.; Nebavsky, A.V.V.; Lebedev, K.A.A.; Nikonenko, V.V.V. Overlimiting mass transfer through cation-exchange membranes modified by Nafion film and carbon nanotubes. Electrochim. Acta 2012, 59, 412–423. [Google Scholar] [CrossRef]
  12. Nebavskaya, K.A.; Sarapulova, V.V.; Sabbatovskiy, K.G.; Sobolev, V.D.; Pismenskaya, N.D.; Sistat, P.; Cretin, M.; Nikonenko, V.V. Impact of ion exchange membrane surface charge and hydrophobicity on electroconvection at underlimiting and overlimiting currents. J. Membr. Sci. 2017, 523, 36–44. [Google Scholar] [CrossRef]
  13. Choi, J.-H.; Lee, H.-J.; Moon, S.-H. Effects of electrolytes on the transport phenomena in a cation-exchange membrane. J. Colloid Interface Sci. 2001, 238, 188–195. [Google Scholar] [CrossRef] [PubMed]
  14. Martí-Calatayud, M.C.; García-Gabaldón, M.; Pérez-Herranz, V. Effect of the equilibria of multivalent metal sulfates on the transport through cation-exchange membranes at different current regimes. J. Membr. Sci. 2013, 443, 181–192. [Google Scholar] [CrossRef]
  15. Nikonenko, V.V.; Pismenskaya, N.D.; Belova, E.I.; Sistat, P.; Huguet, P.; Pourcelly, G.; Larchet, C. Intensive current transfer in membrane systems: Modelling, mechanisms and application in electrodialysis. Adv. Colloid Interface Sci. 2010, 160, 101–123. [Google Scholar] [CrossRef] [PubMed]
  16. Pismenskaya, N.D.; Belova, E.I.; Nikonenko, V.V.; Larchet, C. Electrical conductivity of cation-and anion-exchange membranes in ampholyte solutions. Russ. J. Electrochem. 2008, 44, 1285–1291. [Google Scholar] [CrossRef]
  17. Martí-Calatayud, M.C.; García-Gabaldón, M.; Pérez-Herranz, V.; Ortega, E. Determination of transport properties of Ni(II) through a Nafion cation-exchange membrane in chromic acid solutions. J. Membr. Sci. 2011, 379, 449–458. [Google Scholar] [CrossRef] [Green Version]
  18. Martí-Calatayud, M.C.; García-Gabaldón, M.; Pérez-Herranz, V.; Sales, S.; Mestre, S. Ceramic anion-exchange membranes based on microporous supports infiltrated with hydrated zirconium dioxide. RSC Adv. 2015, 5, 46348–46358. [Google Scholar] [CrossRef] [Green Version]
  19. Cowan, D.A.; Brown, J.H. Effect of turbulence on limiting current in electrodialysis cells. Ind. Eng. Chem. 1959, 51, 1445–1448. [Google Scholar] [CrossRef]
  20. Sarapulova, V.; Nevakshenova, E.; Pismenskaya, N.; Dammak, L.; Nikonenko, V. Unusual concentration dependence of ion-exchange membrane conductivity in ampholyte-containing solutions: Effect of ampholyte nature. J. Membr. Sci. 2015, 479, 28–38. [Google Scholar] [CrossRef]
  21. Tanaka, Y. Acceleration of water dissociation generated in an ion exchange membrane. J. Membr. Sci. 2007, 303, 234–243. [Google Scholar] [CrossRef]
  22. Mel’nikov, S.S.; Shapovalova, O.V.; Shel’deshov, N.V.; Zabolotskii, V.I. Effect of d-metal hydroxides on water dissociation in bipolar membranes. Pet. Chem. 2011, 51, 577–584. [Google Scholar] [CrossRef]
  23. Gil, V.V.; Andreeva, M.A.; Jansezian, L.; Han, J.; Pismenskaya, N.D.; Nikonenko, V.V.; Larchet, C.; Dammak, L. Impact of heterogeneous cation-exchange membrane surface modification on chronopotentiometric and current–voltage characteristics in NaCl, CaCl2 and MgCl2 solutions. Electrochim. Acta 2018, 281, 472–485. [Google Scholar] [CrossRef]
Figure 1. Correlation between the shape of the input applied current density, the profiles of concentration through the membrane system and the corresponding response of Um.
Applsci 08 01566 g001
Figure 2. Examples of chronopotentiograms characteristic of phenomena related to shifts in the equilibrium at the depleting diffusion boundary layer of cation-exchange membranes. (a) Curves obtained when different species become depleted at the membrane surface, experiments conducted with 2.5 × 10⁻³ M Cr2(SO4)3; (b) Curves obtained when equilibrium is shifted towards formation of more mobile ions using 2 × 10⁻² M Fe2(SO4)3 solutions; (c) Curves obtained during formation of precipitates at the membrane surface using 10−2 M NiSO4 solutions; (d) Membrane potential relaxation profile after formation of precipitates at the membrane surface.
Applsci 08 01566 g002
Figure 3. Equilibrium diagrams for 2.5 × 10⁻³ M Cr2(SO4)3 solutions: (a) Speciation diagram as a function of pOH, (b) speciation diagram as a function of pSO4.
Applsci 08 01566 g003
Figure 4. (a) Precipitation diagram of 10−2 M NiSO4 solutions. The dot represents the initial pH under equilibrium conditions. (b) Pictures of the membrane surface facing the diluate compartment after the formation of precipitates of Ni(II) and Fe(III).
Applsci 08 01566 g004
Figure 5. (a) Normalized current-voltage curves obtained for different solutions and (b) Cowan-Brown plot obtained for Cr2(SO4)3 solutions of different concentrations.
Applsci 08 01566 g005
Figure 6. Examples of the evolution of chronopotentiograms at increasing current densities where overlimiting current transfer mechanisms evolve. (a) Curves obtained with Cr2(SO4)3 solutions where electroconvective vortices evolve; (b) curves obtained with Fe2(SO4)3 solutions where the formation of precipitates blocks the membrane surface and hampers overlimiting currents; (c) curves obtained with 5 × 10⁻³ M NiSO4 solutions where first electroconvection arises and then electroconvective vortices coexist with the formation of precipitates; (d) curves obtained with 2 × 10⁻² M NiSO4 solutions where precipitates are formed before activation of electroconvection and then the dissociation of water is promoted.
Applsci 08 01566 g006
Figure 7. (a) Normalized current-voltage curves obtained for different solutions of Cr2(SO4)3 and (b) for different concentrations of NiSO4 where different overlimiting mass transfer mechanisms occur.
Applsci 08 01566 g007

