Article

Measurement of High Numerical Aperture Cylindrical Surface with Iterative Stitching Algorithm

1
Lab of Applied Optics and Metrology, Department of Precision Mechanical Engineering, Shanghai University, Shanghai 200072, China
2
Guangdong Provincial Key Laboratory of Optical Fiber Sensing and Communications, Department of Optoelectronic Engineering, Jinan University, Guangzhou 510632, China
3
Department of Physics, Chemistry and Biology (IFM), Linköping University, SE-581 83 Linkoping, Sweden
4
Centre for Optical and Laser Engineering, School of Mechanical and Aerospace Engineering, Nanyang Technological University, Singapore 639798, Singapore
*
Author to whom correspondence should be addressed.
Appl. Sci. 2018, 8(11), 2092; https://doi.org/10.3390/app8112092
Submission received: 22 September 2018 / Revised: 22 October 2018 / Accepted: 23 October 2018 / Published: 29 October 2018
(This article belongs to the Special Issue Precision Dimensional Measurements)

Abstract

:

Featured Application

The proposed method is used to test the contour of a cylindrical lens and improve the performance of optical systems.

Abstract

There are some limitations in null test measurements in stitching interferometry. In order to meet the null test conditions, the moving distance between the sub-apertures often deviates from the theoretical preset distance, which leads to a position deviation of sub-apertures when measured. To overcome this problem, an algorithm for data processing is proposed in this paper. An optimal estimation of the deviation between sub-apertures is used to update their positions, and then a new overlapped region is obtained and again optimized. This process is repeated until the algorithm converges to an acceptable tolerance, and finally exact stitching is realized. A cylindrical lens was taken as an object for experimental examination of the proposed method. The obtained results demonstrate the validity, reliability, and feasibility of our iterative stitching algorithm.

1. Introduction

The requirements for optical instruments are constantly increasing. Many optical instruments need one-dimensional shaping of the light source realized by cylindrical lenses. Cylindrical lenses have been widely used in high intensity laser systems and spectroscopic and interferometric devices. Their manufacturing processes, which include cutting, grinding, and polishing, are more complex and difficult than for spherical lenses [1,2]. Therefore, quality control and characterization are required.
Tactile measurements are usually recorded with a coordinate measuring machine or a cylindricity measuring instrument. This technology is mature as has been in use for a long time. These methods are highly accurate and provide various error compensation, but only have a small number of sampling points in a certain direction [3]. Besides, it is necessary to be extraordinarily careful to avoid damaging the precision instrument.
Non-contact measurements are realized with optical interferometric techniques known for their high accuracy and dynamic measurement capability coupled with non-destructiveness. At present, plane and spherical interferometers, like that developed by Zygo Co. (Middlefield, CT, USA), are relatively accurate. However, there are some difficulties in using interferometry to measure large optical surfaces or high numerical apertures due to the problems in manufacturing reference optics for these purposes. The sub-aperture stitching technique [4,5,6,7,8,9,10] has to be applied in this case. In J Peng et al. [11,12], stitching interferometry of high numerical aperture cylindrical optics without using a fringe-nulling routine was proposed. An outgoing plane wave from an interferometer is converted into a cylindrical wave by using a Computer Generated Hologram (CGH) [13,14]. Although this work simplified the measurement procedure without meeting the null test condition [8], the described method cannot totally remove high-order errors. J Peng et al. [15] introduced the first order cylindrical coordinate transformation approximation method to measure the complete 360° cylinder surface. The wavefront of the light carrying information on the large aperture was divided into several sub-parts, and the whole surface profile of the metal cylindrical shaft was obtained by the stitching algorithm. However, the sub-aperture stitching technique, based on the null test method, produces errors when the axes of the lens, the wavefront, and the rotation stage do not coincide with each other. A multi-dimensional adjustment device was used to satisfy the null test condition by adjusting the position of the axis of rotation and to obtain the interferogram with a minimal number of fringes in the measured part (sub-aperture) of the lens. The actual errors of the turntable movements can cause miss-arrangement of the sub-apertures. In order to overcome this problem, we propose an iterative algorithm to correct the mismatch and to establish an interferometric stitching measurement system for cylindrical lens examination, where a CGH cylinder null is used as the cylindrical wave converter. We obtain a more accurate stitching result of the surface of the cylindrical lens.
The remainder of the paper is organized as follows. In Section 2, we introduce the principles of the stitching algorithm that have been used in the past. The interferometric system for cylindrical measurement is described in this section. Considering the adjustment errors caused by the null test, we describe a cylinder stitching model based on the iterative algorithm, which can constantly adjust the position of the sub-aperture in the global coordination. In Section 3, we compare the results of the simulations obtained using the proposed iterative algorithm with the traditional algorithms. The results of the proposed method show good performance, with the errors we added to the sub-apertures being almost eliminated. Section 4 is devoted to experimental measurements of a cylindrical lens, and the obtained data are processed with the iterative algorithm. Conclusions are drawn in the final section.

2. Principles

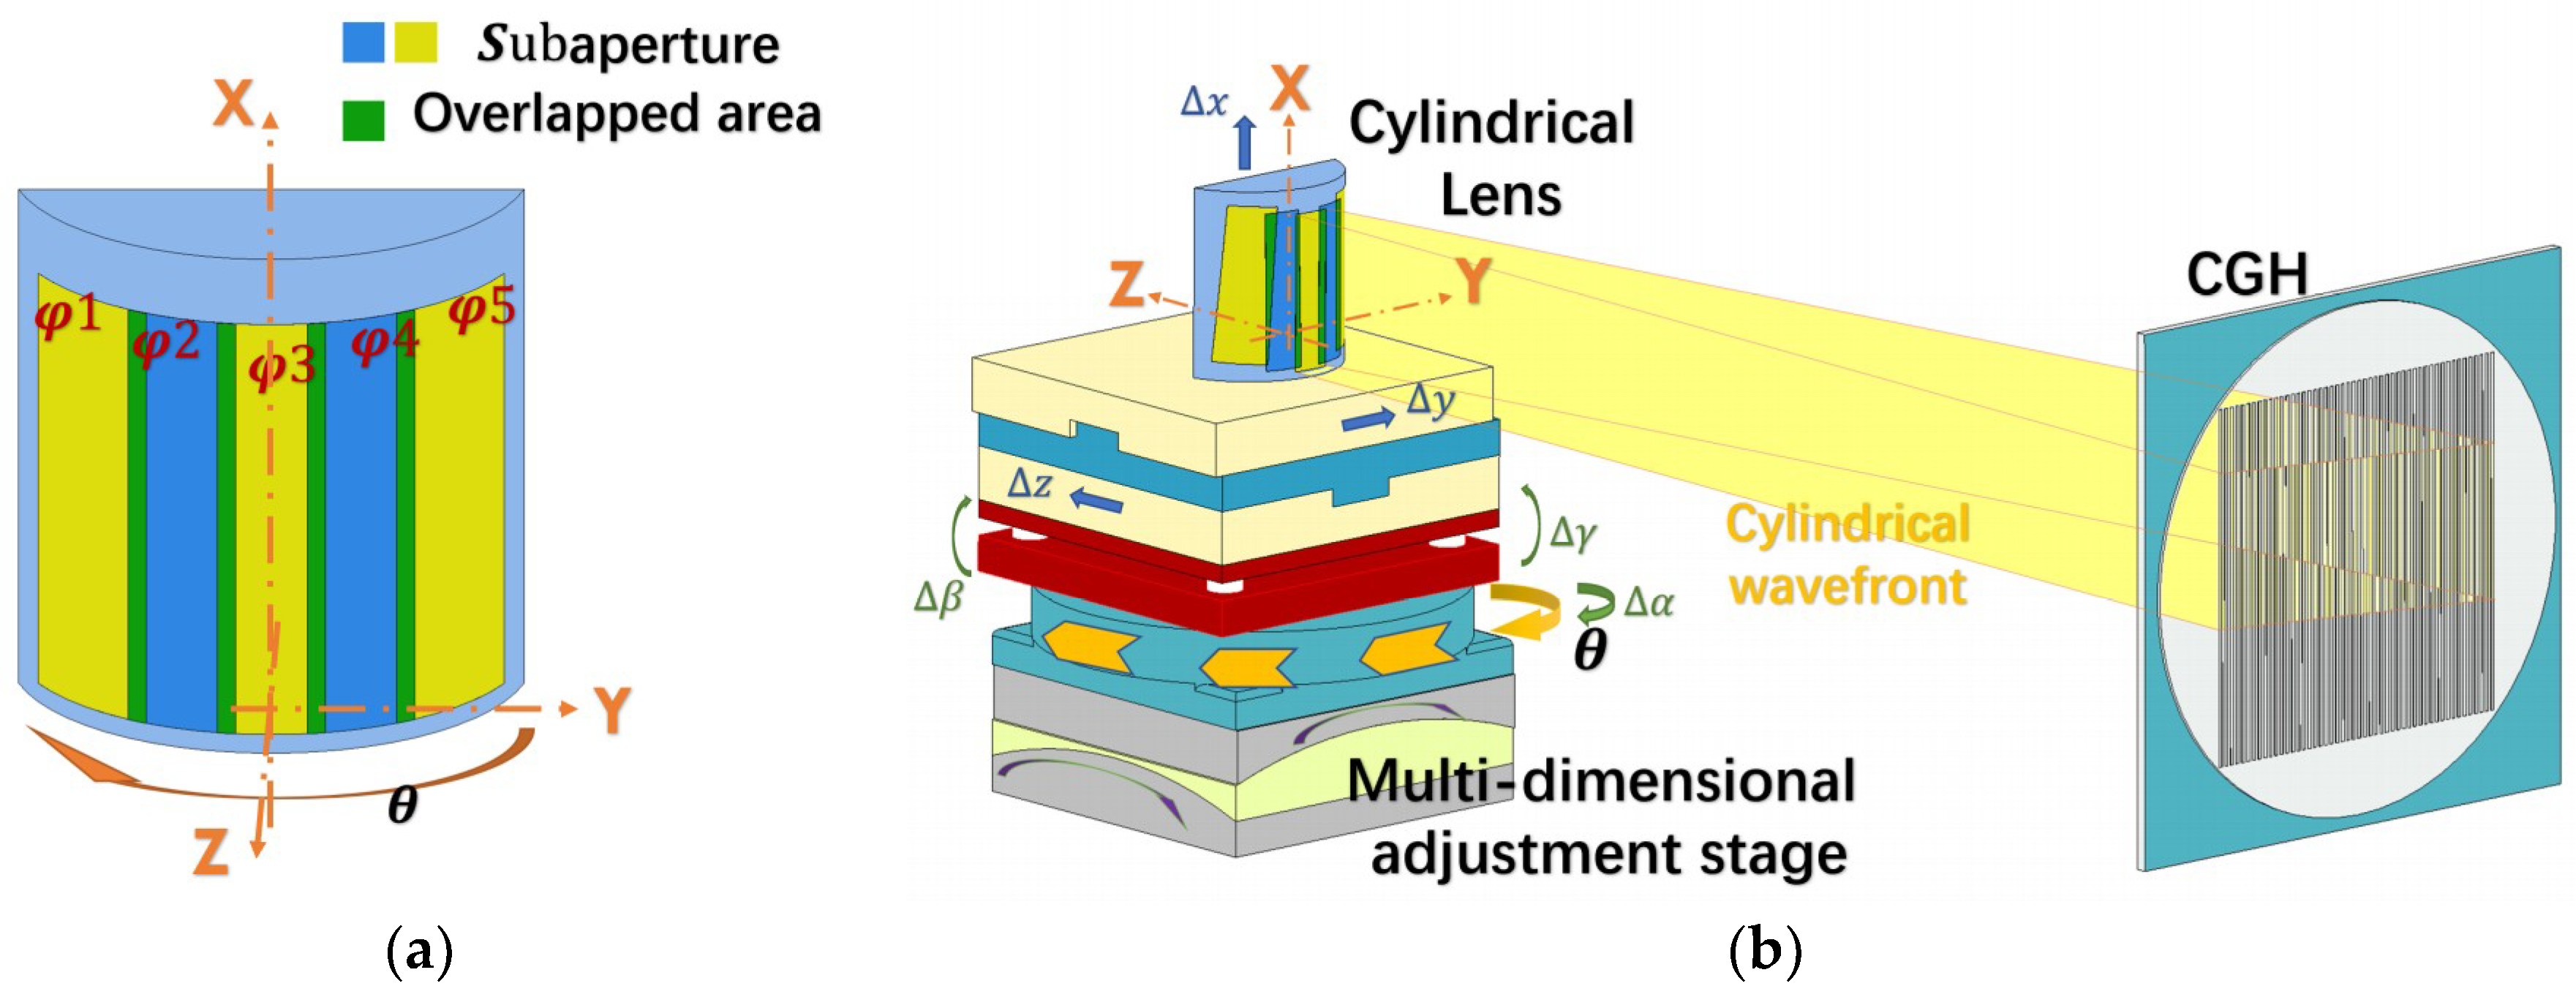
2.1. Experimental Setup and Error Analysis

In the null test, when the tested and reference surfaces have the same profile, the interferogram is a uniform zero fringe pattern. A non-zero fringe pattern indicates differences between the two surfaces. In order to minimize the misalignment aberrations during the null test, the sub-apertures must be adjusted so that the interferograms contain minimal fringes. In this paper, a CGH was chosen as a null corrector to measure the cylindrical lens.
Figure 1 presents the cylindrical interferometric stitching system. Firstly, the plane wave from the interferometer is converted into a cylindrical wave by the CGH and projected on the cylindrical lens to be tested. Then, after interaction with the cylindrical lens surface, the reflected light returns to the CGH, where the cylindrical wavefront is converted into the plane wavefront and directed back into the interferometer. After, the discrepancy between the measured and reference cylindrical surfaces are obtained by analyzing the recorded interferograms. In order to measure cylindrical lenses with large apertures, it was necessary to have a CGH with a small f/number (the ratio of the system’s focal length to the diameter of the entrance pupil, usually greater than 1). The CCH used in our experiment had a f/number of 3, which enables observation and detection within 20° and, as a result, prevents obtaining the whole surface profile of a cylindrical lens by scanning once.
The problem mentioned above is usually solved with the sub-aperture stitching technique [4,5,6,7,8,9,10]. Such an approach is also helpful for characterization of optical components with high numerical apertures. Multiple scanning of a sample requires preliminary planning of dividing the whole aperture into sub-apertures at different angles of observation. To ensure the whole tested surface is covered during the measurements and to control the stitching process, the adjacent segments from the sub-apertures must have overlapping regions. The reconstructed profiles of these overlapping regions have to be identical to smoothly and continuously supplement the information obtained from the non-overlapping regions.
In the measuring approach, we set the global Cartesian coordinate system so that the X-axis coincides with the focus of the CGH, the optical axis of the tested sample, and the axis of rotation of the rotatable stage (Figure 2a). Z represents the direction of defocus and Y is the horizontal direction. Since the actual positions of the sub-apertures are unknown in the traditional algorithm [5], we assumed that the areas covered by the sub-apertures were uniformly allocated on the tested surface. To obtain uniform allocations of the overlapped and non-overlapped regions, the rotation axis of the multi-dimensional adjustment device platform is adjusted with the optical axis of the cylinder and the focus of the CGH (Figure 2b).
However, in real situations, a deviation may exist in the adjustment. As a result, the mentioned three axes are usually mismatched. Sub-aperture data acquisition in the rotating process may introduce relative position errors, including: (1) turntable radial error caused by inaccuracies in Δy and Δz, (2) the turntable axial runout, caused by Δx, (3) the rotating error of the turntable shaft caused by the change in Δβ and Δγ (Figure 2b), and (4) the turntable angle error caused by the change in Δα (Figure 2b). The real coordinates on the surface of the cylindrical lens, ρ 2 , Θ 2 , and X 2 , can be expressed through the real coordinates, ρ 1 , Θ 1 , and X 1 , respectively, according to the following formula [16]:
[ ρ 2 Θ 2 X 2 ] = [ ρ 1 Θ 1 X 1 ] + [ cos Θ 1 sin Θ 1 0 X 1 sin Θ 1 X 1 cos Θ 1 0 sin Θ 1 / ρ 1 cos Θ 1 / ρ 1 0 X 1 cos Θ 1 / ρ 1 X 1 sin Θ 1 / ρ 1 1 0 0 1 ρ 1 sin Θ 1 ρ 1 cos Θ 1 0 ] [ Δ z Δ y Δ x Δ γ Δ β Δ α ]
Since the measured phase φ is associated with the lens surface, the radius can be replaced by the phase in this equation.
At present, the minimum resolution of a commercial precision turntable rotating stage is less than 1’. Such a low deviation cannot be registered by the camera in our experimental setup. Therefore, Δα and Δx can be ignored.

2.2. Stitching Algorithm for the Cylindrical Lens

Suppose that the entire cylindrical surface can be totally covered by N sub-apertures forming the N 1 overlapping regions as shown in Figure 2a. Due to the non-ideality of the rotating stage and the position errors, each measurement after a rotation requires preliminary tuning for minimization of the fringes in the interferogram. This, in turn, forced us to describe the sample position during measurement with a correction based on the errors Δ z i , Δ y i , Δ γ i , and Δ β i .
Let the whole interferogram of the lens consist of M × K pixels. The results of the measurement of each sub-aperture can be represented by the matrix M × K, which includes the measured sub-aperture and the zero values. In particular, the data for the first sub-aperture characterized by φ 1 (Figure 2) are:
Φ 1 = [ φ 1 1 , 1 φ 1 1 , 2 φ 1 1 , L 0 0 0 0 0 0 0 φ 1 2 , 1 φ 1 2 , 2 φ 1 2 , L 0 0 0 0 0 0 0 φ 1 M , 1 φ 1 M , 2 φ 1 M , L 0 0 0 0 0 0 0 ]
whereas the matrix characterizing the second sub-aperture is:
Φ 2 = [ 0 0 φ 2 1 , 1 φ 2 1 , 2 φ 2 1 , L 0 0 0 0 0 0 0 φ 2 2 , 1 φ 2 2 , 2 φ 2 2 , L 0 0 0 0 0 0 0 φ 2 M , 1 φ 2 M , 2 φ 2 M , L 0 0 0 0 0 ]
The rows in the matrixes correspond to the data obtained along the X axis and the columns correspond to the data along the Θ axis. Due to the overlapping region between the two measurements, the exact positions of the measured values in Φ 2 can be determined only after comparing the maps of the first and second measurements and finding the exact overlapping region between them.
Since each element of the matrixes can be considered a function of X and Θ , the relative position error of adjacent sub-apertures can be eliminated using the correlation of the overlapping regions. Within an overlapping region, the relationship between the relative position errors and the two sub-apertures can be expressed as:
Δ φ s t i t c h e d ( X , Θ ) = φ i a , b φ i + 1 a , b = Δ z cos Θ + Δ y sin Θ Δ γ X sin Θ + Δ β X cos Θ
where Δ z = Δ z i Δ z i + 1 , Δ y = Δ y i Δ y i + 1 , etc.; a = X X m i n X m a x X m i n ( M 1 ) + 1 ; and b = Θ Θ m i n Θ m a x Θ m i n ( K 1 ) + 1 . Here, the sub-index min. and max. correspond to the minimum and maximum values, respectively. In order to simplify the calculation, it is preferable to transform Φ i into column vectors in advance. i + 1 should be in the range of 2 to N.
To produce the full aperture map of the tested cylindrical surface, the sum of the squared differences for all overlapping regions should be minimized simultaneously [8] in the following manner:
i = 1 N 1 a , b { [ φ i a , b + Δ z i cos Θ + Δ y i sin Θ Δ γ i X sin Θ + Δ β i X cos Θ ] φ i + 1 a , b + Δ z i + 1 cos Θ + Δ y i + 1 sin Θ Δ γ i + 1 X sin Θ + Δ β i + 1 X cos Θ ] } 2 m i n
where the deviation of any two adjusted sub-apertures in the overlapping region should be small enough. Equation (3) can be transformed into a linear equation system. The misalignment error coefficients of the ith sub-aperture, which were mentioned in Section 2.1, can be formed as a 4 × 1 vector R i :
R i = [ Δ z i , Δ y i , Δ γ i , Δ β i ] T
where the superscript T denotes the transpose operation. For the ith sub-aperture measurements, we construct a 4 × 1 vector P i :
P i = [ f i , i 1 T ( φ i a , b φ i 1 a , b ) ] + [ f i , i + 1 T ( φ i a , b φ i + 1 a , b ) ]
which is associated with the overlapping regions of the sub-aperture. Here, for the first sub-aperture (i = 1), the first part of the right side of Equation (5) is zero, whereas for the Nth sub-aperture (i = N), the second part of the right side of Equation (5) is zero. The f i , i ± 1 in Equation (5) is expressed as:
f i , i ± 1 = [ cos Θ , sin Θ , X sin Θ , X cos Θ ] T
where X and Θ are related to a and b in the overlapping region as defined above, respectively. Then, a 4 × 4 matrix Q i , i ± 1 is built with f i , i ± 1 :
Q i , i ± 1 = f i , i ± 1 T f i , i ± 1
Combining Equations (4)–(7) and choosing the mth sub-aperture (m ∈ [1, N]) as a benchmark sub-aperture, it is possible to rewrite Equation (3):
[ P 1 P 2 P m 1 P m + 1 P N ] = [ Q 1 , 2 Q 1 , 2 Q 1 , 2 Q 1 , 2 Q 2 , 3 Q 2 , 3 Q m 2 , m 1 Q m 2 , m 1 Q m 1 , m Q m , m + 1 Q m , m + 1 Q m + 1 , m + 2 Q N 1 , N Q N 1 , N ] [ R 1 R 2 R m 1 R m + 1 R N ]
The right side of Equation (8) is a product of the 4 ( N 1 ) × 4 ( N 1 ) matrix by the 4 ( N 1 ) × 1 vector, where the benchmark sub-aperture is not included. By calculating Equation (8), it is possible to find the position error R i . After that, the stitching map of the whole surface φ ^ can be performed as the right array division by dividing each element of the sum of the corrected sub-apertures by the corresponding element of the sum of mask:
φ ^ ( X , Θ ) = i = 1 N ( Φ i + Δ z i cos Θ + Δ y i sin Θ Δ γ i X sin Θ + Δ β i X cos Θ ) / i = 1 N m a s k i
where m a s k i is a matrix with M × K elements that equals 1 or 0. Positions of the nonzero elements coincide with the positions of the measured values φ i M , L in Φ i . For example, the m a s k 1 is:
m a s k 1 = [ 1 1 1 0 0 0 0 0 0 0 1 1 1 0 0 0 0 0 0 0 1 1 1 0 0 0 0 0 0 0 ] .

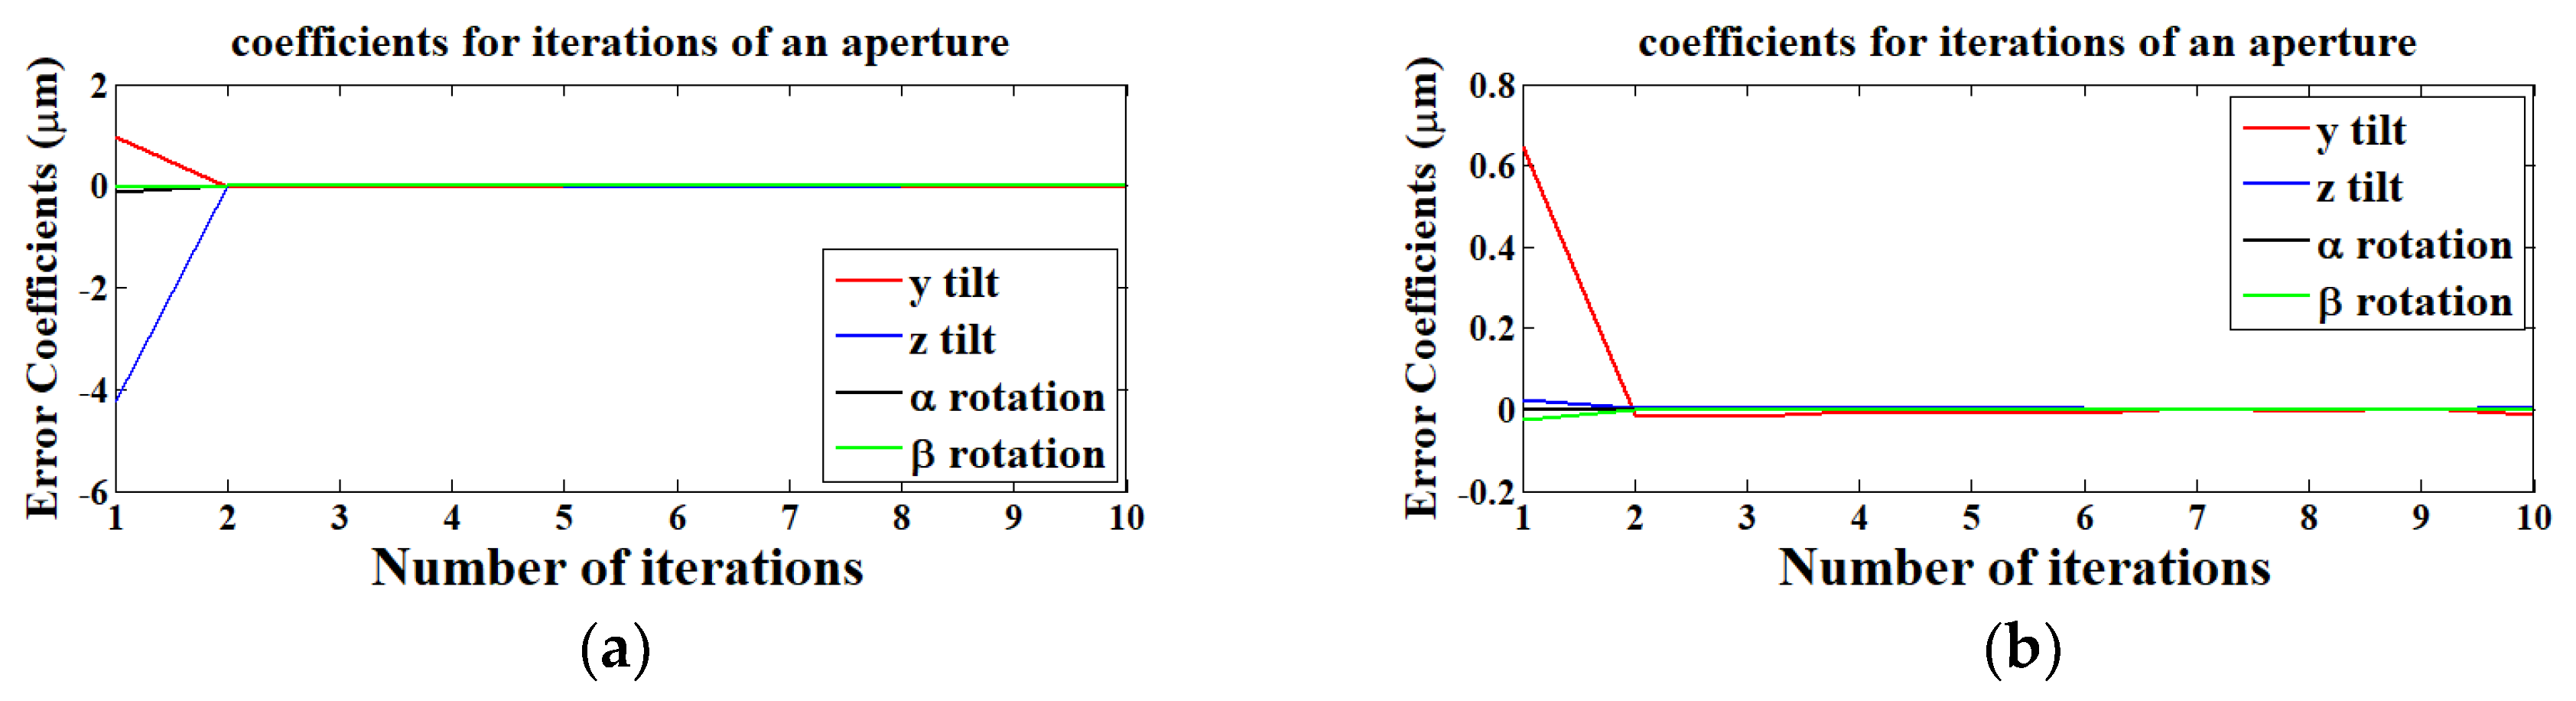
2.3. Iterative Algorithm for the Cylindrical Sub-Aperture
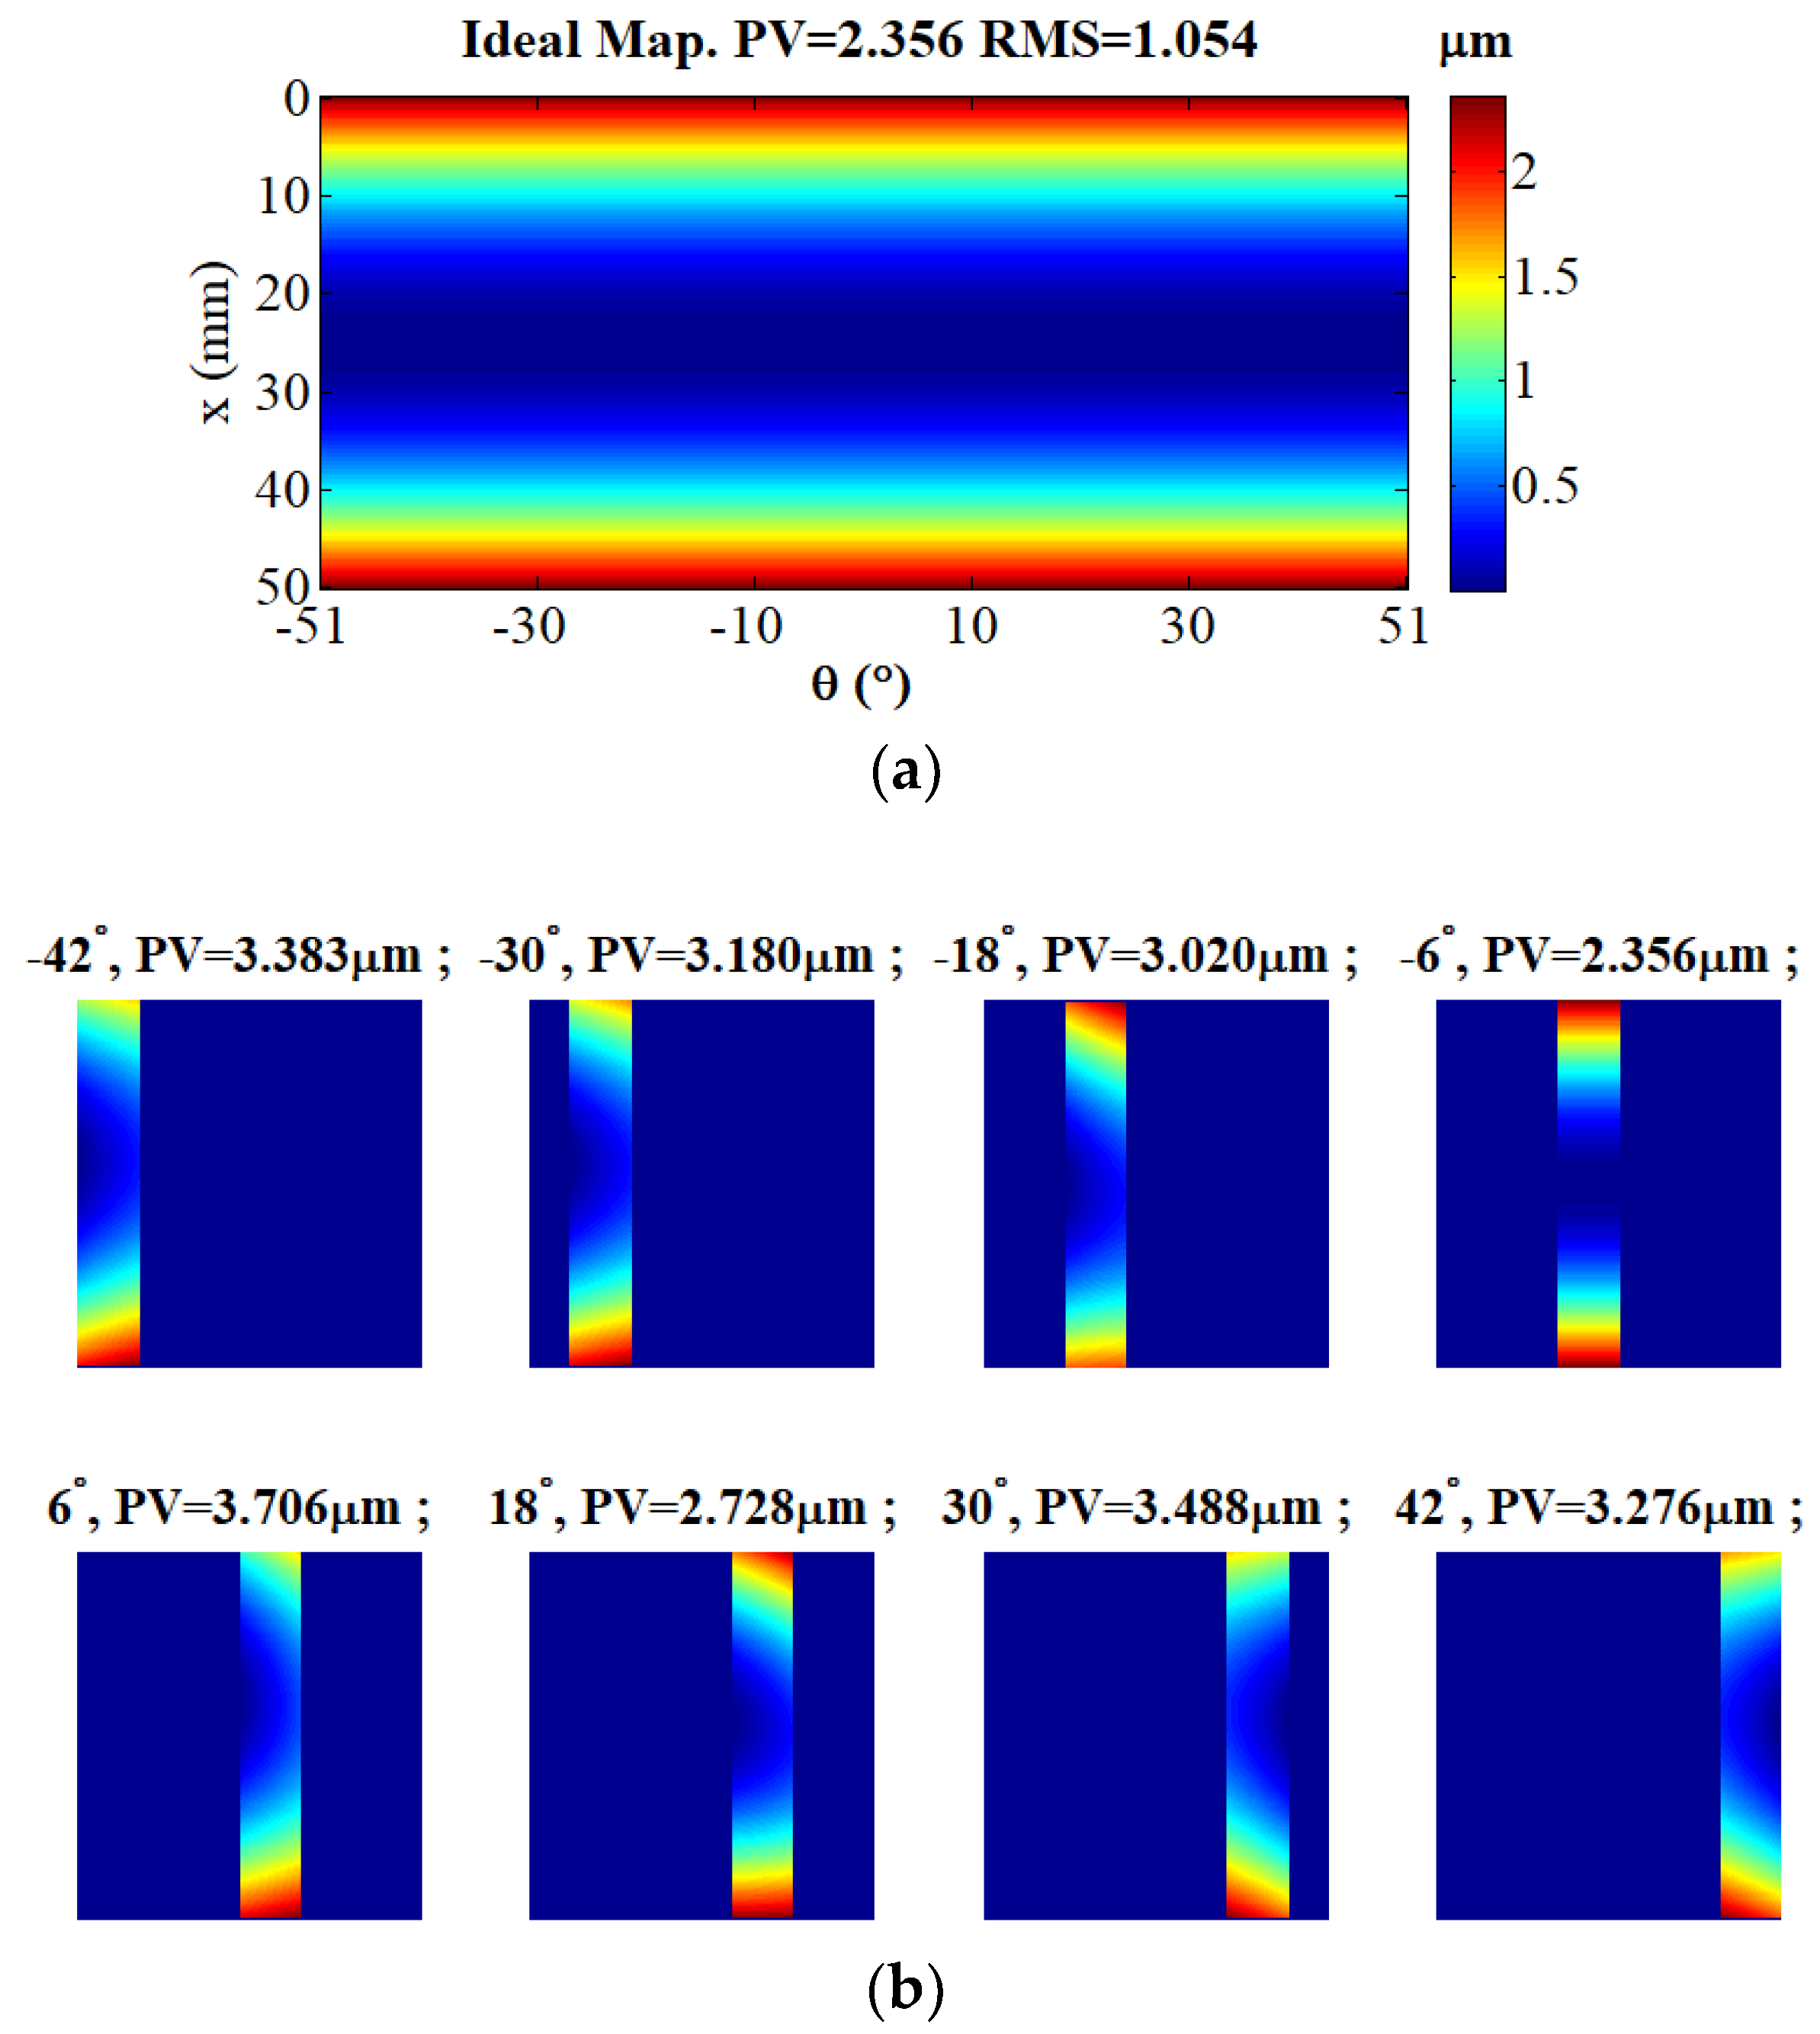
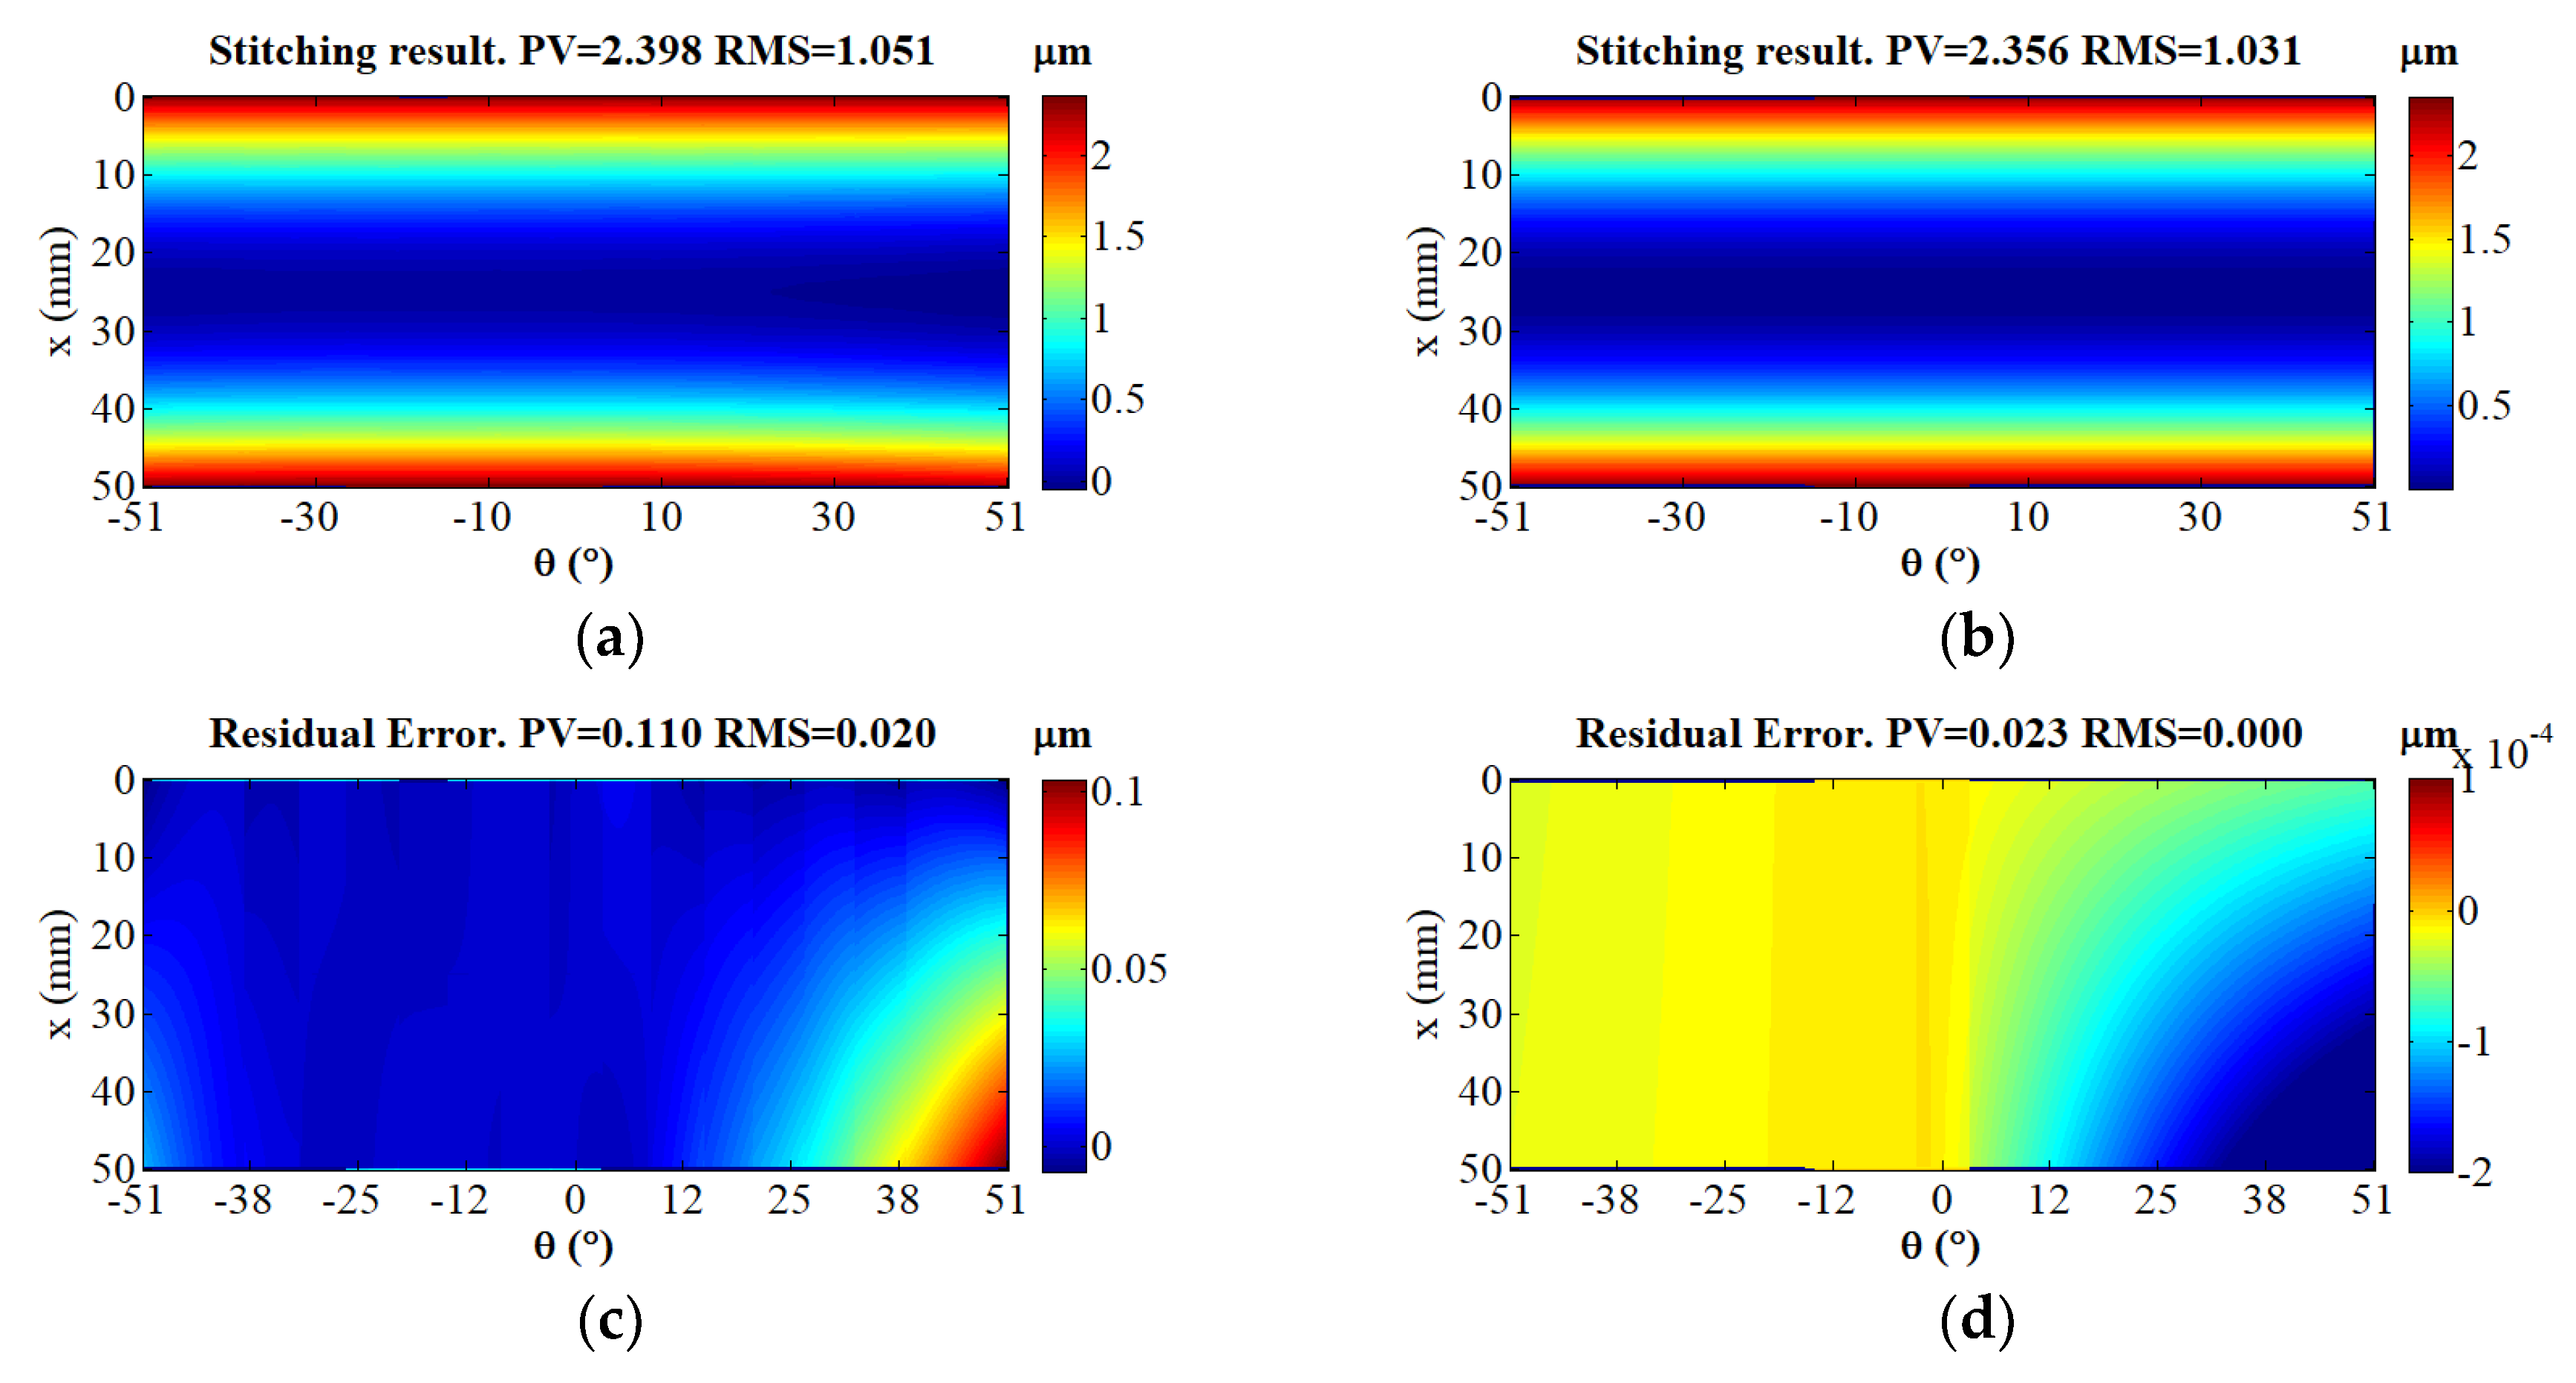
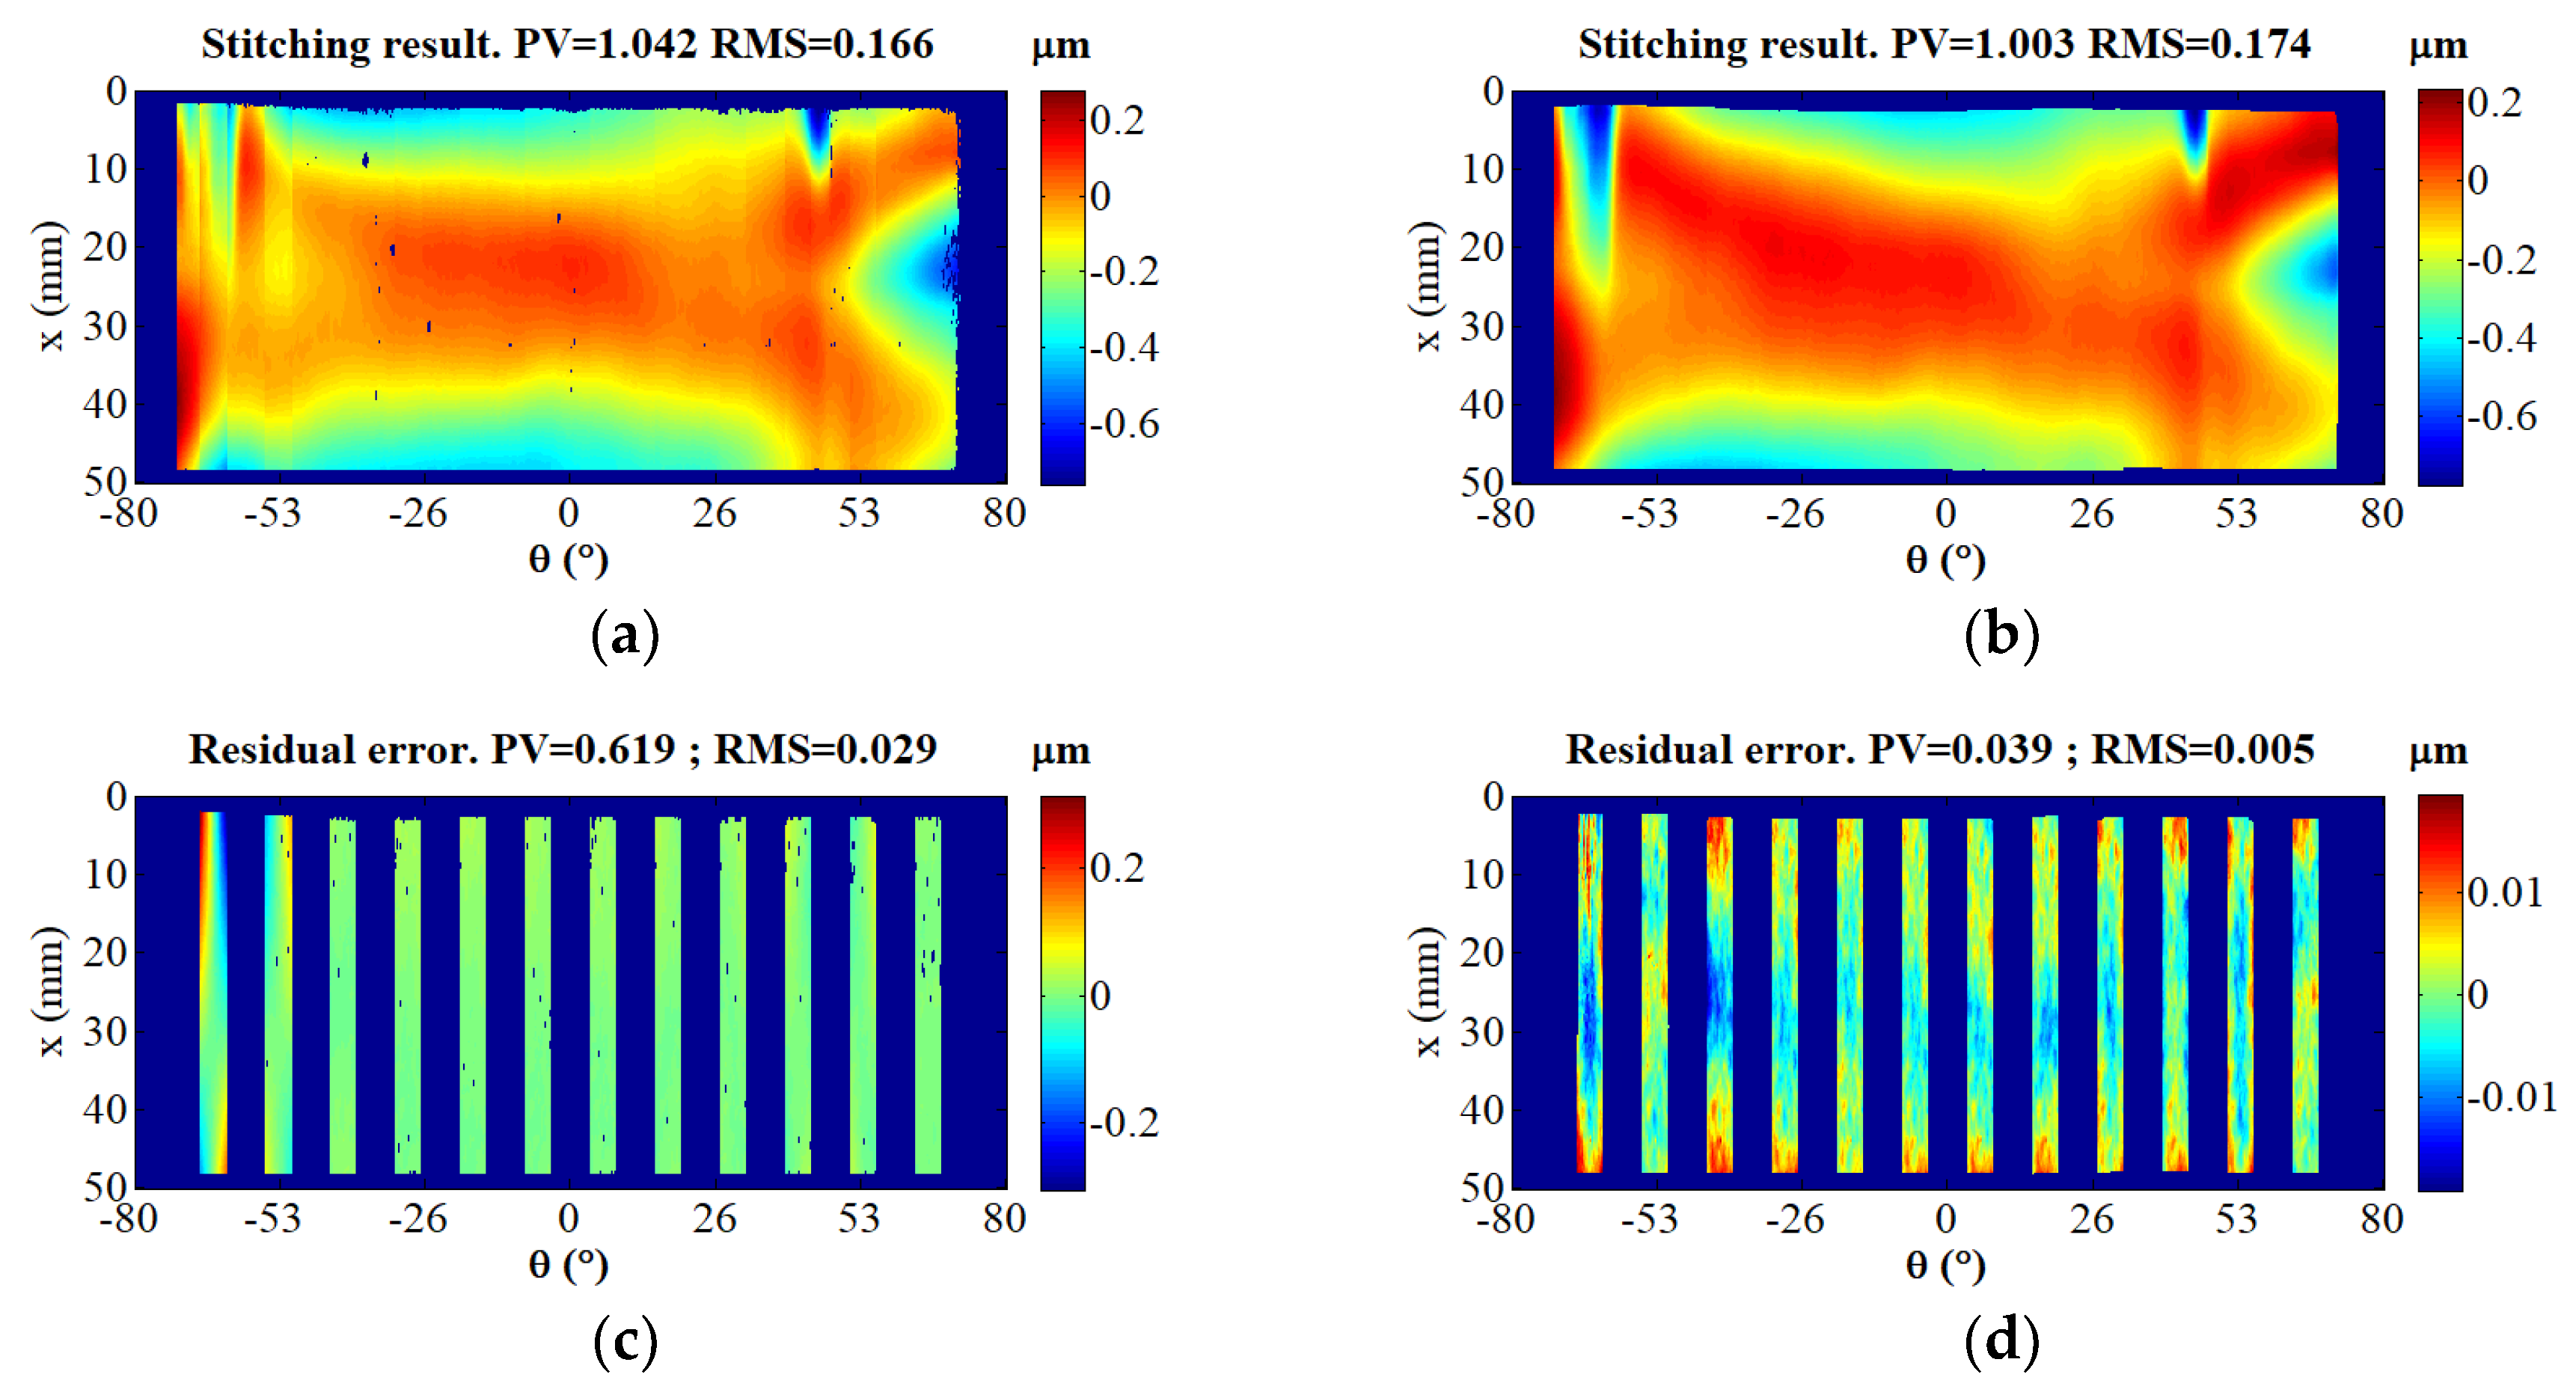
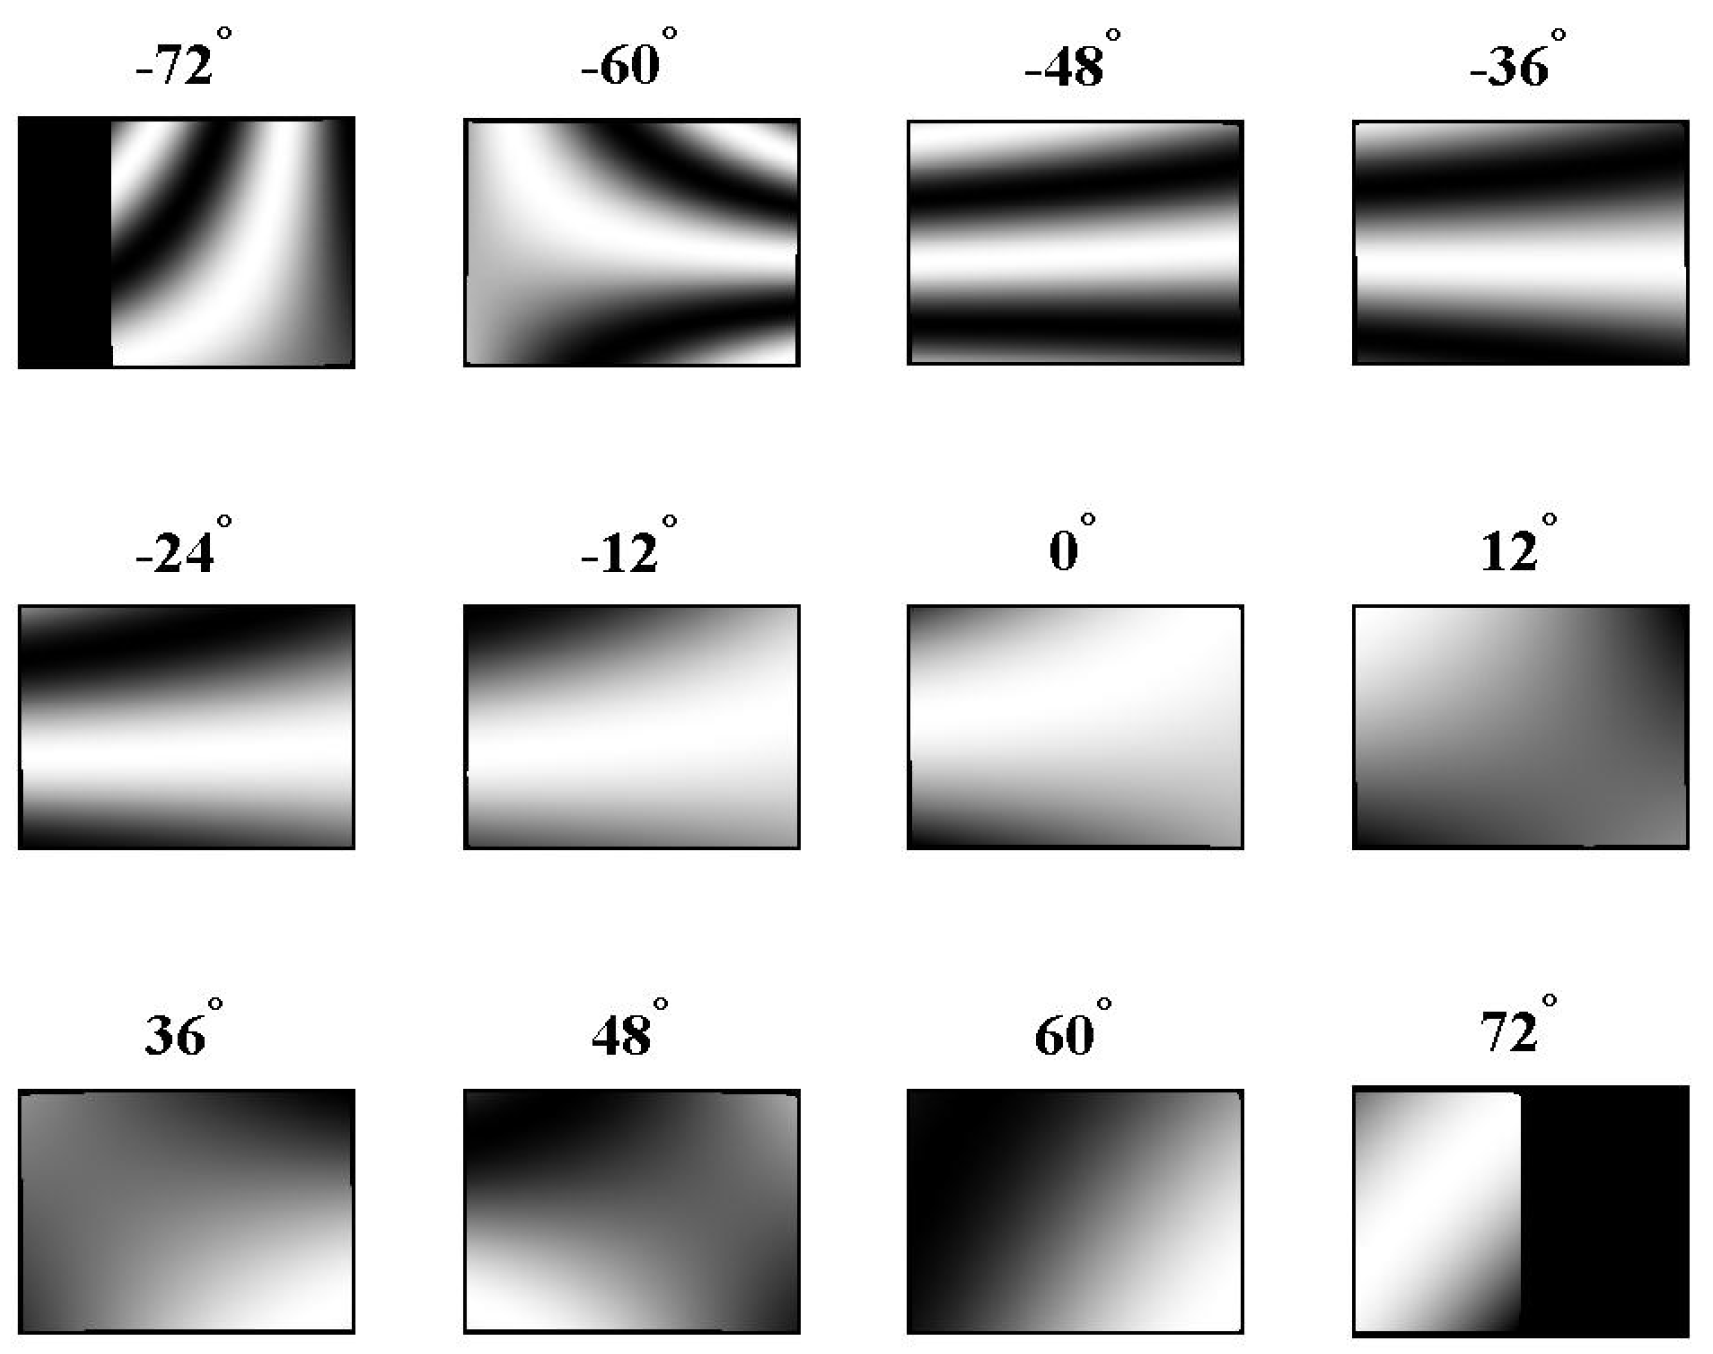
The surface profile of the high high-numerical-aperture (NA) cylindrical lens obtained by stitching the collected phase data with the approach described in Section 2.2 may not immediately have a seamless result. One of the reasons for this is that the restriction by the first order of the Taylor expansion in Equation (1). Besides, the cylindrical lens is not a closed surface, and unlike the cylindrical shaft, it lacks some constraints in the circumference direction. To produce better stitching, an iterative algorithm that enables us to make constant adjustments to the position of each sub-aperture is preferred. This can be realized by applying the least square method for finding the position errors R i according to Equation (8). Then, the position errors R i are substituted into the Rigid Body Transformation to correct the mismatch of the sub-apertures. After correcting the sub-apertures, the new corrected position errors R i are calculated. The loop with the iterations enables us to get more reliable results. The specific steps of the algorithm are as follows:
Step 1. Assume that the measuring aperture is arranged in space according to the preset coordinates. Then, the initial values of the cumulative errors have to be set as E r r i 0 = ( Δ z i 0 ,   Δ y i 0 ,   Δ γ i 0 ,   Δ β i 0 ) = ( 0 , 0 , 0 , 0 ) . The initial phase values φ i 0 = φ i are the phase data measured by the interferometer. The superscript denotes a current iteration number, and the subscript i denotes the number of sub-apertures.
Step 2. Substitute θ , X, and φ i ( t ) into Equation (8) to obtain the least squares solution ( Δ z i ( t + 1 ) ,   Δ y i ( t + 1 ) ,   Δ γ i ( t + 1 ) ,   Δ β i ( t + 1 ) ) = R i ( t + 1 ) , which is the error vector in the cylindrical coordination system. The superscript t denotes the iteration number, t = 0 , 1 , 2 .
Step 3. Find a new corrected E r r i ( t + 1 ) according to the equation:
E r r i ( t + 1 ) = E r r i ( t ) + R i ( t + 1 )
Step 4. Change φ i ( t ) into Cartesian coordinate sand substitute it into the transformation matrix, which includes the coefficient R i t . After that, change the coordinate back into the cylindrical coordination:
y i ( t ) = φ i ( t ) × cos ( θ i ( t ) ) ; z i ( t ) = φ i ( t ) × s i n ( θ i ( t ) ) ; x i ( t ) = X i ( t + 1 )
[ y i ( t + 1 ) z i ( t + 1 ) x i ( t + 1 ) I ] = [ y i ( t ) z i ( t ) x i ( t ) I ] T 1 T 2 T 3 T 4
where T 1 , T 2 ,   T 3 , and T 4 are the transformation matrixes taking R i ( t + 1 ) into account, and I is the unity matrix.
φ i ( t + 1 ) = y i ( t + 1 ) 2 + z i ( t + 1 ) 2 ;   X i ( t + 1 ) = x i ( t + 1 ) ;   θ i ( t + 1 ) = arctan ( z ( t + 1 ) y ( t + 1 ) )
Step 5. Repeat the steps described above until R i ( t + 1 ) is less than the threshold or reaches the iteration number (usually 10−3 µm or 3 iterations according to practical experience). Then we can obtain a more reliable result for φ i ( t + 1 ) .

3. Simulation

In order to estimate the accuracy of the proposed method, we carried out a stitching interferometry simulation for a high-NA cylindrical surface using MATLAB (MathWorks. Inc, Natick, MA, USA). First, a cylindrical surface 50 mm high and a radius of 26.4 mm was built (Figure 3a). The angular aperture equaled 102°. Then, the simulated surface was divided into eight equal fragments, each of which was observed under a sub-aperture of about 18°. The rotation angle of each fragment was 12°, and the overlapping region was 6°. Each fragment was associated with its own position error as shown in Table 1. The fourth fragment (sub-aperture) was chosen as the benchmark; therefore, its error was zero. Besides, because the errors Δ x and Δ α were negligible, they were set zero. The errors given in the table correspond to the actual situation in the measurement.
After obtaining the sub-aperture with different position errors (Figure 3b), it was necessary to stitch them using iterations if necessary (Figure 4a,b). Subtracting the obtained data (Figure 4a,b) from the simulated data (Figure 3a) enabled us to see that the peaks-and-valleys (PV) value and the root mean square (RMS) value of the stitching result without using the iterative method are larger than those obtained using the iterative method. The PV value of the residual error (Figure 3d) was 0.023 µm and the RMS value was 0.000 µm, which means that the sub-apertures were correctly stitched. Because the curve of the lens was not closed, some constraints in the circumference direction were lacking. So, the errors produced by the traditional method cannot be eliminated totally, especially when there is an error near the boundary. Through iterations, this situation will improve. The final value of the residual error is affected by the size of the pixel.

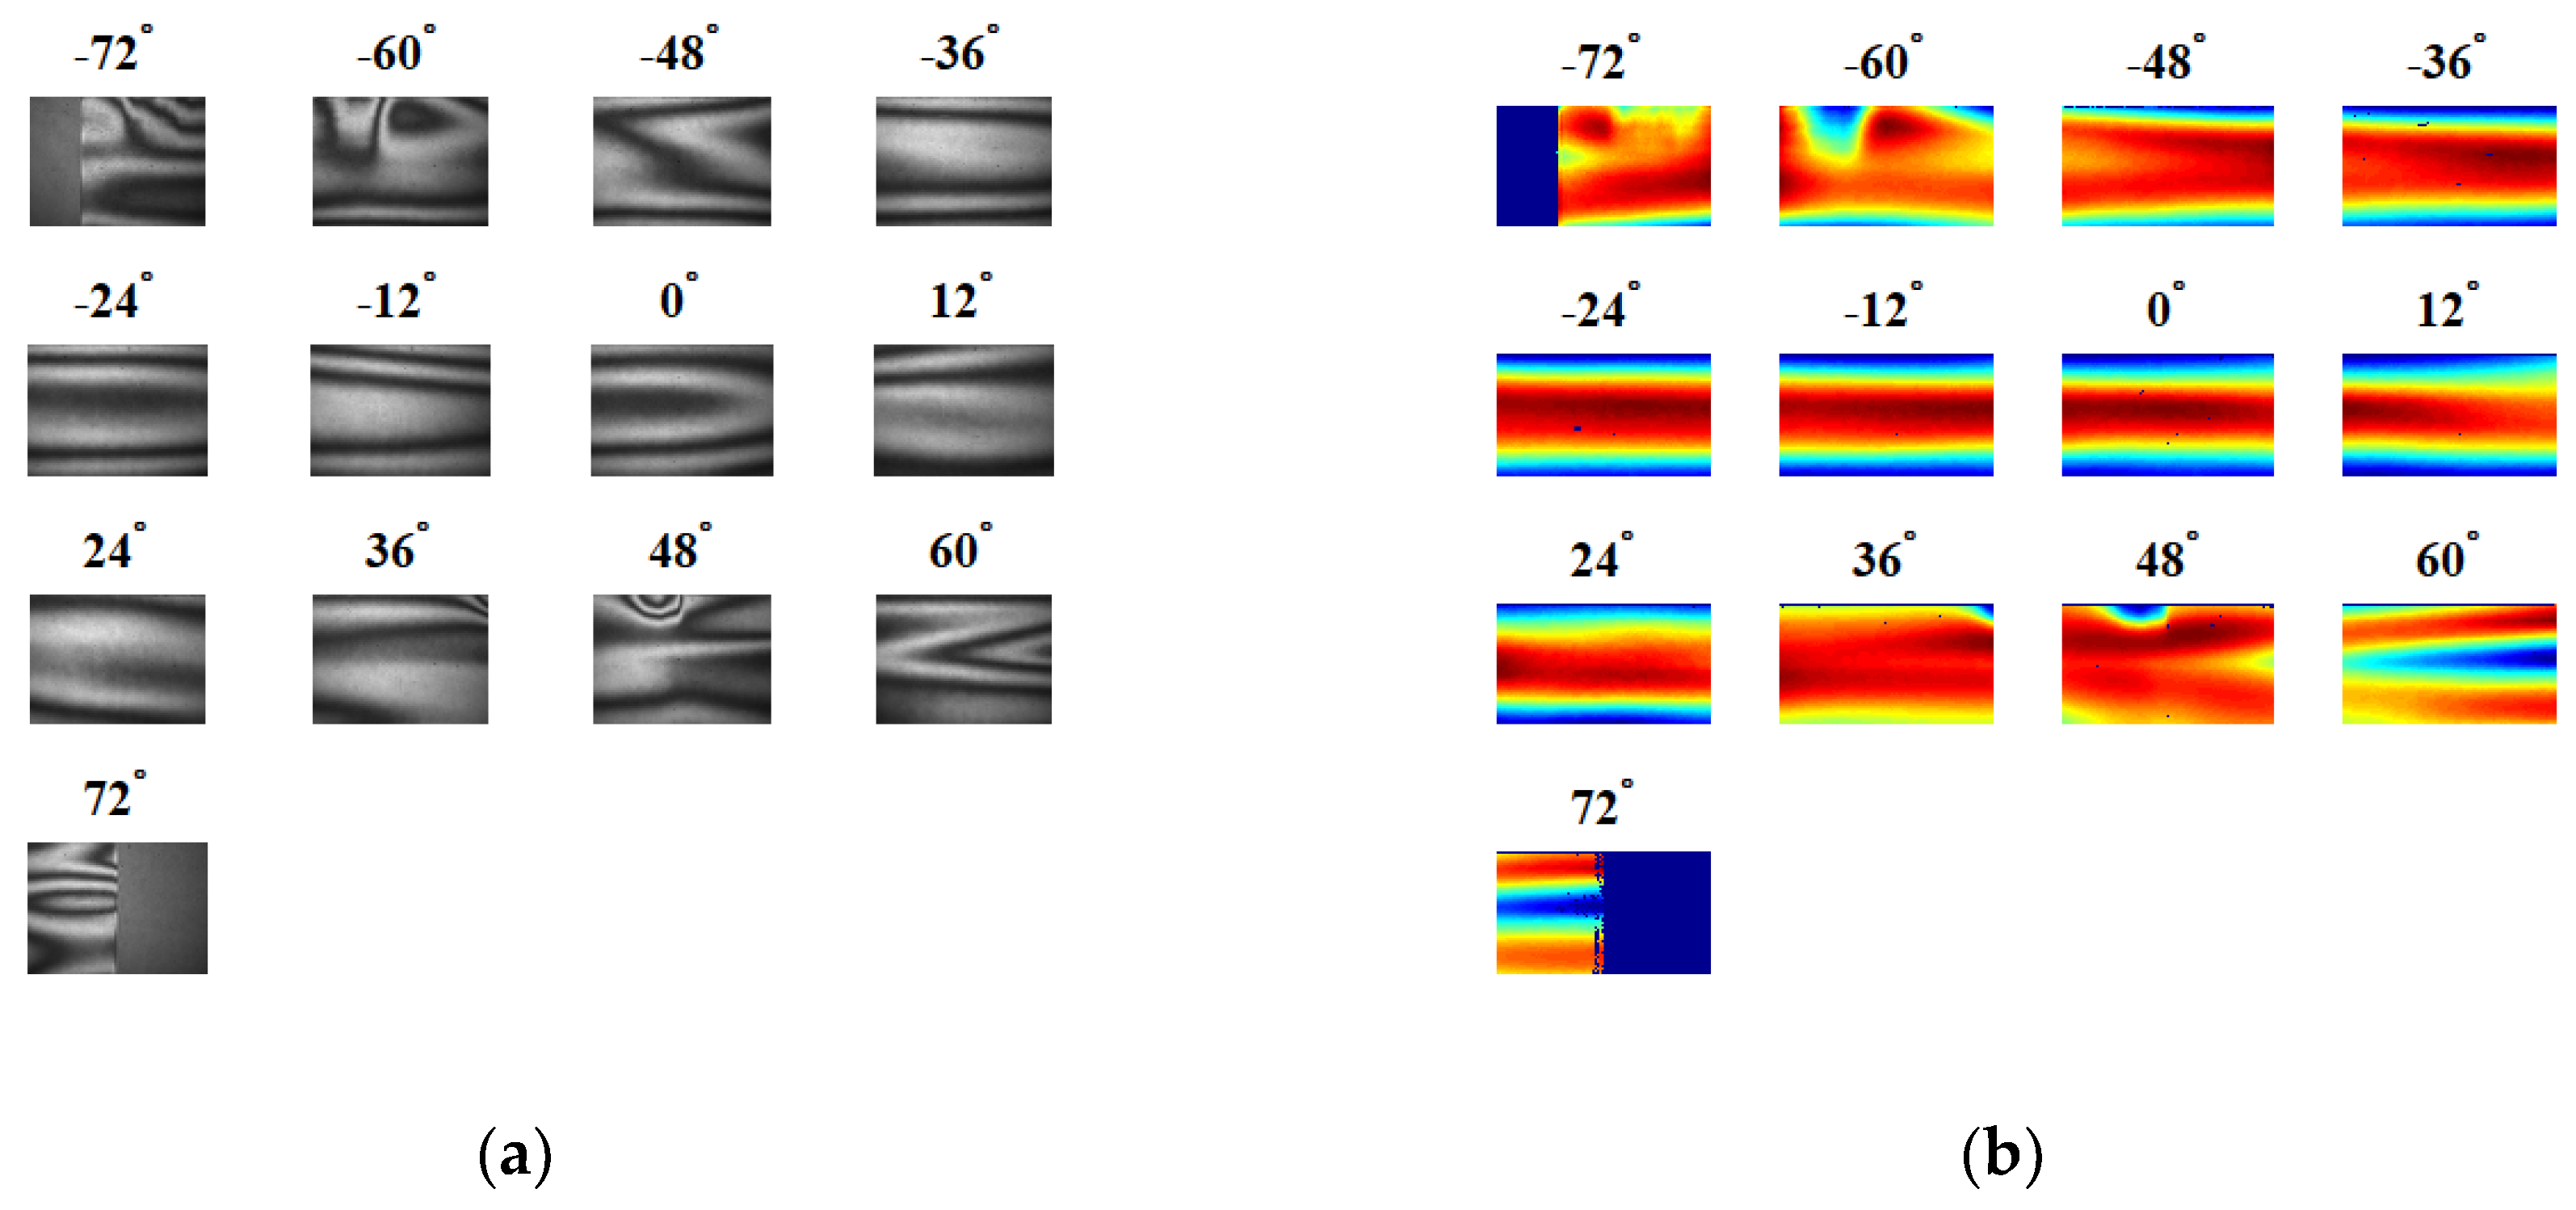
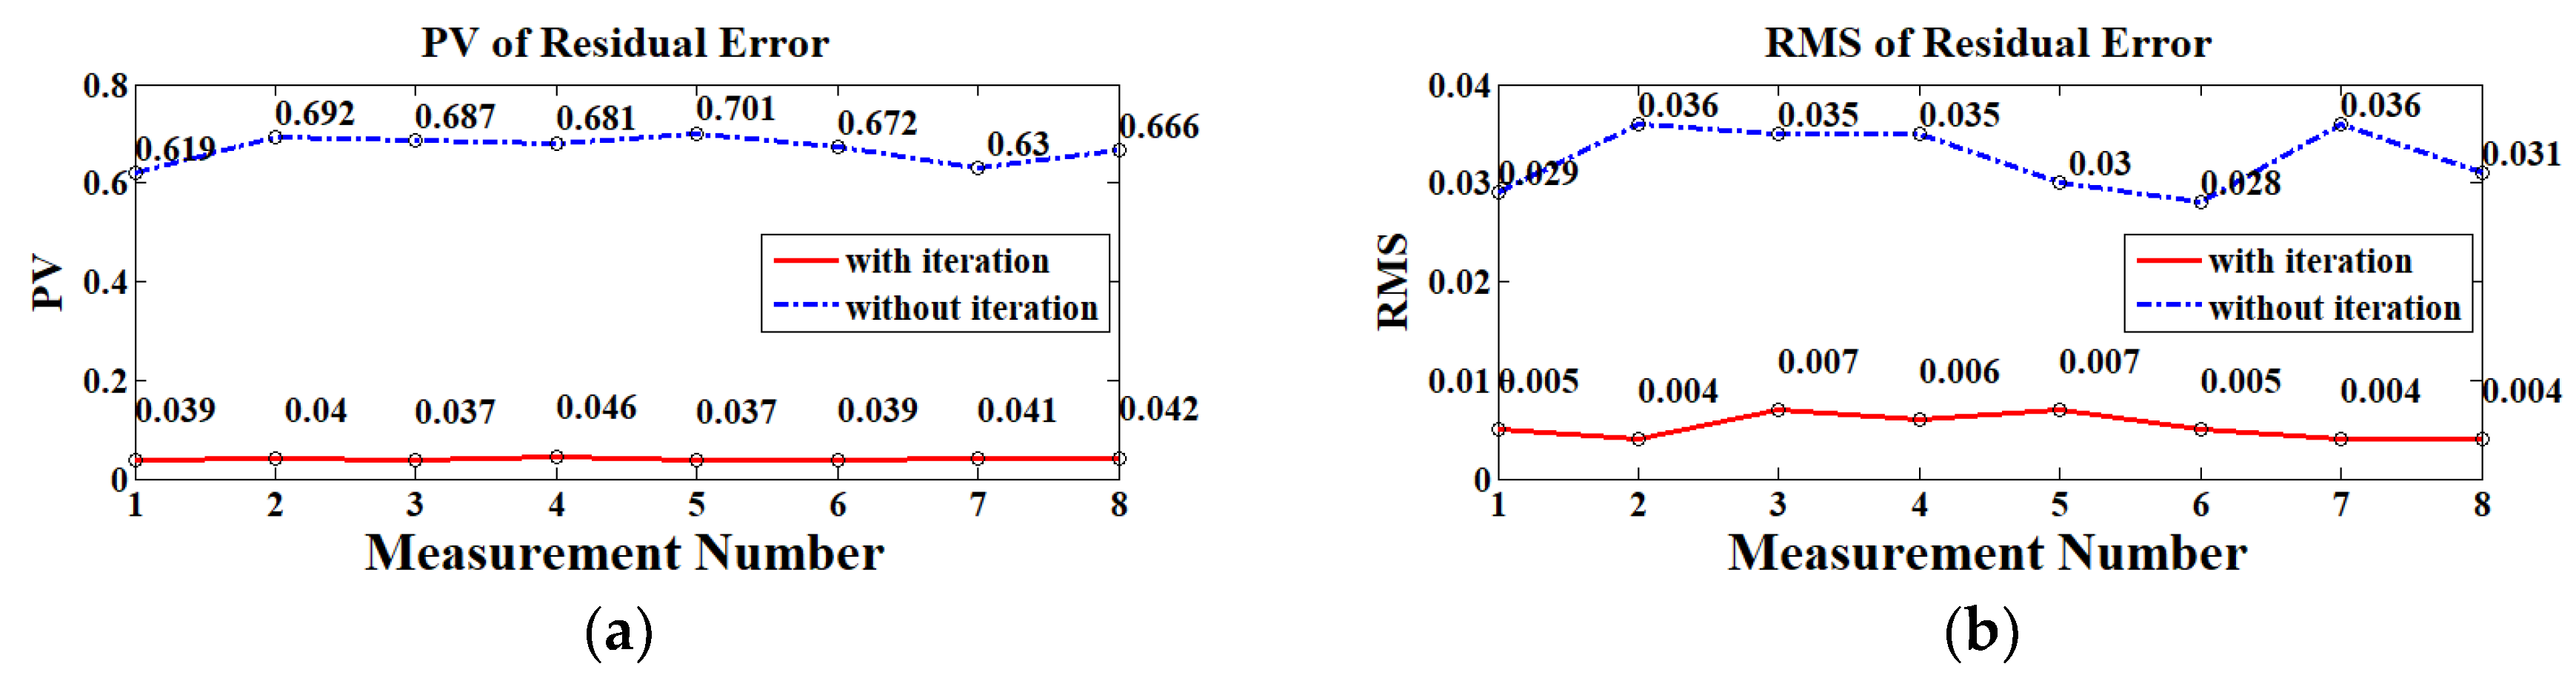
4. Experimental Demonstration

Experimental measurements were carried out to verify the practicality of the proposed algorithm. The experimental arrangement consisted of a Fizeau interferometer (Zygo GPI/XP 4, Zygo, Middlefield, CT, USA), a CGH cylinder null (H80F3C, Diffraction international, Minnetonka, MN, USA) and a multi-dimensional adjustment stage (Figure 5). A CGH cylinder null, 80 mm high × 80 mm wide, was used as the cylindrical wavefront converter of the interference system. The maximum measurable aperture angle was nearly 18.9° (the treatment of the image borders led to a measured angle less than 20 degrees). The cylindrical lens was 53 mm high × 50.8 mm wide and curvature radius was 26.4 mm. For obtaining the whole surface of the cylindrical lens, we collected 13 sub-apertures and set the rotation angle to 12°. We did not strictly align the lens, so after each rotation, the fringe of interferogram was too dense to be analyzed. So, we manually tilted and leveled the sub-aperture to obtain an interferogram that was near to non-fringe. Then, the remaining position errors were calculated through the iterations.
Figure 6 shows the phase maps and interferograms of the acquired sub-aperture. In order to meet the condition of the null test, we ensured that the fringe was small enough to make the ideal cylindrical wavefront and cylindrical lens coincide. The remaining fringes were caused by the contour deviation and remaining position errors.
The stitching result map without the iterations is depicted in Figure 7a, where the stitching marks can be seen. Accordingly, the result map after three iterations (Figure 7b) was seamless, the PV value of the stitching result was 1.003 µm, and the RMS value was 0.174 µm. To evaluate the effectiveness of the proposed stitching method, we observed the variation in the mismatch map within the overlapping regions, as shown in Figure 7c,d. The variation was determined by calculating the radial deviations of the corresponding points in the overlapping region, and can be thought of as the residual noise following stitching process. The PV value of the residual error without iterations was 0.619 µm and the RMS value was 0.029 µm. The RMS value obtained with the proposed method was 0.005 µm. This confirms that the proposed stitching model can eliminate the discrepancies among the overlapping regions. The invalid points in Figure 7a were caused by the spurious fringe in the central sub-aperture. Due to the interpolation process in the coordinate transformation, there was no invalid point in the middle part of the stitching result shown in Figure 7b.
In order to evaluate the reliability of the proposed algorithm, we carried out 10 iterations of the experimental data and compared the coefficients of the sub-aperture adjustment for each iteration of the two sub-apertures. The experimental data (Figure 8) showed that after three iterations, the y-direction and z-direction errors were stabilized within a very small range. From the graph, for the whole experimental system and its operation, the rotation errors around the Y and Z axes were relatively small.
Table 2 summaries the position error E r r i k of three iterations and Figure 9 shows an interferogram of E r r i k . As the ninth sub-aperture was chosen as the benchmark, the 24° interferogram is not shown. Compared with the number of fringes in the pattern in Figure 6a, the value of the position error is near the magnitude of the contour of the lens. The position errors of the first few sub-apertures are quite large, which is consistent with the result in Figure 7c. Because the smallest reading value of the tilt stage was 1° and the resolution was 18″, the precision angles of manual adjustment could not be obtained. However, through the simulation according to the fringe number before manual adjustment, the range of the manually tilt angle was about ±10′, and the horizontally motion was about ±200 µm.
Finally, to verify the robustness of the algorithm, the lens was measured eight times, with or without the iteration to compare the residual errors (Figure 10). The PV value and the RMS value of the residual error solved by iteration method were, as a rule, kept within a stable range, which further verifies the high reliability of the measurement.
From the experiment, the stitching result obtained by our algorithm has advantages in comparison with the traditional technique. Among the next practical steps for improving the proposed method include slight modifications and adaptation for characterization of complex structured materials and surfaces [17,18] as well as for inline quality control in a product line [19], which is often highly required in mass production of optical components.

5. Conclusions

An iterative stitching algorithm was proposed in this study for data processing of interferometric measurements of cylindrical surfaces. The technique was demonstrated with an example by determining the surface topography of a cylindrical lens with high NA. By constantly calculating the deviation of the measured overlapping region and then adjusting the position of each sub-aperture, the obtained experimental results had fewer residual errors than when using the traditional method. Possible registered miss-arrangements during measurement were corrected in the data processing. The advantages of this new method enable achieving higher reasonability and reliability than the traditional techniques. The calculation results quickly converge, but the improvement in accuracy is not obvious with increasing numbers of iterations. In addition, due to the high accuracy of the experimental device, a higher number of iterations was not required.

Author Contributions

Writing—Original Draft Preparation and Software: D.C.; Formal Analysis, Investigation and Methodology: J.P.; Project Administration and Supervision: Y.Y. and A.A.; Supervision: A.A.; Editing & Review and editing: Y.Y. and S.V.

Funding

The authors are grateful for support from the following research grants: (1) the National Natural Science Foundation of China (NSFC) (No. 51775326); (2) National Science and Technology Major Project (No.2016YFF0101905); (3) Natural Science Foundation of China (NSFC) (No. 61605126).

Acknowledgments

Dingfu Chen thanks the ’Strategic Partners Scholarship Fund’ program of Shanghai University for the support.

Conflicts of Interest

The authors declare no conflict of interest.

References

  1. Fang, F.; Zhang, X.; Hu, X. Cylindrical coordinate machining of optical freeform surfaces. Opt. Express 2008, 16, 7323–7329. [Google Scholar] [CrossRef] [PubMed]
  2. Zhang, X.; Zeng, Z.; Liu, X.; Fang, F. Compensation strategy for machining optical freeform surfaces by the combined on- and off-machine measurement. Opt. Express. 2015, 23, 24800–24810. [Google Scholar] [CrossRef] [PubMed]
  3. Ramaswami, H.; Kanagaraj, S.; Anand, S. An inspection advisor for form error in cylindrical features. Int. J. Adv. Manuf. Technol. 2009, 40, 128–143. [Google Scholar] [CrossRef]
  4. Chen, M.; Cheng, W.; Wang, C.W.W. Multi aperture overlap scanning technique for large-aperture test. Proc. SPIE 1991, 1553, 626–635. [Google Scholar] [CrossRef]
  5. Otsubo, M.; Okada, K.; Tsujiuchi, J. Measurement of large plane surface shapes by connecting small aperture interferograms. Opt. Eng. 1994, 33, 608–613. [Google Scholar] [CrossRef]
  6. Peng, J.; Chen, D.; Guo, H.; Zhong, J.; Yu, Y. Variable optical null based on yawing CGH for measuring steep acylindrical surface. Opt. Express 2018, 16, 20306–20318. [Google Scholar] [CrossRef] [PubMed]
  7. Wen, Y.; Cheng, H.; Tam, H.Y.; Zhou, D. Modified stitching algorithm for annular subaperture stitching interferometry for aspheric surface. Appl. Opt. 2013, 52, 5686–5694. [Google Scholar] [CrossRef] [PubMed]
  8. Tricard, M.; Kulawiec, A.; Bauer, M. Subaperture stitching interferometry of high-departure aspheres by incorporating a variable optical null. CIRP Ann. Manuf. Technol. 2010, 59, 547–550. [Google Scholar] [CrossRef]
  9. Hagino, T.; Yokoyama, Y.; Kuriyama, Y.; Haitjema, H. Sphericity measurement using stitching interferometry. Key Eng. Mater. 2012, 523, 883–888. [Google Scholar] [CrossRef]
  10. Fan, Y.; Struik, K.; Mulders, P.; Velzel, C. Stitching interferometry for the measurement of aspheric surfaces. CIRP Ann. Manuf. Technol. 1997, 46, 459–462. [Google Scholar] [CrossRef]
  11. Peng, J.; Wang, Q.; Peng, X.; Yu, Y. Stitching interferometry of high numerical aperture cylindrical optics without using a fringe-nulling routine. J. Opt. Soc. Am. A 2015, 32, 1964–1972. [Google Scholar] [CrossRef] [PubMed]
  12. Peng, J.; Xu, H.; Yu, Y. Stitching interferometry for cylindrical optics with large angular aperture. Meas. Sci. Technol. 2015, 26, 025204. [Google Scholar] [CrossRef]
  13. Mac Govern, A.J.; Wyant, J.C. Computer Generated Holograms for Testing Optical Elements. Appl. Opt. 1971, 10, 619–624. [Google Scholar] [CrossRef] [PubMed]
  14. Asfour, J.M.; Poleshchuk, A.G. Asphere testing with a Fizeau interferometer based on a combined computer-generated hologram. J. Opt. Soc. Am. A 2006, 23, 172–178. [Google Scholar] [CrossRef]
  15. Peng, J.; Yu, Y.; Chen, D. Stitching interferometry of full cylinder by use of the first-order approximation of cylindrical coordinate transformation. Opt. Express 2017, 25. [Google Scholar] [CrossRef] [PubMed]
  16. Guo, H.; Chen, M. Multiview connection technique for 360-deg 3D measurement. Opt. Eng. 2003, 42, 900–905. [Google Scholar] [CrossRef]
  17. Valyukh, S.; Osterman, J.; Valyukh, I.; Skarp, K. Characterization of flexible reflective liquid crystal cells. J. SID 2005, 13, 501–506. [Google Scholar] [CrossRef]
  18. Valyukh, S.; Valyukh, I.; Skarp, K. Spectrophotometric determination of reflective liquid crystal cell parameters. J. Appl. Phys. 2006, 99, 053102. [Google Scholar] [CrossRef]
  19. Valyukh, S.; Sorokin, S.; Chigrinov, V. Inline quality control of liquid crystal cells. IEEE/OSA J. Disp. Technol. 2015, 11, 1042–1047. [Google Scholar] [CrossRef]
Figure 1. Schematic view of the cylindrical interference system.
Applsci 08 02092 g001
Figure 2. (a) Schematic diagram of sub-aperture layout; (b) Schematic view of a multi-dimensional adjustment stage.
Applsci 08 02092 g002
Figure 3. (a) The simulation of the proposed method. An ideal cylindrical surface was built and (b) eight sub-apertures were segmented to cover the whole surface and each sub-aperture was attached with some position errors.
Applsci 08 02092 g003
Figure 4. (a) The stitching result without using the iteration algorithm. (b) The result obtained with the proposed iterative method, (c) the residual error between the origin map and traditional method, and (d) the residual error between the origin map and iterative method.
Applsci 08 02092 g004
Figure 5. (a) Photograph of the experimental system and (b) the experimental sample.
Applsci 08 02092 g005
Figure 6. (a) Measured interferograms of different sub-apertures, fringe maps of sub-apertures and (b) the phase maps of sub-apertures.
Applsci 08 02092 g006
Figure 7. (a,b) Stitching result without iteration and the mismatch map; (c,d) comparison with the proposed method with three iterations.
Applsci 08 02092 g007
Figure 8. (a,b) The change of the relative motion errors of two sub-apertures in 10 iterations.
Applsci 08 02092 g008
Figure 9. The interferogram of translation error E r r i k .
Applsci 08 02092 g009
Figure 10. (a) Data comparison of eight groups of the peaks-and-valleys (PV) value of residual error; (b) the root mean square (RMS) value of the residual error.
Applsci 08 02092 g010
Table 1. Errors of the sub-apertures.
Error12345678
Δz (µm)1.20.62.30−1.9−2.11.11
Δy (µm)0.81.41.502.61.4−0.5−0.3
Δγ (″)−3.1−3.7−6.40−5.6−6.6−2.9−1.7
Δβ (″)−3.5−2.33.70−7.0−3.9−6.4−5.6
Δx (µm)00000000
Δα (″)00000000
Table 2. The adjustment errors of each sub-aperture for three iterations.
E r r i ( 3 ) 12345678
Δz (µm)1.2137−0.57410.88440.77860.79420.72320.50380.4332
Δy (µm)−4.40612.7769−0.18650.01280.02050.05740.11290.0850
Δγ (″)−14−16−0.7−0.5−0.2700.20.3
Δβ (″)−3.51−2.273.710−7.01−3.92−6.39−5.57
E r r i ( 3 ) 910111213
Δz (µm)00.4166−0.60060.51410.5827
Δy (µm)00.1540−0.59520.35760.3520
Δγ (″)0−1.6−4.4−0.3−0.3
Δβ (″)0−4.14.6−0.8−0.9

