Analysis of the Energy Use in the Mexican Residential Sector by Using Two Approaches Regarding the Behavior of the Occupants


Department of Architecture, Universidad de las Americas Puebla, Ex Hacienda Sta. Catarina Martir, San Andres Cholula, Puebla 72810, Mexico
*
Author to whom correspondence should be addressed.
Appl. Sci. 2018, 8(11), 2136; https://doi.org/10.3390/app8112136
Submission received: 13 September 2018
/
Revised: 21 October 2018
/
Accepted: 27 October 2018
/
Published: 2 November 2018
(This article belongs to the Special Issue New Heating and Cooling Concepts)
Abstract
:An analysis of the energy use in the Mexican residential sector is carried out. To achieve this, two approaches are taken into account. The first one is the usage of low-energy devices, and the second one is the decrease of their time of use. These two approaches are considered in the calculation method with random values of power and time of usage. The energy activities are divided into air-conditioning, illumination & appliances, and refrigeration. After total annual use is validated with the actual values of energy use in 2015, a sensitivity analysis of the approaches used separately and together is carried out in order to determine the potential of energy saving. Thereby, it is found that the most influential parameter for energy saving is the extensive acquisition of more efficient technologies of illumination & appliances, followed by the decrease of use of the same illumination & appliances. Furthermore, with an integrated approach that takes into account both the use of efficient devices and the reduction of their use for the three energy activities, a maximum of 19.67 TWh is calculated in 2015 for the Mexican residential sector. This approach is therefore expected to have a reliable basis for the development and improvement of policies that help to drive energy savings in an extensive manner in Mexico.
1. Introduction
The energy transition process is a global action to counter climate change [1] that involves the switch from fossil-fuel-based electricity to renewable sources, the use of low-carbon technologies in sectors such as transport and industry, and the application of more energy-efficient processes, among other strategies [2]. Furthermore, according to the Intergovernmental Panel on Climate Change (IPCC), the building sector is an important target for addressing climate change because it accounts for almost 40% of the total energy use, contributing almost 25% the global greenhouse gases emissions [3].
Thereby, in the building sector various approaches have been applied in order to fulfill the different international protocols and agreements combating climate change such as Kyoto, Cancun and Paris [4]. Among these approaches there are the use of on-site renewable energy, codes for the building design, and the development of passive cooling/heating systems [3]. Of these approaches, one of the most important is the regarding the behavior of the occupants in terms of the handling of HVAC&R (heating, ventilation, air-conditioning and refrigeration), illumination and appliances. This is important because, for instance, studies have found out that operation by the users has more influence for HVAC&R performance than climate conditions [5]. Similar results have been found in electrical and gas appliances [6], claiming that an incorrect operation can represent up to 30% of energy waste [7].
Hence, in order to have a deeper analysis of the energy performance of a building, the occupants’ behavior must be taken into account. The randomness of this behavior, however, drives the analysis to the use of stochastic modelling. Various studies have focused on the importance of the occupants onto the building performance, especially the related to the energy consumption [8,9,10,11,12,13,14,15,16,17,18,19] and on the stochastic modelling necessary to understand the energy consumption and performance upon buildings [20,21,22,23,24,25,26,27,28,29,30]. Nonetheless, there is not, to the best of our knowledge, any similar study on Mexican buildings, neither analyzing the role of the occupants on the buildings nor developing stochastic modelling to analyze the performance of the buildings.
1.1. Mexican Climatic Regions
As the climate conditions are very important for the energy use, especially for HVAC&R, the main climates of Mexico are analyzed here. Four major climates present within the Mexican territory are identified (see Figure 1). Arid conditions are predominant in the northern region, dry tropics in the west, temperate conditions are present in the center and humid tropics in the southeast part. These four regions are differentiated by their average outdoor temperature and relative humidity as can be seen in Figure 2.
Figure 2 shows that for arid conditions the average temperature is high in summer and the relative humidity (RH) is low (under 50%) almost all year long. The dry tropic climate presents a similar behavior as the mean temperature in arid regions (low in winter and high in summer) and a medium relative humidity (around 70%) during the year. Temperate conditions have low average temperatures (under 20 °C) and a relative humidity similar to dry conditions. Humid tropics have high mean temperatures (above 25 °C) and a high relative humidity (above 80%) throughout the year.
Also, the distribution of the Mexican population is given in Table 1, where it is seen that more than half of the Mexicans live in temperate conditions. Nevertheless, the other half lives in conditions that enforce the use of space conditioning (HVAC&R).
Thereby, this paper has the aim of showing the energy performance on the Mexican residential buildings according to the behavior of the occupants, hence calculating the potential of energy saving. The analysis pretends to be carried out upon a large-scale scenario, taking the Mexican housing sector as a case study, and considering the warm climate conditions (reflected in the use of air-conditioning systems). By doing this, it is expected to set up the basis for an extensive use of better practices regarding the behavior of the occupants in terms of energy use and saving.
1.2. Calculation of the Residential Energy Use
In order to develop the program of calculation of the electricity use of the Mexican residential sector, an analysis of this use should be applied. This analysis has the purpose of showing the main energy activities in Mexican dwellings and their share of total energy usage. Also, it has the objective of breaking down the two main approaches of energy saving that can be applied by the occupants of the Mexican dwellings (use of low-energy devices and reduce of the time of usage).
The national electricity use in the Mexican residential sector in 2015 was 54.60 TWh [31]. In the same year, a total of 31.37 million of occupied dwellings was estimated by the Mexican National Council of Housing (CONAVI, initials in Spanish) [32]. Therefore, an average daily use of 4.76 kWh/dwelling is calculated in Mexico for the same year.
Regarding the characteristics of the households, according to CONAVI, 82% of the Mexican dwellings have a combination of walls-roof of brick-concrete, respectively, whereas the remaining 18% have construction materials such as clay tile & corrugated roofs for the roofs, and adobe as well as wood for the walls. Concerning the size of the buildings, 10.6% have a built area of 45 m2 or less, 46.9% have an area between 45 and 100 m2, and 42.5% are bigger than 100 m2. Also, it is stated that in 22.6% of the dwellings live 1 to 2 persons, in 57.3% live 3 to 5 people, 16.6% of the households have 6 to 8 occupants, and 3.5% have more than 9 users [32].
Furthermore, according to the Mexican National Council of Efficient Use of Energy (CONUEE, initials in Spanish), the most important activities related to the energy use (electrical and thermal) within a regular air-conditioned household are the following: air-conditioning systems (only cooling), illumination, including street lights where are close by the dwellings (nevertheless, there is not sufficient information concerning how the Mexican Federal Commission of Electricity considers “close by the dwellings” [33]) & appliances, stove, water & space heating, and refrigeration [33]. It is worthy to mention that illumination & appliances include street lights, televisions, washing machines, lamps, microwave ovens, computers etc. Nonetheless, to the best of our knowledge, there is no further analysis of the use of these devices.
On the other hand, for not air-conditioned dwellings the activities are presented as follows: Illumination & appliances, stove & water heating, and refrigeration. It is important to mention that the stove, water heating & space heating are considered as mostly gas-based activities (thermal energy) in Mexico by the CONUEE. Thereby, the share of total of the energy use are shown in Table 2.
In the study by the CONUEE, space heating represents a very small share of the thermal energy use. Nevertheless, space cooling seems to be a large share of the electricity use. Thereby, for the same year 2015, Oropeza-Perez calculated a use of 11.92 TWh for air-conditioning systems within the residential sector, considering a total of 6.93 million of air-conditioned dwellings [34]. Thus, an average daily use of 4.66 kWh/dwelling is estimated. In the same year, the CONUEE calculated a share of 21% of the total electricity use in the residential sector for air-conditioning. If this is considered for this study, a use of 11.58 TWh is estimated, therefore the analysis can be considered as valid.
Furthermore, the daily use of energy (thermal and electrical) on air-conditioned dwellings is given by the Mexican Ministry of Energy which is 10.73 kWh/dwelling, where 4.73 kWh is used for air-conditioning [31]. Therefore, air-conditioning makes up 44% of the total energy use of an air-conditioned household, which is considered to be a valid result.
With respect to the average energy use of every activity, this is calculated for an air-conditioned (10.73 kWh/day) and for a non-air-conditioned household (4.67 kWh/day) by taking the shares given by the CONUEE (see Table 3).
With Table 2 the thermal energy use is calculated at 14.32 TWh/year, i.e., 20.9% of the total thermal and electrical energy, in air-conditioned dwellings is 14% and in not air-conditioned is 25%. Figure 3 shows a break-down of the energy activities within the Mexican residential sector.
In this way, two main type of dwellings are considered: Air-conditioned and not air-conditioned. This is considering that in many of the warmest parts of Mexico, air-conditioning systems are seen as being indispensable [33]. On the other hand, although large parts of the Mexico have warm to hot climates, the usage of air-conditioning is not essential in warm temperate zones, where a large part of the population lives (cf. Table 1), therefore most of Mexican households are not air-conditioned.
Furthermore, the average power of each activity as well as the average time of usage have been found for Mexican conditions in prior documents by Rosas-Flores et al. and Arroyo-Cabanas et al. [35,36]. The data is shown in Table 4. It is important to mention that these values are nationally averaged, and they can vary due to economic, social and other factors.
In order to validate the energy use analysis, a comparison between the national energy use calculated in this paper and given by refs. [35,36] is shown in Table 5. For this, the annual use of both studies was multiplied by 6.93 million of air-conditioning dwellings and by 24.44 million of not air-conditioning, respectively.
Thereby, the total of energy use shown in Table 5 is only related to electricity. It is noticed that the figures have the same order of magnitude, and after being compared to the figures provided by the Ministry of Energy for the same year (54.60 TWh) [31] the figures are considered as valid. Moreover, from now on, only electricity is considered in the analysis presented in this paper.
Two main approaches are considered as strategies for saving energy in buildings: The usage of energy-efficient appliances and a proper operation of the devices. Although there are other approaches such as the use of renewable energy and smart grids, it is considered that these are not well integrated in the Mexican framework, where a one-way connection to the conventional national electrical grid is still a common practice for many households [37].
For calculating the energy saving by applying these two approaches it is considered that the energy unit (Watt-hour) can be separated into two parts. In other words, the use of low-consuming devices would decrease the power (Watts), and a proper handling would decrease the time of use (hours). The decreases can be applied together or separately in order to find the lowest use while keeping a proper performance of the device.
2. Methodology
2.1. Calculation Method
According to Equation (1), the energy use of any electrical device can be estimated by multiplying its power by its time of use:
Thereby, the calculation method is divided into two parts that might take stochastic values: The range of watts of the different devices, and the minimum and maximum time of usage of these devices. In order to calculate the total annual electricity use (TAEC) for Mexico in 2015, the activities within the air-conditioned dwellings (6.93 million) are broken down into air-conditioning, illumination & appliances, and refrigeration, whereas the activities within the free-running, i.e., not air-conditioned dwellings (24.44 million) are broken down into illumination & appliances, and refrigeration. Equation (2) shows the calculation with the respective number of air-conditioned and free-running households in the country:
Equation (2) can be developed to Equation (3):
Equation (3) shows the sum of the energy use for the 6.93 million air-conditioned households and the 24.44 million non-air-conditioned dwellings in Mexico in 2015 depending on the corresponding devices’ power and time of usage.
Furthermore, in Equation (3), PowerAC, PowerI&A, PowerR, TimeAC, TimeI&A and TimerR have random values ranged between a respective lower and an upper threshold. These lower and upper thresholds depend on the minimal and maximum values of power for every devices and the minimal and maximum values of time of use for each activity (refrigeration, air-conditioning, and illumination & appliances). Moreover, for air-conditioning and refrigeration only one device is considered for each dwelling, whereas for illumination & appliances two or more devices are taken into account, therefore the value of PowerI&A is an aggregated value of all the appliances and lights of the household. Finally, it is important to mention that the thresholds are independent of each other.
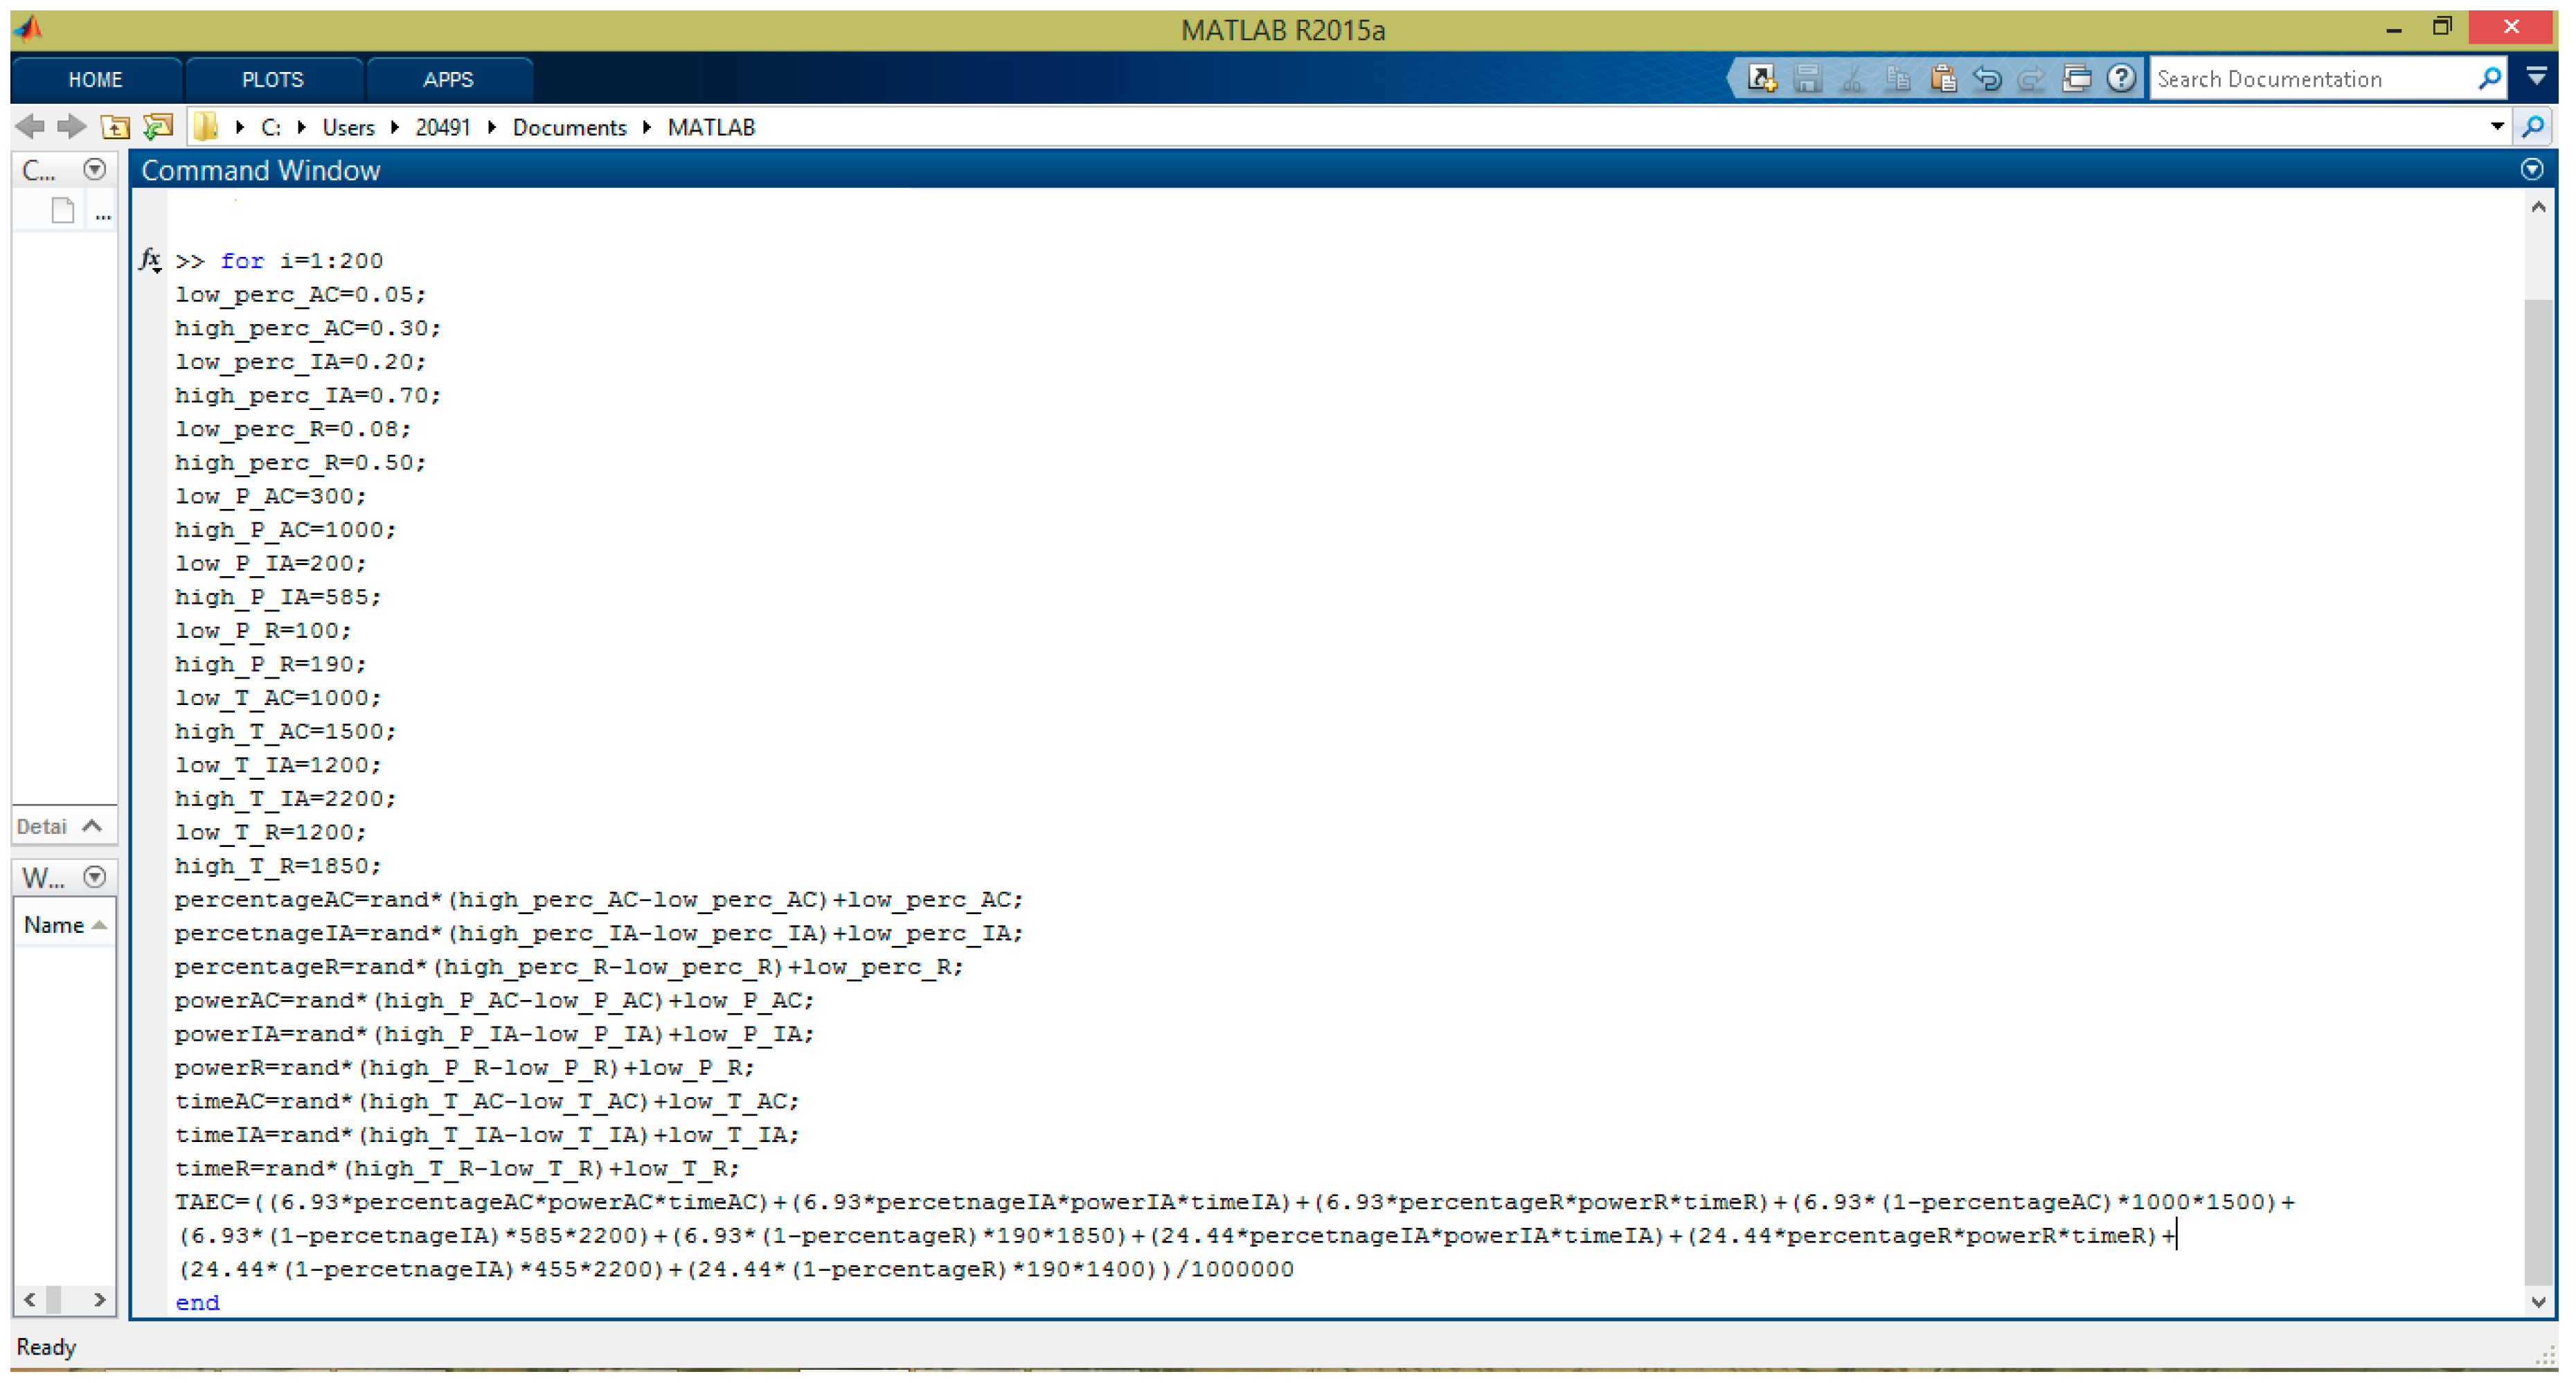
In addition, in Equation (3) it is considered that a percentage of penetration of the two approaches is taken into account, while the remaining percentage still has the conventional practice. In other words, for instance, if the use of low-energy refrigeration is applied to 25% of the air-conditioned dwellings, it is considered that the other 75% has an average power of refrigeration of 190 W (cf. Table 4). Thereby, by using the programming software MatLab [38], the model is developed. In Figure 4 the code of the program can be seen.
From the code shown in Figure 4 a new method that calculates the electricity consumption onto the Mexican residential sector can be displayed. The novelty of the method consists in the use of random values of power and time of usage of the electrical devices and therefore analyzing in a probabilistic manner the energy saving potential. With this, more realistic results can be achieved than those estimated in a deterministic manner, for the “contribution to the reliability of building performance assessments” [39].
If the inputs in the program are set with the actual averaged values in Mexico in 2015, i.e., for air-conditioned households: PoweAC 1000 W, PowerI&A 585 W, PowerR 190 W, TimeAC 1500 h, TimeI&A 2200 h and TimeR 1850 h; for free-running dwellings: PowerI&A 455 W, PowerR 190 W, TimeAC 2200 h and TimeR 1400 h (cf. Table 4), the TAEC is 54.6 TWh as is stated by the Ministry of Energy.
In this case, it is considered that the level of penetration of the approaches is 0%. Nevertheless, this is not true since there are already dwellings that use low-power devices and reduce the time of usage. There is no data availability, however, of the percentage of application of the approaches. Hence, it is decided to take the averaged power and time of usage (Table 4) along with a level of penetration of 0% as the baseline of the energy use.
As the saving potential depends on the level of penetration of the two proposed approaches, i.e., the number of households, air-conditioned and non-air-conditioned, that are willing to purchase low-energy devices and/or reduce their time of usage, the set of upper and lower threshold of power, time of usage and level of penetration is carried out.
2.2. Upper and Lower Threshold of Penetration
The lower and upper values of power and time of use presented in the Mexican scenario can be seen in Table 6. The values are taken from [35,36] and were estimated based upon the Mexican National Association of Manufacturers of Domestic Devices (in the case of the power) and on surveys made by the authors (in the case of the time of usage). It is worthy to state that these values might vary due to various factors such as the brand & model of the device, and the schedule of the users.
It is important to mention that the conventional ranged power of air-conditioning is stated at 1000–4000 W, illumination & appliances at 100 W (incandescent lightbulb)–1700 W (microwave oven); and refrigeration at 150–400 W [40].
In order to carry out the analysis upon a national scale, lower and upper values of the probable national percentage of the saving appliances saturation and the time-of-usage reduction have to be taken into account. These percentages represent the expected number of households that implement the efficient appliances and/or reduce their time of usage. For this, the governmental programs of energy efficiency were taken account of as well as their expectance of penetration amongst Mexican dwellings [41]. The values are displayed in Table 7.
According to the two main programs of saving energy in the Mexican residential sector of the last two government administrations, i.e., the Program of Substitution of Electrical Devices for Energy Saving and the Program of Substitution of Incandescent Lightbulbs for Energy Saving Lightbulbs [33], it is expected to substitute between 300 thousand and 2 million old AC devices, the switch for efficient lightbulbs in 6 to 22 million dwellings, and the substitution of 2 to 14 million of inefficient refrigerators, all this in a period of 8 years [33]. With these figures, the lower and upper thresholds were set in Table 7 and in accordance to the goals of the existing programs.
It is important to mention that the percentages are considered the same for both the appliance saturation and the households that reduce the time of usage of their devices. This is considering that the governmental programs which encourage users to purchase more efficient appliances and to reduce their time of use (including Daylight Saving Time) do not show a clear difference between the two approaches. It is considered that the remaining percentage of dwellings uses the averaged power and time of use, in this paper taken from Table 4.
Finally, for a simplification purpose, it is considered that 100% of the dwellings have an electrical connection, electrical appliances and at least one refrigerator. In the realistic Mexican scenario, 97% of the residential stock is connected to the national grid [42]. Out of them, 99% have at least one appliance and/or electrical illumination device, and 89% have at least one refrigerator [42].
3. Results
3.1. Sensitivity Analysis
Runs of the program were carried out in order to find the correspondent TAEC, considering 200 as a sufficient number of executions to analyze the variance of energy use without overloading the number of outputs. As mentioned before, the program was developed only for ranges of power, time of use and percentage of saturation below the actual values. This is considering that the governmental programs have a sort of effect amongst the residential users and thus there is a certain level of energy saving within the Mexican residential sector. Nevertheless, the program could calculate higher use than the presented in reality (54.6 TWh). This is because the program has an error rate of 2.56% with respect to the actual energy use.
Thereby, if there is a saturation of electrical devices with a level of energy efficiency, Figure 2 can be displayed. 200 runs are carried out for a case of use of efficient illumination & appliances, 200 for a case of usage of efficient refrigeration, and 200 runs for the use of efficient air-conditioning. The results are shown simultaneously in Figure 5.
In Figure 5 it can be noticed that the usage of efficient refrigerators and air-conditioning has only a slight effect on the Mexican residential electricity use (maximum saving of 3.3 and 3.9 TWh, respectively) whereas the usage of efficient appliances & illumination can reduce considerably the electricity use, up to 16.01 TWh. Nevertheless, it is noticed that the probability of having an energy saving is higher if the usage of efficient devices is focused on air-conditioning and refrigerators. In other words, the usage of efficient air-conditioning units can ensure at least a saving of 1.89 TWh, and the usage of efficient refrigerators can provide a saving of 1.04 TWh. By using low-energy illumination & appliances, the probability of having a higher energy saving than low-energy air-conditioning is 79%, while is 87% probable of having a higher saving than the use of low-energy refrigerators, even though there is a probability of having a higher energy use than the actual presented in 2015.
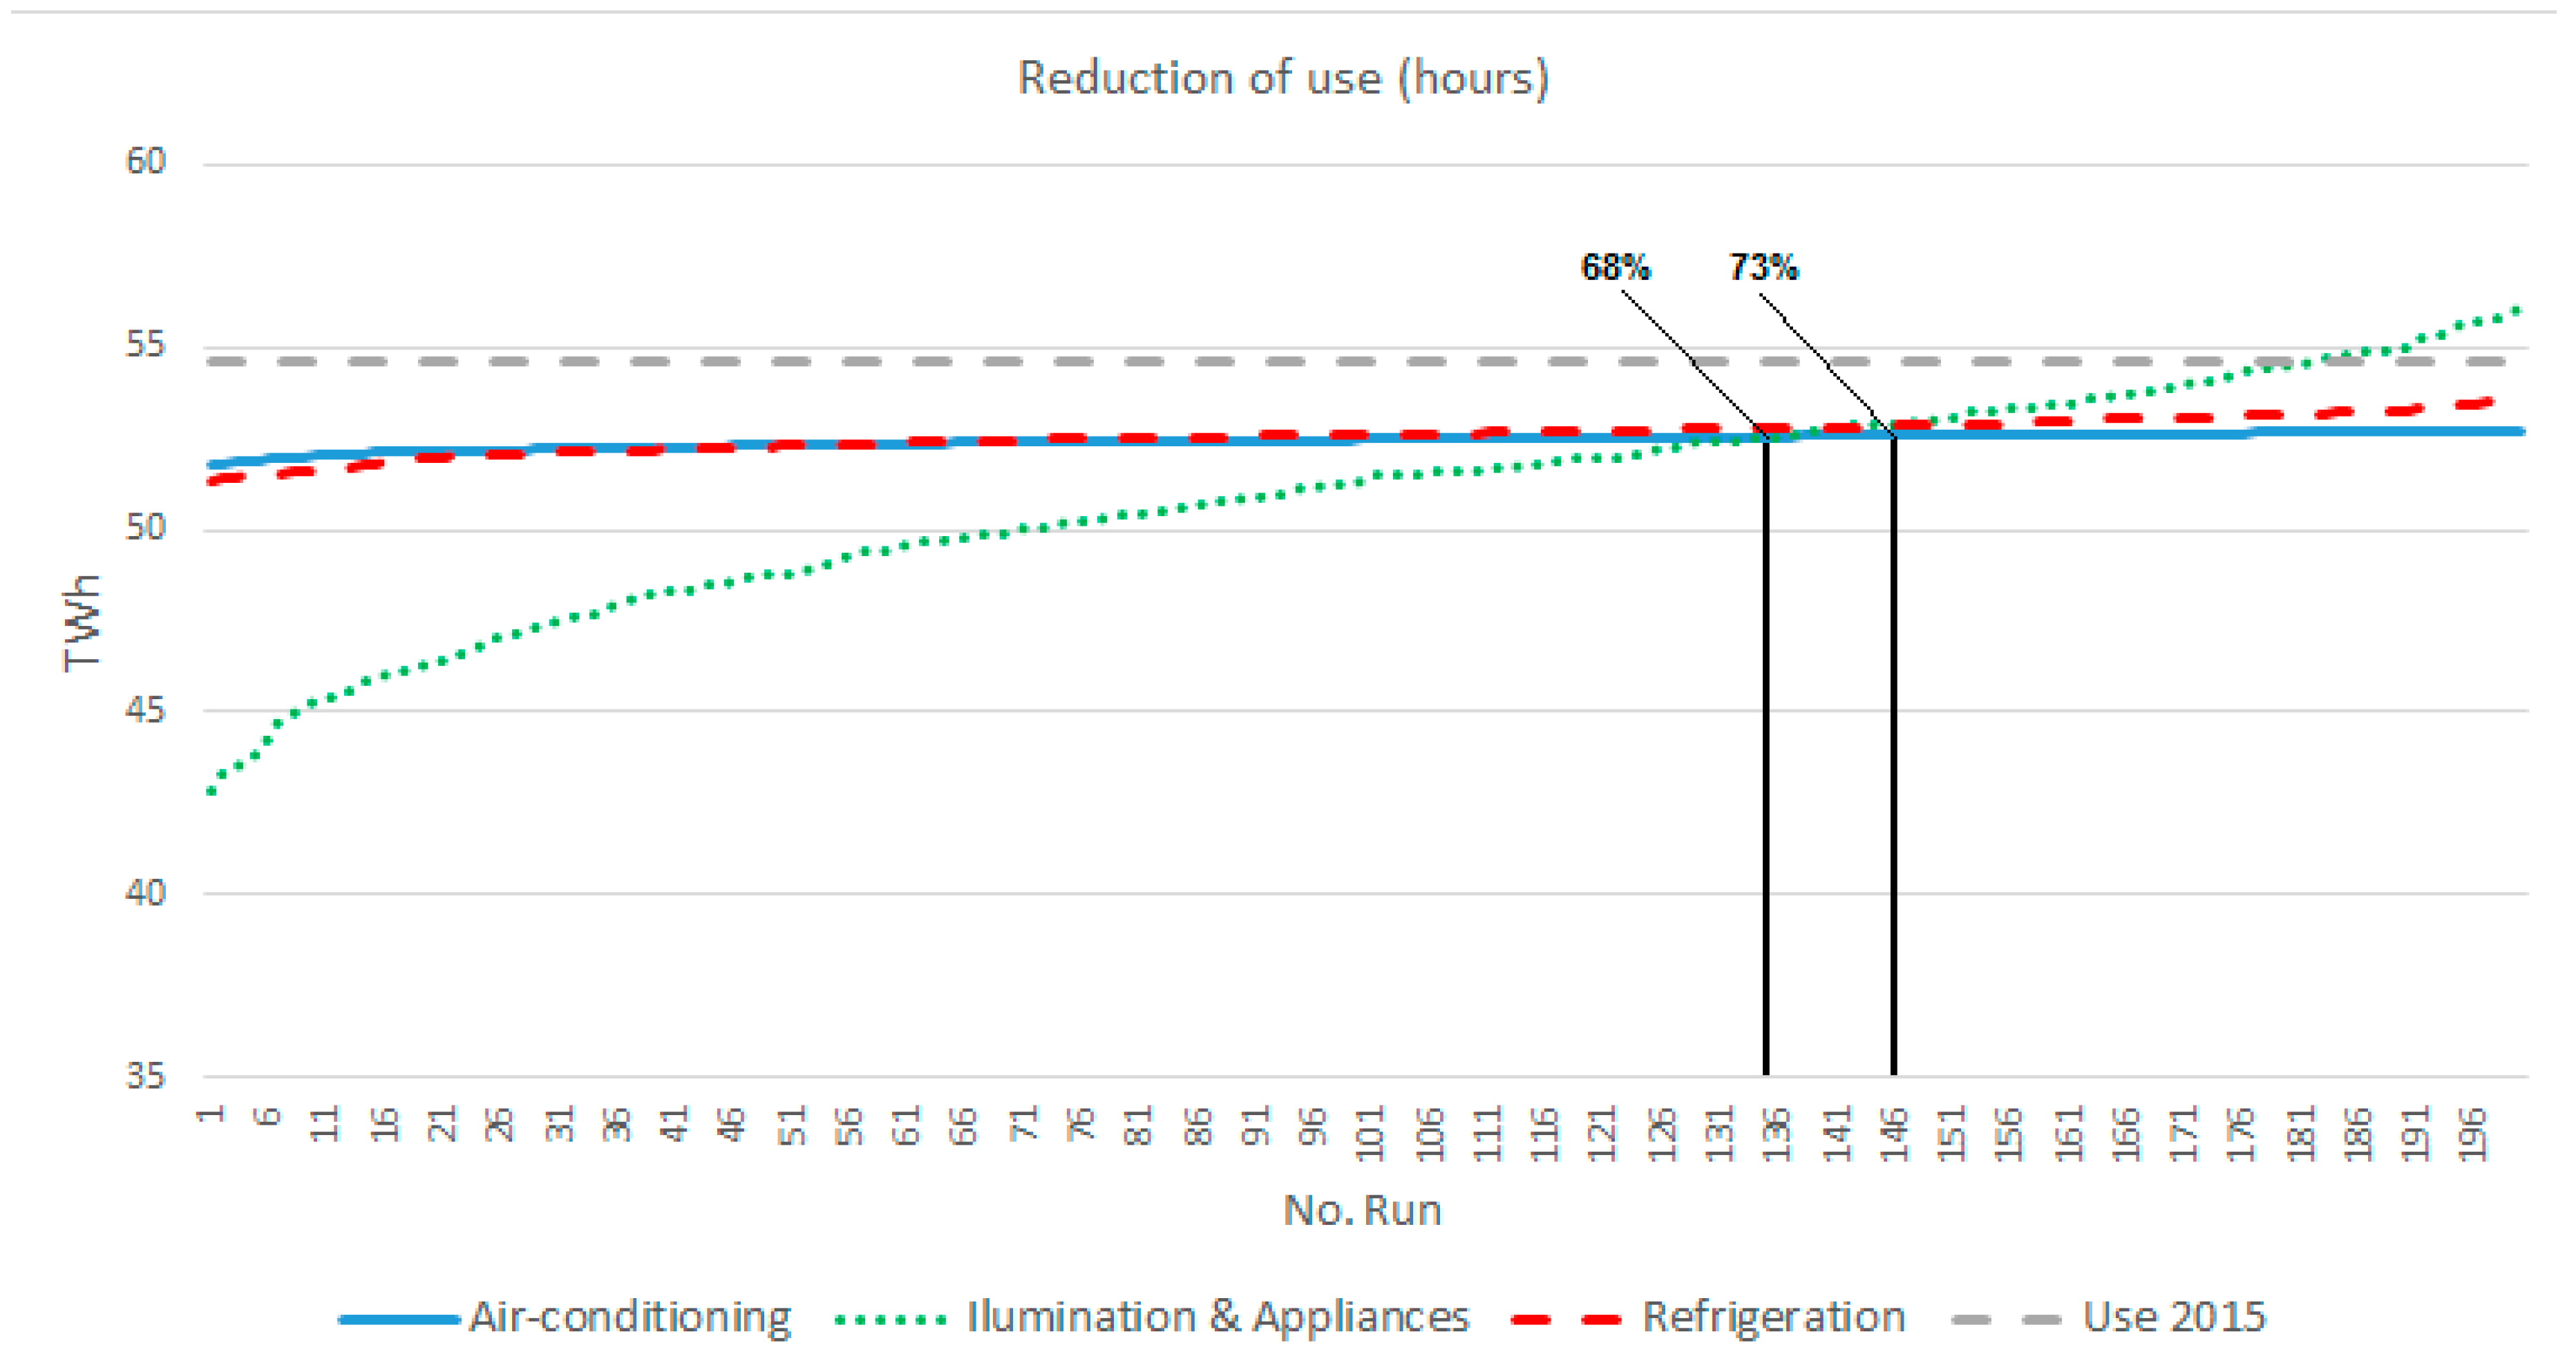
When the time of usage of the devices is reduced, Figure 6 can be constructed. Again, the electricity use is calculated with a reduction of usage not related between the three energy activities. In this case it is considered that the time of use of air-conditioning systems, illumination & appliances is reduced by switching off the devices, whereas the time of use of refrigerators is decreased by not getting hot products in, not letting the door open and not opening the door many times, therefore the compressor of the refrigerator does not work in an often manner [33].
As for the use of efficient devices, the time reduction of usage of refrigeration and air-conditioning systems does not have a high influence upon the electricity use (maximum saving of 3.3 and 2.9 TWh, respectively). There is, however, a major reduction if the appliances & illumination are decreased in their time of usage i.e., 13.15 TWh. Nonetheless, with the reduction of the usage of air-conditioning ensures a saving of 1.89 TWh. Also, with the reduction of usage of refrigerators the saving would be at least 0.94 TWh. By decreasing the time of usage of illumination & appliances, the probability of having a higher energy saving than decreasing the usage of air-conditioning is only 68%, while there is a 73% chance of having a higher saving than the reduction of the use of refrigerators.
If both the power and the usage are reduced, Figure 7 is displayed. In this case the calculation of the electricity use of each energy activity is estimated in an independent manner too.
From Figure 7 it is seen that that the combination of using efficient devices and decreasing their time of usage achieves an ensured saving of 1.93 TWh for air-conditioning and 1.12 TWh for refrigeration, this is in accordance with other studies [36,43]. By decreasing the usage of illumination & appliances and applying efficient devices for the same activity the saving could be 17.87 TWh. By decreasing the time of usage and using low-energy illumination & appliances, the probability of having a higher energy saving than the combination of low-energy and decreasing the usage time of air-conditioning is 96%, while having a 98% chance of having a higher saving than the usage of low-energy and reduction of use of refrigerators. In all cases, the saving rate for refrigerators and air-conditioning systems is very poor, i.e., less than 7% of the total national electricity use.
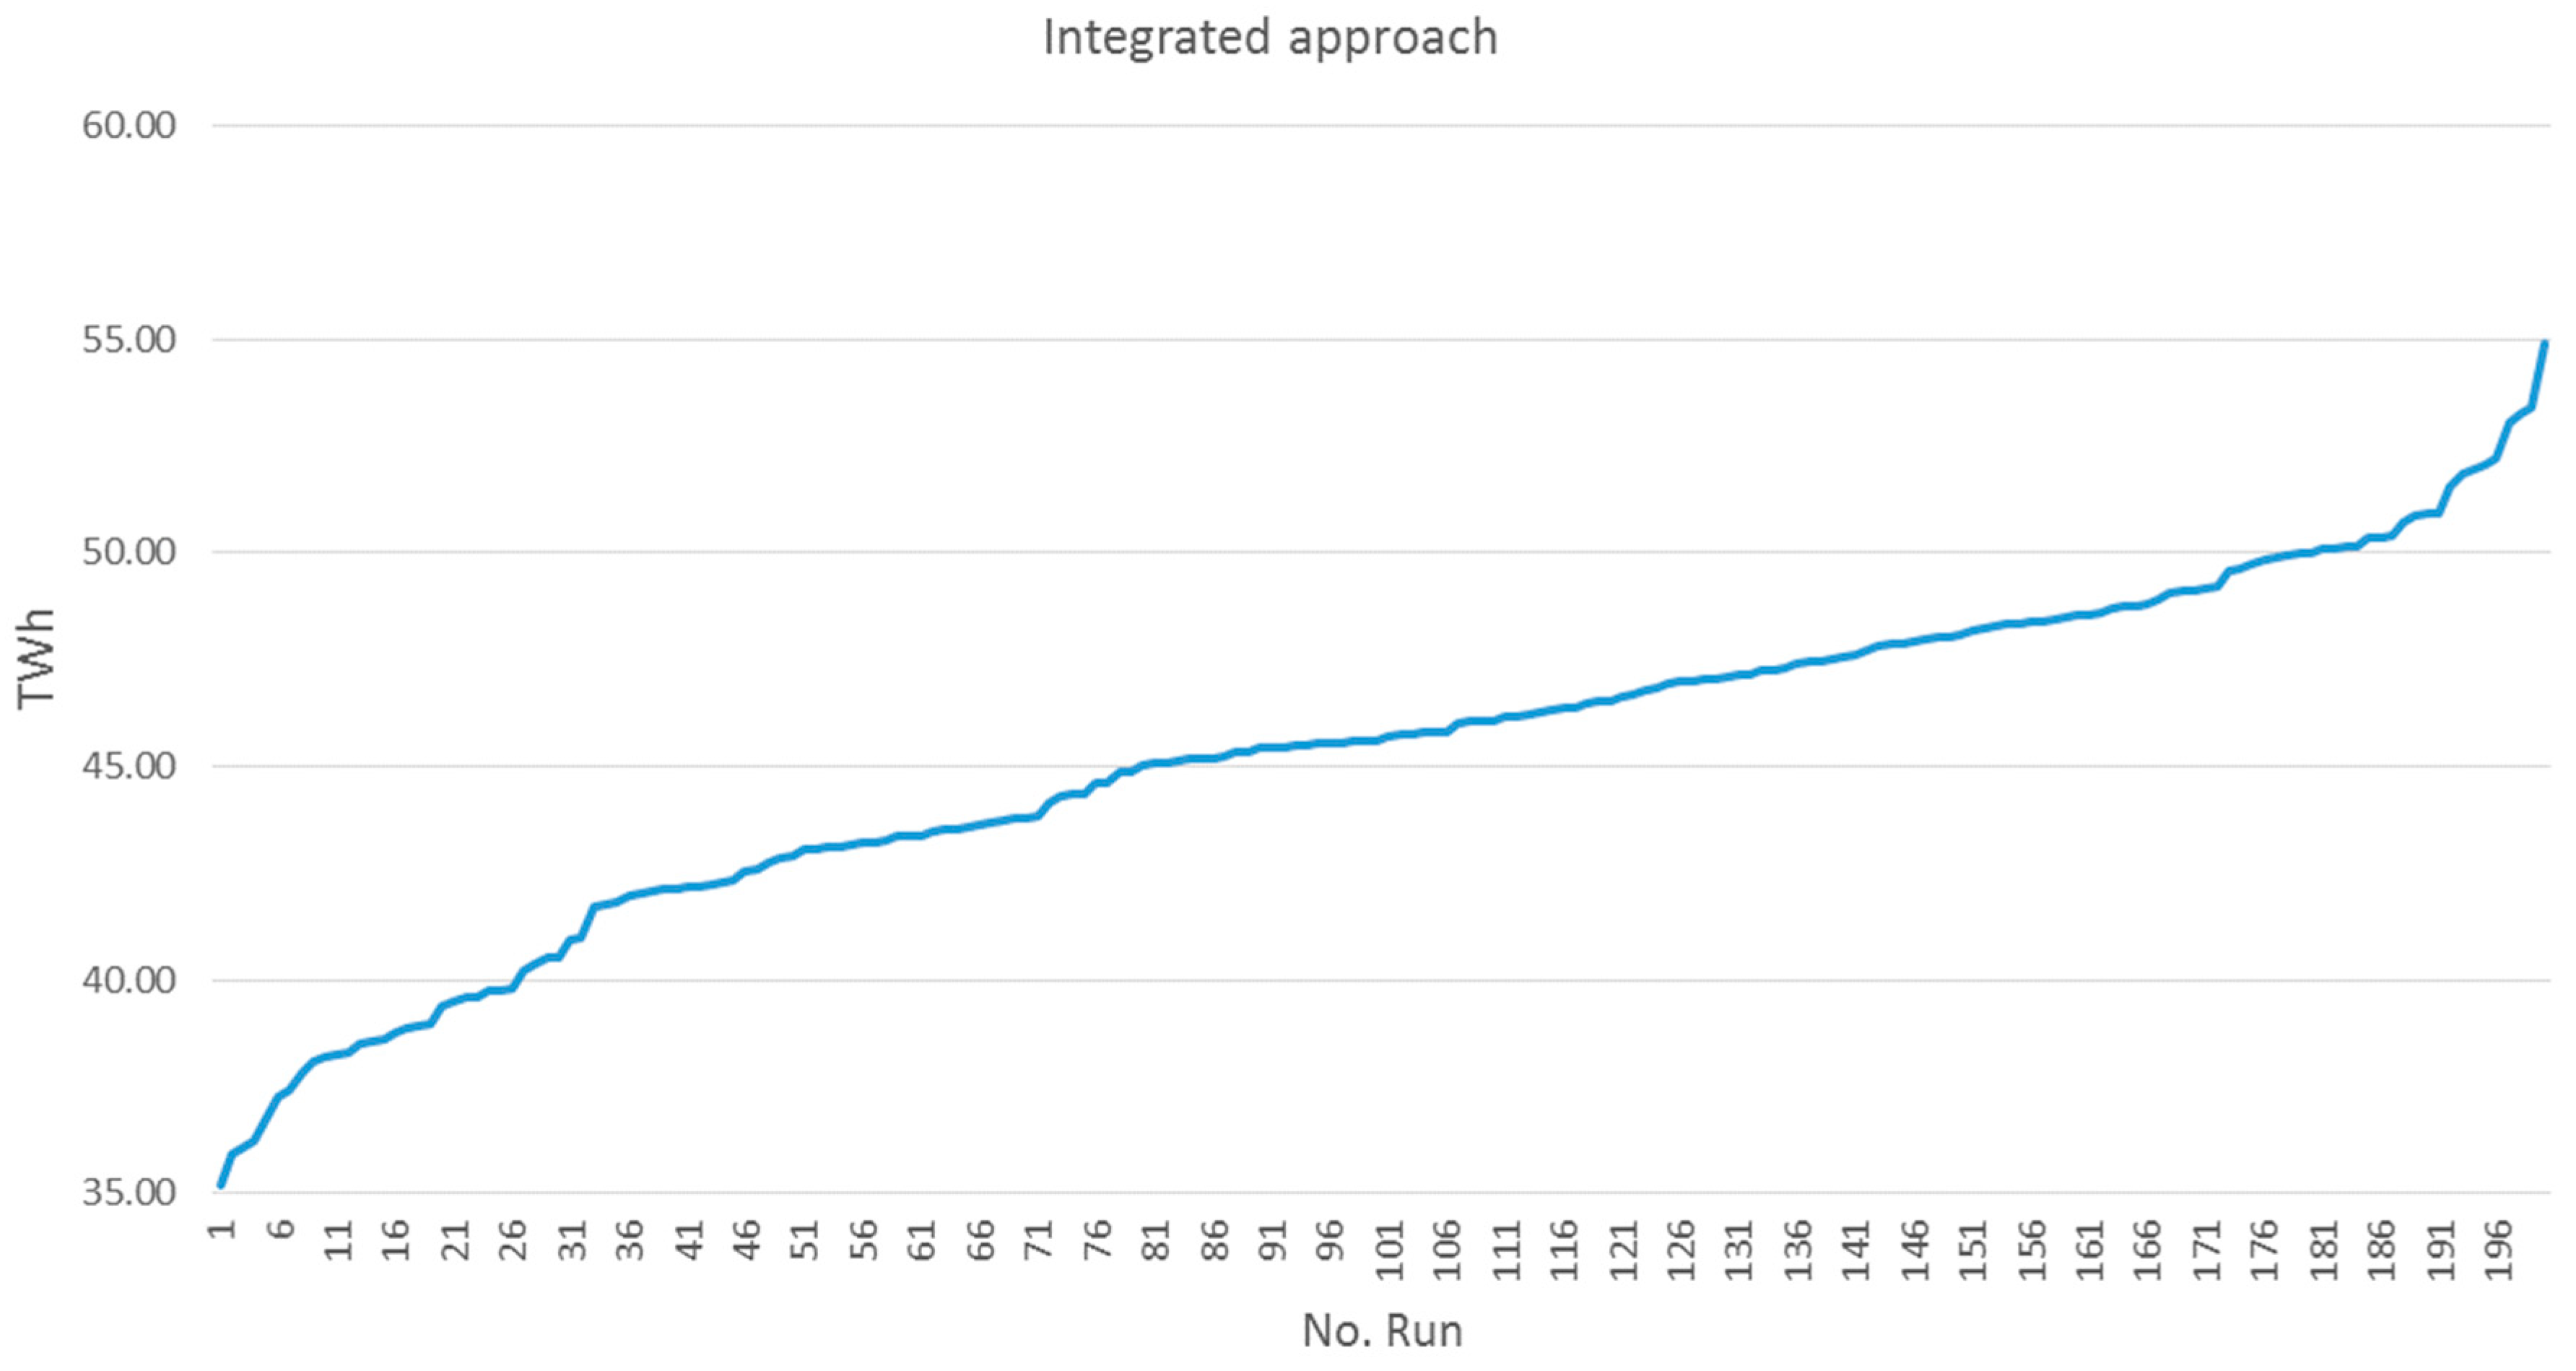
Finally, when an integrated approach is used that involves a saturation of efficient appliances and a reduction of their time of use for all the three electrical energy activities being applied at the same time in the residential sector, Figure 8 can be plotted.
As can be seen from Figure 8, by applying an integrated approach, there is a very high probability of obtaining considerable energy savings. This in addition to existing programs such as the Mexican Daylight Saving Time program (Horario de Verano, title in Spanish), which, since 1996 has gotten a yearly average saving approximately of 1 TWh [44].
Furthermore, the maximum energy saving is estimated at 19.67 TWh for the Mexican residential sector in 2015. With this maximum energy saving, and with an emission factor of 0.454 tons of CO2eq/MWh for Mexico [45], it is calculated that a total of 8.93 million of tons of CO2eq could have been avoided in 2015.
3.2. Comparison with Other National Programs
Making a comparison with other national-wide scenarios, in terms of percentage of saving compared to a baseline of energy use, Table 8 can be constructed.
3.3. Limitations of the Results
It is important to mention that the results assessed in the paper have various limitations in terms of the different features of the devices (power, brand etc.), the real time of usage of the devices, and the actual penetration of the two proposed approaches. To obtain more accurate results, a deeper analysis of the time of use and the power of the devices for 30 million households should be carried out. Therefore, this analysis would require a great amount of effort and time. Nevertheless, to find out more precise results it is necessary to do so.
3.4. A National Strategy Proposal
With the estimated results of energy saving and CO2 mitigation, a national-wide strategy is proposed in this paper. This strategy must be in accordance with the format of other programs such as the Daylight Saving Time, the Program of Substitution of Electrical Devices for Energy Saving (Programa de Sustitución de Equipos Electrodomésticos para el Ahorro de Energía, title in Spanish) and the Program of Substitution of Incandescent Lightbulbs for Energy Saving Lightbulbs (Programa de Sustitución de Focos Incandescentes por Lámparas Ahorradoras, title in Spanish) [51,52].
Despite the aforementioned programs, which are independent of each other, this strategy must be an integrated approach of these existing programs and other new programs such as the decrease of time that electrical devices are being used (not only illuminations as it is stated at the Daylight Saving Time) in order to increase the upper thresholds of level of penetration of the approaches (purchase of efficient devices and reduce the time of use) amongst Mexican residential users. Therefore, the probability to achieve higher energy savings will be enhanced.
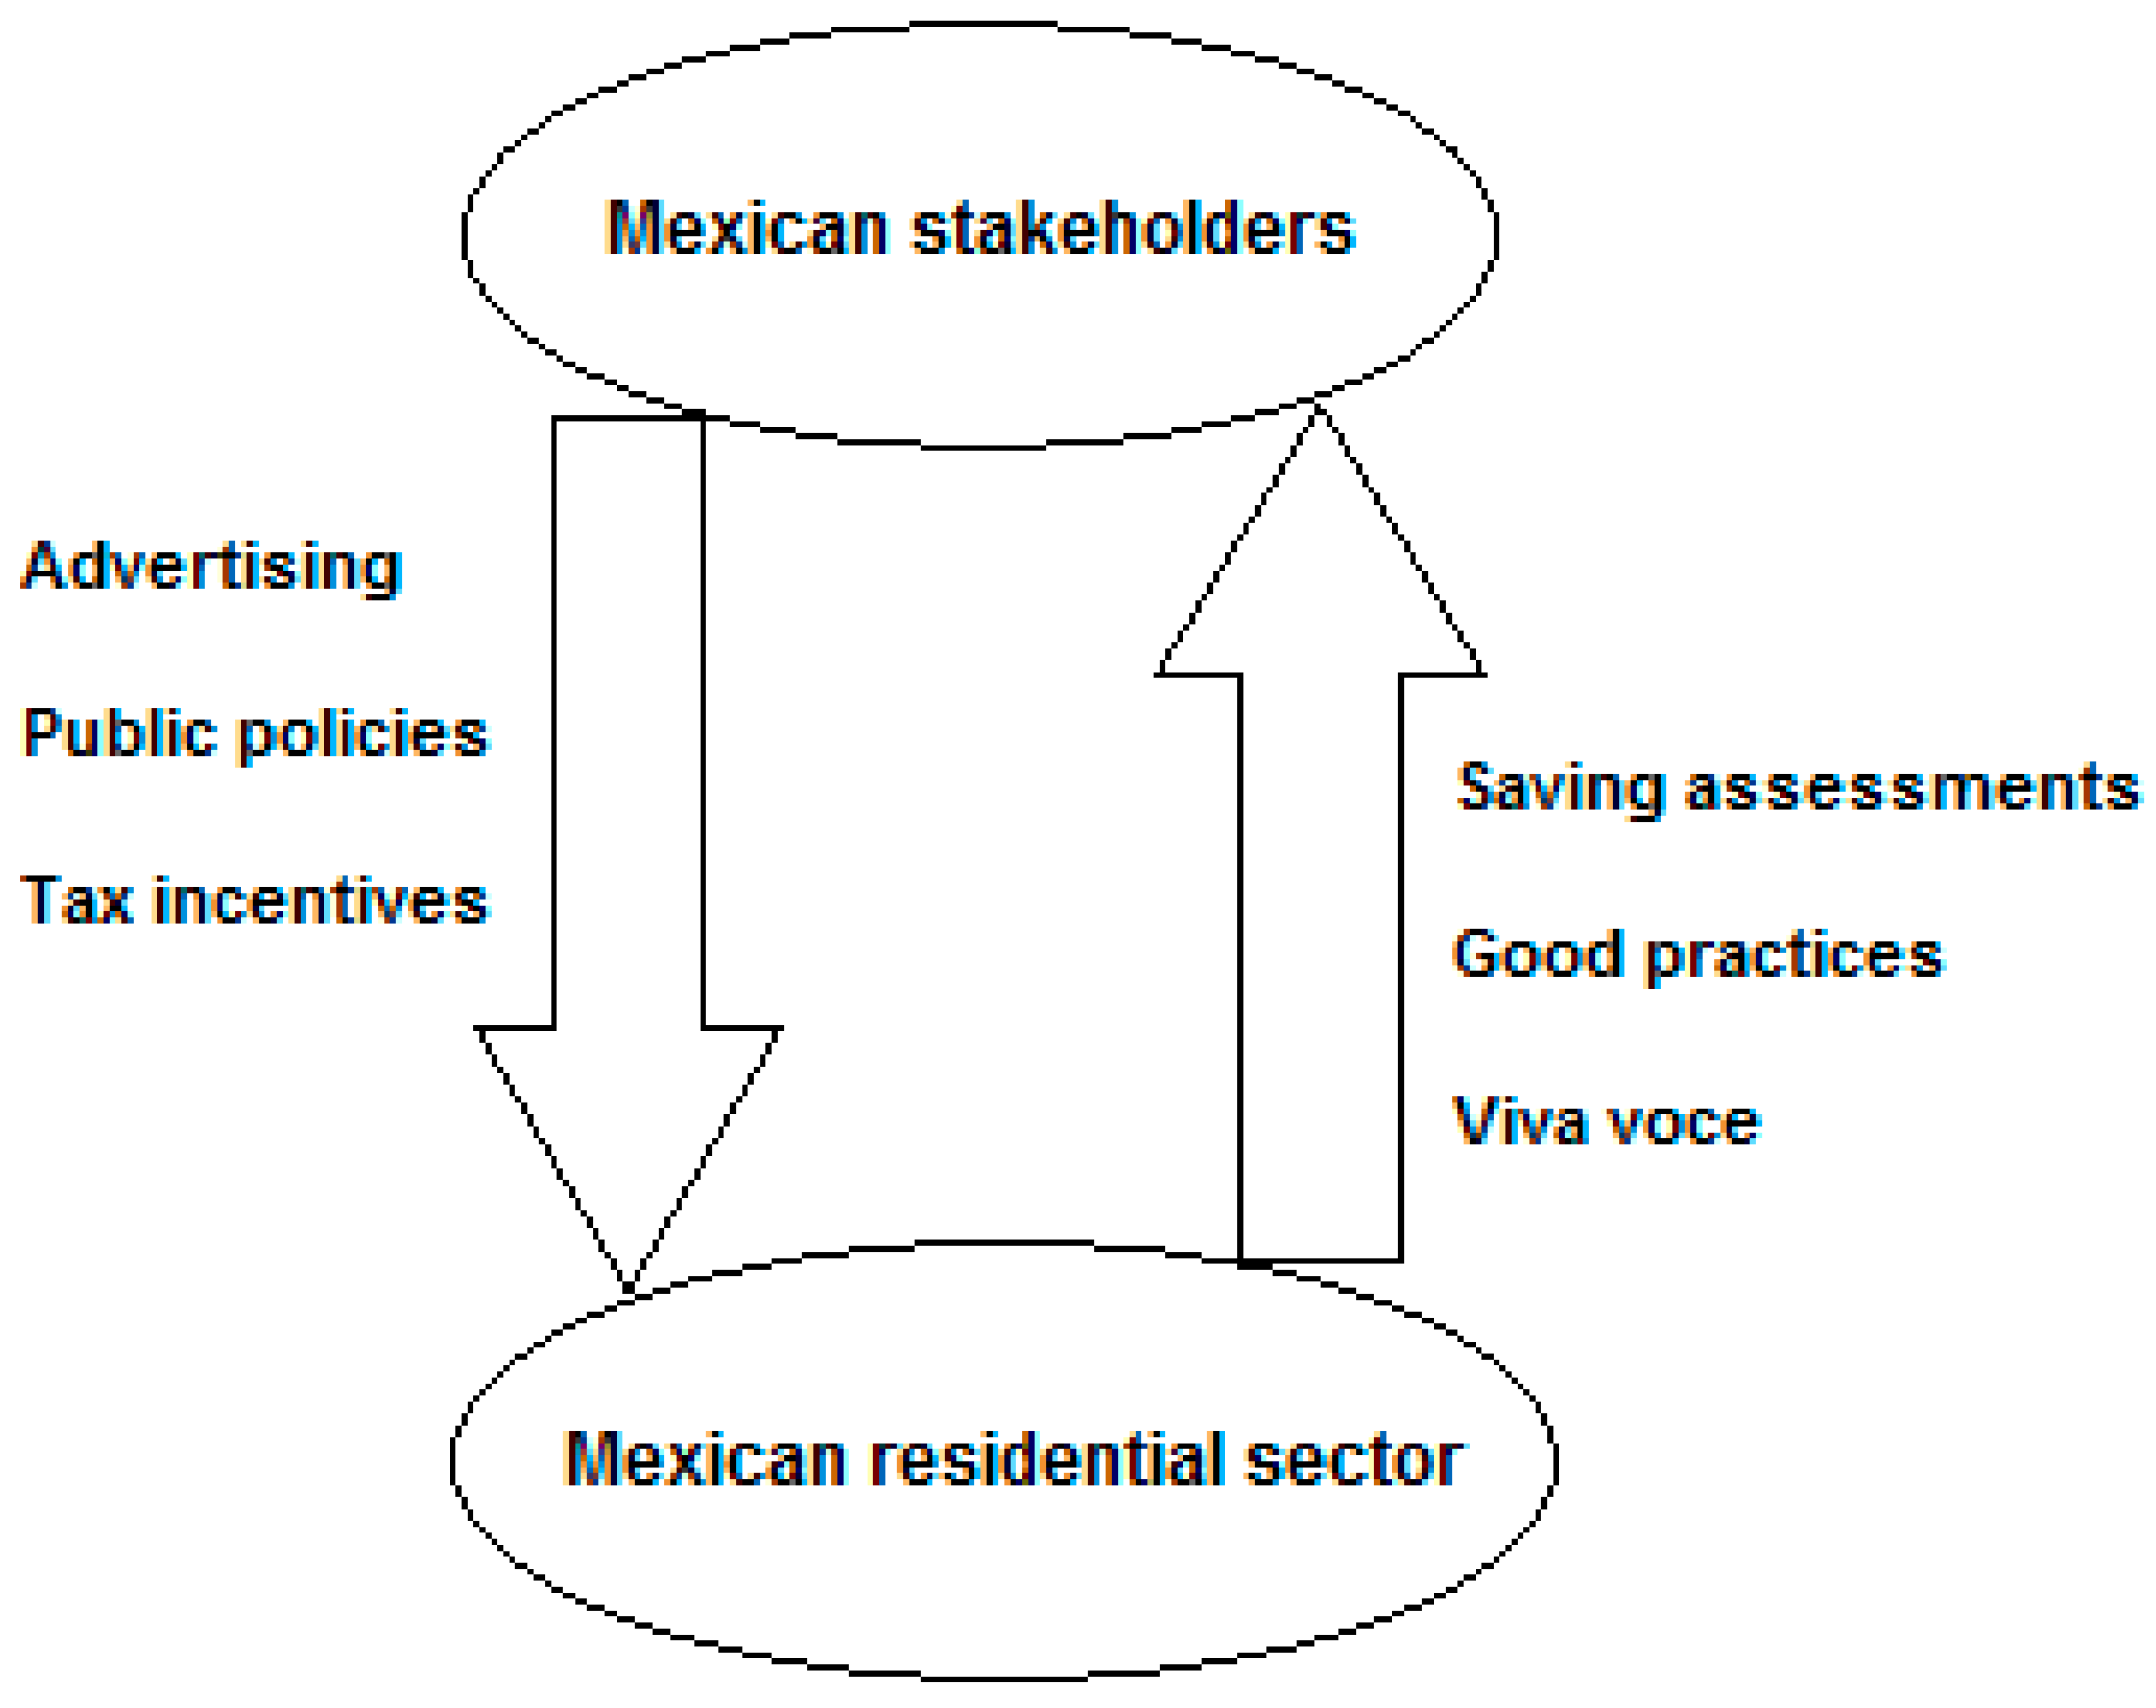
In order to accomplish this, a bidirectional top-down and bottom-up strategy is suggested. The top sector is considered as the Mexican stakeholders namely the Mexican National Government, medium & large energy producers and consumer companies, academic & research institutes, and Non-Governmental Organizations (NGOs); whereas the bottom sector is considered to be the Mexican residential sector, namely occupants of the Mexican dwellings and local governments. Figure 9 shows a summary of the strategy.
The top-down direction is reflected in three main strategies: National advertising oriented towards the residential occupants to encourage the application of the two main energy saving approaches; policies that enforce to local governments to purchase low-consumption devices, especially in efficient streetlights (although there would not be a precise calculation of the savings from this approach due to the ambiguity of their consumption in the residential sector) and tax incentives, especially towards the dwellings’ users, in order to convince them to buy efficient devices, mainly.
As a result of the bottom-up strategy, it is expected to spread the good practices of saving energy within the Mexican dwellings by word of mouth based upon real assessments of the energy savings claiming therefore realistic benefits, economic for the users and environmental for the country, especially. Table 9 shows the main actions for the national strategy.
As can be seen in Table 7, the main role of energy saving for the Mexican residential sector relies on the residential occupants and the local governments, who have to apply the proposed approaches at the final stage. Nonetheless, they must aware that the probabilities of saving energy and thus of saving money are very high.
4. Conclusions
The energy use (electrical and thermal) within the Mexican residential sector in 2015 is analyzed here. For electrical energy only, three activities are considered by the CONUEE in Mexico: Air-conditioning, illumination & appliances, and refrigeration. To achieve this, a model that calculates the energy use of the residential sector is developed, taking account of random values of the power of the devices, the time of use and the percentage of penetration of the energy saving approaches (use of efficient appliances and reduce of the time of usage). Thereby, it is found that the highest energy saving is given by the correct use of illumination & appliances, followed by refrigeration and finally air-conditioning.
With an approach that embraces the use of efficient devices and the reduction of the time of use for the three activities, a maximum energy saving of almost 20 TWh is estimated, which is 36% of the total electricity use of the Mexican residential sector in 2015.
If the two energy saving approaches are separately applied for the three energy activities, it is found that, for both cases, air-conditioning and refrigeration have a more consistent range of savings, even the savings are lower than for illumination & appliances. If both approaches are applied in illumination & appliances, although the savings could be higher, it is very likely to achieve lower savings than those in air-conditioning and refrigeration.
Nevertheless, it is important to mention that these estimations were carried out taking into account the current governmental programs and their calculated level of penetration amongst the users. If there is more diffusion of these programs or there are more similar programs the results might be better and higher.
Hence, it is established that this paper could be a guideline for the governmental sector, stakeholders and decision makers in order to drive proper programs that encourage the efficiency use of the energy onto the Mexican residential sector, especially regarding the correct behavior of the building occupants. The approach proposed in the paper is a combined top-down and bottom-up strategy with the Mexican stakeholders at the top and the Mexican residential occupants at the bottom. This is always considering that the achieved energy savings could be reflected in financial savings towards both the government and the household’s occupants.
Author Contributions
I.O.-P. developed the stochastic modelling and carried out the sensitivity analysis of the energy use. A.H.P.-R. proposed the national-wide program to be applied with the stochastic modelling.
Funding
This research received not external funding.
Conflicts of Interest
The authors declare no conflict of interest.
Nomenclature
| PowerAC | Power of the air-conditioning device (Watt) |
| PowerI&A | Power of the illumination devices and appliances (Watt) |
| PowerR | Power of the refrigeration device (Watt) |
| TAEC | Total annual electricity use of Mexico (TWh) |
| TimeAC | Time of use of the air-conditioning device (hour) |
| TimeI&A | Time of use of the illumination devices and appliances (hour) |
| TimeR | Time of use of the refrigeration device (hour) |
References
- Durand-Lasserve, O.; Pierru, A.; Smeers, Y. Uncertain long-run emission targets, CO2 price and global energy transition: A general equilibrium approach. Energy Policy 2010, 38, 5108–5122. [Google Scholar] [CrossRef]
- Bridge, G.; Bouzarovski, S.; Bradshaw, M.; Eyre, N. Geographies of energy transition: Space, place, and the low-carbon economy. Energy Policy 2013, 53, 331–340. [Google Scholar] [CrossRef] [Green Version]
- IPCC Working Group III. Special Report of Emission Scenarios. 2000. Available online: http://www.ipcc.ch/publications_and_data/ar4/wg3/en/contents.html (accessed on 12 June 2017).
- United Nations. Framework Convention on Climate Change. 2017. Available online: http://unfccc.int/2860.php (accessed on 12 June 2017).
- Martani, C.; Lee, D.; Robinson, P.; Britter, R.; Ratti, C. ENERNET: Studying the dynamic relationship between building occupancy and energy consumption. Energy Build. 2012, 47, 584–591. [Google Scholar] [CrossRef]
- Goyal, S.; Ingley, H.A.; Barooah, P. Occupancy-based zone-climate control for energy-efficient buildings: Complexity vs performance. Appl. Energy 2013, 106, 209–221. [Google Scholar] [CrossRef]
- Jia, M.; Snirivasan, R.S.; Raheem, A.A. From occupancy to occupant behavior: An analytical survey of data acquisition technologies, modeling methodologies and simulation coupling mechanisms for building energy efficiency. Renew. Sustain. Energy Rev. 2017, 68, 525–540. [Google Scholar] [CrossRef]
- Ioannou, A.; Itard, L.C.M. Energy performance and comfort in residential buildings: Sensitivity for building parameters and occupancy. Energy Build. 2015, 92, 216–233. [Google Scholar] [CrossRef]
- Roetzel, A.; Tsangrassoulis, A.; Dietrich, U. Impact of building design and occupancy on office comfort and energy performance in different climates. Energy Environ. 2014, 71, 165–175. [Google Scholar] [CrossRef]
- Sun, K.; Yan, D.; Hong, T.; Guo, S. Stochastic modeling of overtime occupancy and its application in building energy simulation and calibration. Energy Environ. 2014, 79, 1–12. [Google Scholar] [CrossRef] [Green Version]
- Fabi, V.; Andersen, R.K.; Corgnati, S. Verification of stochastic behavioural models of occupants’ interactions with windows in residential buildings. Energy Environ. 2015, 94, 371–383. [Google Scholar] [CrossRef]
- Jones, R.V.; Fuertes, A.; Gregori, E.; Giretti, A. Stochastic behavioural models of occupants’ main bedroom for UK residential buildings. Energy Environ. 2017, 118, 144–158. [Google Scholar]
- Jang, H.; Kang, J. A stochastic model of integrating occupant behavior into energy simulation with respect to actual energy consumption in high-rise apartment buildings. Energy Build. 2016, 121, 205–216. [Google Scholar] [CrossRef]
- Carlucci, S.; Lobaccaro, G.; Li, Y.; Lucchino, E.C.; Ramaci, R. The effect of spatial and temporal randomness of stochastically generated occupancy schedules on the energy performance of a multiresidential building. Energy Build. 2016, 127, 279–300. [Google Scholar] [CrossRef]
- Diao, L.; Sun, Y.; Che, Z.; Chen, J. Modeling energy consumption in residential buildings: A bottom-up analysis based on occupant behavior pattern clustering and stochastic simulation. Energy Build. 2017, 147, 47–66. [Google Scholar] [CrossRef]
- Wilke, U.; Haldi, F.; Scartezzini, J.L.; Robinson, R. A bottom-up stochastic model to predict occupants’ time-dependent activities. Build. Environ. 2013, 60, 254–264. [Google Scholar] [CrossRef]
- Aerts, D.; Minnen, J.; Glorieux, I.; Wouters, I.; Descamps, F. A method for the identification and modelling of realistic domestic occupancy sequences for building energy demand simulations and peer comparison. Build. Environ. 2014, 75, 67–78. [Google Scholar] [CrossRef]
- Virote, J.; Neves-Silva, R. Stochastic models for building energy prediction based on occupant behavior assessment. Energy Build. 2012, 53, 183–193. [Google Scholar] [CrossRef]
- Chen, Z.; Xu, J.; Soh, Y.C. Modeling regular occupancy in commercial buildings using stochastic models. Energy Build. 2015, 103, 216–223. [Google Scholar] [CrossRef]
- Hong, T.; Koo, C.; Kim, D.; Lee, M.; Kim, J. An estimation methodology for the dynamic operational rating of a new residential building using the advanced case-based reasoning and stochastic approaches. Appl. Energy 2015, 150, 308–322. [Google Scholar] [CrossRef]
- Sulaiman, H.; Olsina, F. Comfort reliability evaluation of building designs by stochastic hygrothermal simulation. Renew. Sustain. Energy Rev. 2014, 40, 171–184. [Google Scholar] [CrossRef]
- Ottesen, S.O.; Tomasgard, A. A stochastic model for scheduling energy flexibility in buildings. Energy 2015, 88, 364–376. [Google Scholar] [CrossRef]
- Zhao, J.; Plagge, R.; Ramos, N.M.M.; Lurdes Simoes, M.; Grunewald, J. Concept for a development of stochastic databases for building performance simulation—A material database pilot project. Energy Environ. 2015, 84, 189–203. [Google Scholar] [CrossRef]
- Buck, J.; Young, D. The potential for energy efficiency gains in the Canadian commercial building sector: A stochastic frontier study. Energy 2007, 32, 1769–1780. [Google Scholar] [CrossRef]
- Yu, F.W.; Chan, K.T.; Yang, J.; Sit, R.K.Y. Comparative study on the energy performance of chiller system in an institutional building with stochastic frontier analysis. Energy Build. 2015, 89, 206–212. [Google Scholar] [CrossRef]
- Ortiz, J.; Guarino, F.; Salom, J.; Corchero, C.; Cellura, M. Stochastic model for electrical loads in Mediterranean residential buildings: Validation and applications. Energy Build. 2014, 80, 23–36. [Google Scholar] [CrossRef] [Green Version]
- Zhou, X.; Yan, D.; Hong, T.; Ren, X. Data analysis and stochastic modeling of lighting energy use in large office buildings in China. Energy Build. 2015, 86, 275–287. [Google Scholar] [CrossRef] [Green Version]
- Karan, E.; Asadi, S.; Ntaimo, L. A stochastic optimization approach to reduce greenhouse gas emissions from buildings and transportation. Energy 2016, 106, 367–377. [Google Scholar] [CrossRef]
- Tavakoli, E.; Montazerin, N. Stochastic analysis of natural gas consumption in residential and commercial buildings. Energy Build. 2011, 43, 2289–2297. [Google Scholar] [CrossRef]
- Brohus, H.; Frier, C.; Heiselberg, P.; Haghighat, F. Quantification of uncertainty in predicting building energy consumption: A stochastic approach. Energy Build. 2012, 55, 127–140. [Google Scholar] [CrossRef] [Green Version]
- Balance Nacional de Energía 2015. Secretaria de Energía. 2016. Retrieved March 2018. Available online: https://www.gob.mx/cms/uploads/attachment/file/248570/Balance_Nacional_de_Energ_a_2015__2_pdf (accessed on 12 August 2018).
- Comision Nacional de Vivienda. Secretaria de Desarrollo Agrario, Territorial y Urbano. 2018. Retrieved March 2018. Available online: http://sniiv.conavi.gob.mx/Reports/INEGI/ParqHab.aspx (accessed on 12 August 2018).
- Comisión Nacional para el Uso Eficiente de la Energía. Secretaria de Energía. 2018. Retrieved March 2018. Available online: https://www.gob.mx/cms/uploads/attachment/file/98316/CuadernosConueeNo1.pdf (accessed on 12 August 2018).
- Oropeza-Perez, I. Comparative economic assessment of the energy performance of air-conditioning within the Mexican residential sector. Energy Rep. 2016, 2, 147–154. [Google Scholar] [CrossRef]
- Rosas-Flores, J.A.; Rosas-Flores, D.; Gálvez, D.M. Saturation, energy consumption, CO2 emission and energy efficiency from urban and rural households appliances in Mexico. Energy Build. 2011, 43, 10–18. [Google Scholar] [CrossRef]
- Arroyo-Cabanas, F.G.; Aguillón-Martínez, J.E.; Ambríz-García, J.J.; Canizal, G. Electric energy saving potential by substitution of domestic refrigerators in Mexico. Energy Policy 2009, 37, 4737–4742. [Google Scholar] [CrossRef]
- Pérez-Denicia, E.; Fernández-Luqueño, F.; Vilariño-Ayala, D.; Manuel Montaño-Zetina, L.; Alfonso Maldonado-López, L. Renewable energy sources for electricity generation in Mexico: A review. Renew. Sustain. Energy Rev. 2017, 78, 597–613. [Google Scholar] [CrossRef]
- MathWorks. MatLab Software, 1994–2018; The Mathworks, Inc.: Natick, MA, USA, 2017. [Google Scholar]
- Tahmasebi, F.; Mahdavi, A. On the utility of occupants’ behavioural diversity information for building performance simulation: An exploratory case study. Energy Build. 2018, 176, 380–389. [Google Scholar] [CrossRef]
- Daft Logic. 2018. Retrieved October 2018. Available online: https://www.daftlogic.com/information-appliance-power-consumption.htm (accessed on 24 October 2018).
- Comision Nacional para el Uso Eficiente de la Energía. Secretaria de Energía. 2018. Retrieved March 2018. Available online: https://www.gob.mx/conuee (accessed on 24 October 2018).
- Comision Federal de Electricidad. 2018. Retrieved March 2018. Available online: https://www.cfe.gob.mx (accessed on 23 March 2018).
- Oropeza-Perez, I. Energy saving potential of utilizing natural ventilation under warm conditions—A case study of Mexico. Appl. Energy 2014, 130, 20–32. [Google Scholar] [CrossRef]
- Centro Nacional de Metrologia. Retrieved March 2018. Available online: http://www.cenam.mx/hora_oficial/ (accessed on 23 March 2018).
- Vijay, S.; Molina, L.T.; Molina, M. Estimating Air Pollution Emission from Fossil Fuels Use in the Electricity Sector in Mexico; CEC Publishing: Anjou, QC, Canada, 2004. [Google Scholar]
- Garrido-Soriano, N.; Rosas-Casals, M.; Ivancic, A.; Alvarez-del Castillo, M.D. Potential energy saving and economic impact of residential buildings under national and regional efficiency scenarios. A Catalan case study. Energy Build. 2012, 49, 119–125. [Google Scholar] [CrossRef] [Green Version]
- Thomas, S.; Boonekamp, P.; Vreuls, H.; Broc, J.S.; Booseboeuf, D.; Lapillonne, B.; Labanca, N. How to measure the overall energy savings linked to policies and energy services at the national level? Energy Effic. 2012, 5, 19–35. [Google Scholar] [CrossRef]
- Ma, M.; Yan, R.; Du, Y.; Ma, X.; Cai, W.; Xu, P. A methodology to assess China’s building energy savings at the national level: An IPAT-LMDI model approach. J. Clean. Prod. 2017, 143, 784–793. [Google Scholar] [CrossRef]
- Filushina, K.E.; Minaev, N.N.; Gusakova, N.V.; Dobrynina, O.I.; Zharova, E.A.; Merkuleva, Y.A.; Runkova, A.S. Regional programs of energy saving and energy efficiency: The national construction sector. Int. J. Econ. Financ. Issues 2016, 6, 85–90. [Google Scholar]
- Lucas, R.; Farley, P.; Garcia, R.; Lubliner, M. National energy savings potential in HUD-code housing from thermal envelope and HVAC equipment improvements. ASHRAE Trans. 2007, 113, 62–69. [Google Scholar]
- Secretaría de Energía. Sustitución de Equipos Electrodomésticos para el Ahorro de Energía. 2008. Retrieved September 2018. Available online: http://calderon.presidencia.gob.mx/2008/07/sustitucion-de-equipos-electrodomesticos-para-el-ahorro-de-energia/ (accessed on 1 September 2018).
- Secretaría de Energía. Sustitución de Focos Incandescentes por Lámparas Ahorradoras. 2014. Retrieved September 2018. Available online: https://www.gob.mx/sener/en/galerias/programa-de-sustitucion-de-focos-incandescentes (accessed on 1 September 2018).
Figure 1.
Main climatic regions in Mexico.

Figure 2.
Monthly average temperature (Temp) and relative humidity (RH) for the four main climates in Mexico.
Figure 2.
Monthly average temperature (Temp) and relative humidity (RH) for the four main climates in Mexico.

Figure 3.
Energy use onto the Mexican residential sector in 2015.

Figure 4.
Program code for calculating the annual electricity consumption of the Mexican residential sector.
Figure 4.
Program code for calculating the annual electricity consumption of the Mexican residential sector.

Figure 5.
Estimated energy use by using efficient devices upon the Mexican residential sector.

Figure 6.
Estimated energy use by decreasing the time of use of devices upon the Mexican residential sector.
Figure 6.
Estimated energy use by decreasing the time of use of devices upon the Mexican residential sector.

Figure 7.
Estimated energy use by using efficient devices and decreasing their time of use upon the Mexican residential sector.
Figure 7.
Estimated energy use by using efficient devices and decreasing their time of use upon the Mexican residential sector.

Figure 8.
Estimated energy use by using an integrated approach of energy saving upon the Mexican residential sector.
Figure 8.
Estimated energy use by using an integrated approach of energy saving upon the Mexican residential sector.

Figure 9.
Top-down and bottom-up strategy to increase the upper limits of penetration of the proposed approaches of energy saving.
Figure 9.
Top-down and bottom-up strategy to increase the upper limits of penetration of the proposed approaches of energy saving.


Table 1.
Number of air-conditioned dwellings gathered by climatic region.
| Climatic Region | Distribution of Population |
|---|---|
| Arid | 21.9% |
| Dry Tropics | 12.0% |
| Temperate | 53.7% |
| Humid Tropics | 12.4% |
| Total | 100.0% |
Table 2.
Share of the different energy use in air-conditioned and not air-conditioned dwellings in Mexico [33].
Table 2.
Share of the different energy use in air-conditioned and not air-conditioned dwellings in Mexico [33].
| Activity | Share of Total (%) | |
|---|---|---|
| Air-conditioned | Air-conditioning (electrical) | 44 |
| Illumination & appliances (electrical) | 33 | |
| Refrigeration (electrical) | 9 | |
| Stove, water & space heating (thermal) | 14 | |
| Not air-conditioned | Illumination & appliances (electrical) | 59 |
| Refrigeration (electrical) | 16 | |
| Stove & water heating (thermal) | 25 |
Table 3.
Energy use of different activities in air-conditioned and not air-conditioned dwellings in Mexico.
Table 3.
Energy use of different activities in air-conditioned and not air-conditioned dwellings in Mexico.
| Activity | Annual Use (MWh) | Daily Use (kWh) | |
|---|---|---|---|
| Air-conditioned | Air-conditioning (electrical) | 1.72 | 4.73 |
| Illumination & appliances (electrical) | 1.29 | 3.53 | |
| Refrigeration (electrical) | 0.35 | 0.96 | |
| Stove, water & space heating (thermal) | 0.55 | 1.51 | |
| Total | 3.91 | 10.73 | |
| Not air-conditioned | Illumination & appliances (electrical) | 1.00 | 2.75 |
| Refrigeration (electrical) | 0.27 | 0.74 | |
| Stove, water & space heating (thermal) | 0.43 | 1.18 | |
| Total | 1.70 | 4.67 |
Table 4.
Averaged power and time of use of different activities in air-conditioned and not air-conditioned dwellings in Mexico [35,36].
| Activity | Power (Watts) | Time of Use (Hours/Year) | |
|---|---|---|---|
| Air-conditioned | Air-conditioning | 1000 | 1500 |
| Illumination & appliances | 585 | 2200 | |
| Refrigeration | 190 | 1850 | |
| Stove, water & space heating | 1440 | 380 | |
| Not air-conditioned | Illumination & appliances | 455 | 2200 |
| Refrigeration | 190 | 1400 | |
| Stove, water & space heating | 1150 | 380 |
Table 5.
Annual national use of the Mexican residential sector in 2015. a Study presented in this paper. b Calculation from refs. [35,36].
| Activity | Annual Use (TWh) a | Annual Use (TWh) b | |
|---|---|---|---|
| Air-conditioned | Air-conditioning | 11.92 | 10.39 |
| Illumination & appliances | 8.94 | 8.92 | |
| Refrigeration | 2.43 | 2.43 | |
| Stove, water & space heating | 3.81 | 3.79 | |
| Not air-conditioned | Illumination & appliances | 24.44 | 24.46 |
| Refrigeration | 6.59 | 6.50 | |
| Stove, water & space heating | 10.51 | 10.68 | |
| Total electrical | 54.32 | 52.70 |
Table 6.
Lower and upper limits of power and time of use of the energy activities of the Mexican residential sector [35,36].
| Activity | Lower Threshold | Upper Threshold |
|---|---|---|
| Power air-conditioning | 300 W | 1000 W |
| Power illumination & appliances (aggregated) | 200 W | 585 W |
| Power refrigeration | 100 W | 190 W |
| Time air-conditioning | 1000 h/year | 1500 h/year |
| Time illumination & appliances | 1200 h/year | 2200 h/year |
| Time refrigeration | 1000 h/year | 1850 h/year |
Table 7.
Minimum and maximum level of penetration of use of efficient appliances and/or decrease of their time of use for the Mexican residential sector.
Table 7.
Minimum and maximum level of penetration of use of efficient appliances and/or decrease of their time of use for the Mexican residential sector.
| Activity | Lower Threshold | Upper Threshold |
|---|---|---|
| Air-conditioning | 5% | 30% |
| Illumination & appliances | 20% | 70% |
| Refrigeration | 8% | 50% |
Table 8.
Comparison of different energy savings at large scale for different regions.
| National Program [46,47,48,49,50] | Maximum % of Energy Saving |
|---|---|
| Mexico (presented here) | 36.0 |
| Cataluña | 35.5 |
| European Union | 9.0 |
| China | 7.7 |
| Russia | 12.3 |
| United States | 28.9 |
Table 9.
Main actions for the top-down and bottom-up national strategy for energy saving onto the Mexican residential sector.
Table 9.
Main actions for the top-down and bottom-up national strategy for energy saving onto the Mexican residential sector.
| Direction | Action | Approach | Towards |
|---|---|---|---|
| Top-down | |||
| Advertising | Internet, TV & radio advertising | Purchase efficient devices & reduce time of use | Residential users |
| Public policies | Enforcement of laws & policies | Purchase efficient devices | Local governments |
| Tax incentives | Tax reduction by saving energy | Purchase efficient devices | Residential users & local governments |
| Bottom-up | |||
| Saving assessments | Money saving | Purchase efficient devices & reduce time of use | Residential users |
| Good practices | Rewards & recognitions | Purchase efficient devices | Local governments |
| Viva voce | Spread of benefits | Purchase efficient devices & reduce time of use | Residential users |
© 2018 by the authors. Licensee MDPI, Basel, Switzerland. This article is an open access article distributed under the terms and conditions of the Creative Commons Attribution (CC BY) license (http://creativecommons.org/licenses/by/4.0/).
Share and Cite
MDPI and ACS Style
Oropeza-Perez, I.; Petzold-Rodriguez, A.H. Analysis of the Energy Use in the Mexican Residential Sector by Using Two Approaches Regarding the Behavior of the Occupants. Appl. Sci. 2018, 8, 2136. https://doi.org/10.3390/app8112136
AMA Style
Oropeza-Perez I, Petzold-Rodriguez AH. Analysis of the Energy Use in the Mexican Residential Sector by Using Two Approaches Regarding the Behavior of the Occupants. Applied Sciences. 2018; 8(11):2136. https://doi.org/10.3390/app8112136
Chicago/Turabian StyleOropeza-Perez, Ivan, and Astrid H. Petzold-Rodriguez. 2018. "Analysis of the Energy Use in the Mexican Residential Sector by Using Two Approaches Regarding the Behavior of the Occupants" Applied Sciences 8, no. 11: 2136. https://doi.org/10.3390/app8112136
Note that from the first issue of 2016, this journal uses article numbers instead of page numbers. See further details here.