Fault Localization by Comparing Memory Updates between Unit and Integration Testing of Automotive Software in an Hardware-in-the-Loop Environment


Department of Electrical and Computer Engineering, Ajou University, Suwon 16499, Korea
*
Author to whom correspondence should be addressed.
Appl. Sci. 2018, 8(11), 2260; https://doi.org/10.3390/app8112260
Submission received: 21 September 2018
/
Revised: 10 November 2018
/
Accepted: 13 November 2018
/
Published: 15 November 2018
(This article belongs to the Special Issue Fault Detection and Diagnosis in Mechatronics Systems)
Abstract
:During the inspection stage, an integration test is performed on electronic automobile parts that have passed a unit test. The faults found during this test are reported to the developer, who subsequently modifies the source code. If the tester provides the developer with memory usage information (such as functional symbol or interface signal), which works differently from normal operation in failed Hardware-in-the-Loop (HiL) testing (even when the tester has no source code), that information will be useful for debugging. In this paper, we propose a fault localization method for automotive software in an HiL environment by comparing the analysis results of updated memory between units and integration tests. Analyzing the memory usage of a normally operates unit test, makes it possible to obtain memory-updated information necessary for the operation of that particular function. By comparing this information to the memory usage when a fault occurs during an integration test, erroneously operated symbols and stored values are presented as potential root causes of the fault. We applied the proposed method to HiL testing for an OSEK/VDX-based electronic control unit (ECU). As a result of testing using fault injection, we confirmed that the fault causes can be found by checking the localized memory symbols with an average of 5.77%. In addition, when applying this methodology to a failure that occurred during a body control module (BCM) (which provides seat belt warnings) test, we could identify a suspicious symbol and find the cause of the test failure with only 8.54% of localized memory symbols.
1. Introduction
As the number of electronic control units (ECU) in automobiles increases, so does the functional complexity of automotive software. Therefore, the possibility of systemic ECU problems also increases [1]. Thus, testing has become a key process in the development of vehicle ECUs. The automobile industry develops and manufactures the electronics and their software via original equipment manufacturers (OEMs). Accordingly, a tester for the automobile company conducts an acceptance or integration test on the ECU and automotive software (ECU/SW) developed by a separate manufacturing company [2].
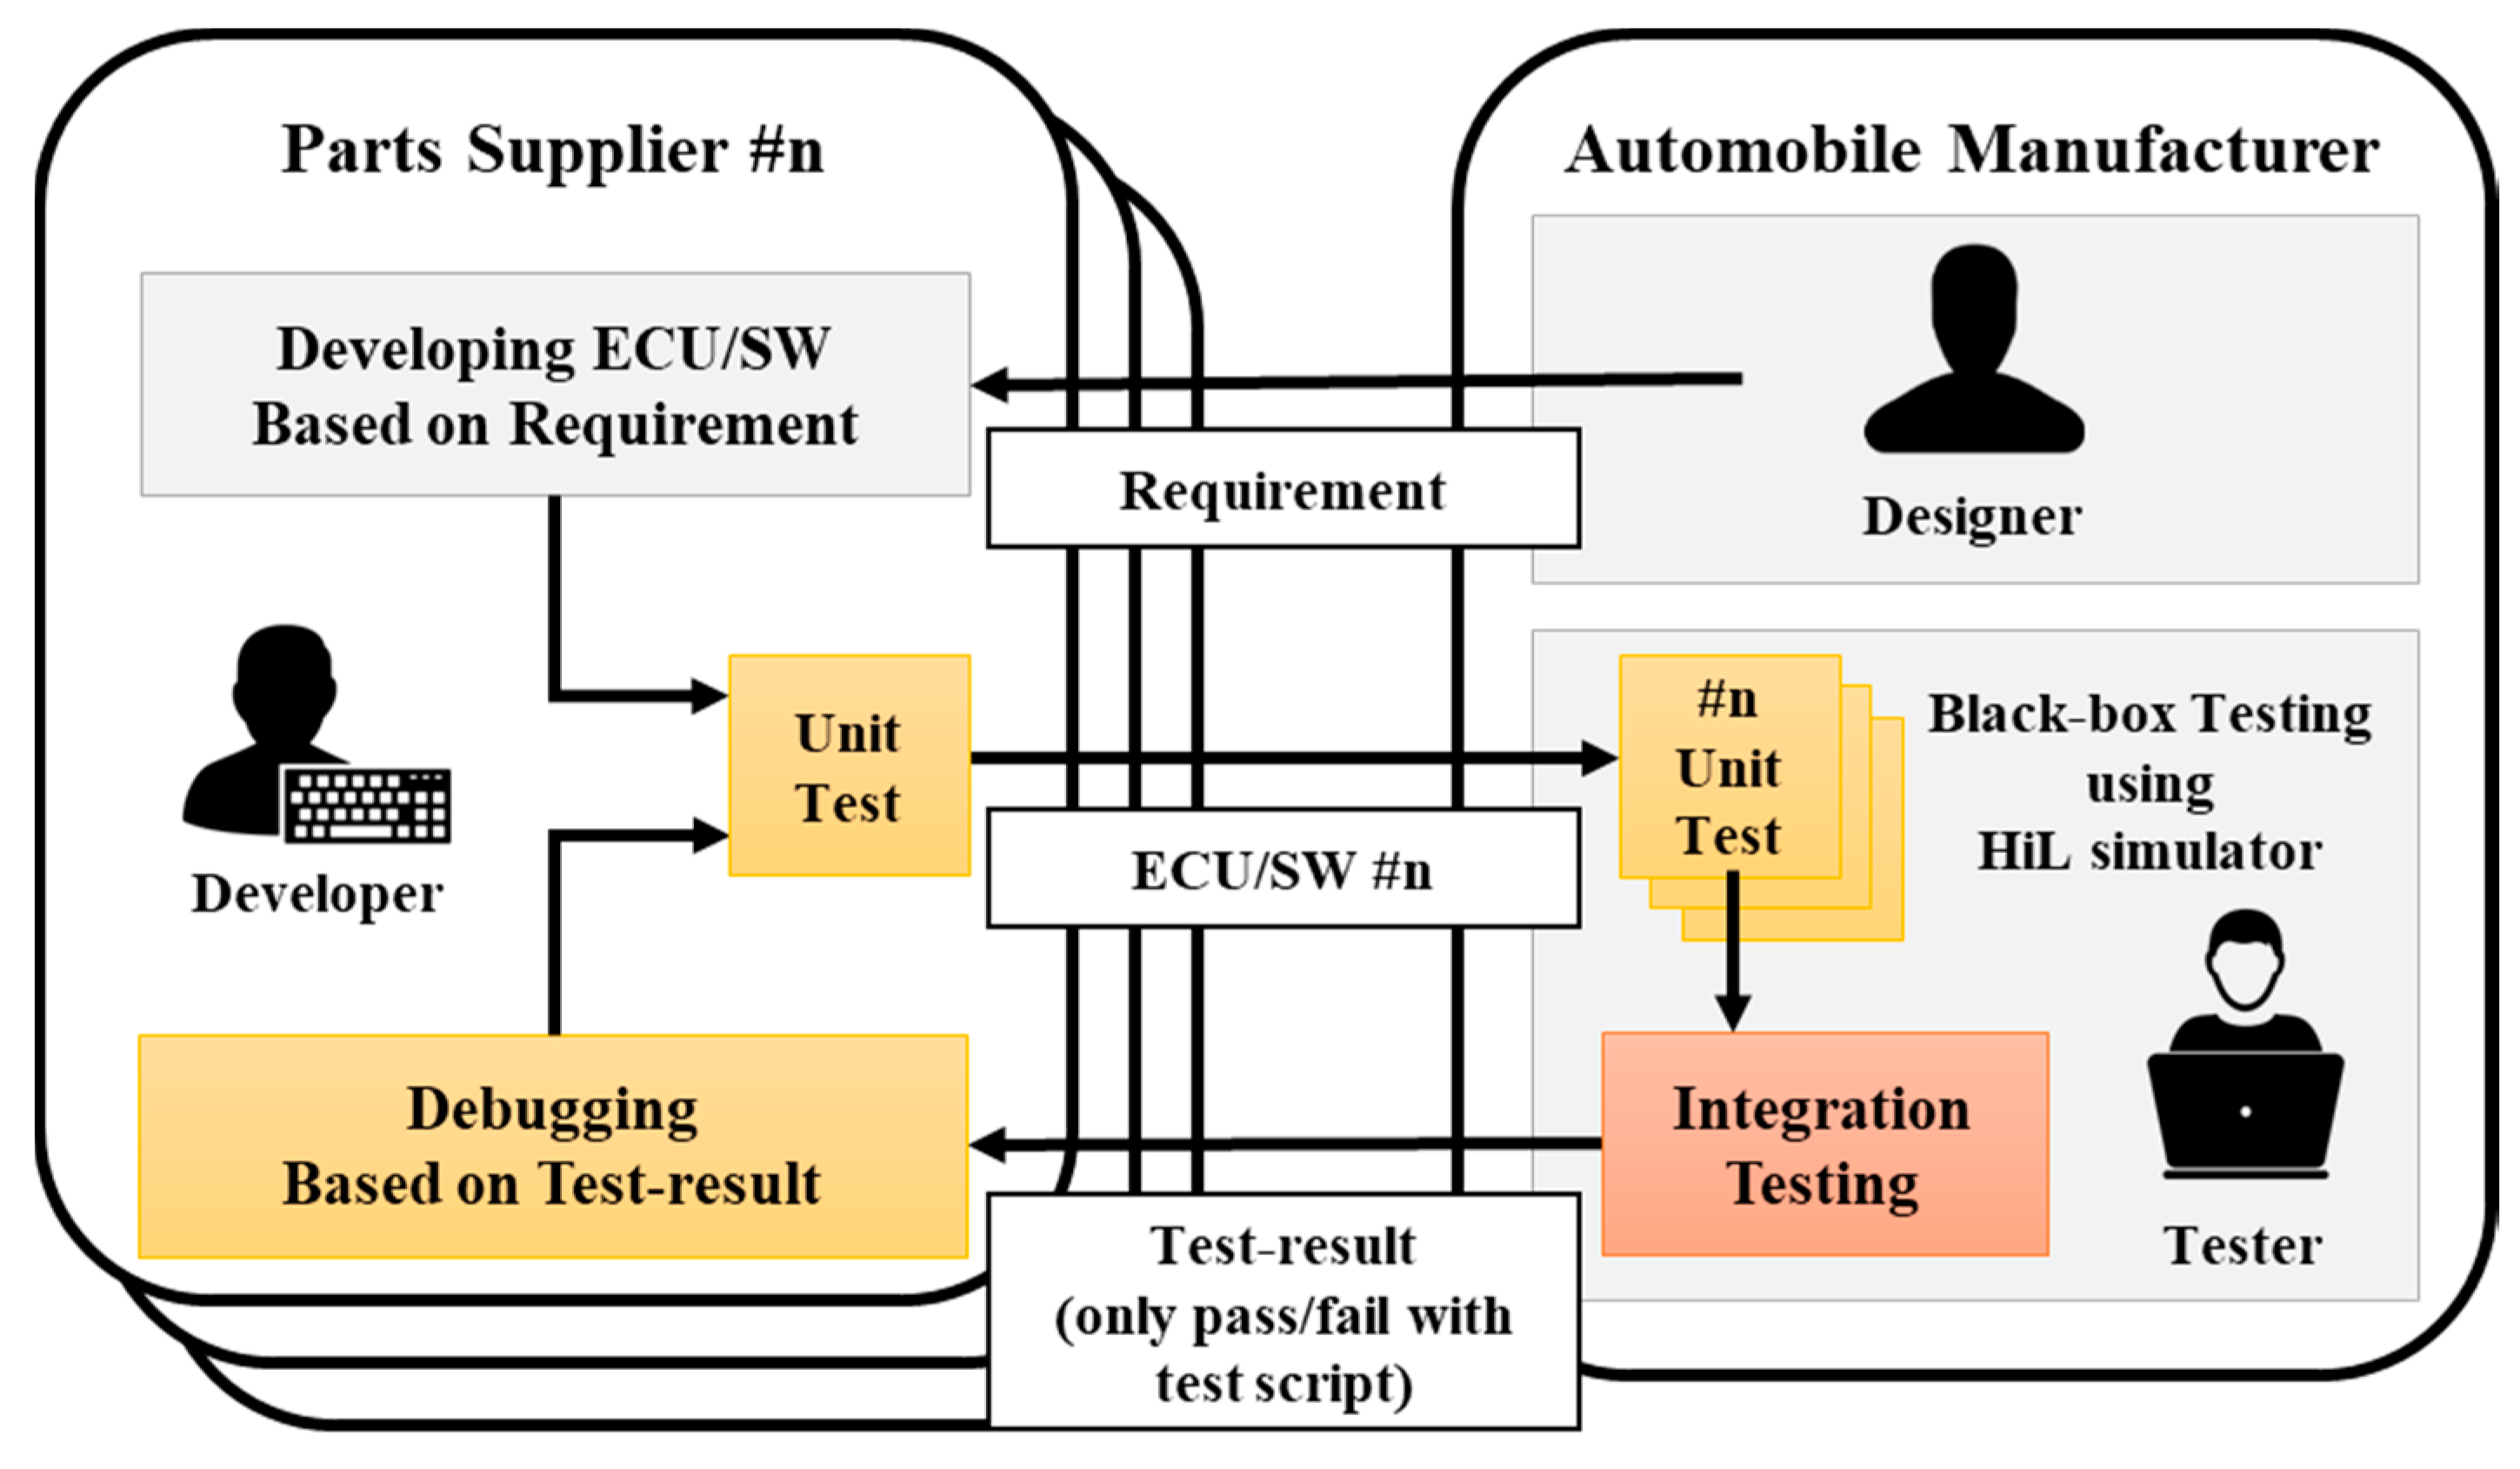
Figure 1 shows the process of electronic component development and testing utilized by the automotive industry and OEMs. The developer receives the requirement from the designer and develops the ECU/SW. The tester receives the developed ECU/SW and uses the Hardware-in-the-Loop (HiL) simulator to test unit or integrated functions without source code. The faults detected during the test are then reported to the developers for modification [3]. At this time, the test results that the tester reports include only the test script and the corresponding pass/fail information (i.e., the expected value for a test condition and the actual output value of the ECU/SW). Therefore, the developers need to rebuild the same testing scenario to correct the reported failure. If the tester can provide debugging information on the internal operations when a failure occurs, the developer can easily resolve the cause of the failure [4].
When developing embedded systems such as ECUs, developers can use existing debugging tools to obtain internal operating information on particular software failures. However, those tools are not available for the HiL testing of ECU/SWs for vehicles that the tester conducts for the following reasons. First, an in-circuit emulator (ICE, for example, Trace32, Multi-ICE), which is generally used as a debugging tool in an embedded system, requires a dedicated connector as a debugging interface. In the case of a completed ECU, the debugging interface is rarely exposed to the exterior of the component. If the debugging interface is not taken into consideration from the design stage of the ECU, the debugging tool cannot be used to check internal operation during an ECU/SW HiL test [5]. Second, even if the ECU is modified to connect the debugging interface, internal operation monitoring using debugging tools is unsuitable for the HiL test environment. The HiL test is based on a test scenario of the test script and the host PC, the HiL simulator and the ECU/SW are organically executed. In order to apply the method of step by step observation of the software using the break point with the existing debugger, the entire HiL test environment should be suspended. Accordingly, it is impractical to use the debugging tool to pause and observe a suspected buggy spot on a running system [6].
There are studies that use software fault localization methods to acquire information needed for debugging without directly using a debugging tool. The conventional method of software fault localization has evolved to find faults efficiently based on source code [7]. However, the tester tests the ECU/SW in a black box without source code. As a result, it is difficult to apply the conventional source-code-based method of to HiL testing. Therefore, in order to understand the internal operation when a fault occurs during the HiL test, a method that does not use the source code and the debugger are needed without affecting the test flow performed on the test script basis.
Memory dump analysis can be used as a way to find the cause of a fault without the source code. In the data-flow analysis, it is called DU chains (or DU pairs), where data is defined (D) and then used (U) (i.e., “A = B + C”; A is “define;” B and C are “use”). Therefore, according to the DU chain, the results of all right-hand side (RHS) expressions processed by the CPU are stored on the left-hand side (LHS). Owing to the nature of these computer systems, the footprints of important data remain in memory when the software is executed. The method used to analyze the memory dump is involving analyzing the stack and variables at the moment when the fault occurred [8]. However, in the HiL test, a test failure occurs when the output of the ECU does not meet the expected value. Therefore, the test failure determination and the occurrence of the fault may manifest at different times and it is difficult to dump the memory by specifying the fault occurrence timing. Accordingly, the memory dump-based debugging method cannot be applied as-is to the HiL test. If it is applied to the HiL test, it is necessary to trace both the updated memory data during the test and the timing information on the fault occurrence. For that reason, in the preliminary work [9], we developed a fault localization method that utilizes an updated data frequency when the failure occurs. However, all update symbols derived by the input without a clear criterion are presented as fault candidates. There is no guarantee that an updated symbol will be associated with a fault while the input is reflected. In the opposite case, if the test fails because important symbols are not updated, the defect candidate will not include the symbol because it has no update frequency. Therefore, in addition to the memory update information available at the time of the fault, a criterion for judging abnormal operation is required. If it is possible to obtain the memory usage information from the ECU during normal operation, it can serve as reference information to be observed in order to judge the cause of the fault in the memory-updated information acquired at the time of fault.
In this paper, we propose a method of fault localization for automotive software in an HiL environment. This is accomplished by comparing analysis results of updated memory between a normal unit test and a failed integration test without the source code. First, analyzing the memory usage of the unit test in normal operation can identify the memory update information required for the operation on the function, such as used memory addresses, corresponding symbols, stored values and updated frequency. The memory usage information of the identified unit test is compared with the memory usage information at the time of the fault. The symbols necessary for the operation of the specific function are compared and presented as fault candidates (Invalid updated or fixed symbols and stored values). As a result, a tester at the OEM can provide the developer with the fault occurrence time, malfunctioning symbols and stored values during an integration test in the HiL environment. He can accomplish this by using the operation information from the unit test without the source code and the debugging tools. The proposed method is applied to an HiL test of an OSEK/VDX-based ECU/SW. As a result of testing using fault injection, we confirmed that fault causes can be found by checking the localized memory symbols at an average of 5.77% by the proposed method. In addition, when applying this methodology to a failure that occurred during a body control module (BCM) (which provides seat belt warnings) test, we could identify suspicious symbols and find the cause of the test failure with only 8.54% of localized memory symbols. In this paper, we can provide debugging information for suspicious symbols and memory usage in an ECU/SW integration test in the HiL environment.
This paper is organized as follows. In Section 2, we analyze HiL test limitations and existing fault localization methods. In Section 3, we define the process of fault localization and the memory-updated information that can be collected during HiL testing of ECUs. In Section 4, we propose a fault localization method and in Section 5, we describe how the method is applied and then provide our evaluation. In Section 6, we conclude the paper and present future work.
2. Related Work
To test electrical automotive parts, a tester uses an HiL simulator in a black box environment without source code. In this environment, when a fault occurs, the tester can provide only limited information, such as the test script and a pass/fail confirmation, to the developers who must do the debugging. In this section, we examine the limitations of HiL testing, software fault localization methods and the studies that have applied memory analysis to debugging.
2.1. Hardware-in-the-Loop (HiL) Testing for Automotive Software
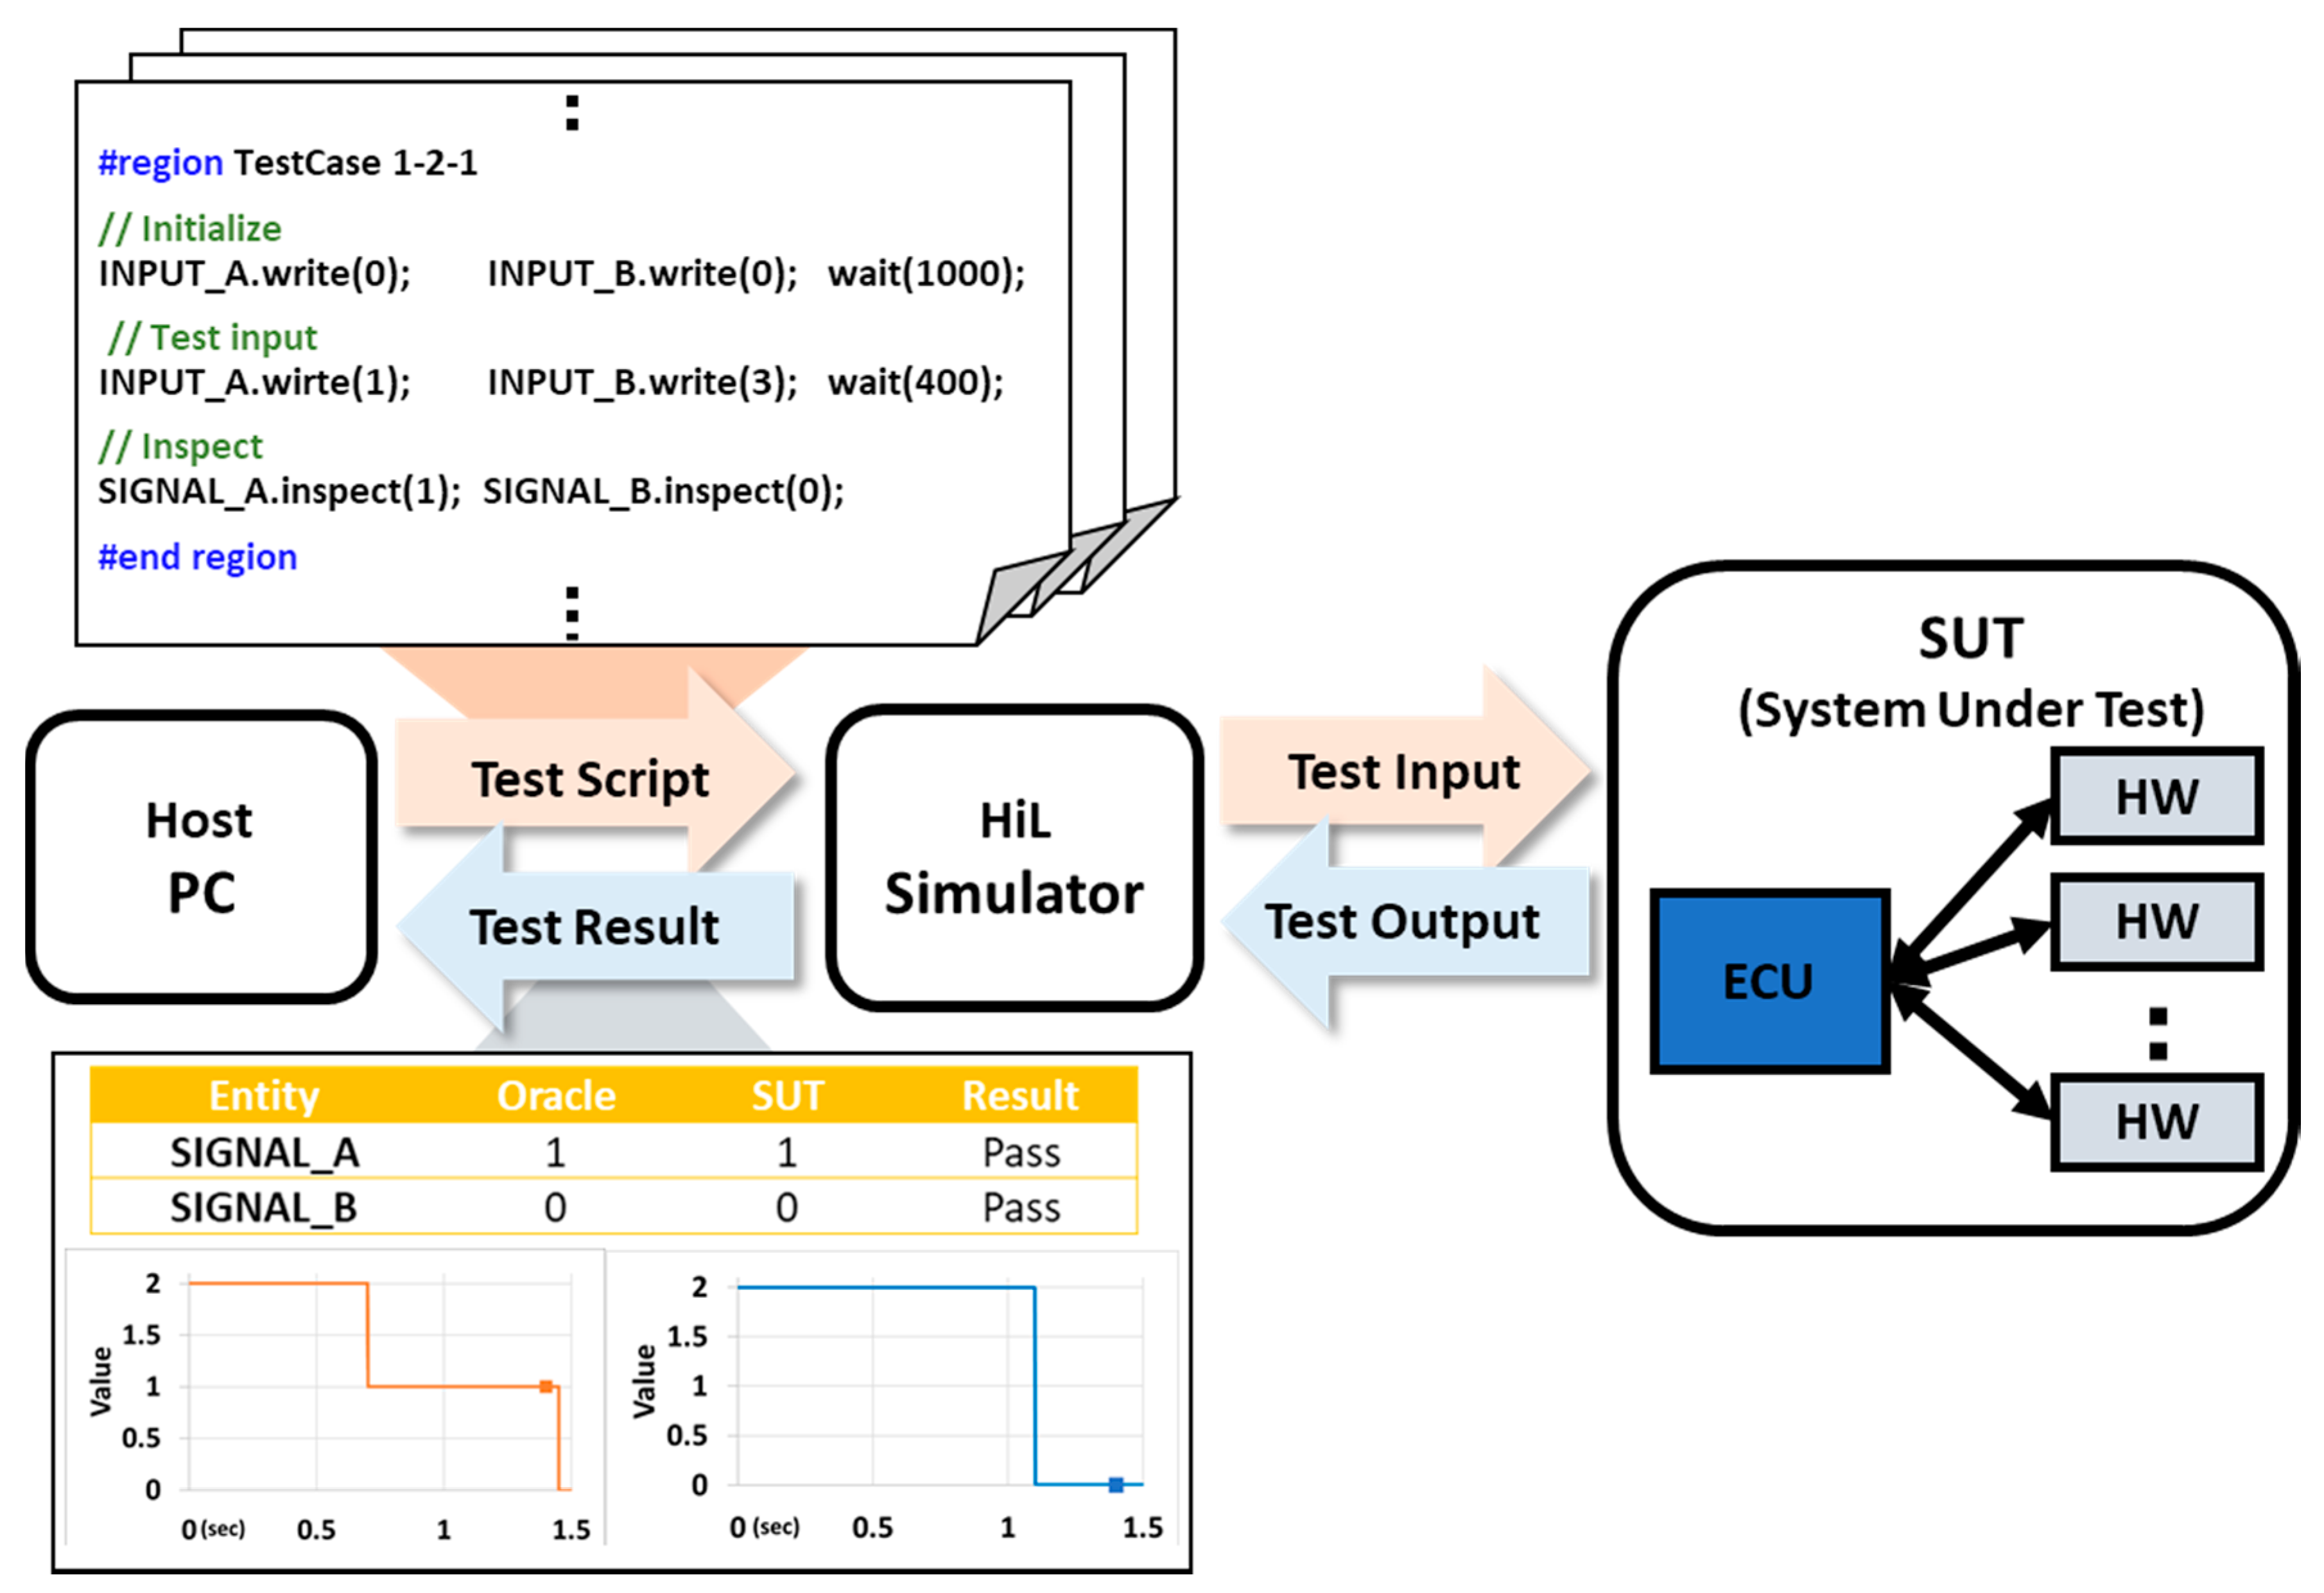
The performance of automotive software is affected by both software and hardware problems. Therefore, the software must be evaluated on actual hardware and its behavior must be tested and verified. The test is performed according to the overall integration level under development. The HiL test is a method for evaluating the hardware on which software is installed [10]. The HiL test constructs the physical environment in which the hardware operates with a simulator and evaluates whether the hardware meets certain input and output requirements [6]. Figure 2 shows an example of an HiL test environment. The host PC provides the test script to the HiL simulator. The HiL simulator then gives an input signal to the system under test (SUT) based on the script and it confirms the result. If the output value is equal to the expected value, a “pass” is delivered; otherwise, a “failure” is delivered to the host PC. This process runs automatically based on the script. However, an HiL test that utilizes such a simulator can only evaluate the output as the input of the defined SUT. In other words, if a fault occurs, there is no information on the internal operation that causes the fault. The results only include inputs that do not meet the requirements (i.e., the expected value—the oracle). Therefore, when a fault occurs during an HiL test, it is necessary to hunt for the internal operation of the employed SUT.
Commonly used methods for debugging general embedded systems include an in-circuit emulator (ICE) and a logic analyzer. The HiL test is based on a test script scenario. Debugging tools that utilize ICE, such as Trace32 and Multi-ICE, require synchronization with the HiL simulator to provide instruction-level control [5]. In addition, the HiL test of the integration process is intended for completed parts, so ICE connectors may not be exposed; this makes it difficult to apply the methodology to HiL testing. Logic analyzers are devices that capture I/O signals and observes the timing relationship between the signals [11]. They can detect the failed signals by using the relationship between the signals, time differences and so forth. It is easy to find the fault signal but the fault signal is unsuitable for finding the internal cause that created the fault. Furthermore, background knowledge at the level of I/O signals and operation timing is required and it is unlikely that anyone other than a developer would have that level of expertise. Therefore, there is a need for a method that can be applied to the HiL test for testers who perform integration testing of the software installed on the completed hardware.
2.2. Software Fault Localization
Finding the location where a fault occurred during debugging is costly and time consuming [12]. Therefore, many studies have been conducted on fault localization methods. Among these methods, there is a technique that finds errors by using information related to the operating elements of the program. Most methods are white-box-based methods that use a source code because a developer can find and fix the cause of the fault. Thus, there are memory-based studies performed using software footprints that can be applied to a black box without source code.
There is a method that locates faults by measuring the code executed by the program [13,14]. This method is called code-coverage-based fault localization (CBFL). Code coverage is one of the test measures, which means that codes are covered during testing. For each statement measured in each test case, suspected areas are calculated by coverage by pass or fail signals. The key idea is that the code executed in the failed test case is the cause of the failure. The CBFL method presents the rank of the statement in order of suspicion. Tarantula [13] and Ochiai [14] are typical methods used for calculating the suspicion of CBFL. However, the CBFL method is unsuitable for testers in OEM environments where the source code is difficult to obtain.
There is also a mutation-based fault localization (MBFL) method that utilizes the mutation of the program. This method identifies suspected mutations and finds the point at which the fault occurred with the statement that caused the mutation [15,16]. A mutation is created by modifying only one statement. The mutation applies the test case that the original performed and kills if the result is the same as the original. The remaining mutations are then mutations that affect the outcome. The MBFL method calculates suspicion with statements that affect the outcome. Typical methods include Metallaxis [15] and Museum [16]. The MBFL method has the disadvantage of creating impractical levels of mutation by creating multiple mutations in each statement in the original program. In order to solve this problem, studies have applied the CBFL method [17] or generate mutation efficiently through test case optimization [18]. However, the MBFL method still has a disadvantage in that it takes a significant amount of time to test with a large number of mutations. HiL testing is unsuitable because it is difficult to control the execution speed differently from software testing.
In addition, there are fault location methods extended from the CBFL method that statistically access characteristic elements of program execution. In Reference [19], statistically defines the density and type of faults based on CBFL method and considers multiple faults present in the program as interference rather than individual approaches. And in Reference [20], the PageRank algorithm is applied to the existing CBFL method to weight the rank. These studies presented the statistical approach to test the results and the effects of source code on faults with density and rank weights. However, it is difficult to measure the covered source code in the HiL test, so the source-code-based methods are not applicable.
However, analyzing the memory that has the execution trace of the program can grant access to the fault without the source code. One of the traditional debugging methods involves analyzing the memory dump. This method analyzes the behavior of the program based on how the memory is used at the OS level. However, this method should support a memory dump at the OS level and generally a memory dump occurs when the program terminates due to a serious fault. The HiL test does not know when a fault occurs and the HiL test cannot pause for the memory dump because the host PC, simulator and SUT work together according to the test script. Therefore, it is difficult to apply it directly to an ECU/SW HiL test.
For this reason, we periodically dumped the memory in previous works for fault localization in HiL tests [4,9,21]. These studies assume that a fault has occurred in the process of determining the output by the input. Therefore, the timing of the interval in which the output is induced by the input applied in the HiL simulator, the address updated in the interval and the corresponding symbol are provided as fault candidates. However, these studies have two problems. The first is that all update symbols derived by the input without a clear criterion are presented as fault candidates. There is no guarantee that an updated symbol will be associated with a fault while the input is reflected. The other problem concerns the opposite case. The fault candidate does not include the symbol if the test fails due to not updating the important symbol. Therefore, in addition to the memory update information at the time of the fault, a criterion for judging abnormal operation is required. By comparing the memory usage at the failed operation in a specific function with the memory usage in normal operation, it is possible to check the memory which is used incorrectly (invalid or fixed symbols and stored values). As a result, it is necessary to compare the memory usage between the unit and integration tests in order to obtain debugging information regarding faults that occur during the HiL integration test. It is difficult to use the source code and existing debugging tools to obtain this information.
3. Preparations for Fault Localization
This section describes the overall process of the updated memory-based fault localization method and explains how to construct memory-updated information by processing available test data and memory usage without source code.
3.1. Fault Localization Process
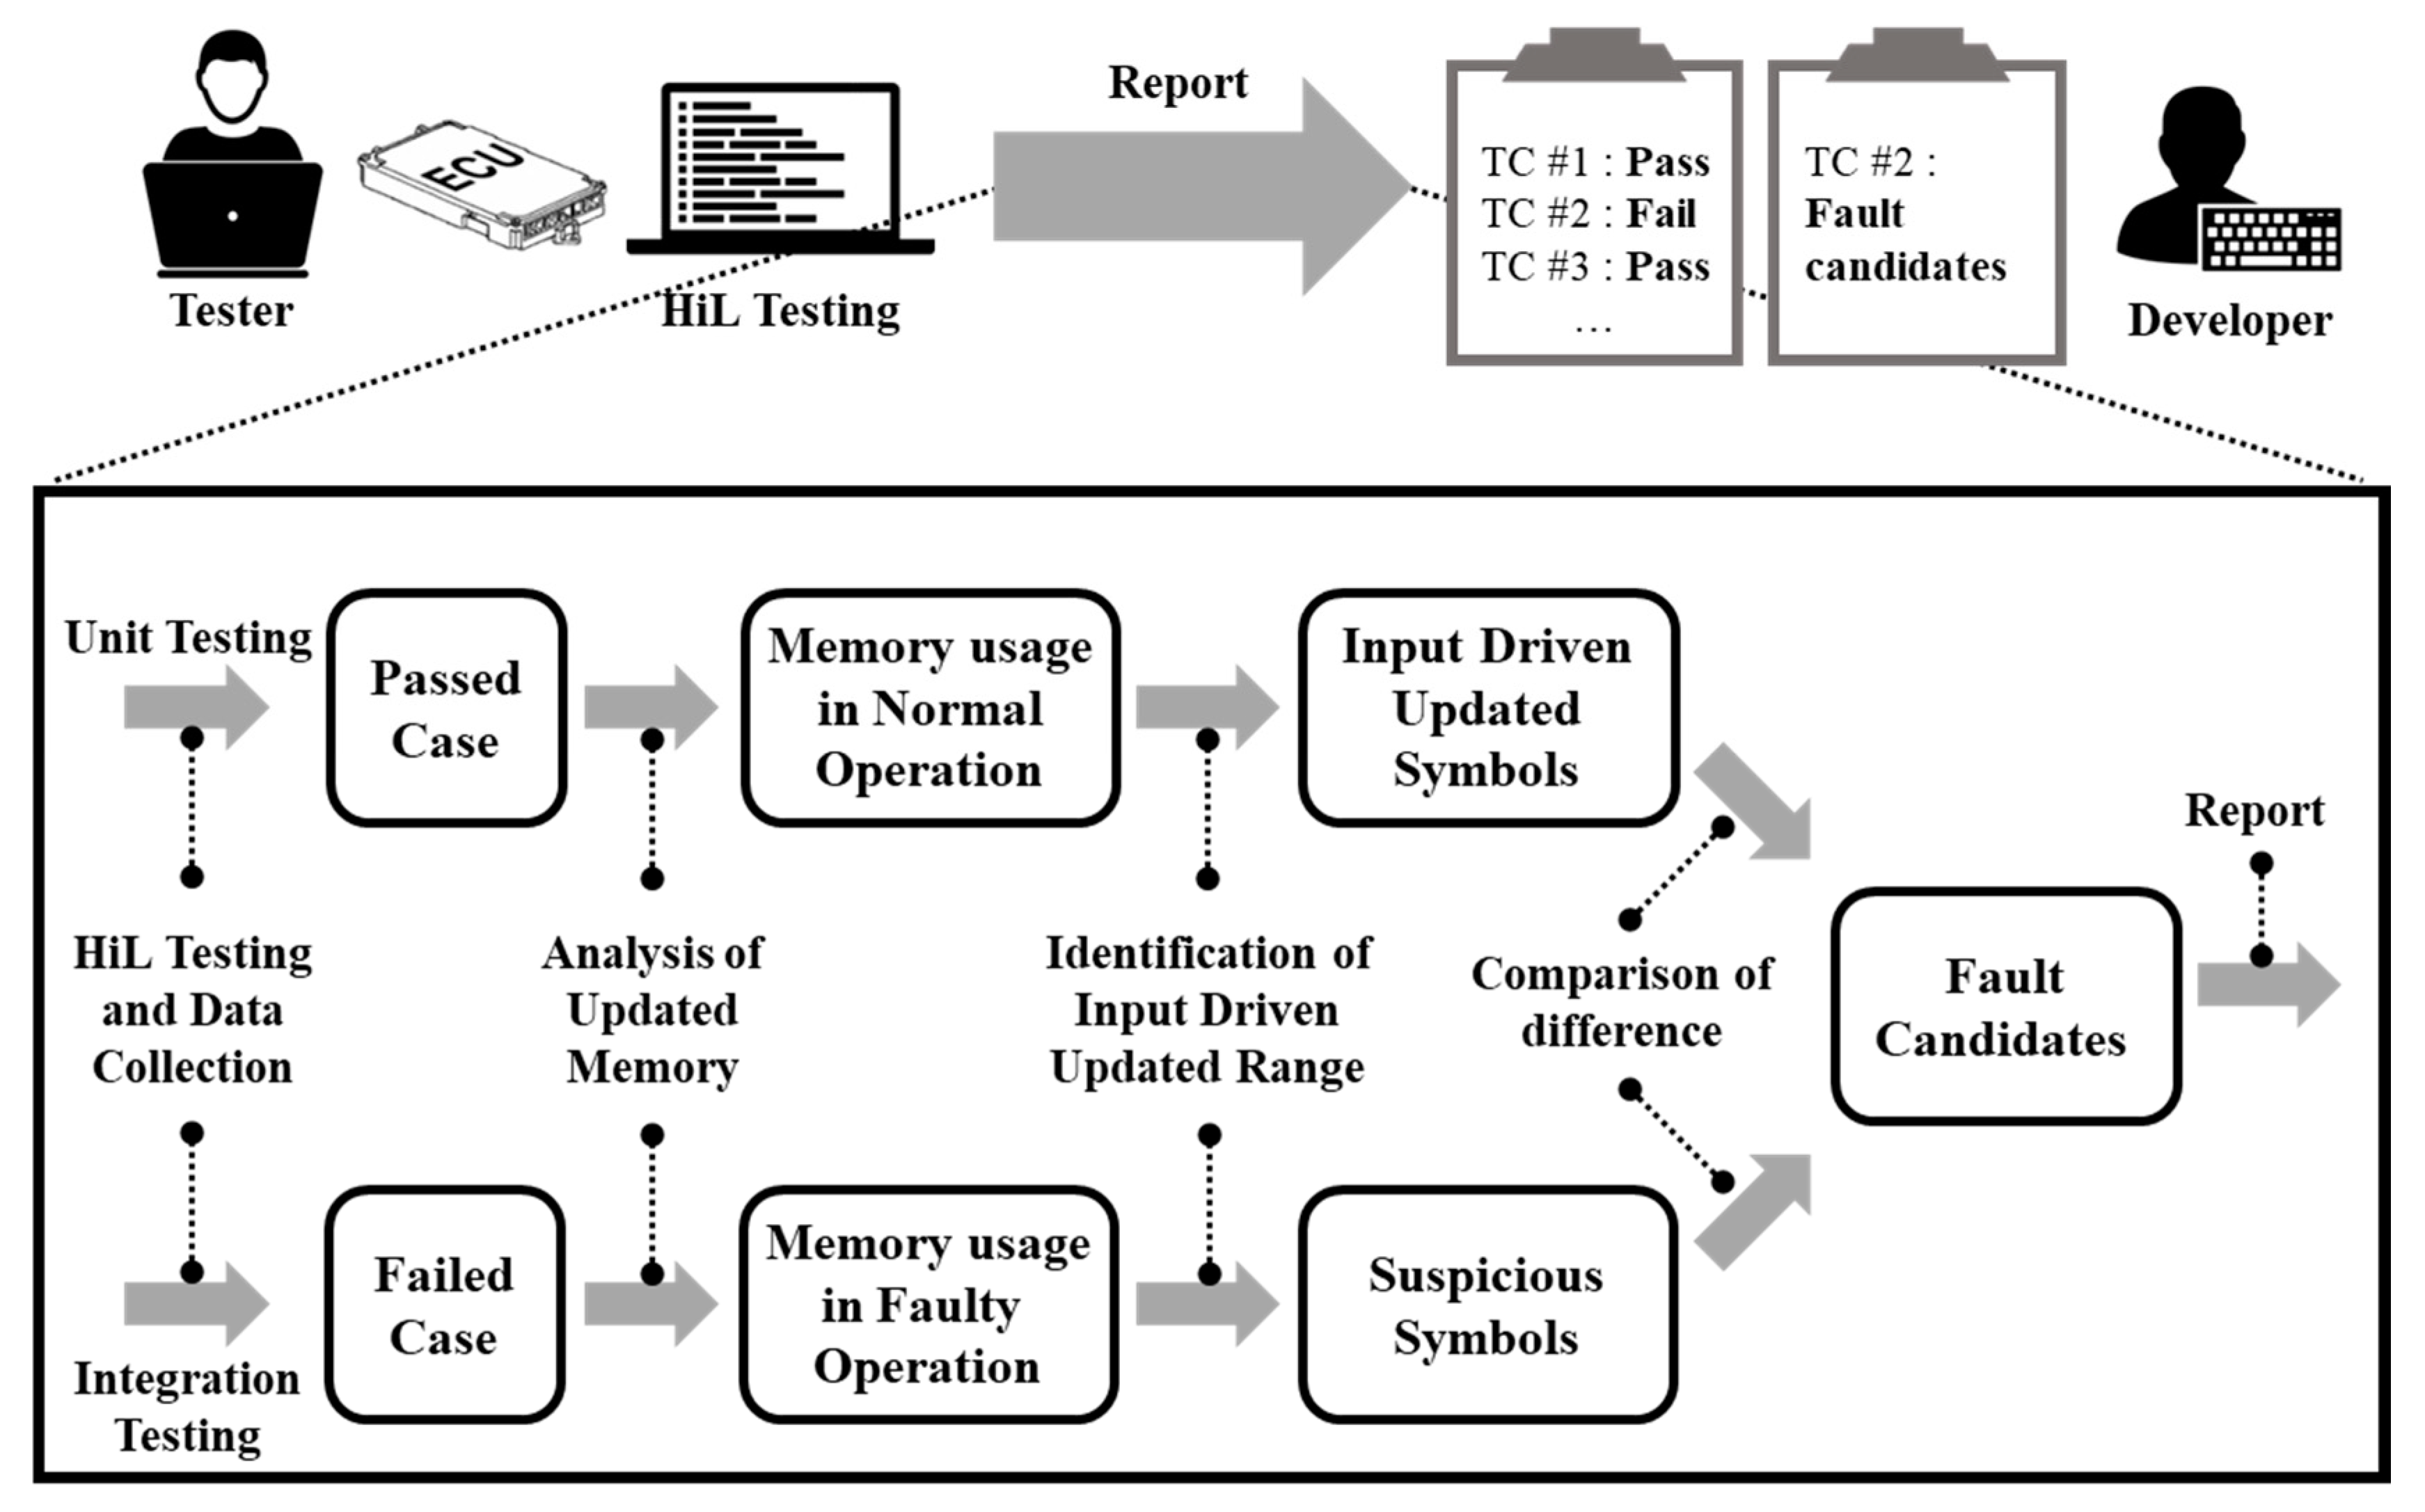
In an integration test, the ECUs that have passed unit tests are inspected under various conditions. As a result of the integration test, the ECU can be divided into “pass” or “fail” categories according to the test case. In the “fail” case, the ECU has operated normally and passed the unit test but faults were found in the integration test. In this paper, we focus on fault localization in the integration test by using memory information that normally operates during the unit test. Figure 3 shows the process of fault localization using memory-updated information.
At the first step, we perform HiL testing and data collection. As a result, we collect test results, test scripts, memory data and executable files of the software used for testing. Next, we perform static analysis of the executable file to extract the symbol names and their assigned addresses. Then, we analyze the memory snapshots that are periodically dumped and compute the update frequency of the specific address. In this step, the analyzed result is used to map the assigned addresses and symbols and to generate memory update information for each address. The third step identifies the frame range of memory data that responds to the input of the function being tested. Here, there are two types of symbols: normally operated symbols and symbols suspected of operating abnormally within the frame range. The last step compares both memory update information of the previous stage. If the suspicious symbols are different from the memory-updated information in normal operation, they can be regarded as abnormal; these symbols are called fault candidates. In the last stage, the memory-updated information on symbols determined to be abnormal is provided as the fault candidates. The key is to find the fault candidates so that the developers can use them as debugging information.
3.2. Data Collection
In order to provide debugging information for automotive ECU/SW faults, we collect the following three types of data and extract important information from them during the HiL Test. First, we collect test data related to the experiments performed, such as test results and test scripts. The results and scripts, including the pass/fail testing criteria, are the basis for distinguishing between normal operation and failure operation and the script contains the I/O specification of the tested function. Second, we collect the executable file of the software running on the ECU. Static analysis of the executable file provides the basis for identifying the symbolic name of the allocated address, which is essential information. This information appears in the form of a pair (address, symbol-name). Finally, we examine all of the raw data by dumping the memory. Because raw memory data is difficult to understand, memory usage can be checked as to how each symbol has changed over time using the symbols obtained from the executable file.
In the fault localization process, the first step collects test data and raw memory data and prepares them for analysis. The HiL test environment is modified to collect raw memory data and periodically collects memory during testing. In addition, the test result is confirmed when the test is finished and test specifications are analyzed in test scripts.
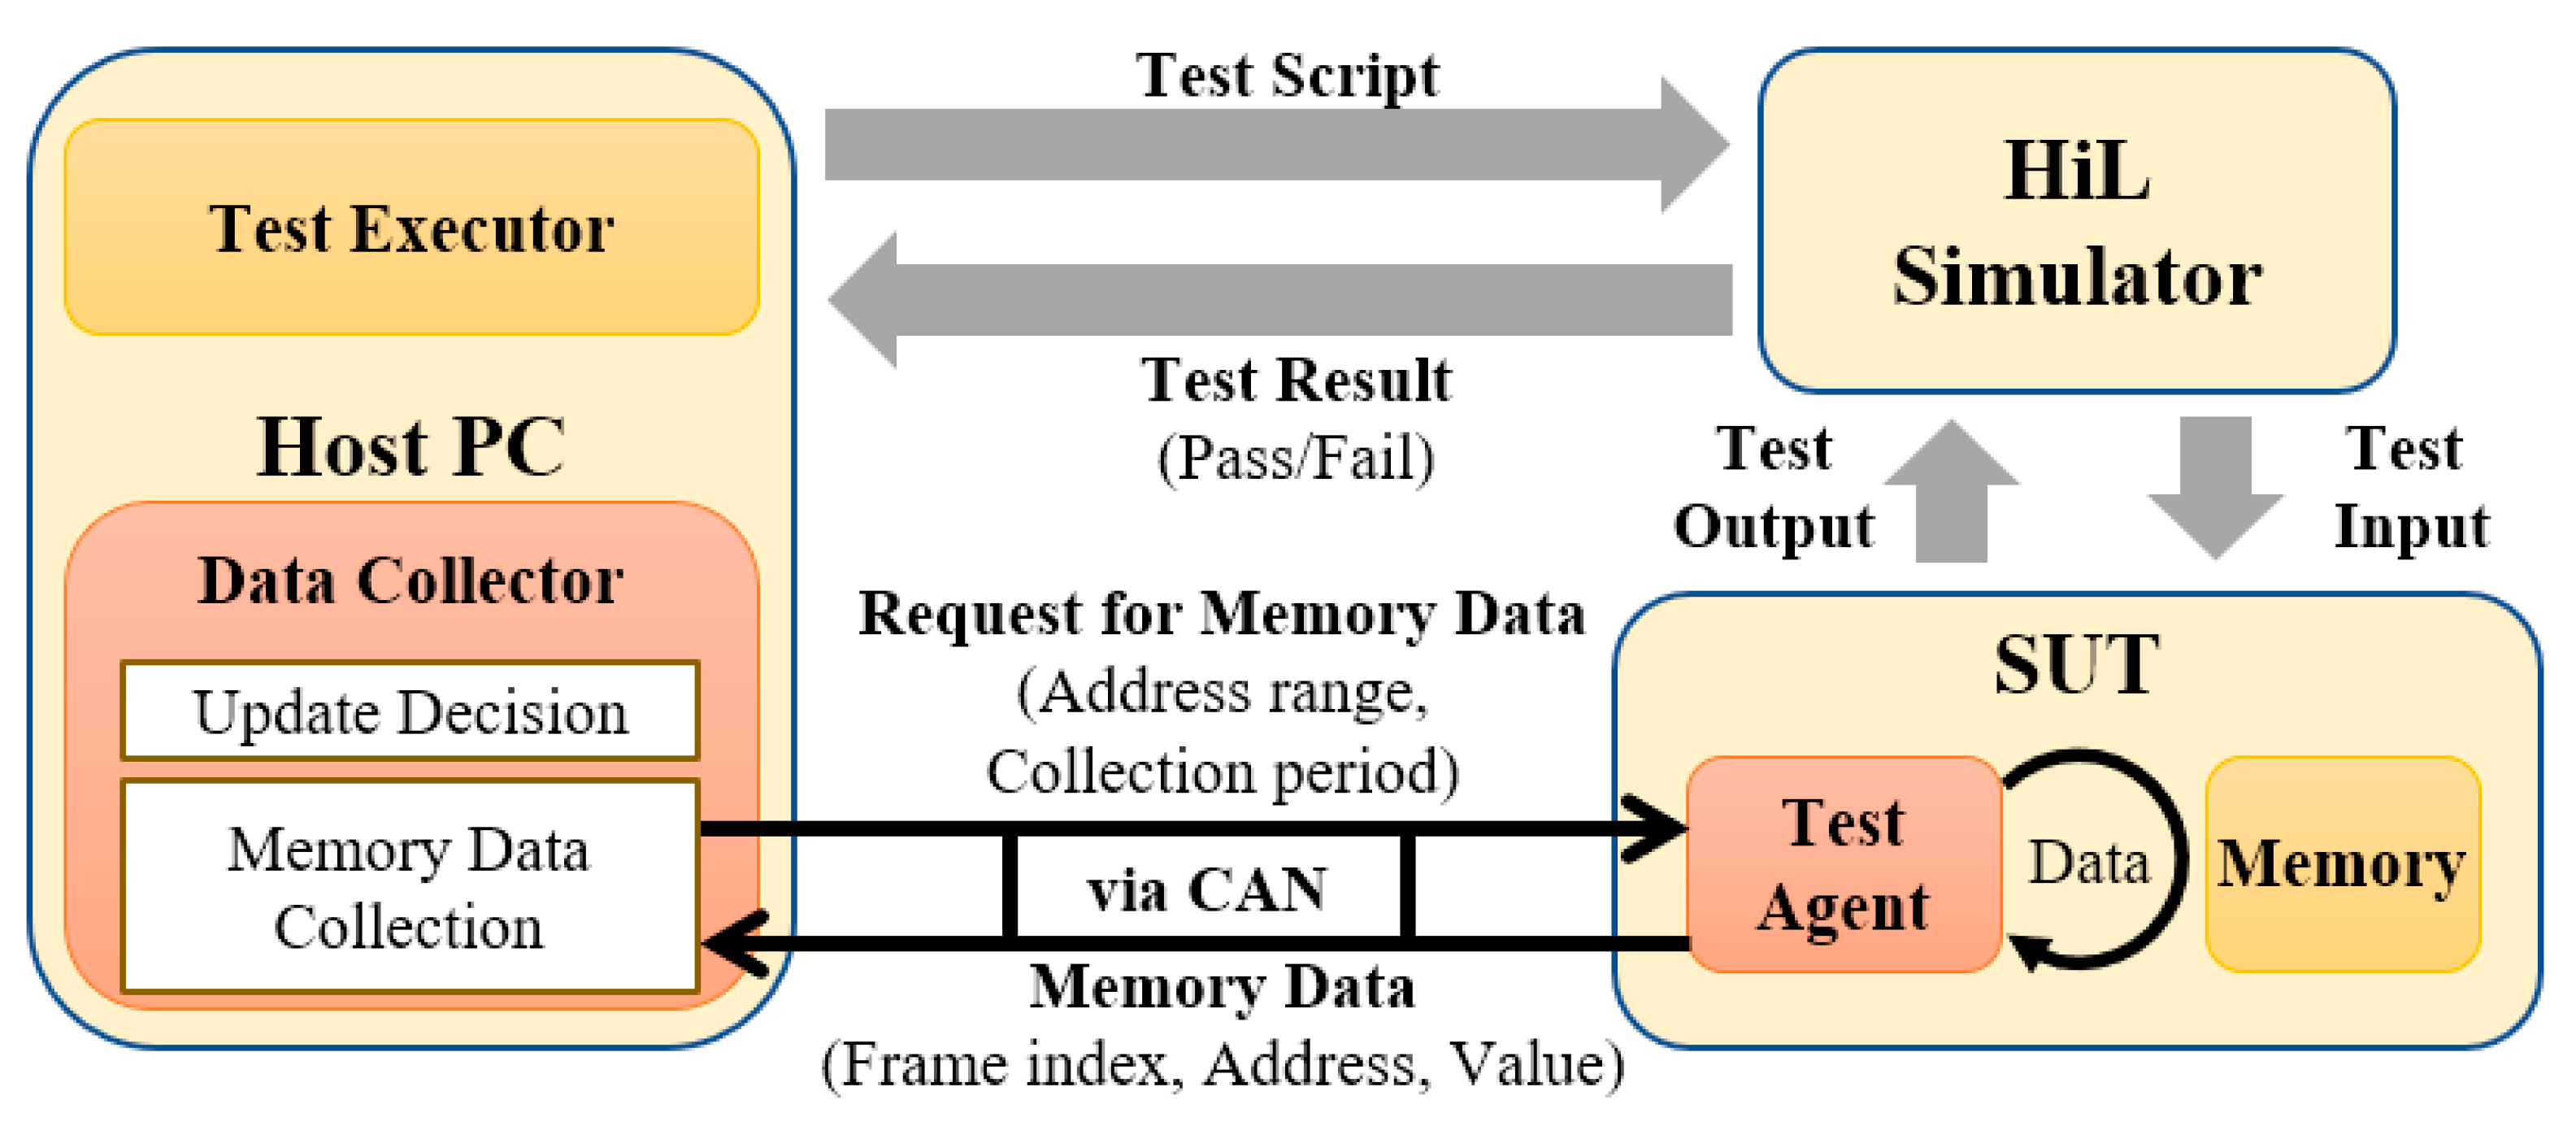
We have added a data collector and a test agent for obtaining memory data from the HiL test environment described in Section 2. In Figure 4, a test executor is expressed as a program that handles the test scripts instead of the host PC in the existing HiL test environment. A data collector and a test agent are responsible for collecting memory data. The data collector collects memory data from the host PC and determines whether they have been updated based on the changes in values. The test agent sends memory data within the address range to be observed in the SUT during the test time according to the request of the data collector. The communication between the test agent and the data collector uses a vehicle communication network, such as a CAN.
When the HiL test is finished, the test results and the script are collected as data. The test reports that the developer receives from the tester for debugging includes metadata about the test, such as the date/time of the test, the result and the test script. Through the test script, the developer recognizes the occurrence of the fault, reproduces the fault condition and starts debugging. Therefore, it is possible to extract the meta information and specification of the test by analyzing the collected test script and the test result. The test script in Figure 2 contains the test conditions and the expected value to check after the required operation time. The “write” command inputs the test condition into the SUT and the “inspect” command checks the expected value and the output value from the SUT. By analyzing the test script in this manner, it is possible to identify the function being tested by the signal name. The data that can be acquired through the test are summarized in Table 1 below. The test case has I/O information of the function to be inspected and the test script includes a series of test cases.
3.3. Data Analysis
In Figure 3, the second step analyzes the updated memory data and the executable file. The amount of memory data collected depends on the set range and time but the amount collected over a period of tens milliseconds is too enormous to check raw data values. Therefore, we focus on the symbols with the values updated by input stimulus. As explained in the Introduction, the results of all right-hand side (RHS) expressions processed by the CPU are stored on the left-hand side (LHS) according to the DU chain. Therefore, we focus on LHS symbols with the updated values.
3.3.1. Static Analysis of the Execution File
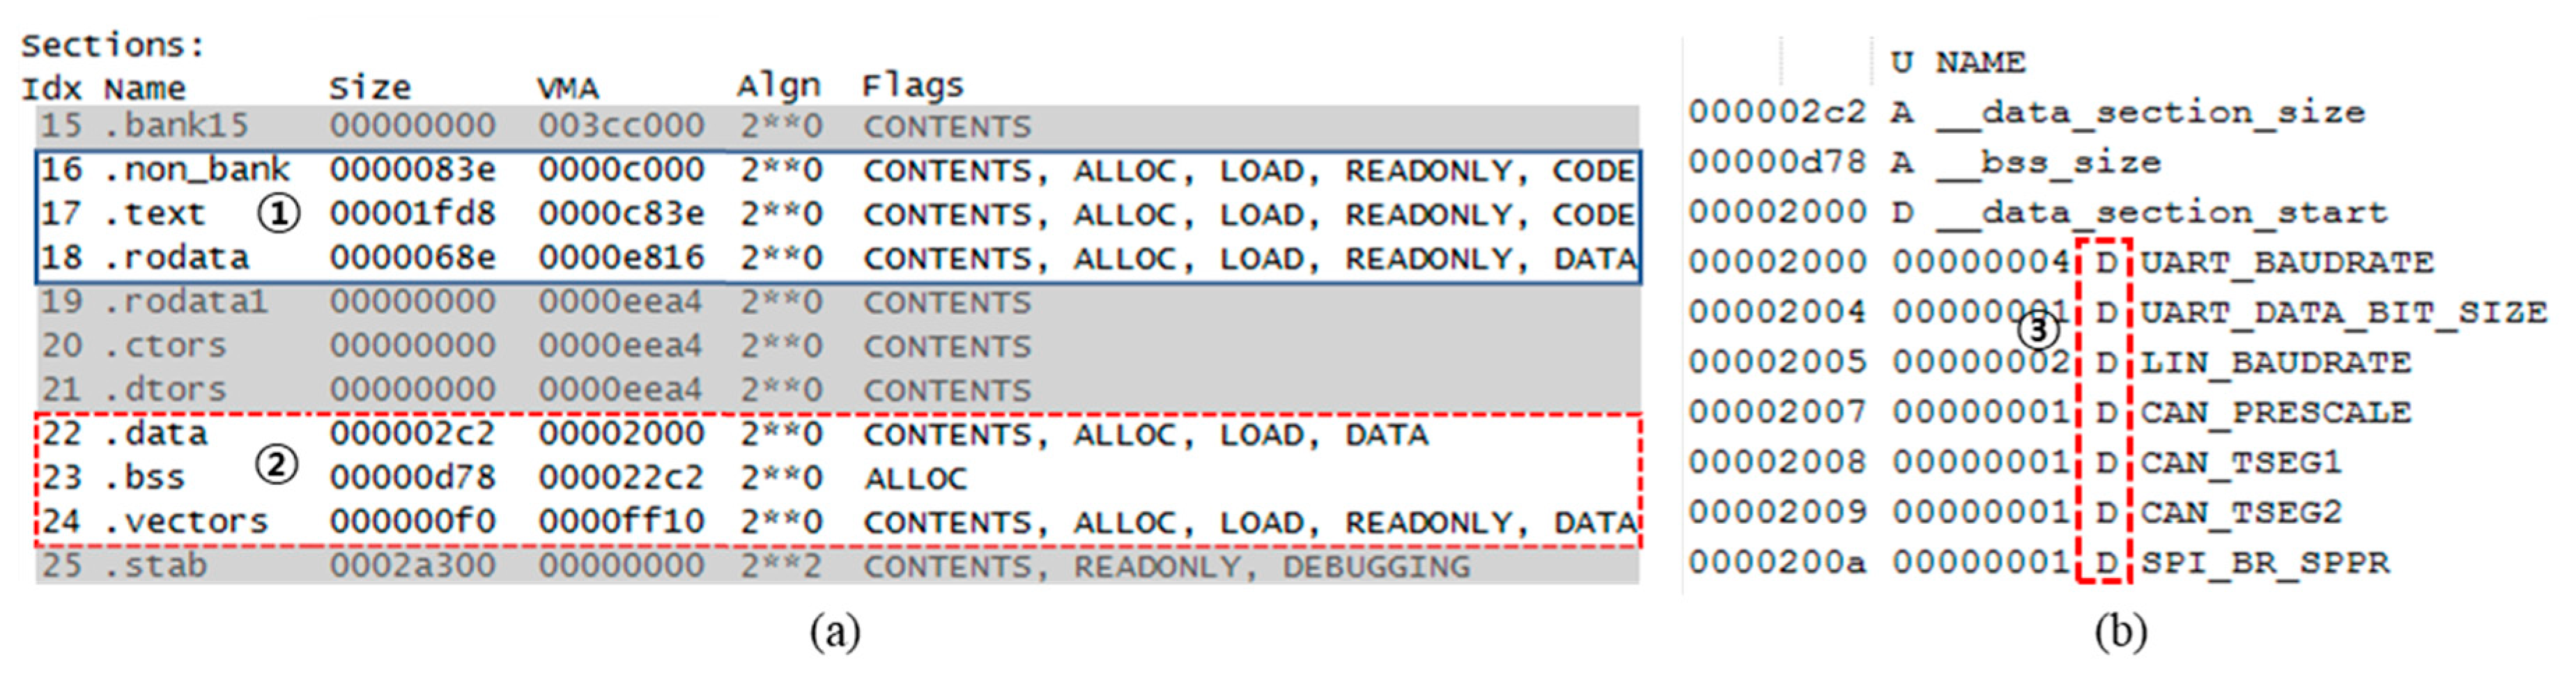
The executable file is statically analyzed to extract execution information from the software. The tester receives an executable file from the developer in a binary form rather than source code to test an automotive ECU/SW. To statically analyze an executable file, a binary utility is used [22]. For instance, the Objdump is used for the memory section table and the NM is used for the symbol list. First, we have to obtain a memory section table, which provides memory partitioning information based on usage, including structure information used by the executable. Figure 5a, which is an example of a memory section table, shows the section name, the size of each section, the start address (Virtual Memory Address, VMA) and characteristics such as alignment and flags. This section table contains information on the address range to be dumped. In the figure, “.text” in ① indicates the part where code is loaded on memory and ② is a section for variables used in software execution. The section of “.data” is for the variables with initial values and “.bss” is for the variables without initial values. The variable sections that can be updated with values that correspond to LHS are dumped and analyzed. At this point, our method focuses on the value changes in the address. Therefore, there is a limit to not using static addresses such as local variables in the stack and dynamic allocation variables in the heap. However, in the coding rules (MISRA-C: 2004 Rule 18.3, 20.4) for automotive software, it is recommended that memory should not be reused or dynamically allocated [23]. In this paper, we propose a fault localization method for static addresses only.
Second, obtain the symbol list that contains the actual names of each address for use in displaying fault candidates. The symbol name obtained is optionally used to help understand the result of fault localization. As shown in Figure 5b, the list of symbols acquired from a binary file using static analysis includes the size, starting address, type and name of the symbol. The symbol type D in ③ represents the “.data” section in the section table of ②. The first column is the address where the symbol is and the next column is the size of the symbol in bytes. Thus, when a symbol list is interpreted, a symbol named UART_BAUDRATE will be the symbol that is 4 bytes in a data section that starts at address 0x2000. That is, even if there is no source code, we can obtain the name, size and memory location of the symbol used in the source code by extracting the symbol list through the static analysis. However, some build options cannot extract the symbol lists. Therefore, the proposed method displays only the memory address when the symbol list cannot be extracted.
3.3.2. Computation of Memory-Updated Information
The HiL tests require a periodic memory dump to trace the running software. Because the tester is prohibited from using additional storage space inside the ECU for testing, we previously developed a method to transfer large amounts of data while taking into account the communication load of an ECU [21]. Using this method, the memory sections for variables can be dumped periodically without data loss and beyond the bandwidth of CAN. The memory data of the k-th dump is defined as a k-frame at the interval of the period T of the main task of the system from the 0-frame in Equation (1) and is represented by Fk.
Fk ≡ {∀VA, k|VA, k is the value of the address A at time T × k; k is an index number}
Fk is a set of values corresponding to each address at the point of dumping. Therefore, Fk can be regarded as a memory snapshot at the k-th point. The ECU state at a specific point can be confirmed using this memory snapshot. By examining the values of memory stored in the frame, we can trace the ECU states at time intervals. A change in value in a specific address means that a new value has been updated to that location. This indicates that the symbol corresponding to that address was used as a left-hand side variable in the program. Accordingly, “MU (Memory Updated)” is defined as Equation (2):
In Equation (2), the memory updated (MUA, k) compares VA, k−1 with VA, k. If both values are equal, the value is 0; otherwise, the value is 1. If MUA, k is 1, it means that the address A is updated in the k-frame and that the ECU has performed an operation related to the address A. By accumulating the MU between specific ranges, we know how frequent the address is used. We refer to it as the memory-updated frequency (MUFA, R) which is defined as shown in Equation (3).
MUFA, R represents the number of times the updates occurred from the range of the R.start to the R.end of the frame index to which address A is to be observed. If we trace the MUFA, R for each address, we can know the addresses used during the operations that are performed over the specific frame range (R).
Equation (4) defines the memory data (MDA, R) using the previous equation. In Equation (4), memory data (MDA, R) includes the address A, the update frequency of the address in the range R of the frame observed (MUFA, R) and the value set of each frame of the address. We define memory-updated information (MUI) as shown in Equation (5), together with the symbol name (SymA) of the address A obtained by static analysis and MDA, R.
Algorithm 1 shows an algorithm for generating MUI. In line 7–12, the update is determined by the change of the value in each frame according to Equation (2) and the update frequency is calculated in line 13 how many times the value has changed in the full range according to Equation (3). For the updated memory according to Equations (4) and (5), the symbol, the address, the update frequency and the values in each frame are stored as line 15. The MUI can be obtained by repeating lines 6–16 for all addresses. As a result, memory usage such as the memory addresses, the corresponding symbol name, the changes in values and the updated frequency can be identified by the analyzed MUI. Therefore, we are ready to proceed with the fault localization by comparing the memory usage of normal and failed operation.
| Algorithm 1. The Algorithm for Memory Updated Information |
| INPUT: value set, symbol list, frame range(R) OUTPUT: MUI, memory updated information 1: val(α,k) ≡ the value of the address α at k-frame 2: MU(α,k) ≡ the value of the address α changed in k-frame 3: MUF(α,R) ≡ the frequency of the MU(α,k) in R range 4: sym(α) ≡ symbol name of the address α in symbol list 5: MUI(α,R) ≡ the memory updated information of the address α in R range 6: FOR each address α DO Update Decision: 7: FOR each frame k of frame range(R) DO 8: IF value change of address α in frame k THEN 9: MU(α,k) ← 1: updated(true) 10: ELSE 11: MU(α,k) ← 0: non-updated(false) 12: END FOR Consist Memory Updated Information: 13: MUF(α,R) ← sum of MU in range R 14: sym(α) ← find α in the symbol list for displaying 15: MUI(α,R) ← {address α, memory updated frequency, value set, symbol name} 16: END FOR |
4. Fault Localization Method Using Memory Updates
By collecting the memory usage of an ECU/SW that has passed its unit test, normal operating criteria can be created. An integration test is conducted to verify the problems that might occur in the integration of the unit functions of an ECU that has already passed a unit test. In other words, the integration between unit functions checks the transfer of the values, exception handling, timing delay and so on. Faults that may occur in this integration test can be compared with the criteria for normal operation to determine the failed signal. This section describes how data is prepared to apply the proposed method for fault localization and it explains how to identify the major symbols involved in the operation of the function. Finally, we propose a primary algorithm for finding fault candidates for integration tests using the normal operation symbols of unit tests.
4.1. Data from Test Specification and Memory Updates
In the previous section, we prepare memory-updated information (MUI) by accumulating the frequency of the specific address and by extracting the symbol names from the executable file. Additionally, we have to obtain a test specification such as show the number of inputs, the test condition, the expected value and the input interval from the test script.
Depending on the test suite, the details of the script may vary. However, the test condition and the expected values are essential. The test condition is input after initialization to confirm the normal operation of the function. The interval means time duration between inputs—between initialization and input or between inputs. The following is summarized.
- Number of Input(Nin)—The number of inputs including initialization in the test script
- Input interval(Tin)—Time interval between inputs
- Test condition—Input values including initialization of input signal
- Expected value—Expected value including initial value of output signal
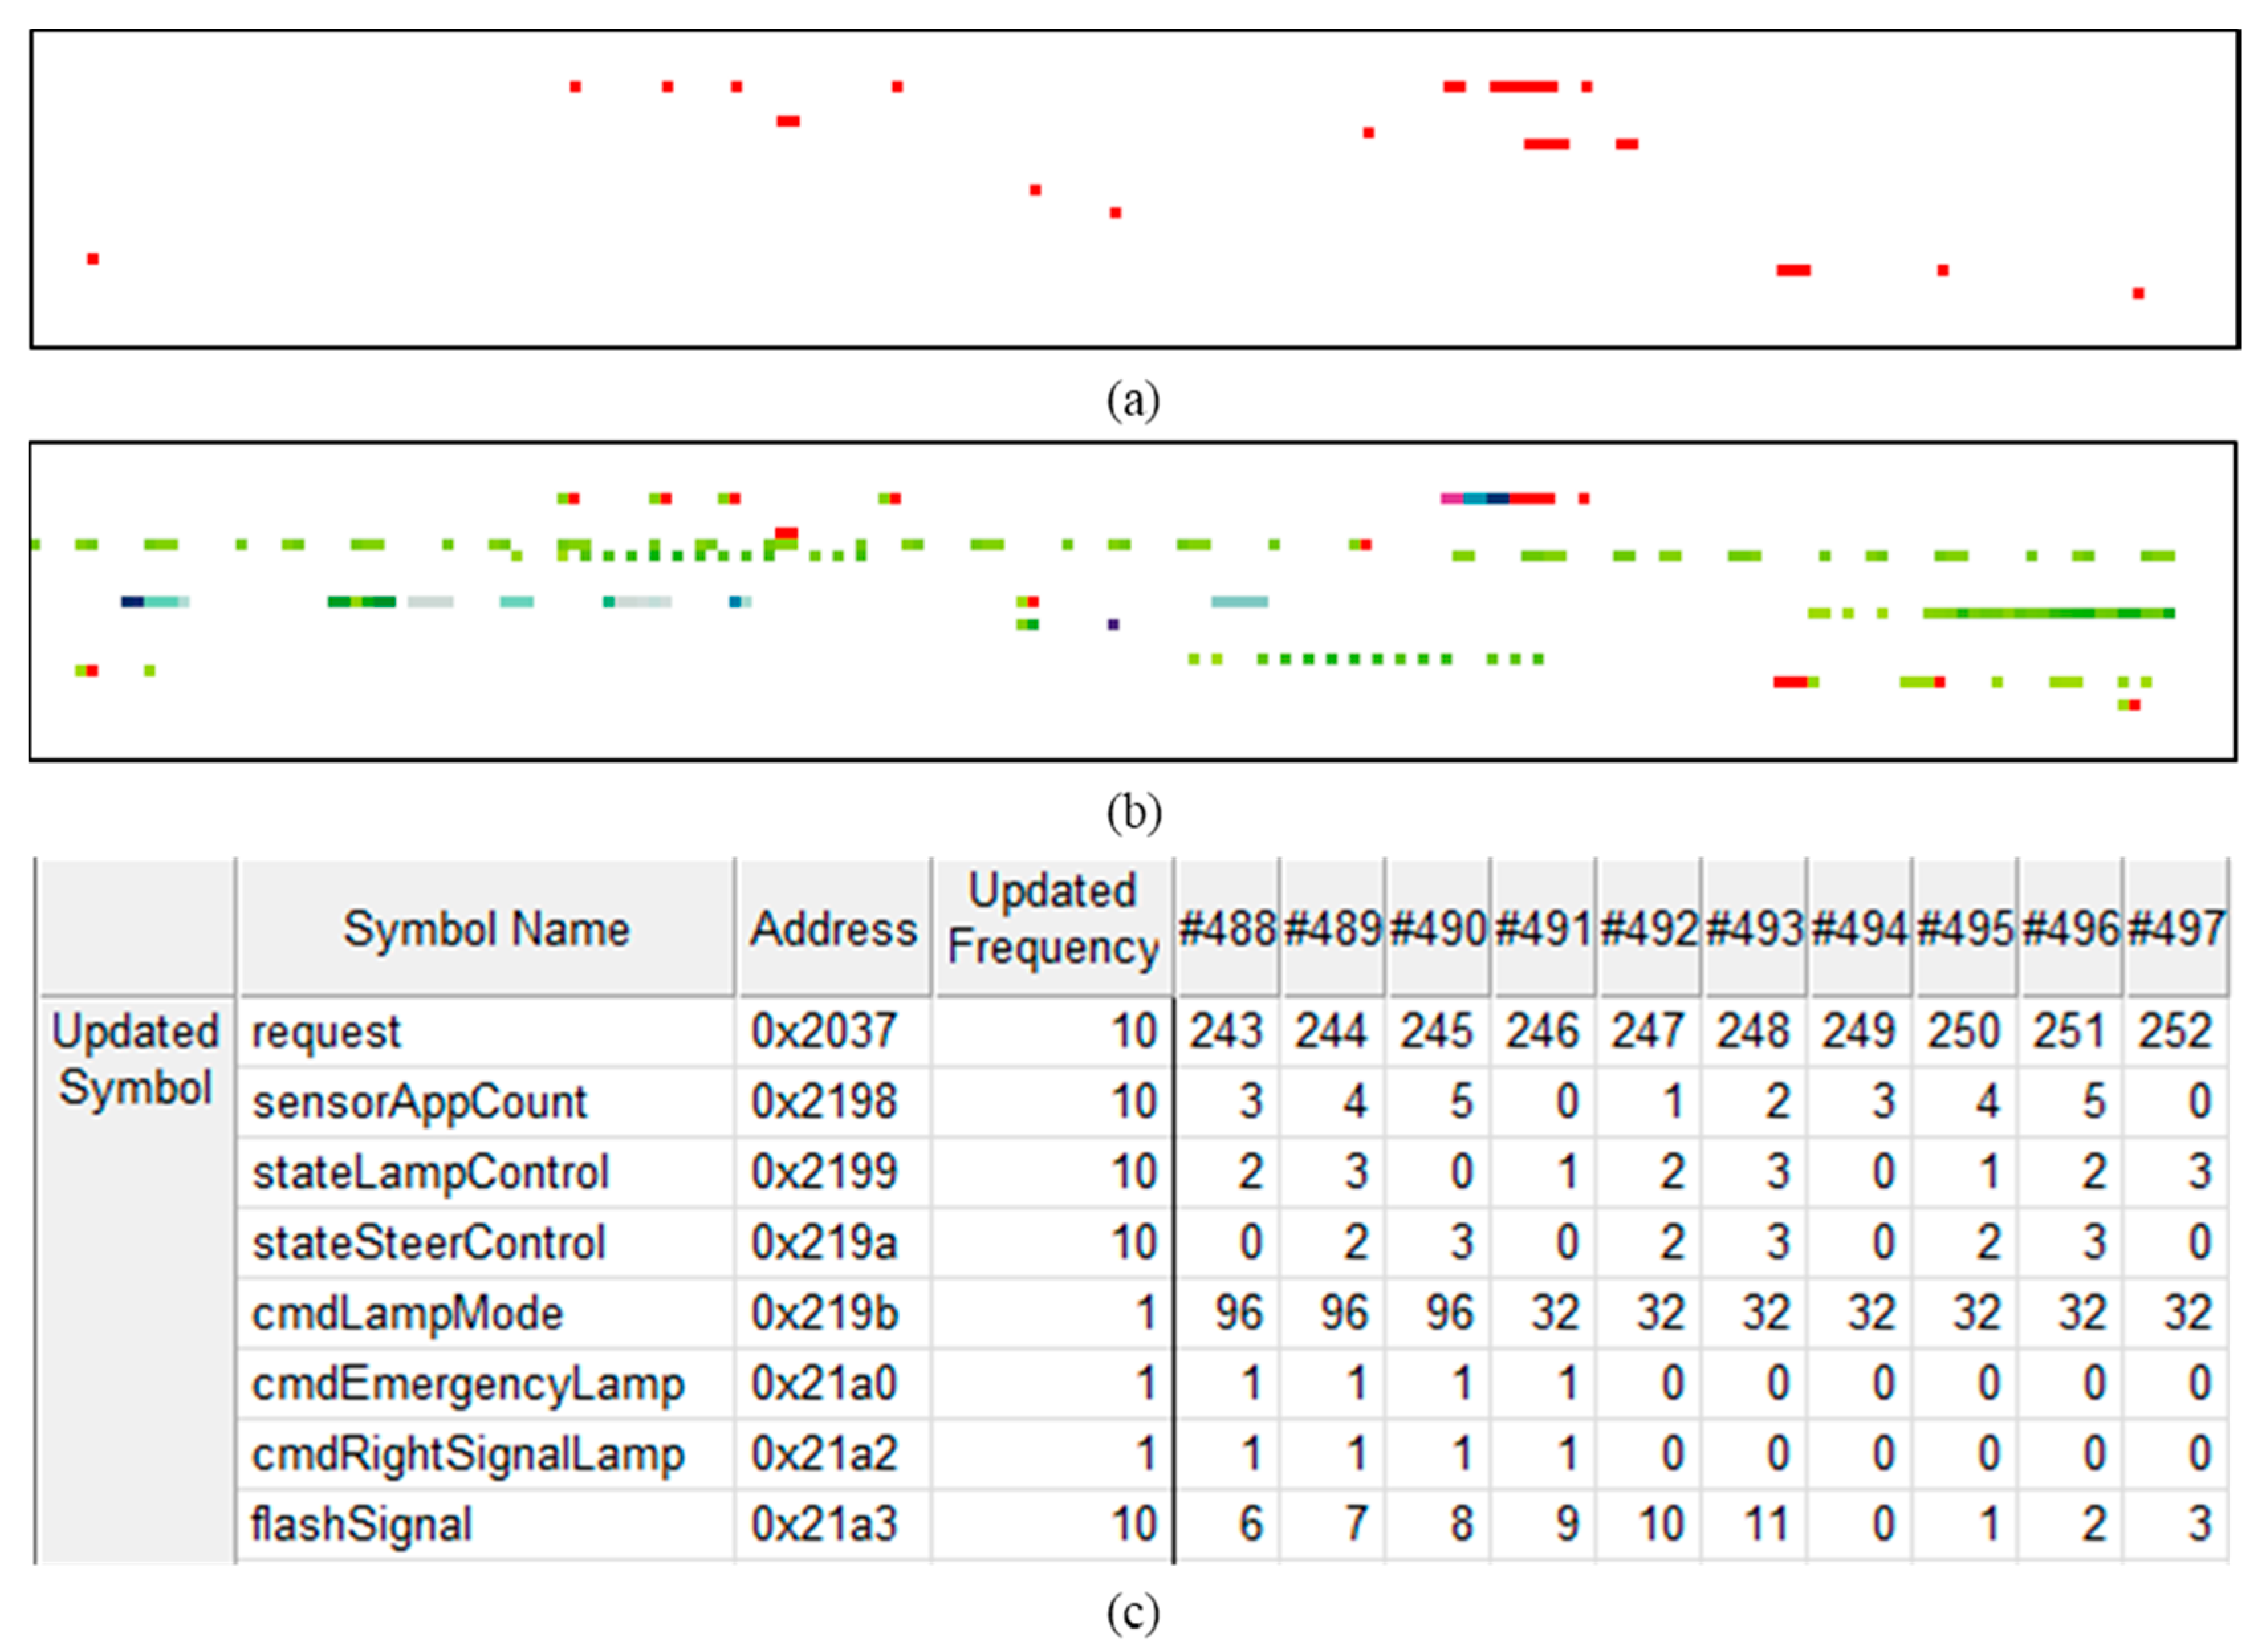
Figure 6 shows an example of MUI. Figure 6a,b are the memory snapshots in color. Figure 6a shows a set of MUA, n of n-th frame in red, which means “updated”. The addresses of the white area that look like the background means there are no changes in the values at that point of n-th frame. In (b), it is possible to identify the updated frequency of each address in the range of the full-frame. The updated frequency is visualized using different color palettes (white, yellow, green, blue, red). As frequency increases, the color changes from white to red and turns red if an address is updated on all frames. In (c), you can see the additional details of the MUI. The symbol “request” in the first line is assigned to address 0x2037 and the total number of updates is 10 because the value is continuously changed from #488 to #497 in every frame.
4.2. Identification of Input-Driven Updated Range
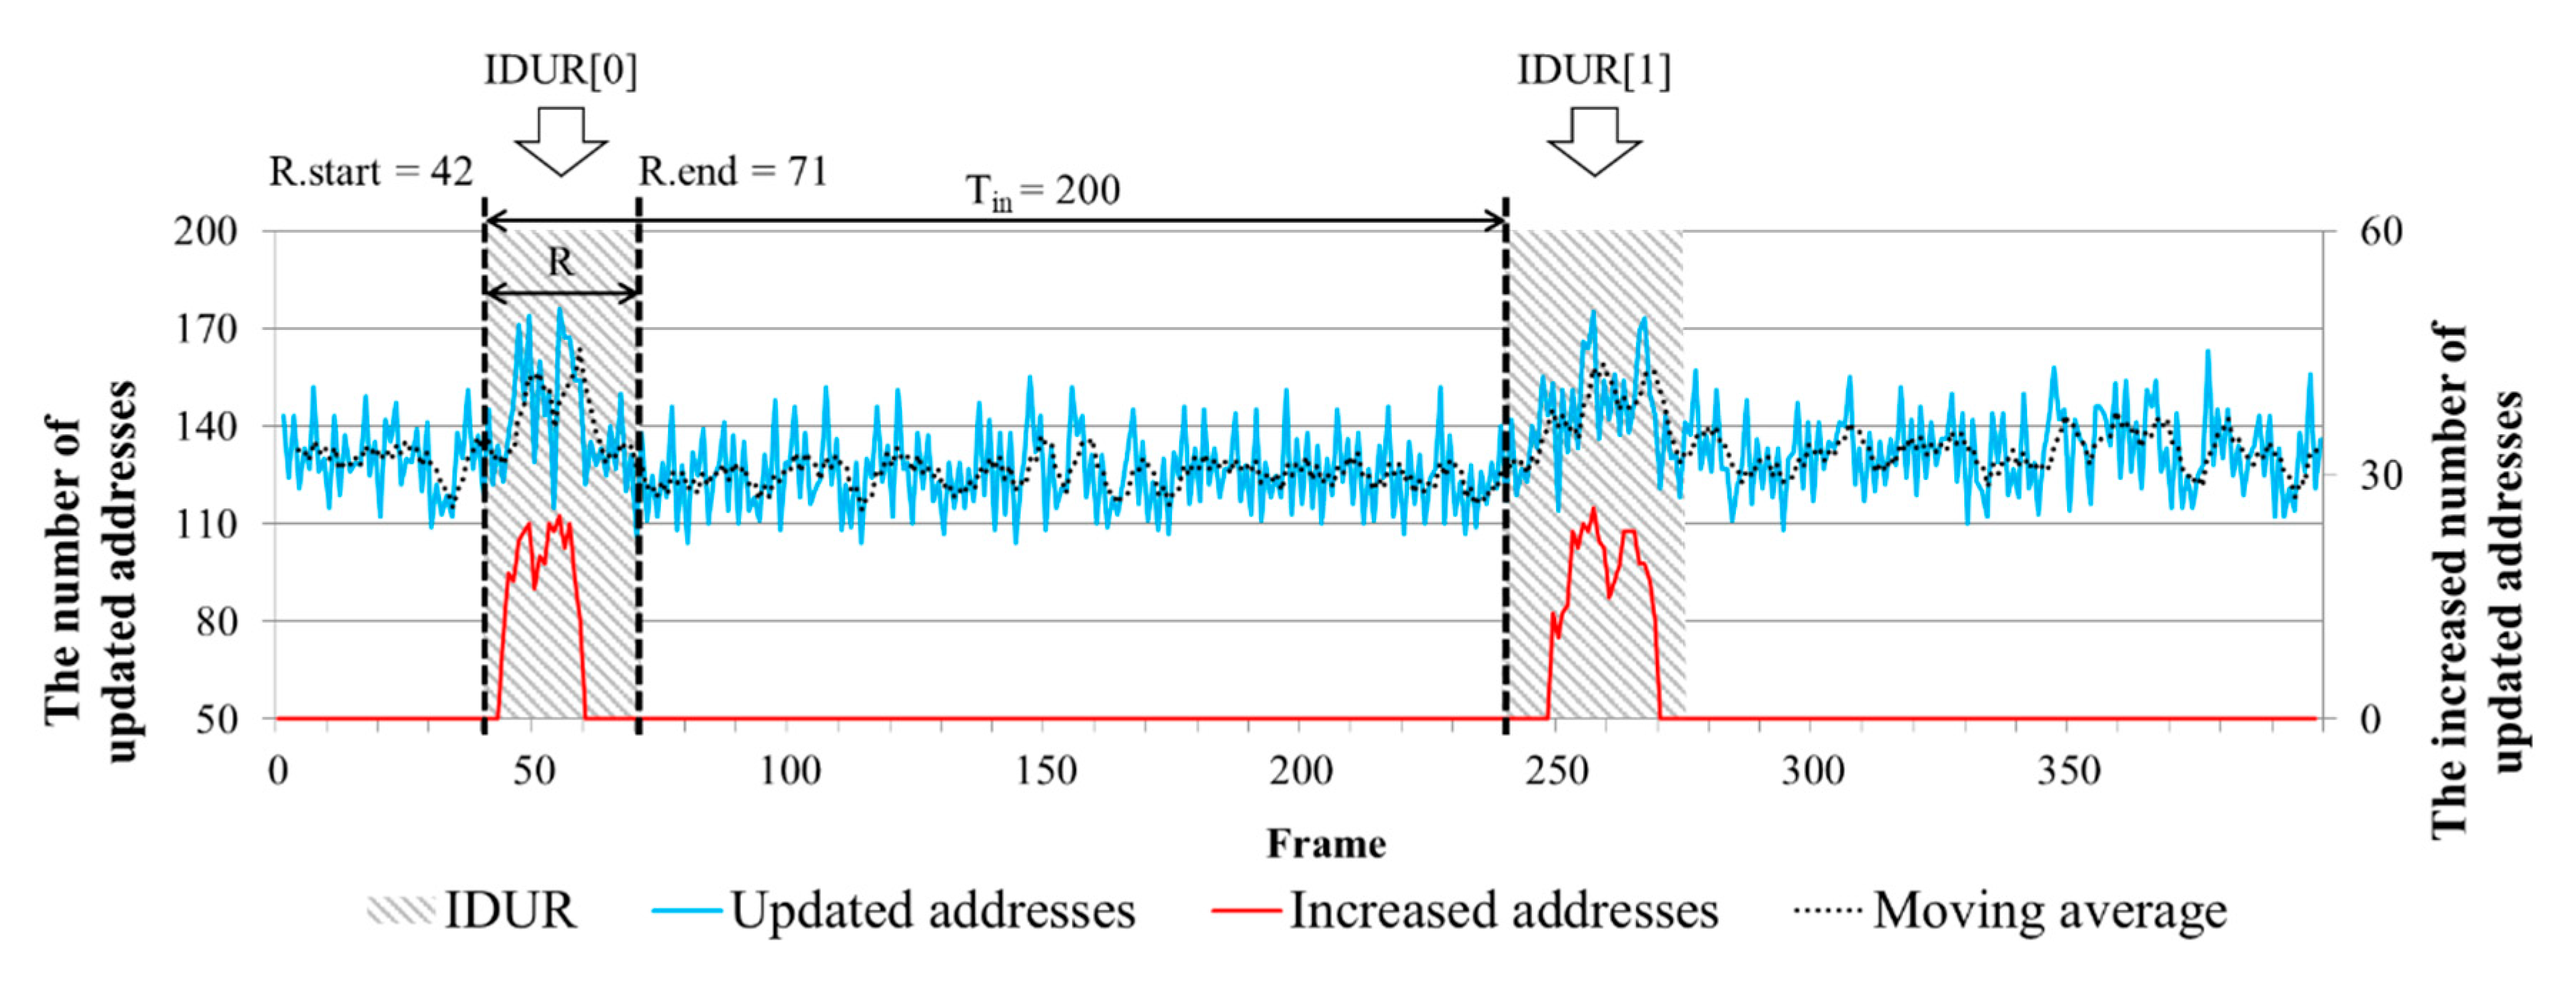
Now, we have to focus on reducing the number of the captured memory frames. Because we use the MUI, we do not need entire frames that are periodically collected. In Figure 3, the third step identifies the Input-Driven Updated Range (IDUR). When the software is executed, the footprint remains in memory. The software is executed according to the input signal provided by the simulator and input-driven output can be traced by analyzing the memory. In Reference [9], we proposed the IDUR identification method using a moving average technique and tracing the trend of updating memory through the entire frames. However, it is difficult to obtain the exact updated range because it is identified only by trend without precise criteria. Thus, we propose a new algorithm that can improve the method of IDUR identification to obtain an exact range. Figure 7 compares the IDUR identified by the existing moving average method of [9] and the proposed method.
The blue line indicates the number of updated addresses throughout the frame and the dashed line shows the trend of the number using the moving average method. Looking at the 50th frame of the graph, you can see that the number of updated addresses increases and the number of updates increases again near the 250th frame after 200 frames (Tin = 200). This is obvious evidence that the input signal reflects the update of the memory value. Therefore, in order to handle only the data driven by the input, we need to find the exact range called IDUR. The algorithm of the proposed IDUR identification method is shown in Algorithm 2.
| Algorithm 2. The Algorithm for Input Driven Updated Range |
| INPUT: Nin, Number of Input, Tin, Input Interval OUTPUT: IDUA, Input Driven Updated Address, IDUR, Input Driven Updated Range 1: MUF (α,R) ≡ the frequency of the MU(α,k) in R range 2: MU(α,k) ≡ the value of the address α changed in k-frame Set Input Driven Updated Address: 3: FOR each address α DO 4: if MUF(α,R) ≤ Nin then 5: if updated frames interval = Tin then 6: IDUA ← α 7: END FOR Identify Input Driven Updated Range: 8: FOR each input j of Nin DO 9: Kj ≡ {∀kj|MU(α, kj) = 1, α in IDUA} // 10: R.start ← min(Kj) // first updated frame of input number j 11: R.end ← max(Kj) // last updated frame of input number j 12: IDUR[j] = {index of IDUR, R.start, size of R range} 13: END FOR |
First, we find an address with MUF smaller than the number of inputs (Nin) written in the test script (line 4). Here, the interval of the updated frame is equal to the input time interval (Tin). That is, it finds an address that is updated at the same time interval of the input. We define a set of the addresses as Input-Driven Updated Addresses (IDUA) (lines 5–6). The identification method of IDUR is based on the order of the updated frames of the IDUA and determines the frame range from the first frame (R.start) to the last frame (R.end) of each order as the IDUR (lines 8–13). As a result, the IDUR identified by the proposed algorithm is determined as shown by the shaded area in Figure 7. Therefore, we can focus on only input-driven data by reducing the number of captured memory frames using the algorithm of IDUR identification.
4.3. Comparison of Difference between Memory Updates of Normal and Failed Operations
In the fourth step, the normal operation executed during the unit test is compared with the failed operation during the integration test. The memory usage pattern generated from the normal operation of each unit test has already been obtained through the previous steps. We define the IDUA of the unit test as functional symbols for the normal operation of the unit function. That is, the IDUA reacts directly when the function is activated by the input. Therefore, we can find the cause of the fault by observing the IDUA of the unit function within the IDUR of integration test. When analyzing the memory symbols, there are symbols required during the function operation, infrastructure symbols used for OS operation and communication and temporary symbols such as buffers and counters [24]. Therefore, the MUI of the integrated function is composed of IDUA of each unit functions and integrated function, the infrastructure symbols and the temporary symbols. If the integration test is operating normally, the IDUA of the unit function should behave similar to unit test.
As the fault candidates, we present the MUI of the IDUA identified in each unit function and the failed integration test. In Equation (6), we define the fault candidates (FC) as the MUI, which consists of the IDUAs within the frame range-IDUR, the address of the symbol, the update frequency and a set of values for each frame. The fault candidates (FC) are defined by Equation (6).
Finding fault using memory updated information has two implications. One is that the update is not made at the time when the update should be made. The other is that the update is made at the correct time but it is updated to the wrong value. Therefore, we proposed a two-step fault localization method using the fault candidates. The first step is to find the “not updated” symbols where the value of MUF is zero in IDUR. These symbols are symbols that are not used as the integrated function among the IDUA of the unit functions or are affected by the fault. The next step is to check the revised value of the updated symbols whose MUF is one or more in the IDUR. Based on the value, you can check which symbol has been updated to the incorrect value. In other words, it is possible to find faults by first identifying symbols that are not updated and then by identifying the cause of the failure operation with the changed values of the updated symbols.
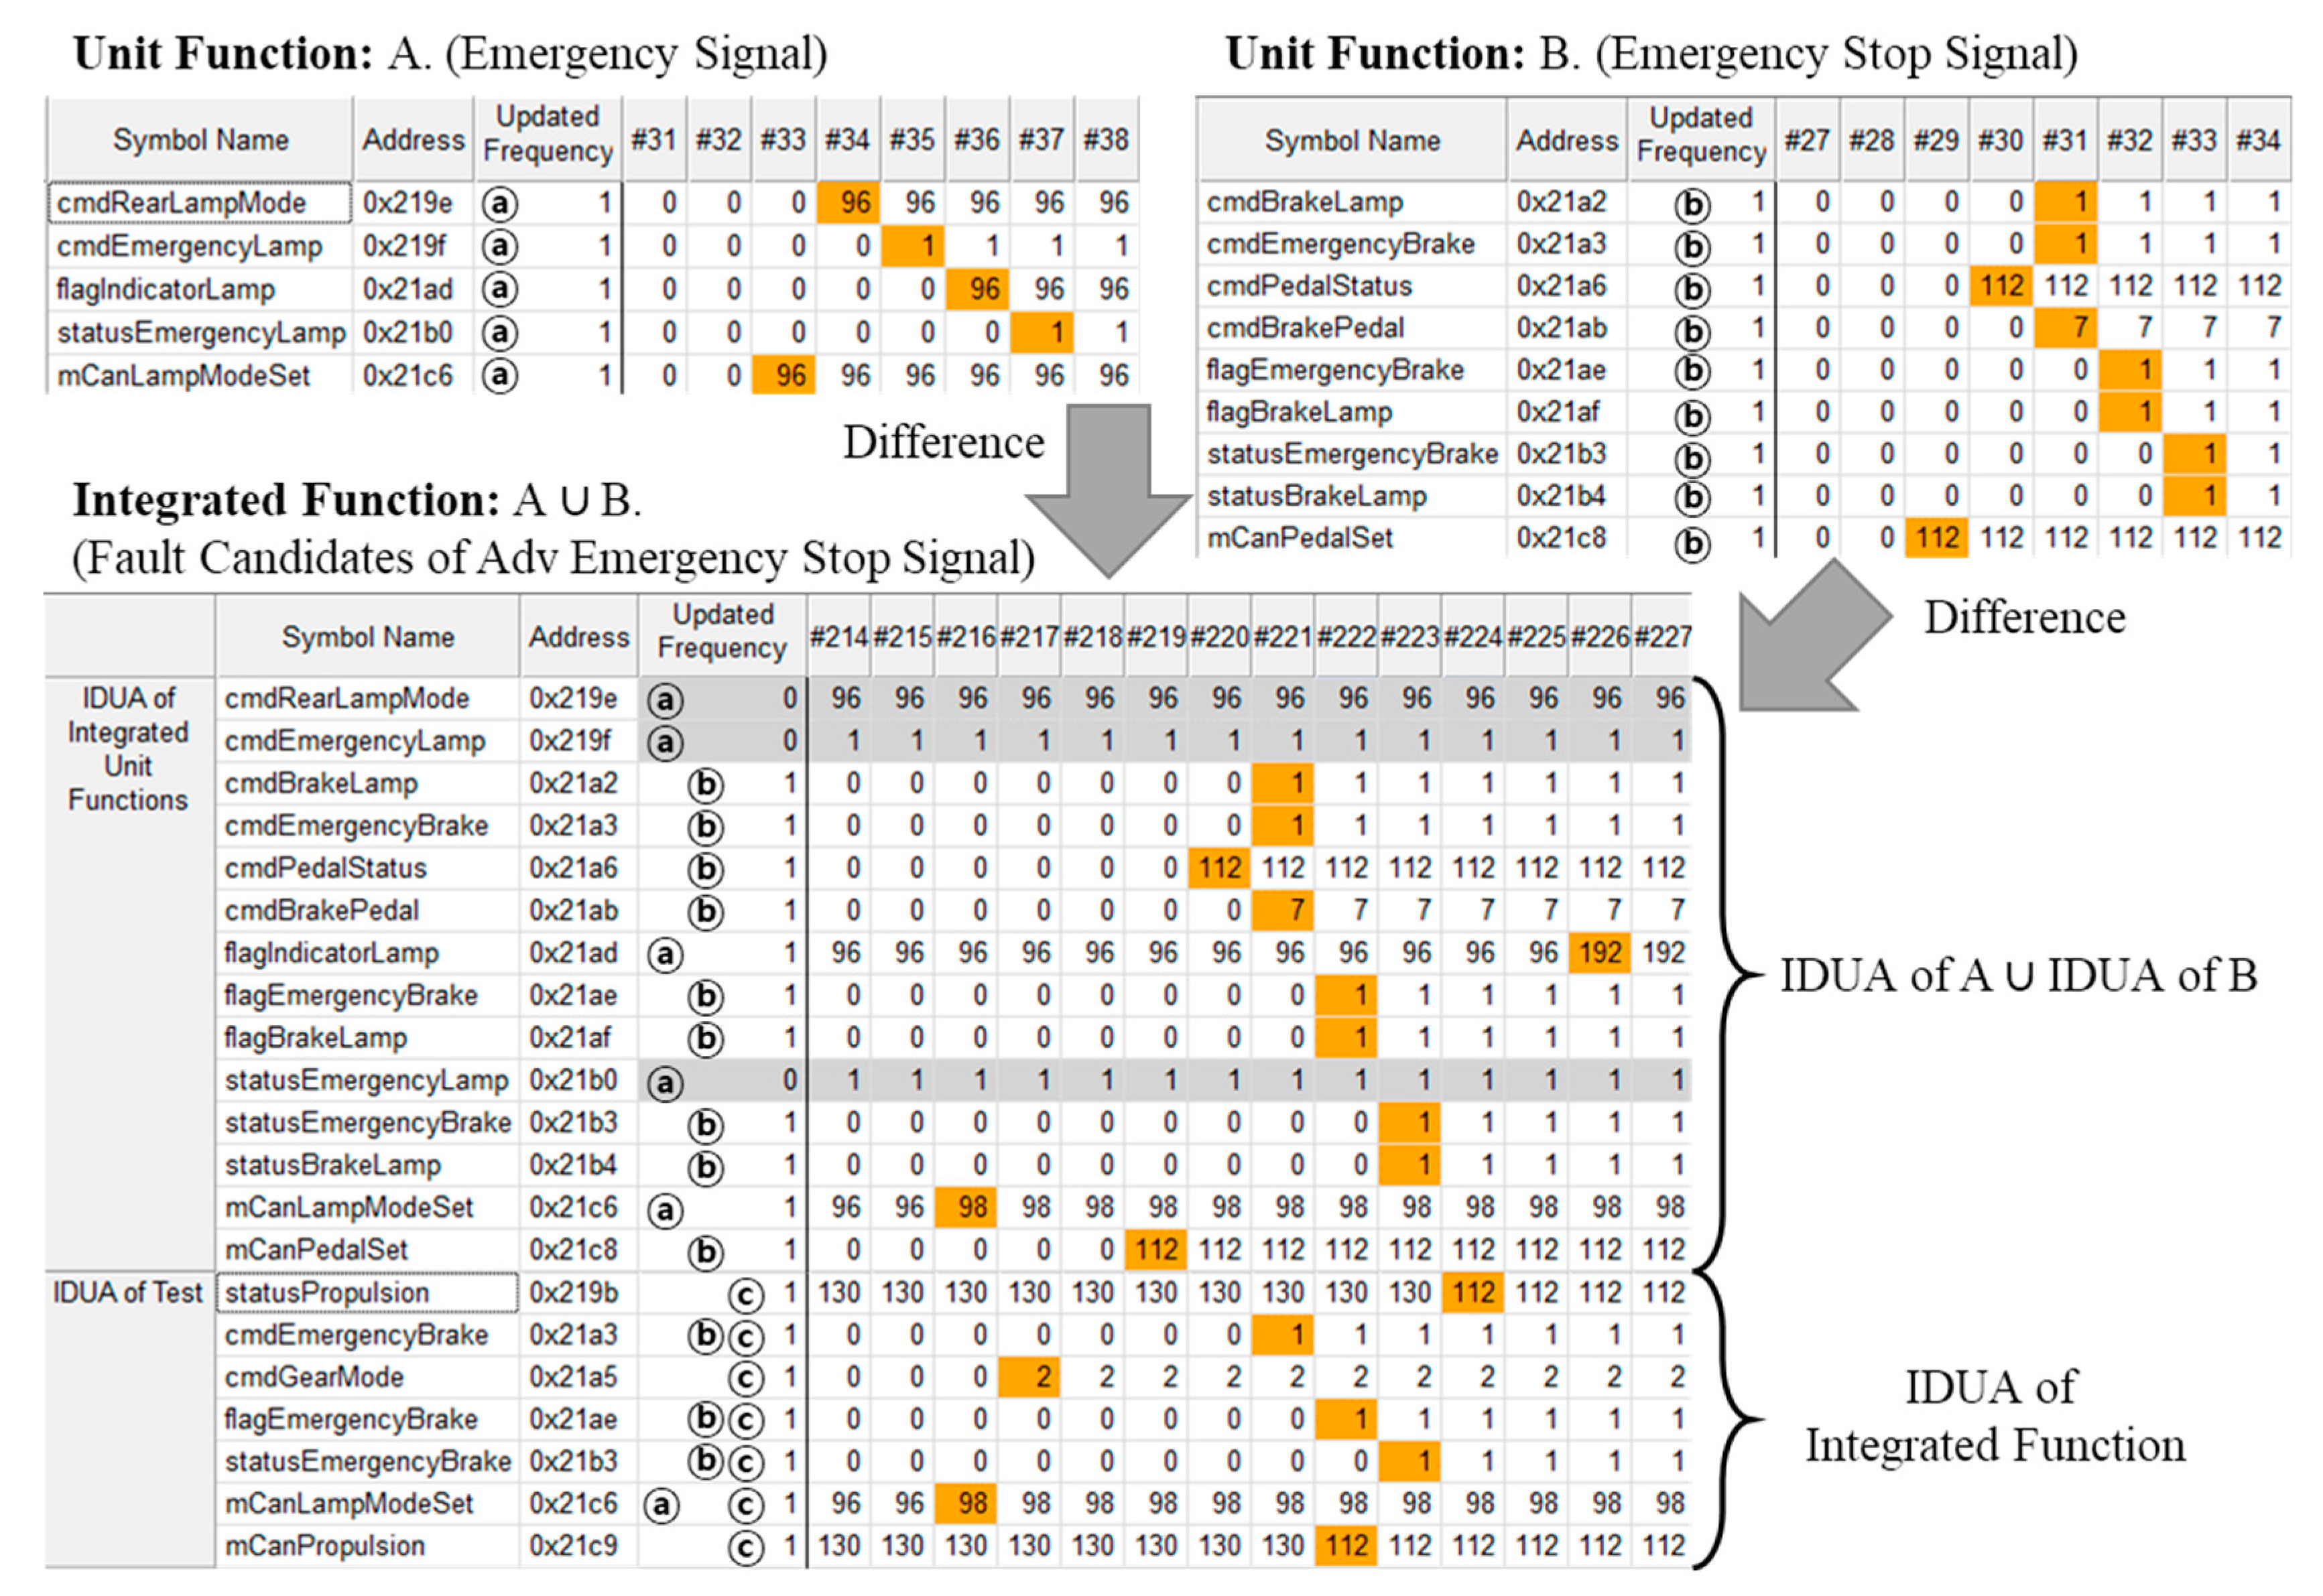
For example, the “Emergency Stop Signal” (ESS) is a function that quickly flashes the brake lamp in an emergency stop situation. Specifically, the “Advanced ESS” (Adv ESS) is connected to the function that automatically turns on the emergency lamp when the vehicle is completely stopped. At this time, the “Adv ESS” consists of an integrated function of “ESS” and “Emergency Signal”. Therefore, by observing the IDUA of the integrated function, the cause of the fault in the “Adv ESS” can be found. Figure 8 presents an example of fault candidates for the “Adv ESS”. It shows the MUI for the IDUA of each “Emergency Signal” and “ESS” from the top of Figure 8. Each IDUA (from function A and B) is updated in order of the cmd* symbol, the flag* symbol and the status* symbol after the update of the mCan* symbol. Figure 8 also shows fault candidates for the integrated functions. The cells highlighted in yellow are the values that have changed in the address and the symbols highlighted as the shaded bars are the symbols that were not updated. The FC contains the union of IDUA of each unit function and the symbols belonging to each unit function are marked as ⓐ and ⓑ. Among these symbols, the symbols marked with ⓑ have been similarly updated for unit B and the integrated function but the symbols with ⓐ marks are not similar. There are symbols highlighted by the shaded bar in the symbols marked ⓐ and when you look at the highlighted cell of the symbol, you can see that the value of flagIndicatorLamp has been changed from 96 to 192. Therefore, the “ESS” (function B) is operated normally but it can be seen that a fault has occurred by connecting to the “Emergency Signal” (function A).
5. Evaluation
In this section, we evaluate the proposed method in both environments. First, a fault is injected into the HiL test environment of the OSEK/VDX-based ECU using the mutation technique and it is confirmed that the fault is included in the fault candidates. In addition, we analyze fault candidates for two types of faults: fixed (called “not updated”) symbols and invalid values. Next, it also evaluates whether the fault candidate includes the cause of failure when applying a warning test for seat belt usage, which is a failed test case of BCM.
5.1. Testbed for Fault Injection
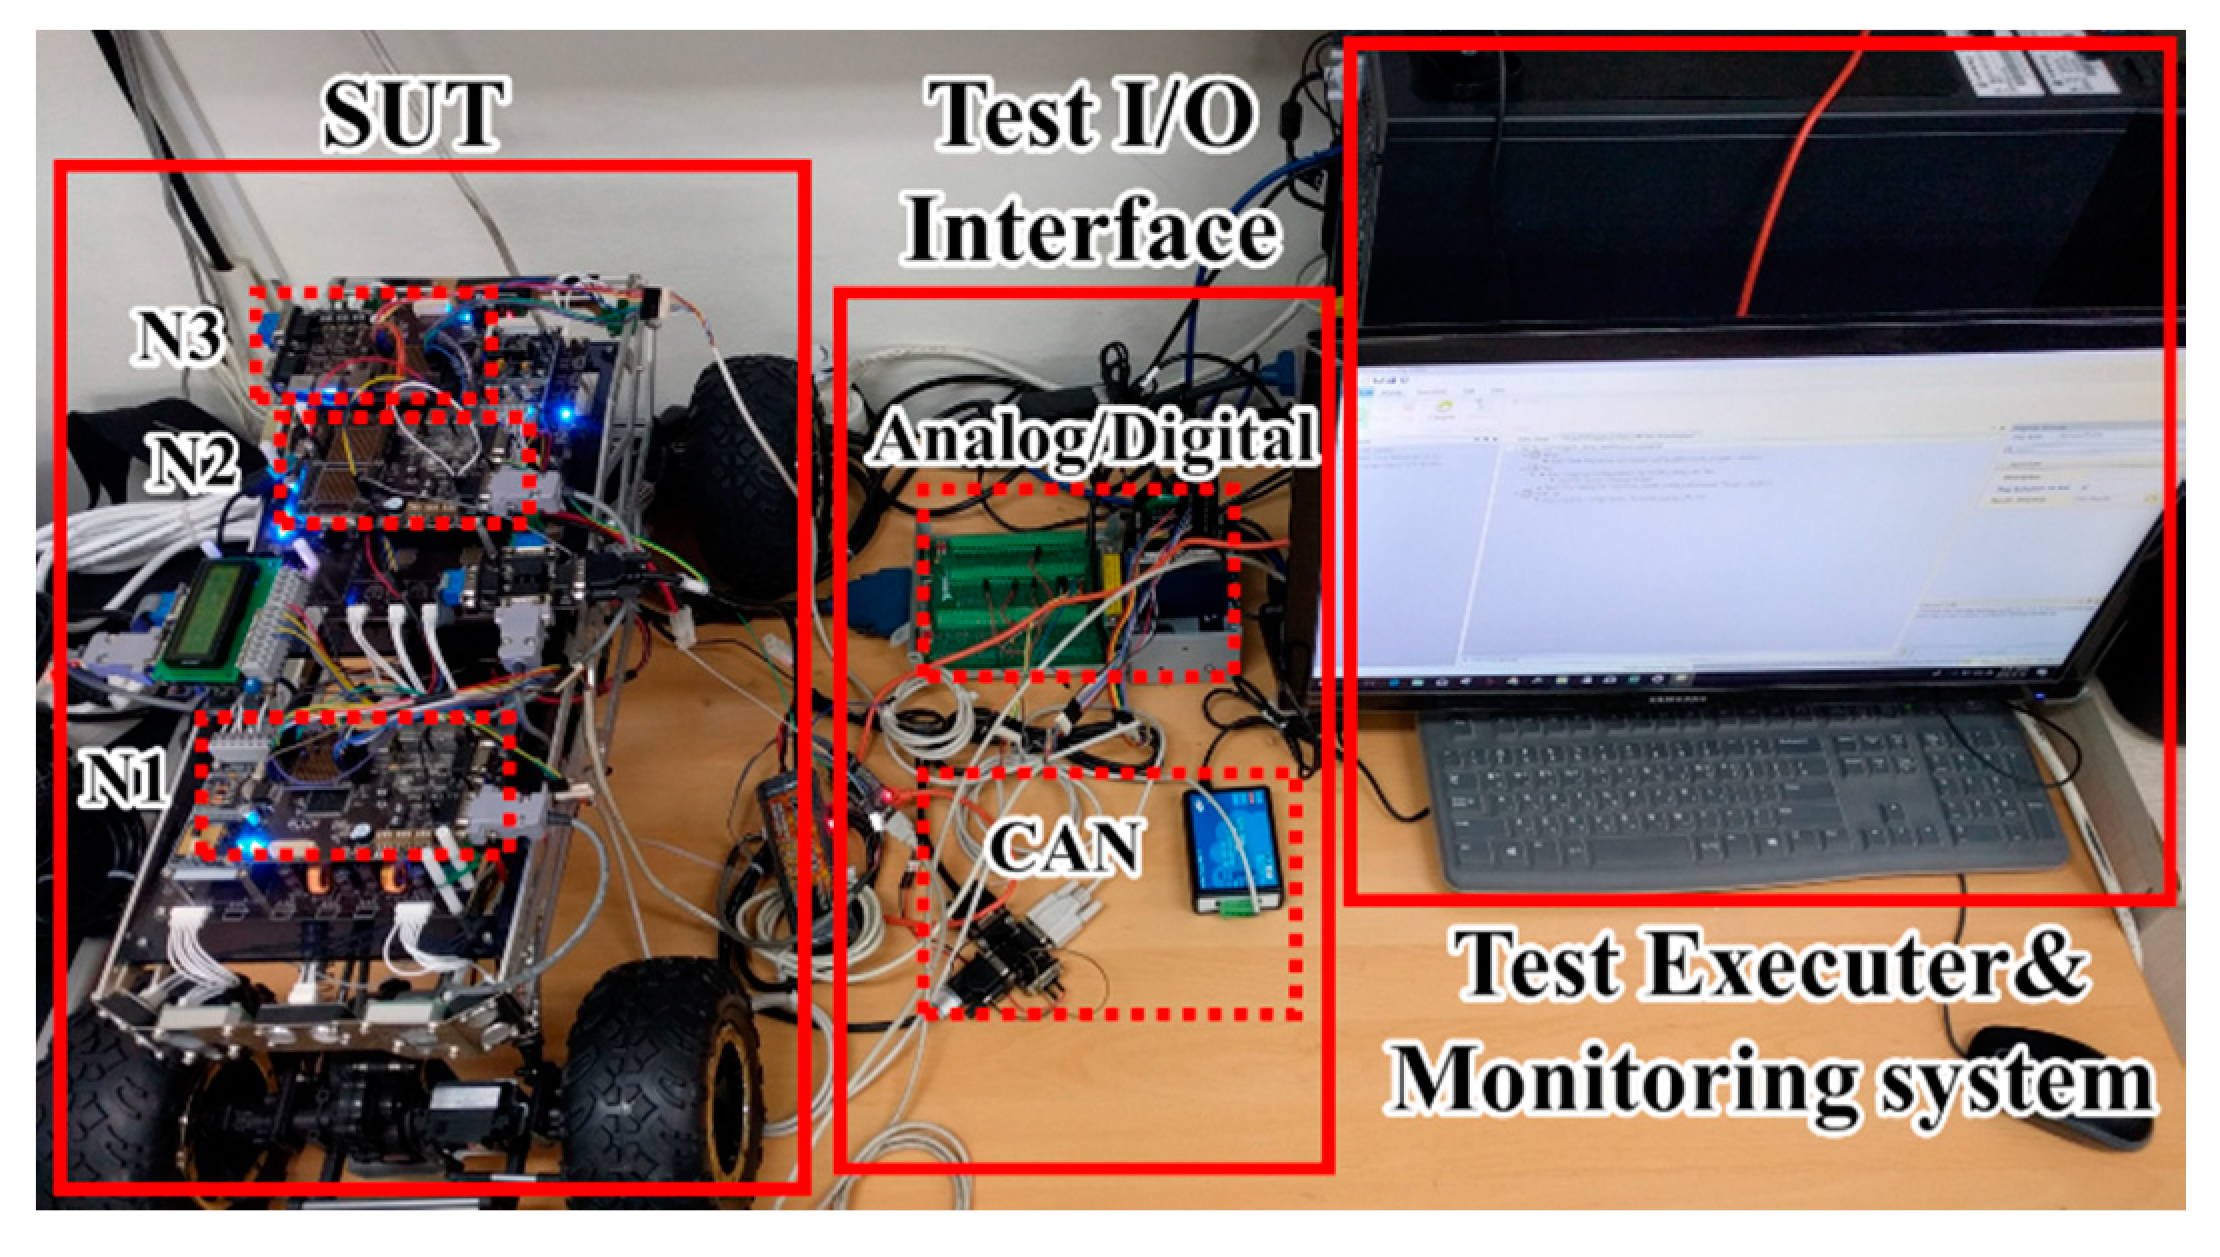
For the evaluation, we have constructed the SUT with an NXP MC9S12X [25] family ECU and OSEK/VDX-based SW. Figure 9 shows the HiL environment used for testing. As shown in the figure, the environment consists of an SUT with three ECUs, a test executor, a test interface and a monitoring system that collects and stores memory. Consisting of three separate ECUs, the SUT has 10 unit functions that handle steering and forward functions (N1), communication and vehicle propulsion (N2) and peripheral sensing and rearward functions (N3). Therefore, the memory region used by each unit function is statically allocated to each node.
The fault is injected by the mutation method [26]. Because the proposed method targets faults after a successful unit test is completed, the fault to be injected must pass the unit test but fail the integration test. In Table 2, the 80 C language mutation operators are classified according to their applicability to each function and the passage of the unit test is confirmed. Table 3 shows the faults injected for each function. In Table 3, we did not use VTWD and ORRN for fault injection. VTWD mutates the variable by adding or subtracting 1, so the result is similar to CGCR. ORRN mutates a relational operator in an “if” statement and behaves similarly to a STRI that forces the state in an “if” statement. Therefore, among all mutation operators, operators with similar operations are not applied. Table 4 summarizes the mutation operators used in the experiments [26].
5.2. Experimental Result
Through an example of localizing the injected faults, we show how to find faults using our proposed method and evaluate the result based on the localization rate of the fault candidates. First, we analyzed the memory-updated information from unit test of the “Left-Turn Signal” function. Next, we test for a fault in both cases (fixed symbols and invalid values) at fault index #1 and #12 of Table 3. Finally, we evaluate the experimental results as the ratio of localization. The data used in the experiment is provided as Supplementary Material.
5.2.1. Memory-Updated Information of Unit Test
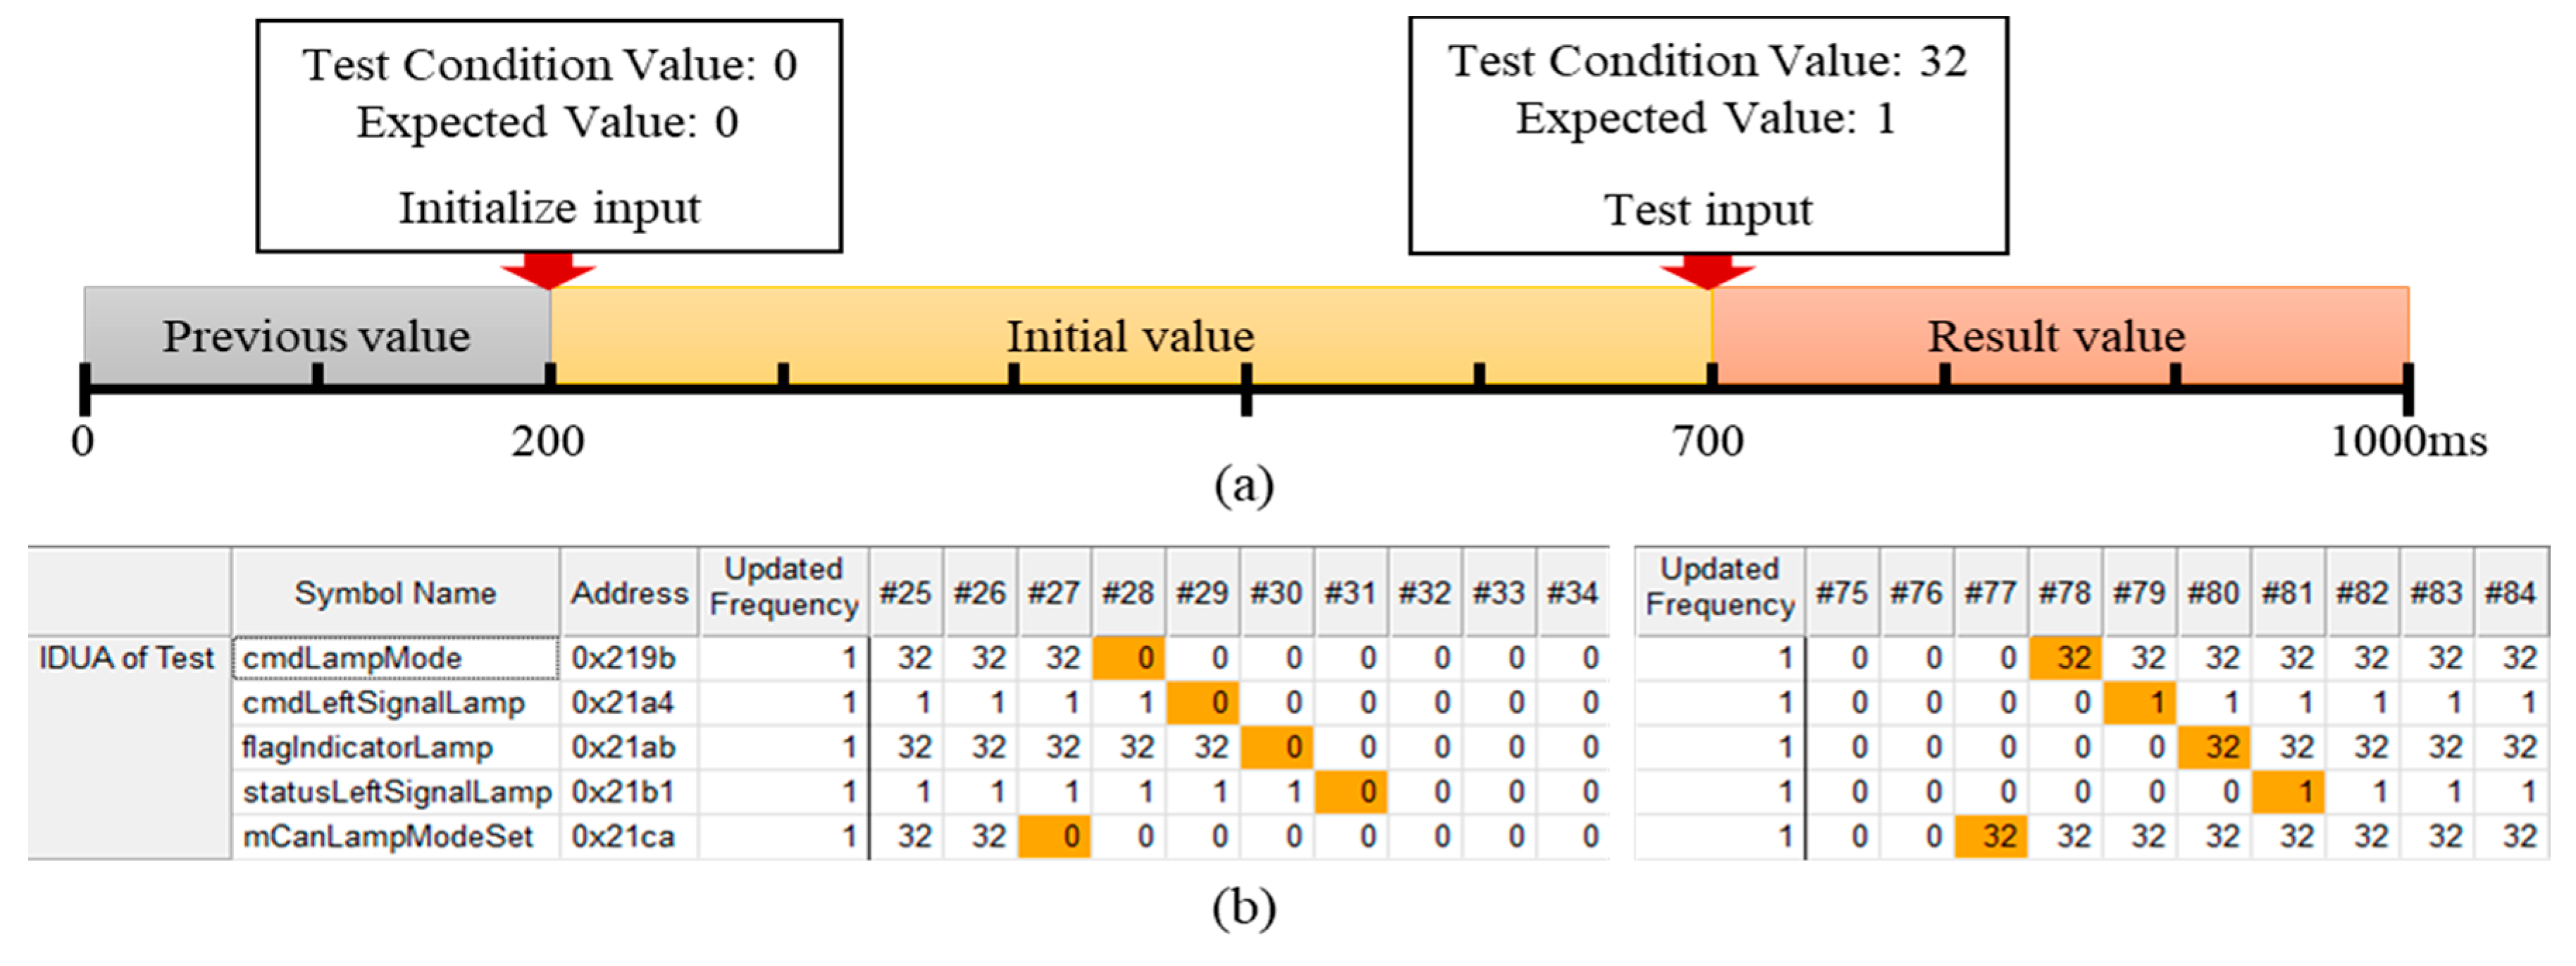
The experiment performs according to the process of illustrated in Figure 3. First, a unit test is performed to check whether a function is normally operated. The unit test sets inputs for initial state setting and functional testing and confirms that the function normally operates. The updated information is analyzed by the collected memory data of unit test. At the same time, the test specifications are analyzed in the test script and include the test conditions, expected values and time intervals between inputs. IDUR is identified using memory-updated information and test specifications. Refer to Figure 10a. “Left-turn Signal” initializes as 0 at 200 ms and inputs to a test condition value (input value) of 32 at 700 ms. If the left signal lamp changes from 0 to 1 (the expected value), it is determined to be normal. In (b) left, mCanLampModeSet is initialized as 0 from frame number #27, then the values of the other symbols are updated in order. The statuslLeftSignalLamp is initialized as 0 from frame number #31. In (b) right, mCanLampModeSet is updated from #77 as 32 to the test condition value and is sequentially updated until #81 and the statusLeftSignalLamp is output as 1, which is the same as the expected value. Because the SUT and the simulator are not synchronized, the timestamp of the test specification and the updated frame number of the MUI may be different. However, the input time difference between the test specification (500 ms) and the MUI (50 frames) is the same (one frame is 10 ms).
5.2.2. Finding the Fault by the Fixed Symbols (in the Case of the Fault Index #1)
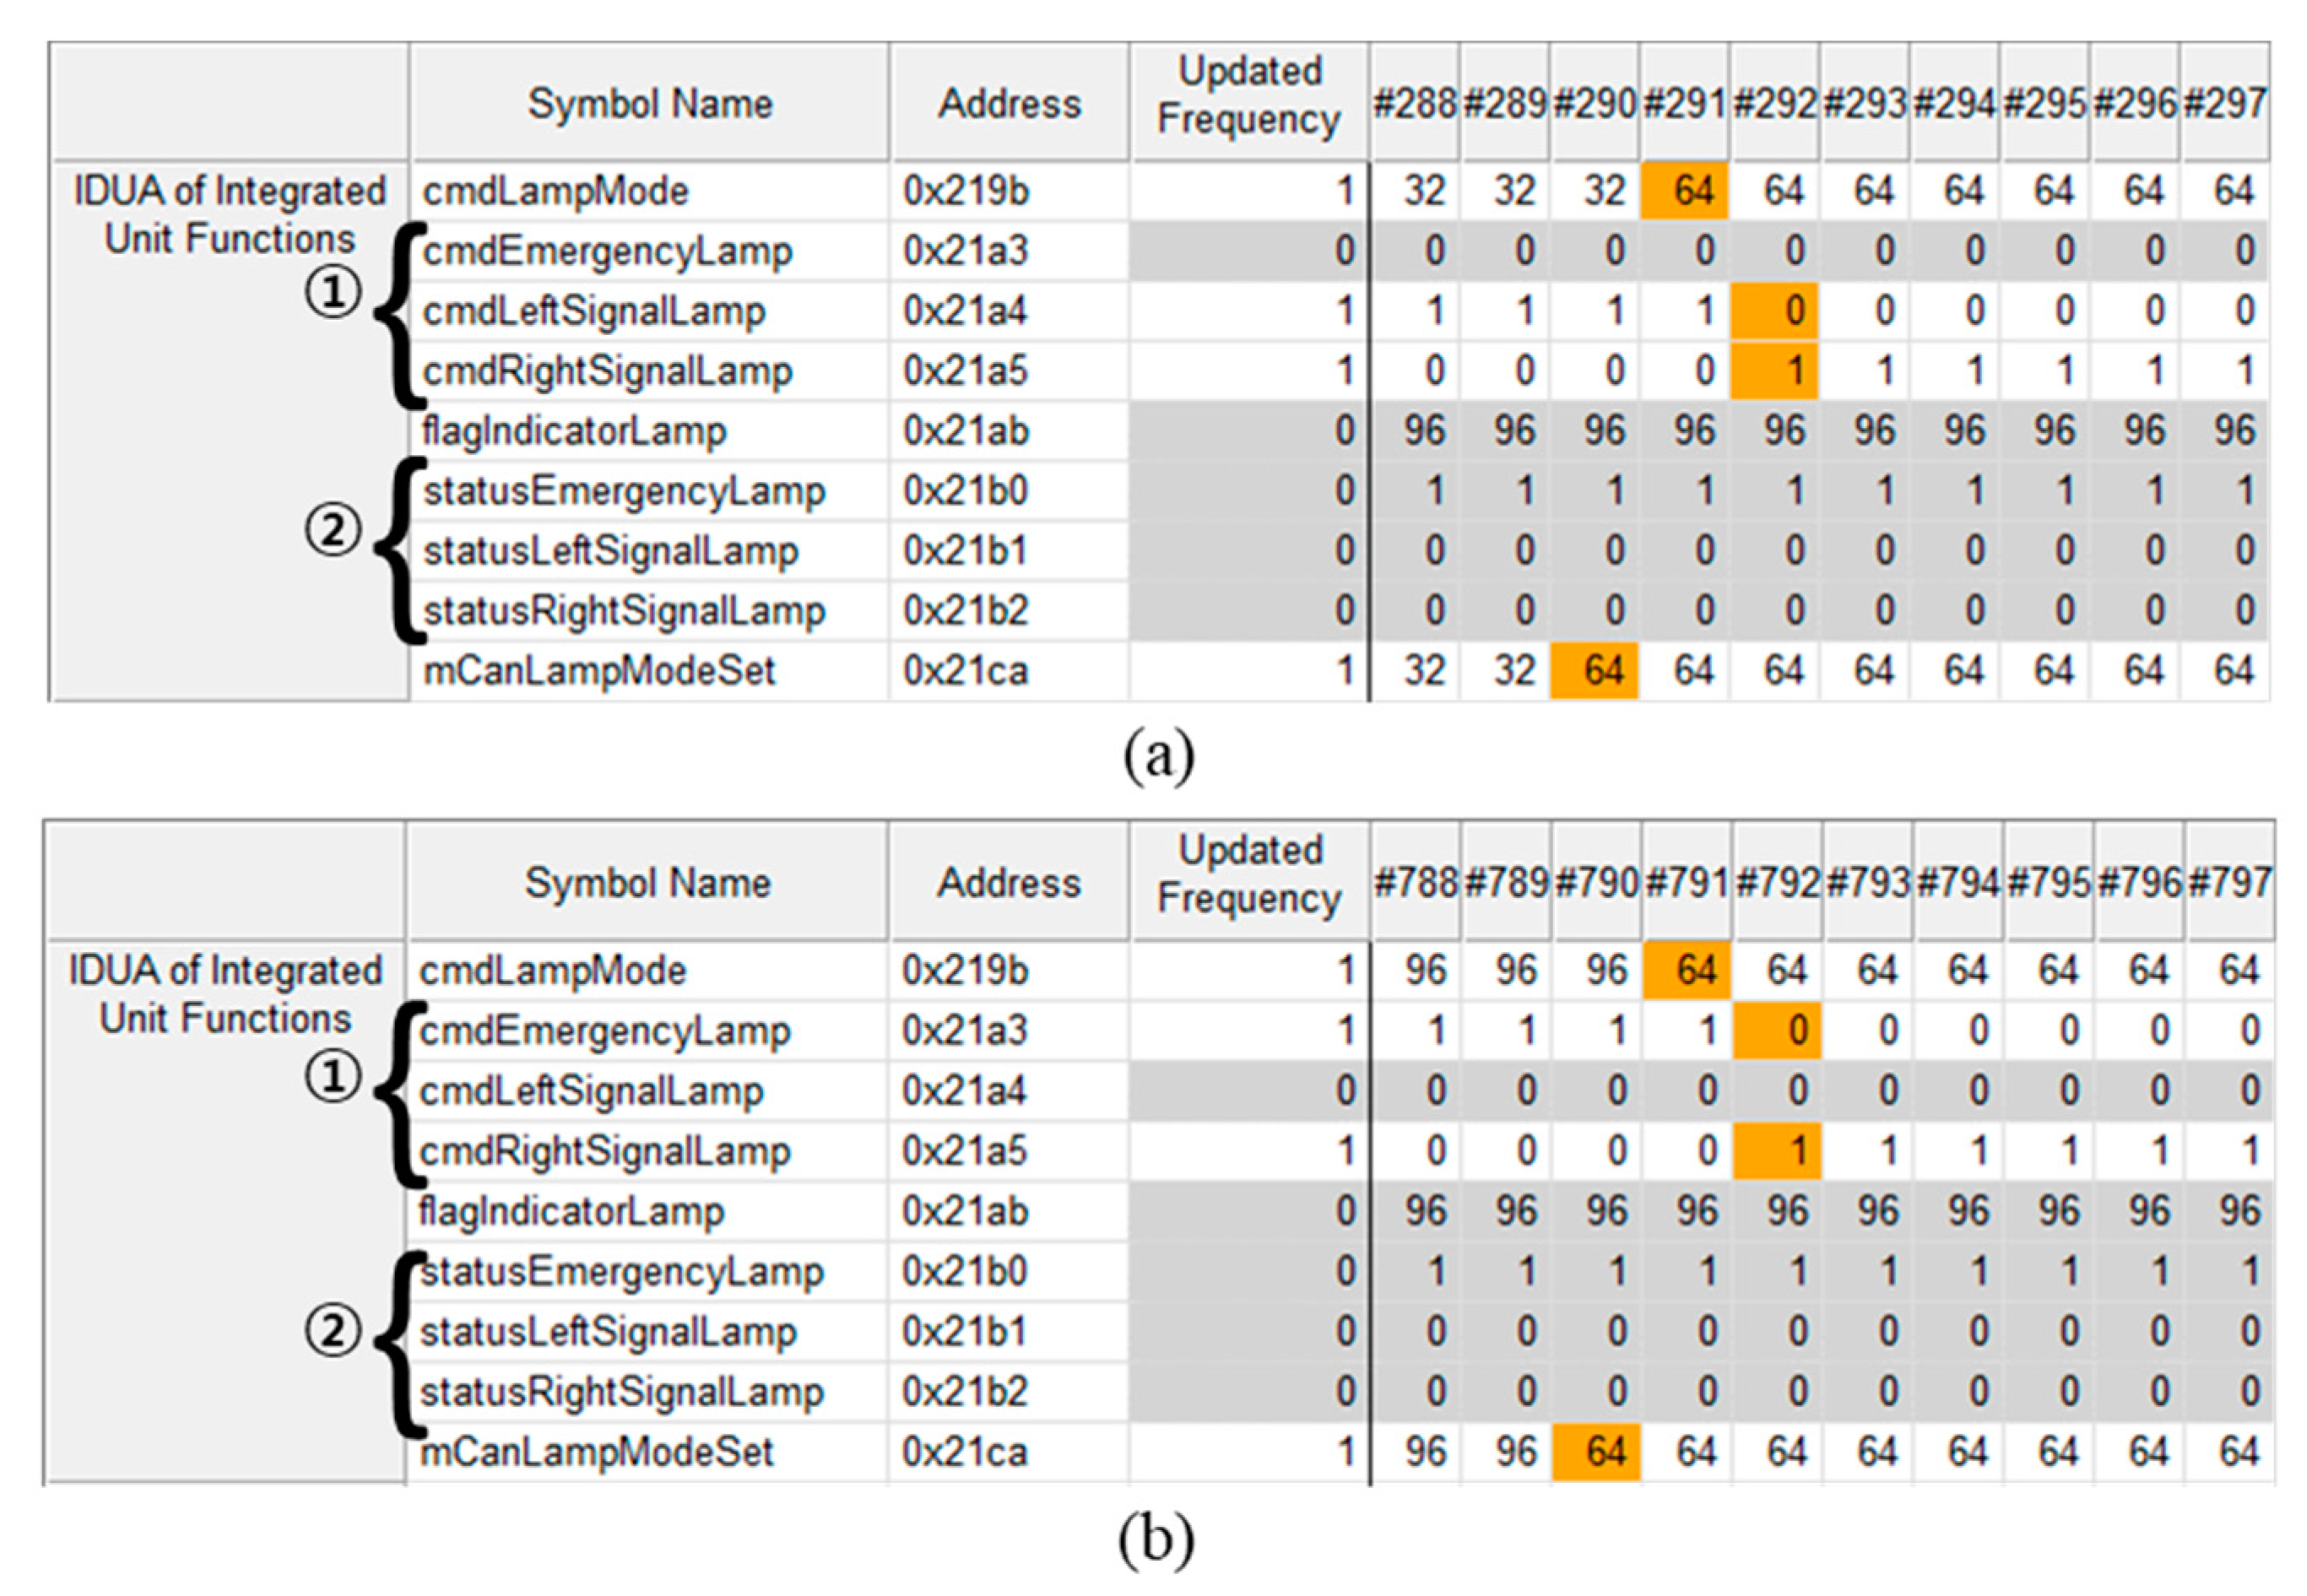
This fault means that the symbols required to be updated by function operations are not updated. In Table 3, the fault index #1 causes the “Front Turn Signal” function to the malfunction due to a consecutive command. The “Front Turn Signal” has three unit tests as left, right and emergency lamp. Therefore, the fault candidates include the IDUA of three unit tests. Figure 11 shows the fault candidates of the fault index #1. In (a), it switches from “Left Turn Signal” into “Right Turn Signal,” and (b) switches from “Emergency Signal” into “Right Turn Signal” (i.e., mCanLampModeSet: in (a), 32 → 64 and in (b), 96 → 64). The test condition values are input in #290 and #790, respectively and have to be updated in the same order as the IDUA of unit test but the flagIndicatorLamp is not updated. When cmdLeftSignalLamp of ① in (a) or cmdEmergencyLamp of ① in (b) is changed to 0, cmdRightSignalLamp is changed to 1 but all status* symbols of ② are not updated. This shows that there is a malfunction in flagIndicatorLamp between ① and ②. The fault index #1 uses OBEA to mutate the assignment operator into a bitwise assignment operator (see the Table 3). Therefore, if a new value comes in when a value already exists, the “|=” operation is performed and it malfunctions.
This fault was found in the test that gave the 12 consecutive commands for 8 s. Of the 3714 addresses allocated on N1 (see the Figure 9, Node of handle steering and forward functions), this test has 187 memory addresses updated. Of the 187 updated memory addresses, the fault candidates that the developer has to check include only nine memory addresses (9-IDUAs of Figure 11). Moreover, without checking a total of 800 frames (generated during 8 s), this test only checks 120 frames, using IDUR for each of the 12 inputs. In summary, developers can find the fault by checking the value at IDUR for 4.8% of the total memory symbols used. The fault localization ratio can be defined by Equation (7).
5.2.3. Finding the Fault by the Invalid Values (in the Case of the Fault Index #12)
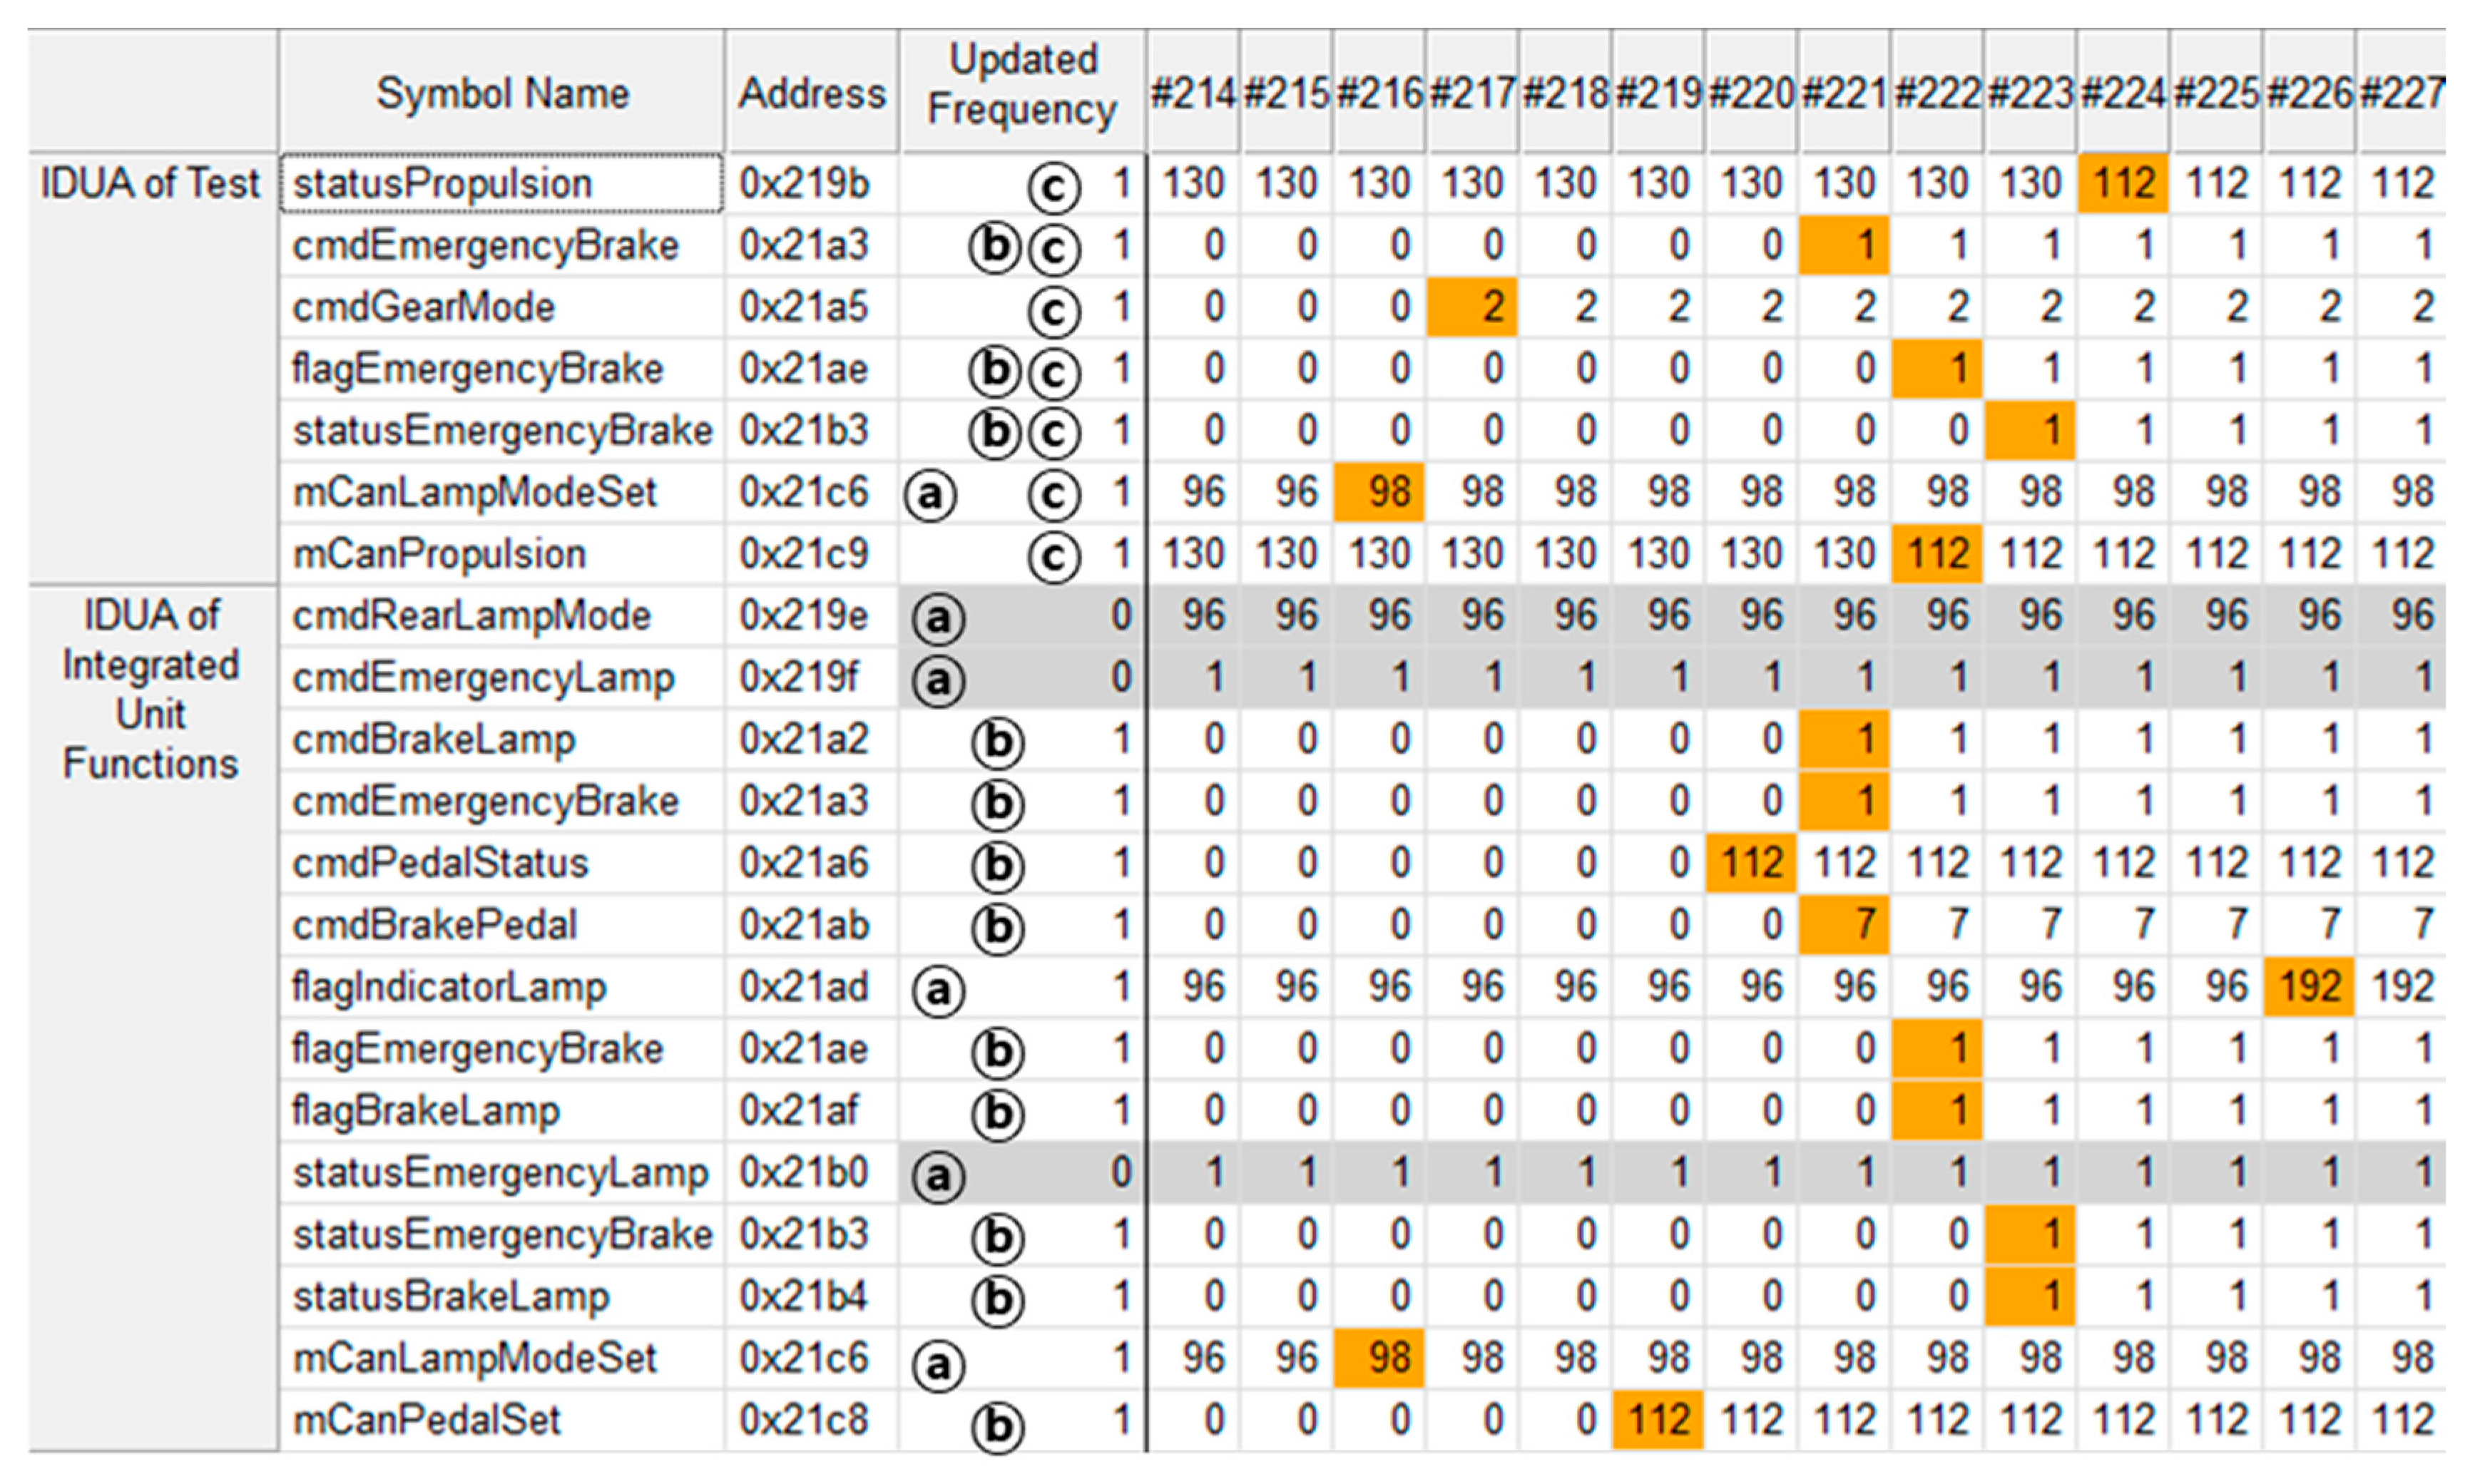
This fault means that the symbols required for function operations are updated with an incorrect value. In Table 3, the fault index #12 is a malfunction due to the existing command state. If “Adv ESS” is activated while the turn signal is on, it is malfunctioning. Figure 12, which shows the fault candidates of fault index #12, can find signals and reasons for the failure. “Adv ESS” turns the “Emergency Signal” on when the car stops after the “ESS” has been activated. In the figure, ⓐ is the IDUA of unit test of the “Emergency Signal,” ⓑ is the IDUA of unit test of the “ESS,” and ⓒ is the IDUA of integration test of the “Adv ESS.” At this point, the three symbols related to the “Emergency Signal” of ⓐ are highlighted by the shaded bar. It can be assumed that a fault has occurred in the symbol associated with the “Emergency Signal.” In the fault index #1, the front turn signal acted as an “Emergency Signal” when the flagIndicatorLamp showed 96. However, after statusPropulsion is updated to 112 at frame number #224 (after the vehicle has stopped), flagIndicatorLamp is updated to an incorrect value of 192 at frame number #226.
5.2.4. Result
We applied our proposed method to the other 10 indexed faults in Table 3. As a result, we could find all the causes of the faults injected by reviewing the presented fault candidates. The results of the experiment are summarized in Table 5. As a result of the fault injection experiment, we could find the cause of the fault by only checking 5.77% of the updated symbols on average.
The proposed method is applied not only to our test bed but also to the commercial BCM seatbelt warning test. The BCM used in the experiment is an OSEK/VDX-based OS and is an SPC5604B BOLERO [27] -based ECU. The experiment dumped 29.4 kB of memory in the same 10 ms cycle as the system main task [9]. In this experiment, 1019 addresses were updated between the total 29.4 kB of allocated memory. Among them, 87 candidate symbols are localized and the localization rate is 8.54%. The previous method suggests fault candidates as the suspect region within the updated memory region rather than the address level. Therefore, the reduction rates (size of fault candidate region/size of the updated memory region) of fault candidates on average were about 22.42% (2 kB/8.7 kB) and about 19.21% (4.7 kB/24 kB). This shows a significant performance improvement when compared to the existing result [9].
As a result, the proposed method was localized at an average of 5.77% in the test bed and 8.54% in the commercial BCM. Experiments were performed on two types of ECUs running different OS that conform to the OSEC/VDX standard. The MC9S12X is 16-bit and the SPC5604 is a 32-bit micro controller, which differs in terms of core family [24,26]. Nevertheless, when we experimented with the proposed fault localization process, we could derive the fault candidates, including the cause of fault, by analyzing memory usage. This shows that the proposed method is applicable to ECUs based on OSEK/VDX. In other words, the memory usage related to the failed operation can be presented as debugging information through the memory usage in the normal operation for finding the fault occurring in the HiL test environment without the debugging tool or the source code. However, the proposed method has limitations in the case of a signal that processes the continuous values like analog signals, when the update does not have a significant meaning.
6. Conclusions
In this paper, we proposed a fault localization method for automotive software in an HiL environment by comparing updated memory between the passed unit test and the failed its integration test. Our proposed method collects memory by dumping it based on the main task cycle during an HiL test. By analyzing the updated information in the collected memory, we can identify the input-driven updated address (IDUA). The fault candidates are localized by comparing the memory-updated information of the failed integration test based on the IDUA identified during the successful unit test. As an experimental result, the fault candidates were localized to 5.77% in the test bed and 8.54% in the commercial BCM. This means that if 100 symbols are used in an integration test, the developer can debug by checking only 6 or 9 symbols.
The advantages of the proposed method are as follows. First, fault localization is possible in a black box environment where the source code is difficult to use. Traditional fault localization methods based on source code are difficult to apply to a black box environment but the proposed method is applicable without source code. Second, debugging information can be obtained without using existing debugging tools. The proposed method can dump the memory for each main task cycle of the system and observe the state change over time. Therefore, it is possible to obtain information in a similar fashion to that achieved by observing a system using existing debugging tools. Third, fault localization is possible without having the background knowledge of a developer because a failed signal can be found using normal operating information as criteria. The proposed method utilizes a unit test to obtain the memory usage information during normal operation and then uses it as a criterion to localize the faults. Therefore, our proposed method can reduce the debugging time invested by developers by providing fault candidates based on the memory-updated information without the source code and existing debugging tools.
Our method has a limitation for signals that are continuously changing, such as analog signals for which the update is less meaningful. However, it is powerful for discrete signals such as digital I/O. We also believe that the highlight of the table that presents the fault candidates is that it can convey information visually. Therefore, we plan are in the study to locate the faults through the visualization of MUI tables.
Supplementary Materials
A sample data is available online at maria DB (IP: 202.30.11.110: 3306/ID: applied/Pass: guest).
Author Contributions
J.-W.L. conceived and designed the experiments; J.-W.L. and K.-Y.C. analyzed the data; K.-Y.C. performed the experiments, contributed analysis tools and wrote the paper.
Funding
This research was supported by Next-Generation Information Computing Development Program through the National Research Foundation of Korea (NRF) funded by the Ministry of Science, ICT & Future Planning (NRF-2014M3C4A7030504); and supported by the National Research Foundation of Korea (NRF) grant funded by the MSIP (NRF-2016R1A2B1014376).
Conflicts of Interest
The authors declare no conflict of interest.
References
- Zhang, H.; Li, W.; Chen, W. Model-based hazard analysis method on automotive programmable electronic system. In Proceedings of the 3rd International Conference on Biomedical Engineering and Informatics (BMEI), Yantai, China, 16–18 October 2010; pp. 2658–2661. Available online: https://ieeexplore.ieee.org/document/5639860 (accessed on 5 November 2018). [CrossRef]
- Köhl, S.; Jegminat, D. How to Do Hardware-in-the-Loop Simulation Right. SAE Technical Paper, No. 2005-01-1657. 2005. Available online: https://www.sae.org/publications/technical-papers/content/2005-01-1657/ (accessed on 5 November 2018).
- Choi, E.M.; Seo, K.I. An Experiment of Traceability-Driven System Testing. J. Inf. Process. Syst. 2008, 4, 33–40. Available online: http://koreascience.or.kr/article/ArticleFullRecord.jsp?cn=E1JBB0_2008_v4n1_33 (accessed on 5 November 2018). [CrossRef] [Green Version]
- Choi, K.-Y.; Seo, J.; Jang, S.; Lee, J.-W. HiL testing based fault localization method using memory update frequency. In Advances in Computer Science and Ubiquitous Computing; Springer: Singapore, 2015; pp. 765–772. Available online: https://link.springer.com/chapter/10.1007%2F978-981-10-0281-6_108 (accessed on 5 November 2018).
- Vermeulen, B. Functional debug techniques for embedded systems. IEEE Des. Test Comput. 2008, 25, 208–215. Available online: https://ieeexplore.ieee.org/document/4534159 (accessed on 5 November 2018). [CrossRef]
- Gomez, M. Hardware-in-the-Loop Simulation. Embed. Syst. Program. 2001, 14, 38–49. Available online: http://www.jmargolin.com/uavs/jm_rpv2_npl_14.pdf (accessed on 5 November 2018).
- Wong, W.E.; Gao, R.; Li, Y.; Abreu, R.; Wotawa, F. A survey of software fault localization. IEEE Trans. Softw. Eng. 2016, 42, 707–740. Available online: https://ieeexplore.ieee.org/document/7390282 (accessed on 5 November 2018). [CrossRef]
- Burdach, M. An Introduction to Windows Memory Forensic. Available online: http://users.du.se/~hjo/cs/dt2018/readings/week2/introduction_to_windows_memory_forensic.pdf (accessed on 5 November 2018).
- Kim, K.H.; Choi, K.-Y.; Lee, J.-W. Fault Localization Method by Partitioning Memory Using Memory Map and the Stack for Automotive ECU Software Testing. Appl. Sci. 2016, 6, 266. Available online: https://www.mdpi.com/2076-3417/6/9/266 (accessed on 5 November 2018). [CrossRef]
- Bringmann, E.; Andreas, K. Model-based Testing of Automotive Systems. In Proceedings of the 2008 1st International Conference on Software Testing, Verification, and Validation, Lillehammer, Norway, 9–11 April 2008; pp. 485–493. Available online: https://ieeexplore.ieee.org/document/4539577 (accessed on 5 November 2018). [CrossRef]
- Sudeendra Kumar, K.; Verghese, L.; Mahapatra, K.K. Fuzzy logic based integrated control of anti-lock brake system and collision avoidance system using can for electric vehicles. In Proceedings of the IEEE International Conference on Industrial Technology (ICIT 2009), Gippsland, VIC, Australia, 10–13 February 2009; pp. 1–5. Available online: https://ieeexplore.ieee.org/document/4939720 (accessed on 5 November 2018). [CrossRef]
- Srivasatav, M.; Singh, Y.; Chayhan, D.S. An Optimized Approach of Fault Distribution for Debugging in Parallel. J. Inf. Process. Syst. 2010, 6, 537–552. Available online: http://koreascience.or.kr/article/ArticleFullRecord.jsp?cn=E1JBB0_2010_v6n4_537 (accessed on 5 November 2018). [CrossRef]
- Jones, J.A.; Harrold, M.J.; Stasko, J. Visualization of test information to assist fault localization. In Proceedings of the 24rd International Conference on Software Engineering (ICSE 2002), Orlando, FL, USA, 19–25 May 2002; pp. 467–477. Available online: https://ieeexplore.ieee.org/document/1007991 (accessed on 5 November 2018). [CrossRef]
- Abreu, R.; Zoeteweij, P.; van Gemund, A.J.C. On the accuracy of spectrum-based fault localization. In Proceedings of the Testing: Academic and Industrial Conference Practice and Research Techniques—MUTATION, Windsor, UK, 10–14 September 2007; pp. 89–98. Available online: https://ieeexplore.ieee.org/document/4344104 (accessed on 5 November 2018). [CrossRef]
- Papadakis, M.; Le Traon, Y. Metallaxis-FL: Mutation-based fault localization. Softw. Test. Verif. Reliab. 2015, 25, 605–628. Available online: https://onlinelibrary.wiley.com/doi/abs/10.1002/stvr.1509 (accessed on 5 November 2018). [CrossRef]
- Hong, S.; Kwak, T.; Lee, B.; Jeon, Y.; Ko, B.; Kim, Y.; Kim, M. Museum: Debugging real-world multilingual programs using mutation analysis. Inf. Softw. Technol. 2017, 82, 80–95. Available online: https://www.sciencedirect.com/science/article/pii/S0950584916302427?via%3Dihub (accessed on 5 November 2018). [CrossRef]
- Just, R.; Jalali, D.; Inozemtseva, L.; Ernst, M.D.; Holmes, R.; Fraser, G. Are mutants a valid substitute for real faults in software testing? In Proceedings of the 22nd ACM SIGSOFT International Symposium on Foundations of Software Engineering, Hongkong, China, 16–22 November 2014; pp. 654–665. Available online: https://dl.acm.org/citation.cfm?doid=2635868.2635929 (accessed on 5 November 2018).
- Gong, P.; Zhao, R.; Li, Z. Faster mutation-based fault localization with a novel mutation execution strategy. In Proceedings of the 2015 IEEE Eighth International Conference on Software Testing, Verification and Validation Workshops (ICSTW), Graz, Austria, 13–17 April 2015; pp. 1–10. Available online: https://ieeexplore.ieee.org/document/7107448 (accessed on 5 November 2018). [CrossRef]
- DiGiuseppe, N.; Jones, J.A. Fault density, fault types, and spectra-based fault localization. Empir. Softw. Eng. 2015, 20, 928–967. Available online: https://link.springer.com/article/10.1007%2Fs10664-014-9304-1 (accessed on 5 November 2018). [CrossRef]
- Zhang, M.; Li, X.; Zhang, L.; Khurshid, S. Boosting spectrum-based fault localization using PageRank. In Proceedings of the 26th ACM SIGSOFT International Symposium on Software Testing and Analysis, Santa Barbara, CA, USA, 10–14 July 2017; pp. 261–272. Available online: https://dl.acm.org/citation.cfm?doid=3092703.3092731 (accessed on 5 November 2018). [CrossRef]
- Lee, J.-W.; Choi, K.-Y.; Lee, J.-W. Collecting Big Data from Automotive ECUs beyond the CAN Bandwidth for Fault Visualization. Mob. Inf. Syst. 2017, 2017, 4395070. Available online: https://www.hindawi.com/journals/misy/2017/4395070/ (accessed on 5 November 2018). [CrossRef]
- GNU Binary Utilities. Available online: https://sourceware.org/binutils/docs/binutils/index.html (accessed on 5 November 2018).
- MISRA-C:2004 Guidelines for the Use of the C Language in Critical Systems. Available online: http://caxapa.ru/thumbs/468328/misra-c-2004.pdf (accessed on 5 November 2018).
- Vector Embedded Components. Available online: https://www.vector.com/int/en/products/products-a-z/embedded-components/ (accessed on 5 November 2018).
- NXP 16-Bit S12 and S12X MCUs|NXP. Available online: https://www.nxp.com/products/processors-and-microcontrollers/additional-processors-and-mcus/8-16-bit-mcus/16-bit-s12-and-s12x-mcus:S12S12X (accessed on 5 November 2018).
- Agrawal, H.; DeMillo, R.A.; Hathaway, B.; Hsu, W.; Hsu, W.; Krauser, E.W.; Martin, R.J.; Mathur, A.P.; Spafford, E. Design of Mutant Operators for the C Programming Language; Technical Report SERC-TR-41-P; Software Engineering Research Center, Department of Computer Science, Purdue University: West Lafayette, IN, USA, 1989; Available online: http://citeseerx.ist.psu.edu/viewdoc/download?doi=10.1.1.40.8490&rep=rep1&type=pdf (accessed on 5 November 2018).
- MPC551x to Bolero (MPC560xB/C, SPC560Bx/Cx) Migration. Available online: https://www.nxp.com/docs/en/application-note/AN3753.pdf (accessed on 5 November 2018).
Figure 1.
Development and testing processes of ECU/SW by OEM. ECU/SW: electronic control unit/automotive software; OEM: original equipment manufacturers; HiL: Hardware-in-the-Loop.
Figure 1.
Development and testing processes of ECU/SW by OEM. ECU/SW: electronic control unit/automotive software; OEM: original equipment manufacturers; HiL: Hardware-in-the-Loop.

Figure 2.
HiL test environment.

Figure 3.
Process of fault localization through analysis of updated memory.

Figure 4.
Data collector in HiL testing.

Figure 5.
Memory section table and symbol List: (a) Memory section table; (b) Symbol list.

Figure 6.
Example of Analyzed Memory Updated Information: (a) n-th frame; (b) Full Range of Frames; (c) MUIA, R (A = {a|MUFa, R > 0}, R = [488,497]).
Figure 6.
Example of Analyzed Memory Updated Information: (a) n-th frame; (b) Full Range of Frames; (c) MUIA, R (A = {a|MUFa, R > 0}, R = [488,497]).

Figure 7.
Identification of Input-Driven Updated Range.

Figure 8.
Example of Finding the Faults in the “Adv Emergency Stop Signal”.

Figure 9.
HiL test environment.

Figure 10.
Unit Test of “Left Turn Signal”: (a) “Left Turn Signal” Unit Test Specification; (b) Initialize and Test input (MUIIDUA,IDUR).
Figure 10.
Unit Test of “Left Turn Signal”: (a) “Left Turn Signal” Unit Test Specification; (b) Initialize and Test input (MUIIDUA,IDUR).

Figure 11.
The Fault Candidates of the Fault Index #1: (a) Switching “Left Turn Signal” into “Right Turn Signal” (MUIIDUA of Unit Function, IDUR); (b) Switching “Emergency Signal” into “Right Turn Signal” (MUIIDUA of Unit Function, IDUR).
Figure 11.
The Fault Candidates of the Fault Index #1: (a) Switching “Left Turn Signal” into “Right Turn Signal” (MUIIDUA of Unit Function, IDUR); (b) Switching “Emergency Signal” into “Right Turn Signal” (MUIIDUA of Unit Function, IDUR).

Figure 12.
Fault Candidates of the Fault Index #12.


Table 1.
Example of test information.
| Type | Content | Example |
|---|---|---|
| Script ID | Index number of test script | #1 |
| Script Name | Name of test script | TS_RoomLamp |
| Date | Date the test was performed | 17 March 2018 12:00:30 |
| Case ID | Index number of test case in the test script | #1-2-1 |
| Result | Pass or Fail | Fail |
| Test condition (Write) | Input signal to the SUT | INPUT_A, INPUT_B, ... |
| Expected value (Inspect) | Signals to check on the SUT | SIGNAL_A, SIGNAL_B, ... |
Table 2.
Mutation operator selection for fault injection.
| Function | Number of Unsuitable Operators | Number of Unit Failure Operators | Unit Pass Operators |
|---|---|---|---|
| Turn Signal | 67 | 12 | OEBA * |
| AEBS | 47 | 30 | SSDL, VTWD, CGCR |
| Driving Mode | 50 | 28 | STRI, ORRN |
| Head lamp | 61 | 18 | OCNG |
| Rear lamp | 51 | 26 | VTWD, CGCR, CGSR |
* See the Table 4.
Table 3.
List of fault injection by the selected mutation operators.
| Index | Node | Function | Mutation Operator | Fault |
|---|---|---|---|---|
| 1 | 1 | Front Turn Signal | OEBA * | Malfunction due to consecutive commands |
| 2 | Head lamp | OCNG | Illumination change error | |
| 3 | Steering | CGSR | Steering angle change error | |
| 4 | 2 | AEBS | SSDL | Distance change error |
| 5 | CGCR | Operation in the reverse mode | ||
| 6 | Driving Mode | STRI | Mode change while accelerating | |
| 7 | STRI | Increase internal variable in the parking mode | ||
| 8 | 3 | Rear Turn Signal | OEBA | Malfunction due to consecutive commands |
| 9 | Brake lamp | CGSR | Malfunction due to accelerator pedal condition | |
| 10 | Emergency stop signal | CGCR | Operation in the reverse mode | |
| 11 | Rear alert | OEBA | Distance change error | |
| 12 | Adv. Emergency stop signal | OEAA | Malfunction due to the existing command state |
* See the Table 4.
Table 4.
List of mutation operators.
| Category | Operator | Mutation |
|---|---|---|
| Statement | SSDL | Statement Deletion |
| STRI | Trap on if Condition | |
| Operator | OEAA | Operator Replacement (Plain assignment to Plain assignment) |
| OEBA | Operator Replacement (Plain assignment to Bitwise assignment) | |
| OCNG | Logical context negation | |
| Constant | CGSR | Constant for Scalar Replacement |
| CGCR | Constant for Constant Replacement |
Table 5.
Experimental result.
| Fault Index | Function | ECU Node | Allocated Memory | Updated Symbols | Fault Candidates | Localization (%) |
|---|---|---|---|---|---|---|
| 1 | Front Turn Signal | 1 | 3714 | 187 | 9 | 4.81 |
| 2 | Head Lamp | 195 | 14 | 7.18 | ||
| 3 | Steering | 200 | 4 | 2 | ||
| 4, 5 | AEBS | 2 | 4032 | 221 | 22 | 9.95 |
| 6, 7 | Driving Mode | 179 | 13 | 7.26 | ||
| 8 | Rear Turn Signal | 3 | 3711 | 170 | 9 | 5.29 |
| 9 | Brake Lamp | 132 | 7 | 5.3 | ||
| 10 | ESS | 289 | 9 | 3.11 | ||
| 11 | Rear Alert | 167 | 4 | 2.4 | ||
| 12 | Adv. ESS | 163 | 17 | 10.43 | ||
| Average | 5.77 |
© 2018 by the authors. Licensee MDPI, Basel, Switzerland. This article is an open access article distributed under the terms and conditions of the Creative Commons Attribution (CC BY) license (http://creativecommons.org/licenses/by/4.0/).
Share and Cite
MDPI and ACS Style
Choi, K.-Y.; Lee, J.-W. Fault Localization by Comparing Memory Updates between Unit and Integration Testing of Automotive Software in an Hardware-in-the-Loop Environment. Appl. Sci. 2018, 8, 2260. https://doi.org/10.3390/app8112260
AMA Style
Choi K-Y, Lee J-W. Fault Localization by Comparing Memory Updates between Unit and Integration Testing of Automotive Software in an Hardware-in-the-Loop Environment. Applied Sciences. 2018; 8(11):2260. https://doi.org/10.3390/app8112260
Chicago/Turabian StyleChoi, Ki-Yong, and Jung-Won Lee. 2018. "Fault Localization by Comparing Memory Updates between Unit and Integration Testing of Automotive Software in an Hardware-in-the-Loop Environment" Applied Sciences 8, no. 11: 2260. https://doi.org/10.3390/app8112260
Note that from the first issue of 2016, this journal uses article numbers instead of page numbers. See further details here.