The Effects of Acidic, Alkaline, and Neutral Anolytes on Electrochemical Seawater Deoxygenation


1
Department of Chemistry, Bioscience and Environmental Engineering, University of Stavanger, NO-4036 Stavanger, Norway
2
Deox AS, Professor Olav Hanssens vei 7A, NO-4021 Stavanger, Norway
*
Author to whom correspondence should be addressed.
Appl. Sci. 2018, 8(11), 2280; https://doi.org/10.3390/app8112280
Submission received: 30 September 2018
/
Revised: 13 November 2018
/
Accepted: 15 November 2018
/
Published: 18 November 2018
(This article belongs to the Special Issue Electro-membrane Processes for Clean Water and Sustainable Energy)
Abstract
:Electrochemical deoxygenation of seawater has advantages over available chemical and physical methods. For seawater deoxygenation, acidic, neutral, or alkaline anolytes can be used. The effects of acidic, alkaline, and neutral buffered and non-buffered anolytes were studied in two compartment deoxygenation cells. The pH, conductivity, H2O2 production, and current were measured throughout the experiments. The optimum applied potentials for oxygen reduction were between 1.9 V–2.2 V, giving water as product; reducing the applied potential also resulted in the formation of H2O2. Analysis after the experiments using a scanning electron microscope with electron-dispersive X-ray spectroscopy showed that both the silver mesh and the cation exchange membrane remained stable during the experiments. The use of alkaline anolytes resulted in the maximum oxygen removal with minimal side reactions in the cell.
Keywords:
cation exchange membrane; electrochemical; seawater; deoxygenation; electrolytes; pH; oxygen
1. Introduction
Removal of oxygen from seawater used for water injection for enhanced oil recovery (EOR) is crucial in order to avoid corrosion in pipelines. Amongst the available technologies for oxygen removal, the electrochemical method using highly conductive seawater is very suitable. This method avoids the use of additional chemicals and utilizes only seawater as an electrolyte. The electrochemical system with a silver cathode for oxygen removal works efficiently on both the laboratory scale and the industrial scale, as previously reported by Dotel et al. [1,2].
The slow kinetics for oxygen reduction reactions (ORR) at the cathode is one of the major limiting factors for the development of an electrochemical system involving ORR [3,4]. Platinum or platinum-based materials have higher activities for oxygen reduction reactions (ORR) [5]; however, higher metal price and slow kinetics for ORR are limiting factors for their commercial use on a large scale. There were several attempts to develop a cheap and efficient catalyst for ORR [6,7,8,9,10,11,12,13,14,15,16,17,18]; however, problems still exist with catalyst degradation during the catalytic reduction of oxygen [19]. The mechanism for the oxygen reduction reaction on silver is similar to the reaction on platinum, but slightly less efficient [20,21,22]. In addition, silver has good corrosion resistance properties and a low cost which is an advantage.
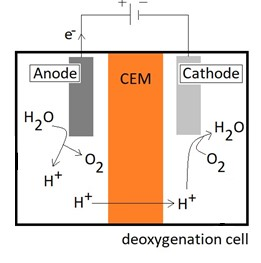
The development of different oxide-based catalysts for oxygen evolution from water found iridium oxide (IrO2) to be a dimensionally stable anode (DSA) and a suitable electrode material for oxygen or chlorine evolution reactions [23,24,25,26]. Thus, a silver cathode and an iridium oxide anode were found to be a good catalyst combination for the deoxygenation cell. The desired reactions and side reactions at the anode and cathode in the deoxygenation cell are shown in Equations (1)–(5).
At the anode:
2H2O → 4H+ + 2O2 + 4e−.
At the cathode:
4H+ + O2 + 4e− → 2H2O.
Side reaction at anode:
2Cl− → Cl2 + 2e−.
Side reactions at cathode:
2H++ 2e− → H2;
2H+ + O2 + 2e− → H2O2.
In neutral or alkaline catholytes, the reduction of oxygen to hydroxyl ions is a typical reaction. The hydrogen cation passes from the anode to the cathode compartment through the cation exchange membrane (CEM). The oxygen evolution reaction (OER) and oxygen reduction reaction (ORR) take place at the anode and cathode, respectively. Both reactions have higher overpotentials making the reactions sluggish.
At the anode, water is oxidized forming oxygen gas as shown in Equation (1). In a deoxygenation cell, operated offshore, the use of seawater as both the anolyte and catholyte could make the process simple. However, the generation of chlorine gas (Equation (3)) prior to the generation of oxygen (Equation (1)) gives more aggressive conditions with respect to corrosion in addition to chlorine being toxic. Thus, the use of a chloride-free electrolyte is preferred at the anode side in the deoxygenation cell.
The pH and temperature effects on the OER and ORR at the anode and cathode were extensively studied in the literature [27,28]. To our knowledge, there is no study on the pH effect of the anolytes with respect to the efficiency of the deoxygenation process or their effect on electrode materials. Non-chloride anolytes were studied in a deoxygenation cell in order to understand and utilize suitable anolytes for oxygen removal from seawater. The results from this study provide additional information that is important in order to establish a suitable industrial method for the deoxygenation of injected seawater. The effects of buffered or non-buffered anolytes at different pH levels (acidic, neutral, or alkaline) on oxygen removal at the anode and on H2O2 production at the cathode were studied. In addition, the durability of the membrane and the effects of acidic, alkaline, or neutral anolytes on the cathode material were analyzed.
2. Materials and Methods
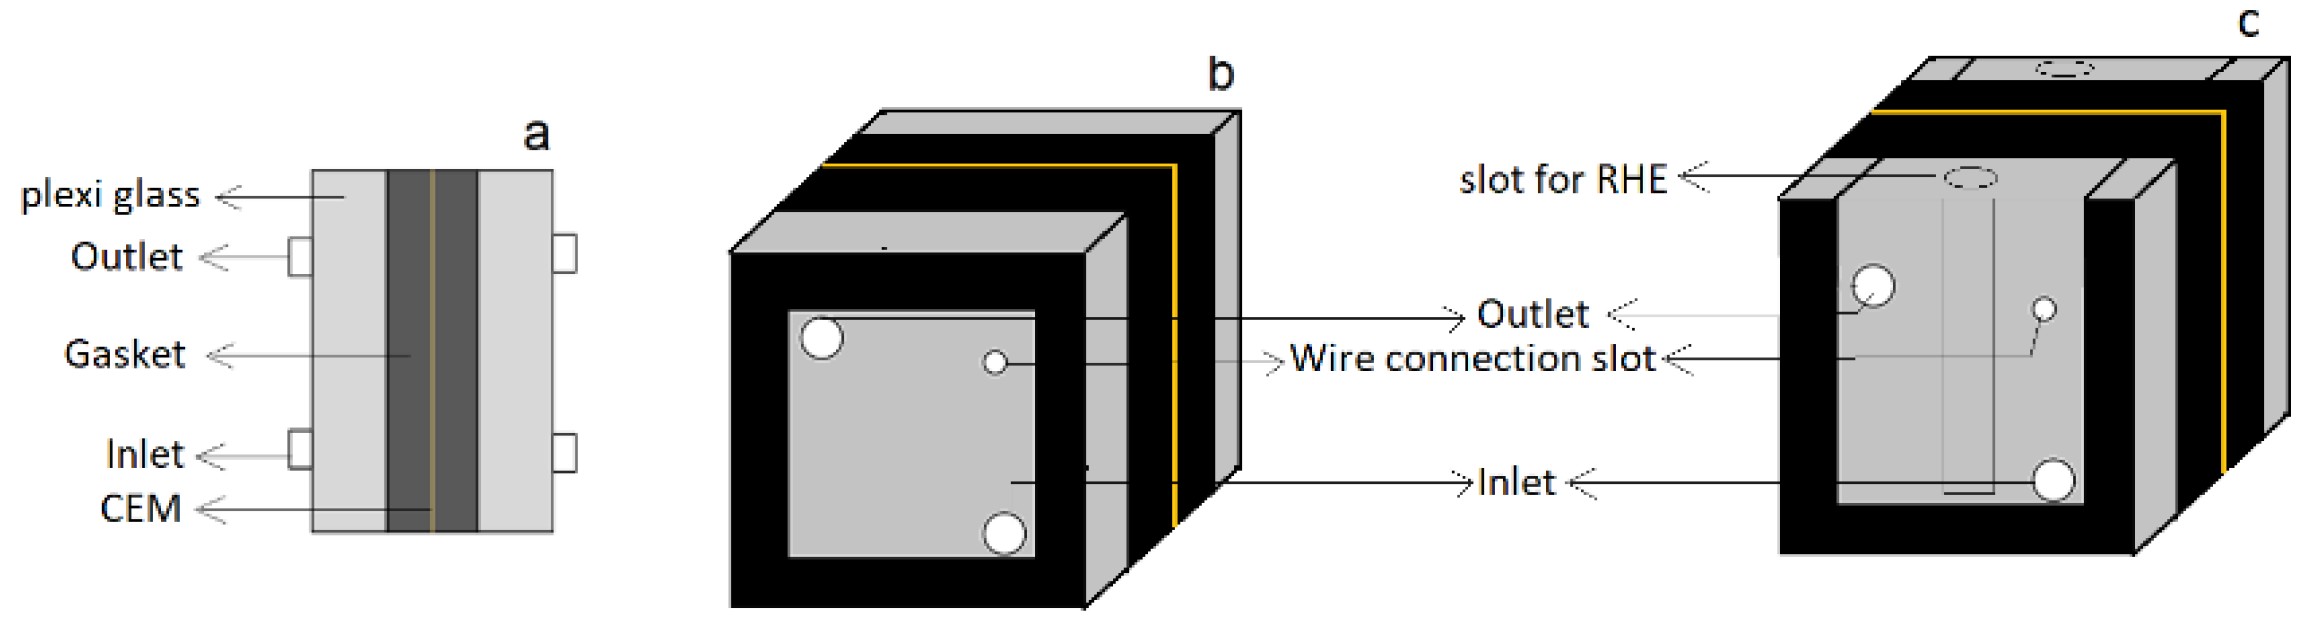
The tests were performed in a two-compartment electrochemical cell. Two cells, Cell A and Cell B, were constructed as shown in Figure 1. Both cells were flat plate rectangular structures made of polycarbonate. Cell A was a closed cell with a possibility for measuring oxygen concentration at the catholyte outlet, whereas Cell B was an open cell with the facility of reversible hydrogen electrode (RHE). Titanium plated with iridium oxide and silver-plated Monel mesh were used as the anode and cathode, respectively. A cation exchange membrane (CEM) (Ionac MC-3470) was used between the anode and the cathode compartments.
Sodium chloride solution (0.5 M) was used as the catholyte in all experiments. Three different solutions were used as anolytes for both cells: 0.1 M nitric acid as an acidic solution, 0.1 M sodium nitrate as a neutral solution, or 0.1 M sodium hydroxide as an alkaline solution. The acidic, basic, and neutral buffer solutions with compositions given in Table 1 were tested as anolytes in Cell B. All solutions were prepared in MilliQ water. The level of oxygen removal from water from each electrolyte was measured in Cell A.
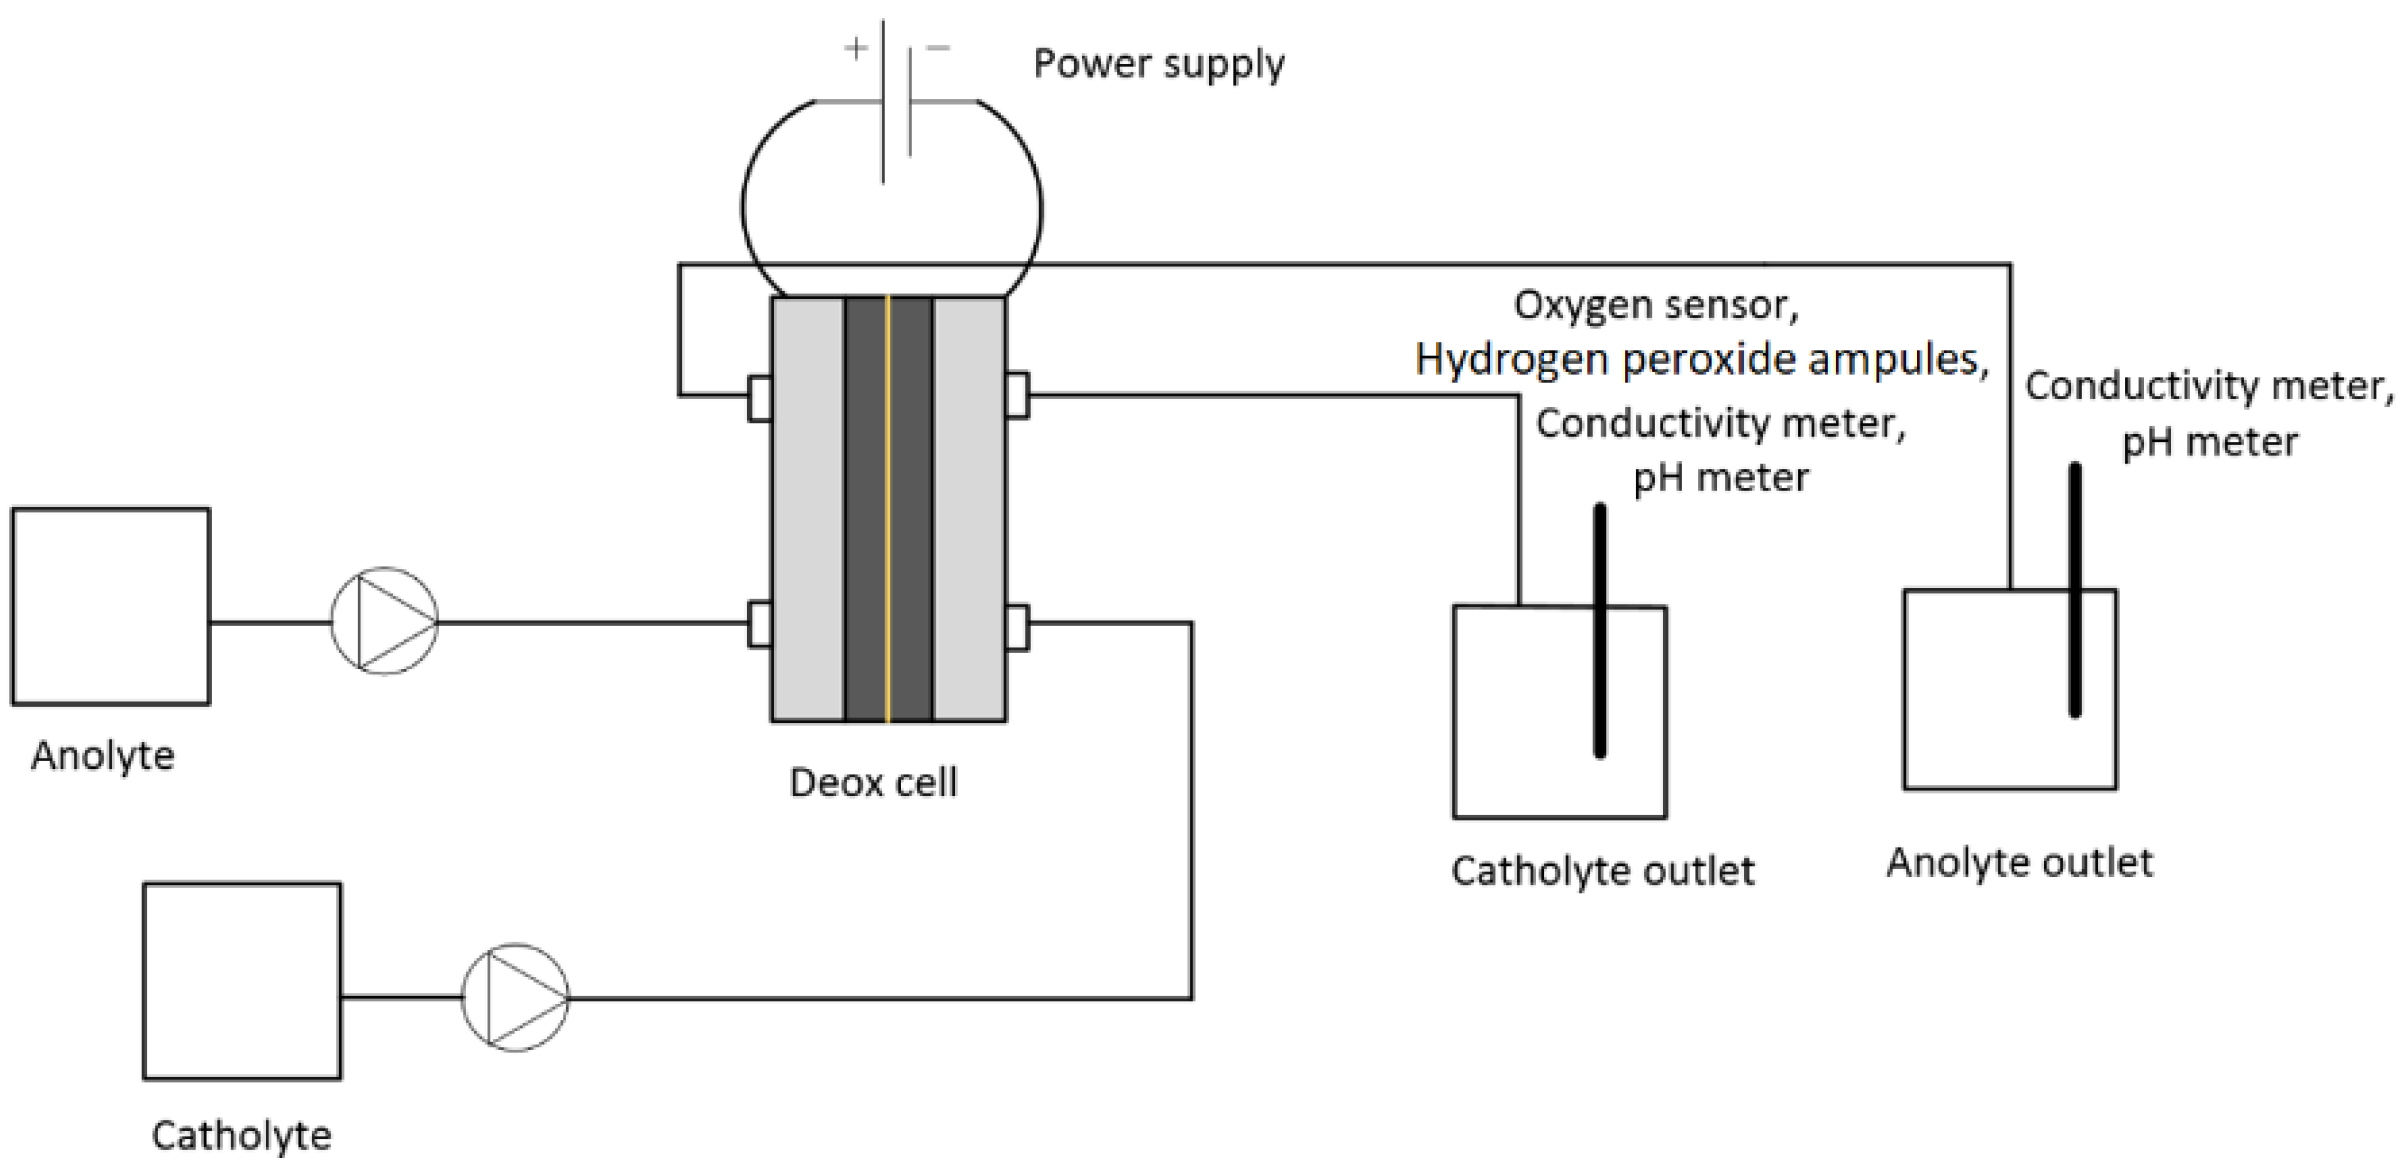
Figure 2 shows the experimental set-up for the test. The peristaltic pump (Watson Marlow 520S) was used for pumping the anolyte and catholyte. The power supply (Manson HCS 3300) was used for providing the current to the cell. The initial and final oxygen concentrations in the electrolytes were measured in Cell A by an optical oxygen sensor (Visiferm DO 120, Hamilton, accuracy 1 ± 0.05 vol%). The conductivity of the electrolytes was measured by a conductivity meter (WTW 350i). The hydrogen peroxide concentration was measured in the catholyte at the outlet using a hydrogen peroxide test kit (CHEMets® Visual Kit, CHEMetrices, Washington, D.C., US) containing ferric thiocyanate. The ranges of measurement were 0–0.8 ppm and 1–10 ppm. The analysis time was <1 min.
The catholyte and anolyte were pumped through the cell at constant flow rates of 10 mL·min−1. For each test, a new membrane, anode, and cathode were installed. The theoretical required current was calculated for the deoxygenation of 0.5 M NaCl solution passing through the cell at a flow rate of 10 mL·min−1. The output current for the deoxygenation of water was measured and compared with the calculated theoretical current. The current difference was used for calculation of the amount of hydrogen gas evolved. The oxygen concentration, pH, and conductivity were continuously monitored at the outlet, and the applied voltage with resulting current were recorded. The experiments were performed minimum 2–3 times to ensure their reproducibility. After each test, the cell was dismantled, and the anode, cathode, and CEM were stored for scanning electron microscope (SEM) analyses.
Cell B rigged with an RHE, was used for measuring the voltage distribution at the anode and the cathode. Voltages in the range of 1.9 V to 2.3 V between the electrodes in the cell and the corresponding currents were measured. In addition, the individual anode and cathode potentials (vs. RHE) were measured. The hydrogen peroxide concentration in the catholyte was measured for all examined voltages and pH values. The compartments in Cell B had an open structure, as shown in Figure 1c, and atmospheric oxygen could easily ingress into the cathode compartment, and the final oxygen concentration was, therefore, not measured. Experiments were performed using buffer solutions with pH 2.6, 7.0, and 9.1, and the change in pH, current, and hydrogen peroxide concentrations were measured.
The cathode material (silver-plated Monel mesh) and CEM were examined in the SEM (Zeiss SUPRA 35 VP) before and after the experiments. The examination was performed in order to study the change in the structure and composition of the materials. The compositions of the materials were studied with electron-dispersive X-ray spectroscopy (EDS) in order to detect changes during the experiments.
3. Results and Discussion
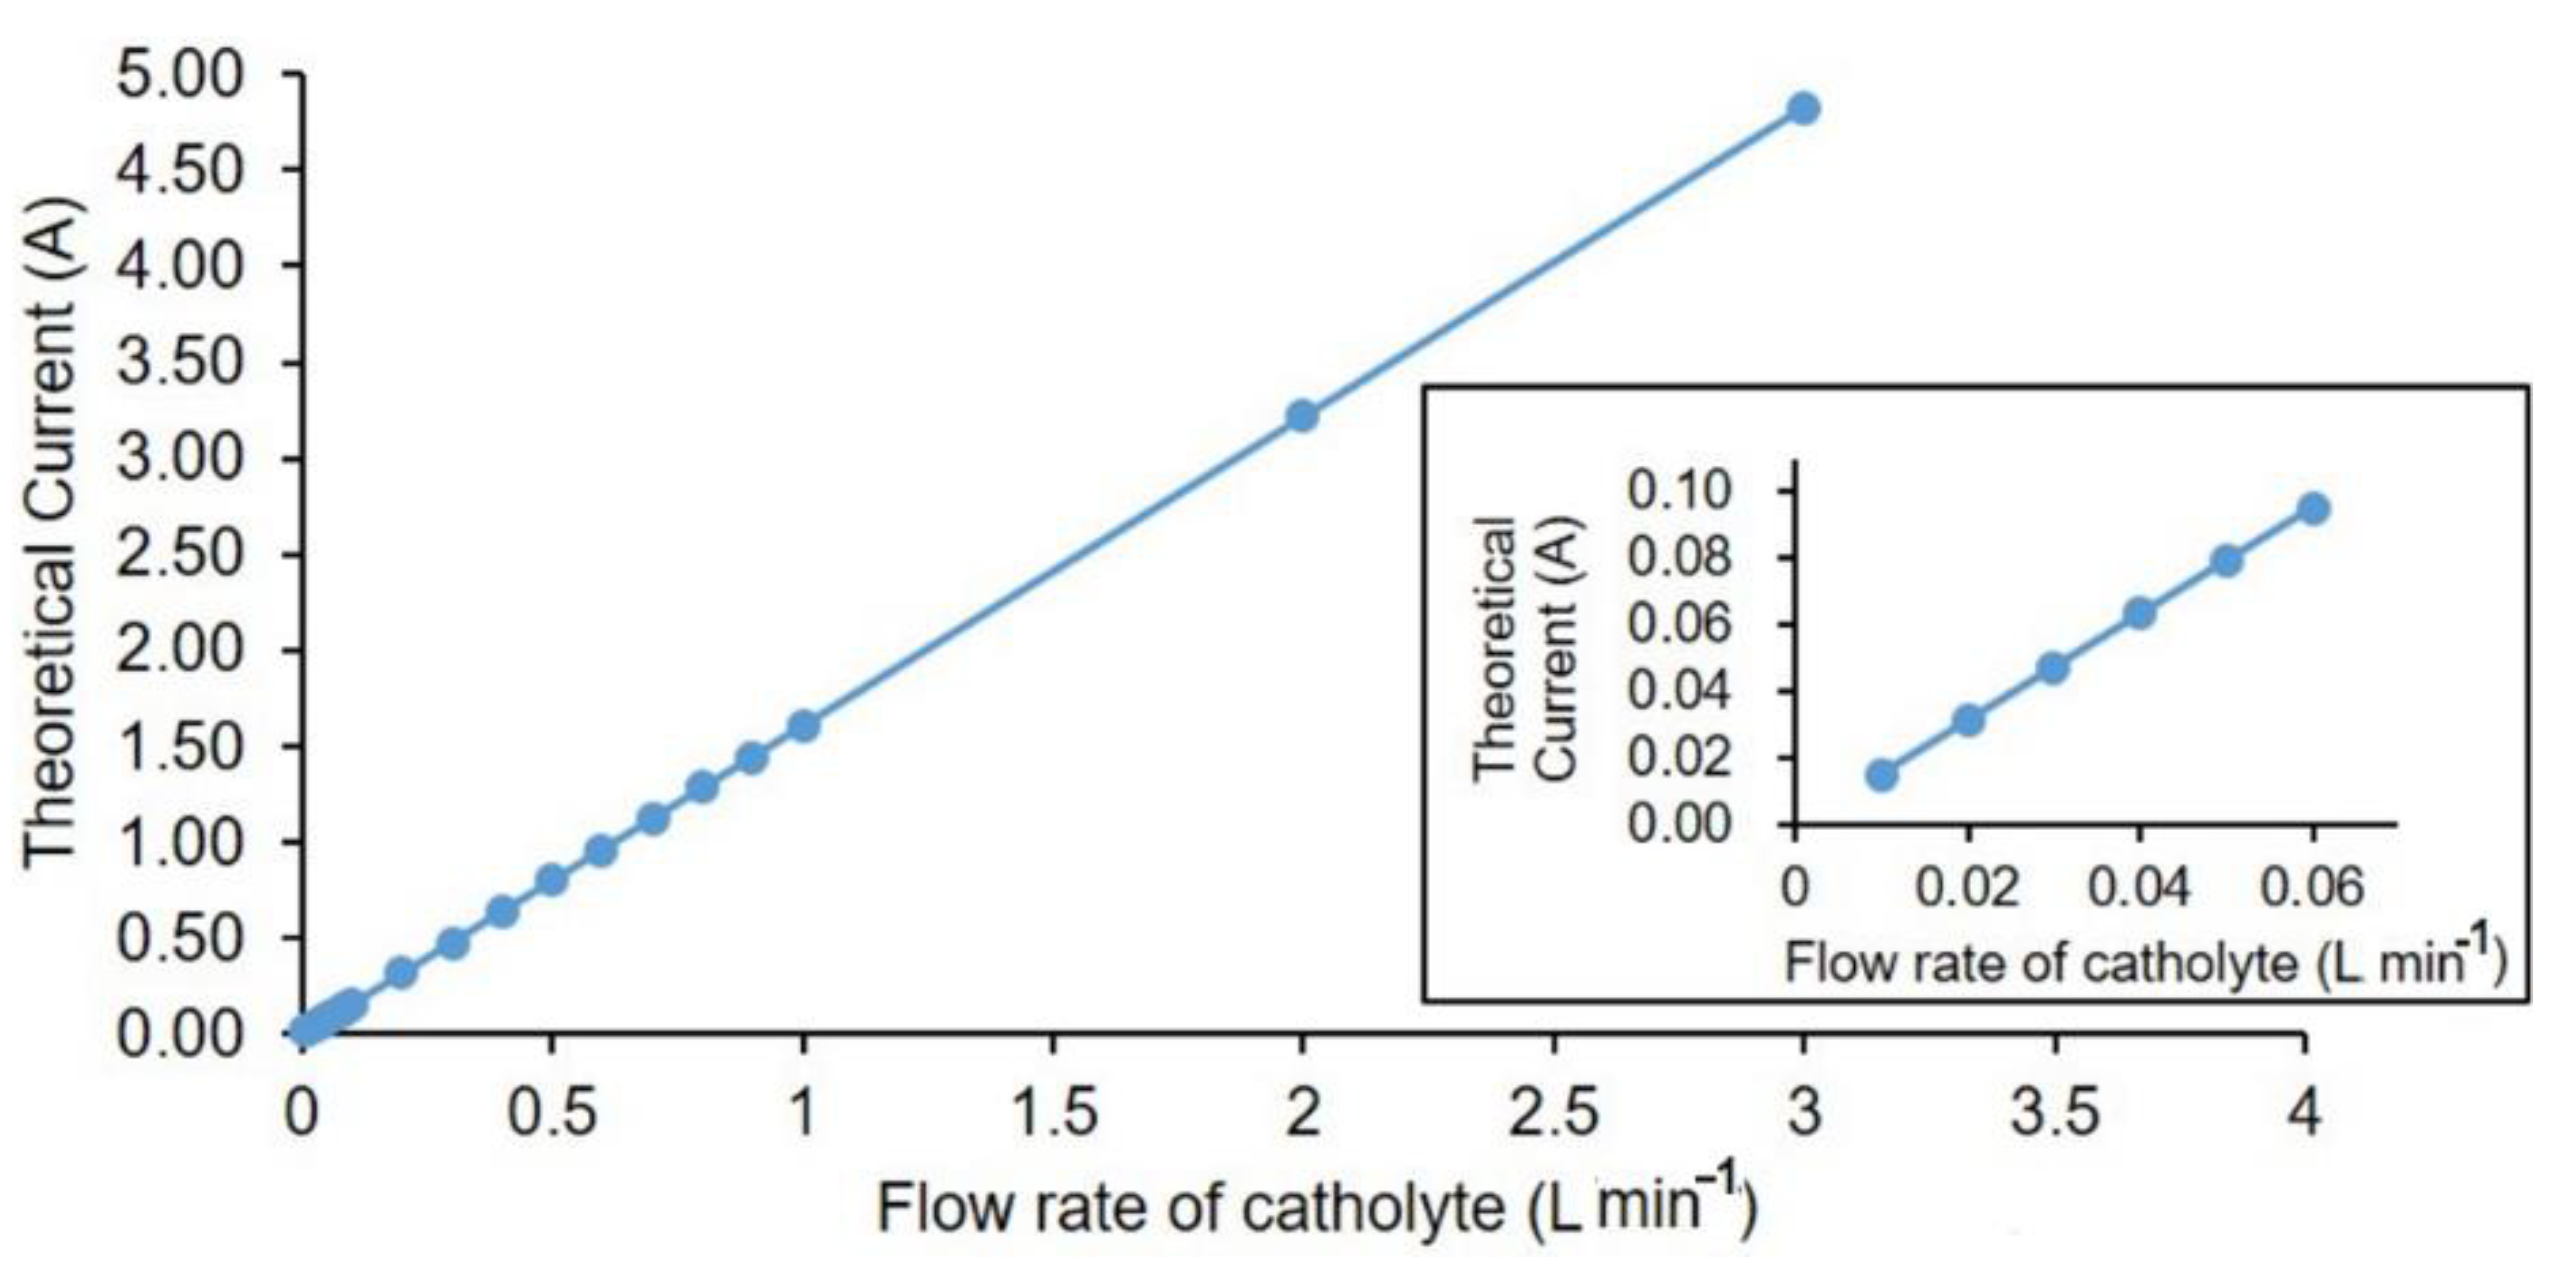
The theoretical currents (Itheor) for different flow rates of catholytes in order to have complete deoxygenation of water are shown in Figure 3. The relationship between flow rate and current output (theoretical) for oxygen removal is linear. Theoretical current is calculated using Equation (6), where CO2 is the mass fraction of dissolved oxygen in the water (g of O2 per g of H2O), ZO2 is the number of electrons required per oxygen molecule (4 e−), F is Faraday’s constant (96,500 A·s·mol−1), m is the mass flow rate (g·s−1), and MO2 is the molecular weight of oxygen (g·mol−1).
Based on the difference from calculated theoretical current and the recorded current at measured oxygen concentrations during the operation, the hydrogen production in the cell was estimated. For a properly designed industrial scale cell, this method can be used for estimating the hydrogen evolution. The theoretical current for 10 mL·min−1 for an oxygen concentration of 8 ppm was calculated to be 20 mA based on Equation (6). The result deviation obtained for each cell was within the error range of maximum 5% (see Supplementary Materials for error bars and standard deviation calculated for the measured data).
3.1. Alkaline Anolyte
The effect of different applied potentials on the oxygen removal in Cell A is shown in Table 2 with 0.1 M NaOH solution as an anolyte and 0.5 M NaCl solution as a catholyte. An increase in potential resulted in a higher oxygen removal efficiency of the electrolyte. At a flow rate of 10 mL·min−1 with 1.9 V applied voltage, the oxygen concentration was reduced from 8.44 ppm to 1.31 ppm, and, at the same rate with 2.3 V applied voltage, the oxygen concentration was lowered to 0.55 ppm. A lower conductivity was observed for the anolyte with an increase in the potential while the catholyte conductivity was not altered significantly. In a deoxygenation cell, the hydronium ions are produced in the anodic compartment and are transferred to cathodic compartment. With the increase in voltage, the rate of transfer and oxidation/reduction increase. The conductivity in the catholyte is dominated by sodium chloride, while the migration of hydronium or hydroxide from acidic or alkaline anolyte influences the pH slightly. For the experiments in alkaline anolyte, the produced hydronium neutralized the hydroxide and the conductivity decreased from 15.6 to 14.1 mS·cm−1. For the experiments in acidic anolyte, the produced hydronium accumulated, and the conductivity increased only slightly, also due to a lower current. The transfer of cations to the cathode compartment with the increase in potential is expected to decrease the conductivity at the anode. The pH of catholyte increased from 7 to 9 during the stabilization period (2 h, see Section 2 for details), and further increased to 10 during oxygen removal operation.
The test run in Cell A with an applied voltage of 2.2 V resulted in the oxygen concentration being reduced from 8.44 ppm to 0.82 ppm. Over a 300-min experiment, the oxygen removal was steady with a stable current output of 27 mA. The potentials at the anode and cathode were studied using RHE in Cell B at 2.2 V and at a flow rate of 10 mL·min−1, and a voltage of 2.2 V between the anode and cathode was measured to result in potentials of 1.670 V and −0.342 V (RHE), respectively. The use of a copper-wire connection at the anode is affected by a positive potential, and some corrosion activities on the wire were observed after each experiment. The ohmic resistance in the solution was considered as the reason for deviation of the applied voltage from observed voltage differences in the cell. There was no observation of hydrogen peroxide formation in the alkaline solution during the potentiostatic test. However, the hydrogen production was calculated to be 25% at 2.2 V and <5% at 2.1 V.
3.2. Acidic Anolyte
The results using 0.1 M HNO3 solution as an anolyte in the cell are shown in Table 3. The pH of the anolyte was stable at pH 1 during both the stabilization (2 h) and the test period. The pH of the catholyte changed from 7 to 5 during the stabilization period, and remained at pH 5 during the test period. The oxygen concentration in the catholyte decreased from 8.18 to 2.99 ppm and from 8.18 to 1.6 ppm using 1.9 V or 2.3 V applied voltage, respectively, as shown in Table 3. The conductivity of the anolyte was quite stable at about 42.8–43.2 mS·cm−1 and for the catholyte at about 46.7–47.1 mS·cm−1.
During a test at a constant voltage of 2.2 V resulting in a constant current of 20 mA, and an oxygen concentration lowered to 1.9 ppm, the use of acidic anolyte was not found to be suitable compared to the alkaline anolyte. In a similar experiment done in Cell B with 2.2 V applied voltage, potentials of 1.3 V and −0.5 V were obtained at the anode and at the cathode, respectively. The hydrogen peroxide concentration was measured to be about 0.5 ppm after 150 min of applied voltage. However, the theoretical current calculation showed that there was <5% current output for hydrogen evolution at 2.2 V, whereas the higher negative potential at the cathode is expected to evolve more hydrogen gas at the cathode. The higher negative potential at the cathode and detection of hydrogen peroxide indicate the possibility for more side reactions taking place in the deoxygenation cell. The lower potential at the anode in the acidic electrolyte shows that there was less oxidation of water resulting in the lower current output.
3.3. Neutral Anolyte
The neutral electrolyte 0.1 M NaNO3 gave different results compared to experiments with acidic and alkaline anolytes. Table 4 shows that the current output, when using the neutral anolyte, was lower than in experiments in acidic or alkaline anolytes, with only about 12 mA at 2.3 V applied voltage. The difference in oxygen removal was not significant between 1.9 V and 2.3 V. The pH of the anolyte and catholyte after stabilization of the cell for 2 h was about 6. During the operation, the anolyte pH decreased to 4, whereas the catholyte pH increased to 9.
In an experiment over 300 min under neutral conditions with an applied voltage of 2.2 V and a flow rate of 10 mL·min−1, the oxygen concentration was reduced from 8.1 ppm to 1.9 ppm. The current output was 11 mA, and the final oxygen concentration was stable at 1.9 ppm throughout the experiment. The anode and cathode potentials were observed to be 1.80 V and −0.08 V, respectively. The hydrogen peroxide concentration was measured to be approximately 0.1 ppm at 2.20 V. The lower potential at the cathode also indicates that there was a minimal chance of hydrogen evolution.
3.4. Buffer Solutions
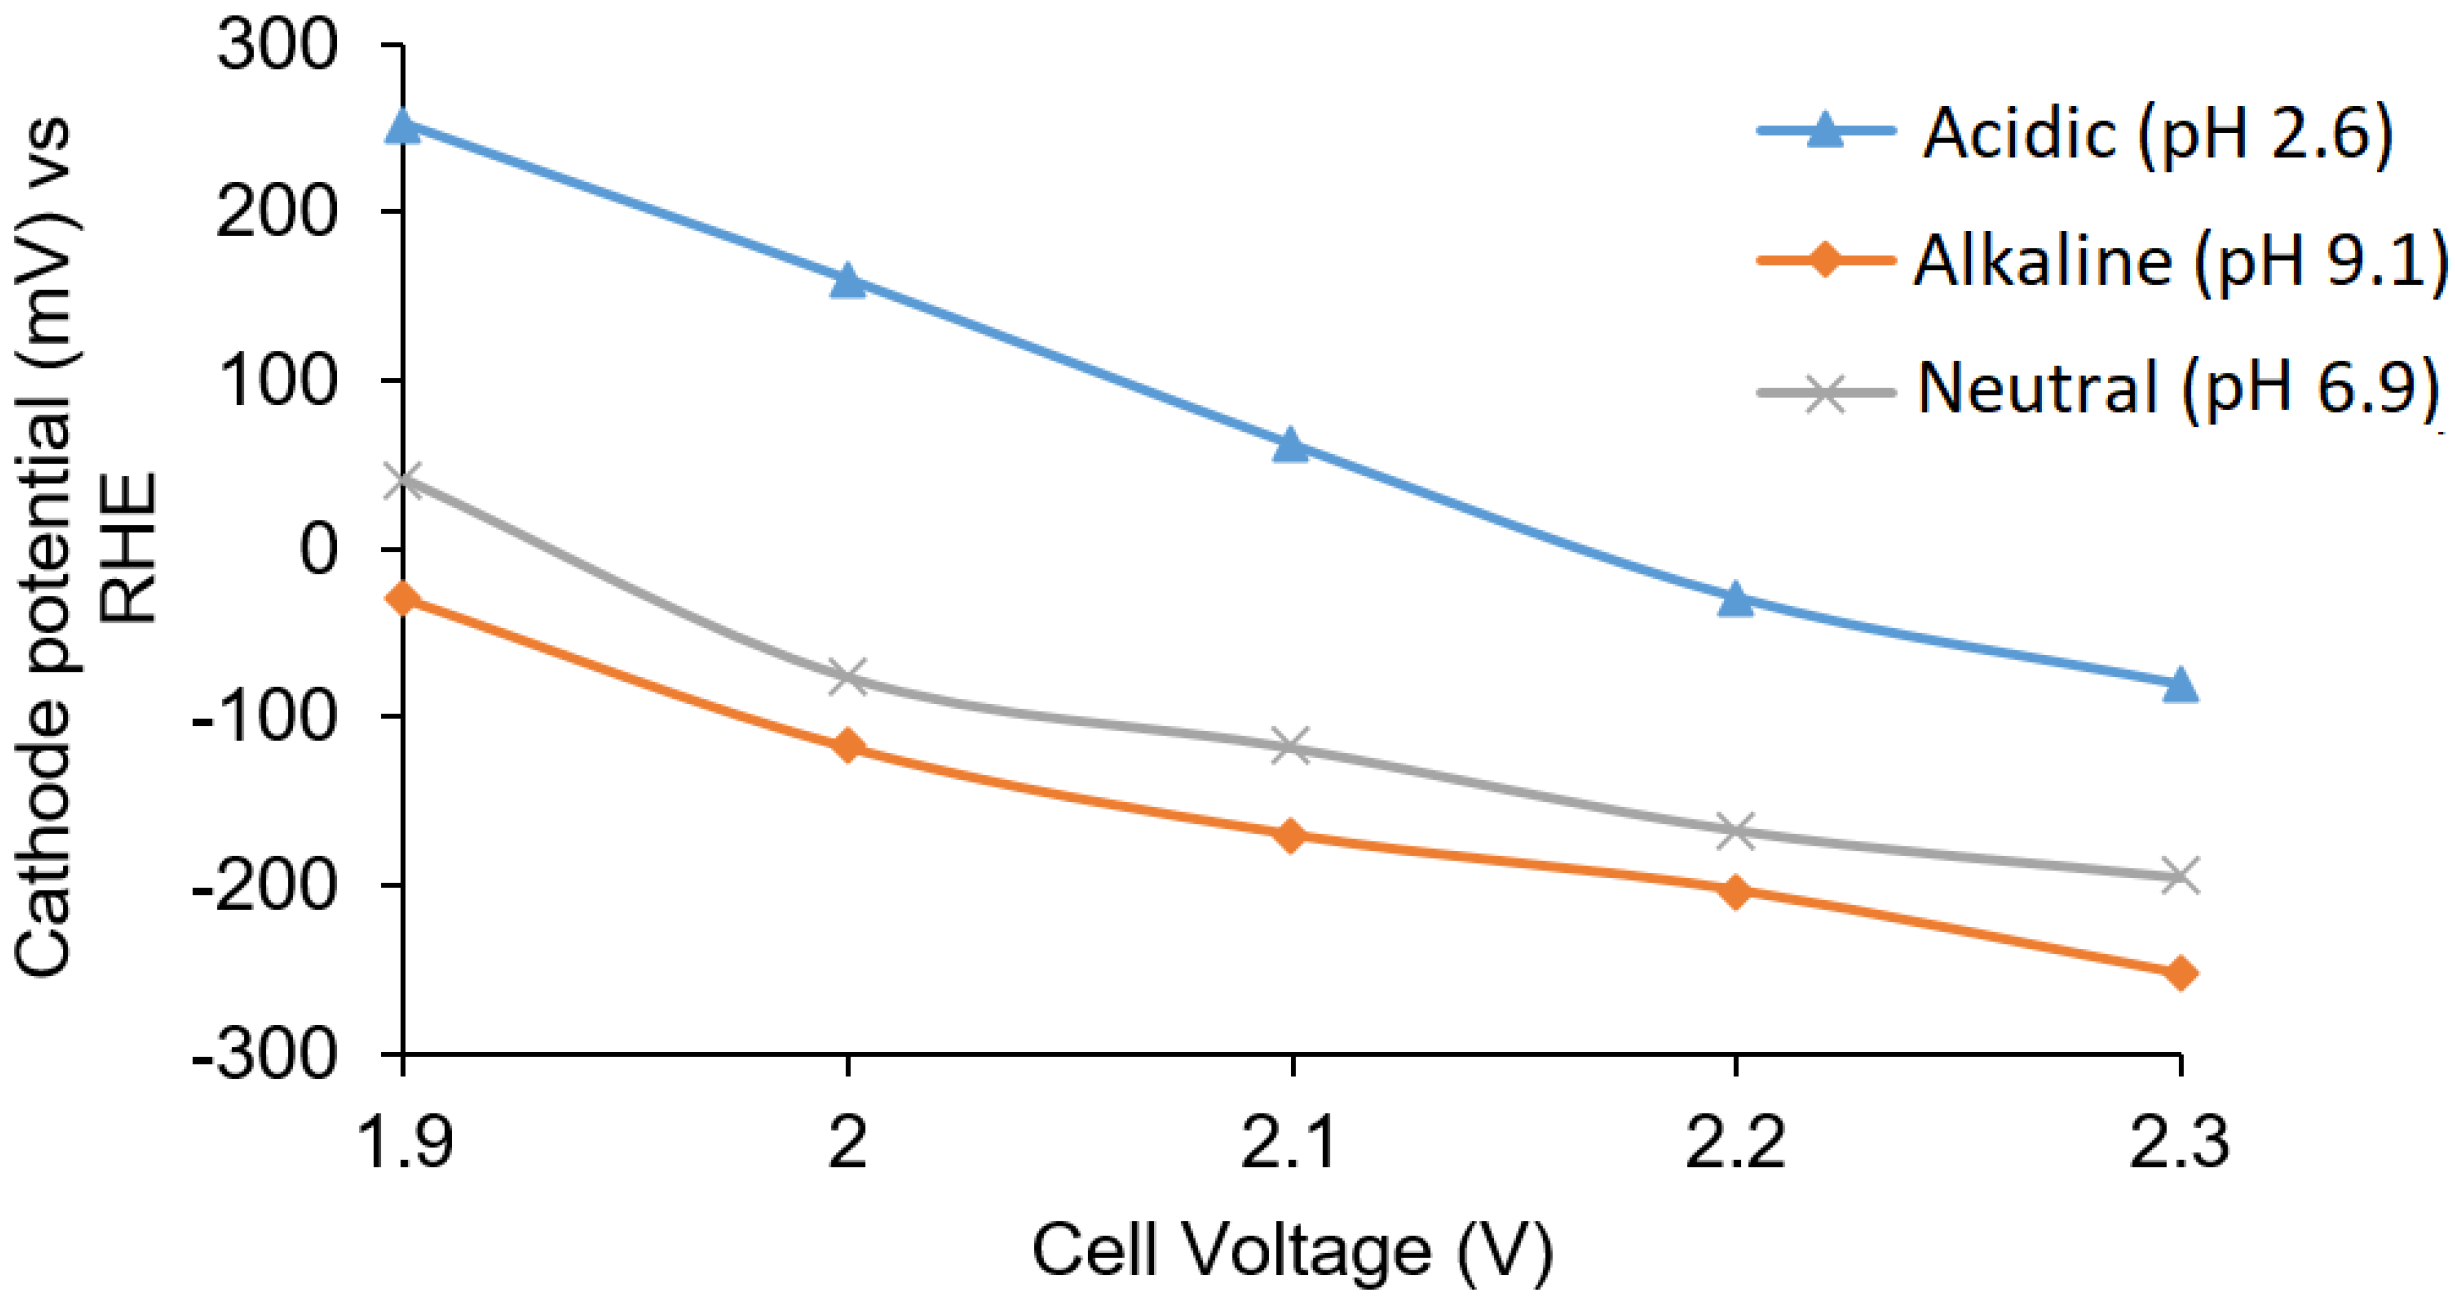
Buffer solutions with pH 2.6, 7.0, and 9.1 at different applied potentials (from 1.9 to 2.3 V) were examined in Cell B. The cathode potential was found to decrease with an increase in the cell voltage as shown in Figure 4. The cathode potential in acidic solution at 2.3 V (−80 mV vs. RHE) indicated that there was no production of hydrogen in the acidic solution on the silver surface. The H2O2 concentration was measured to be 0.3 ppm and 0.1 ppm at 1.9 V and 2.0 V applied voltages in acidic solution, respectively, giving cathode potentials of 253.2 mV and 160 mV (vs. RHE), respectively. H2O2 production was not evident in the alkaline and neutral buffer solutions, and the cathode potentials were also observed to be more negative compared to cathode potentials in the acidic buffer solution.
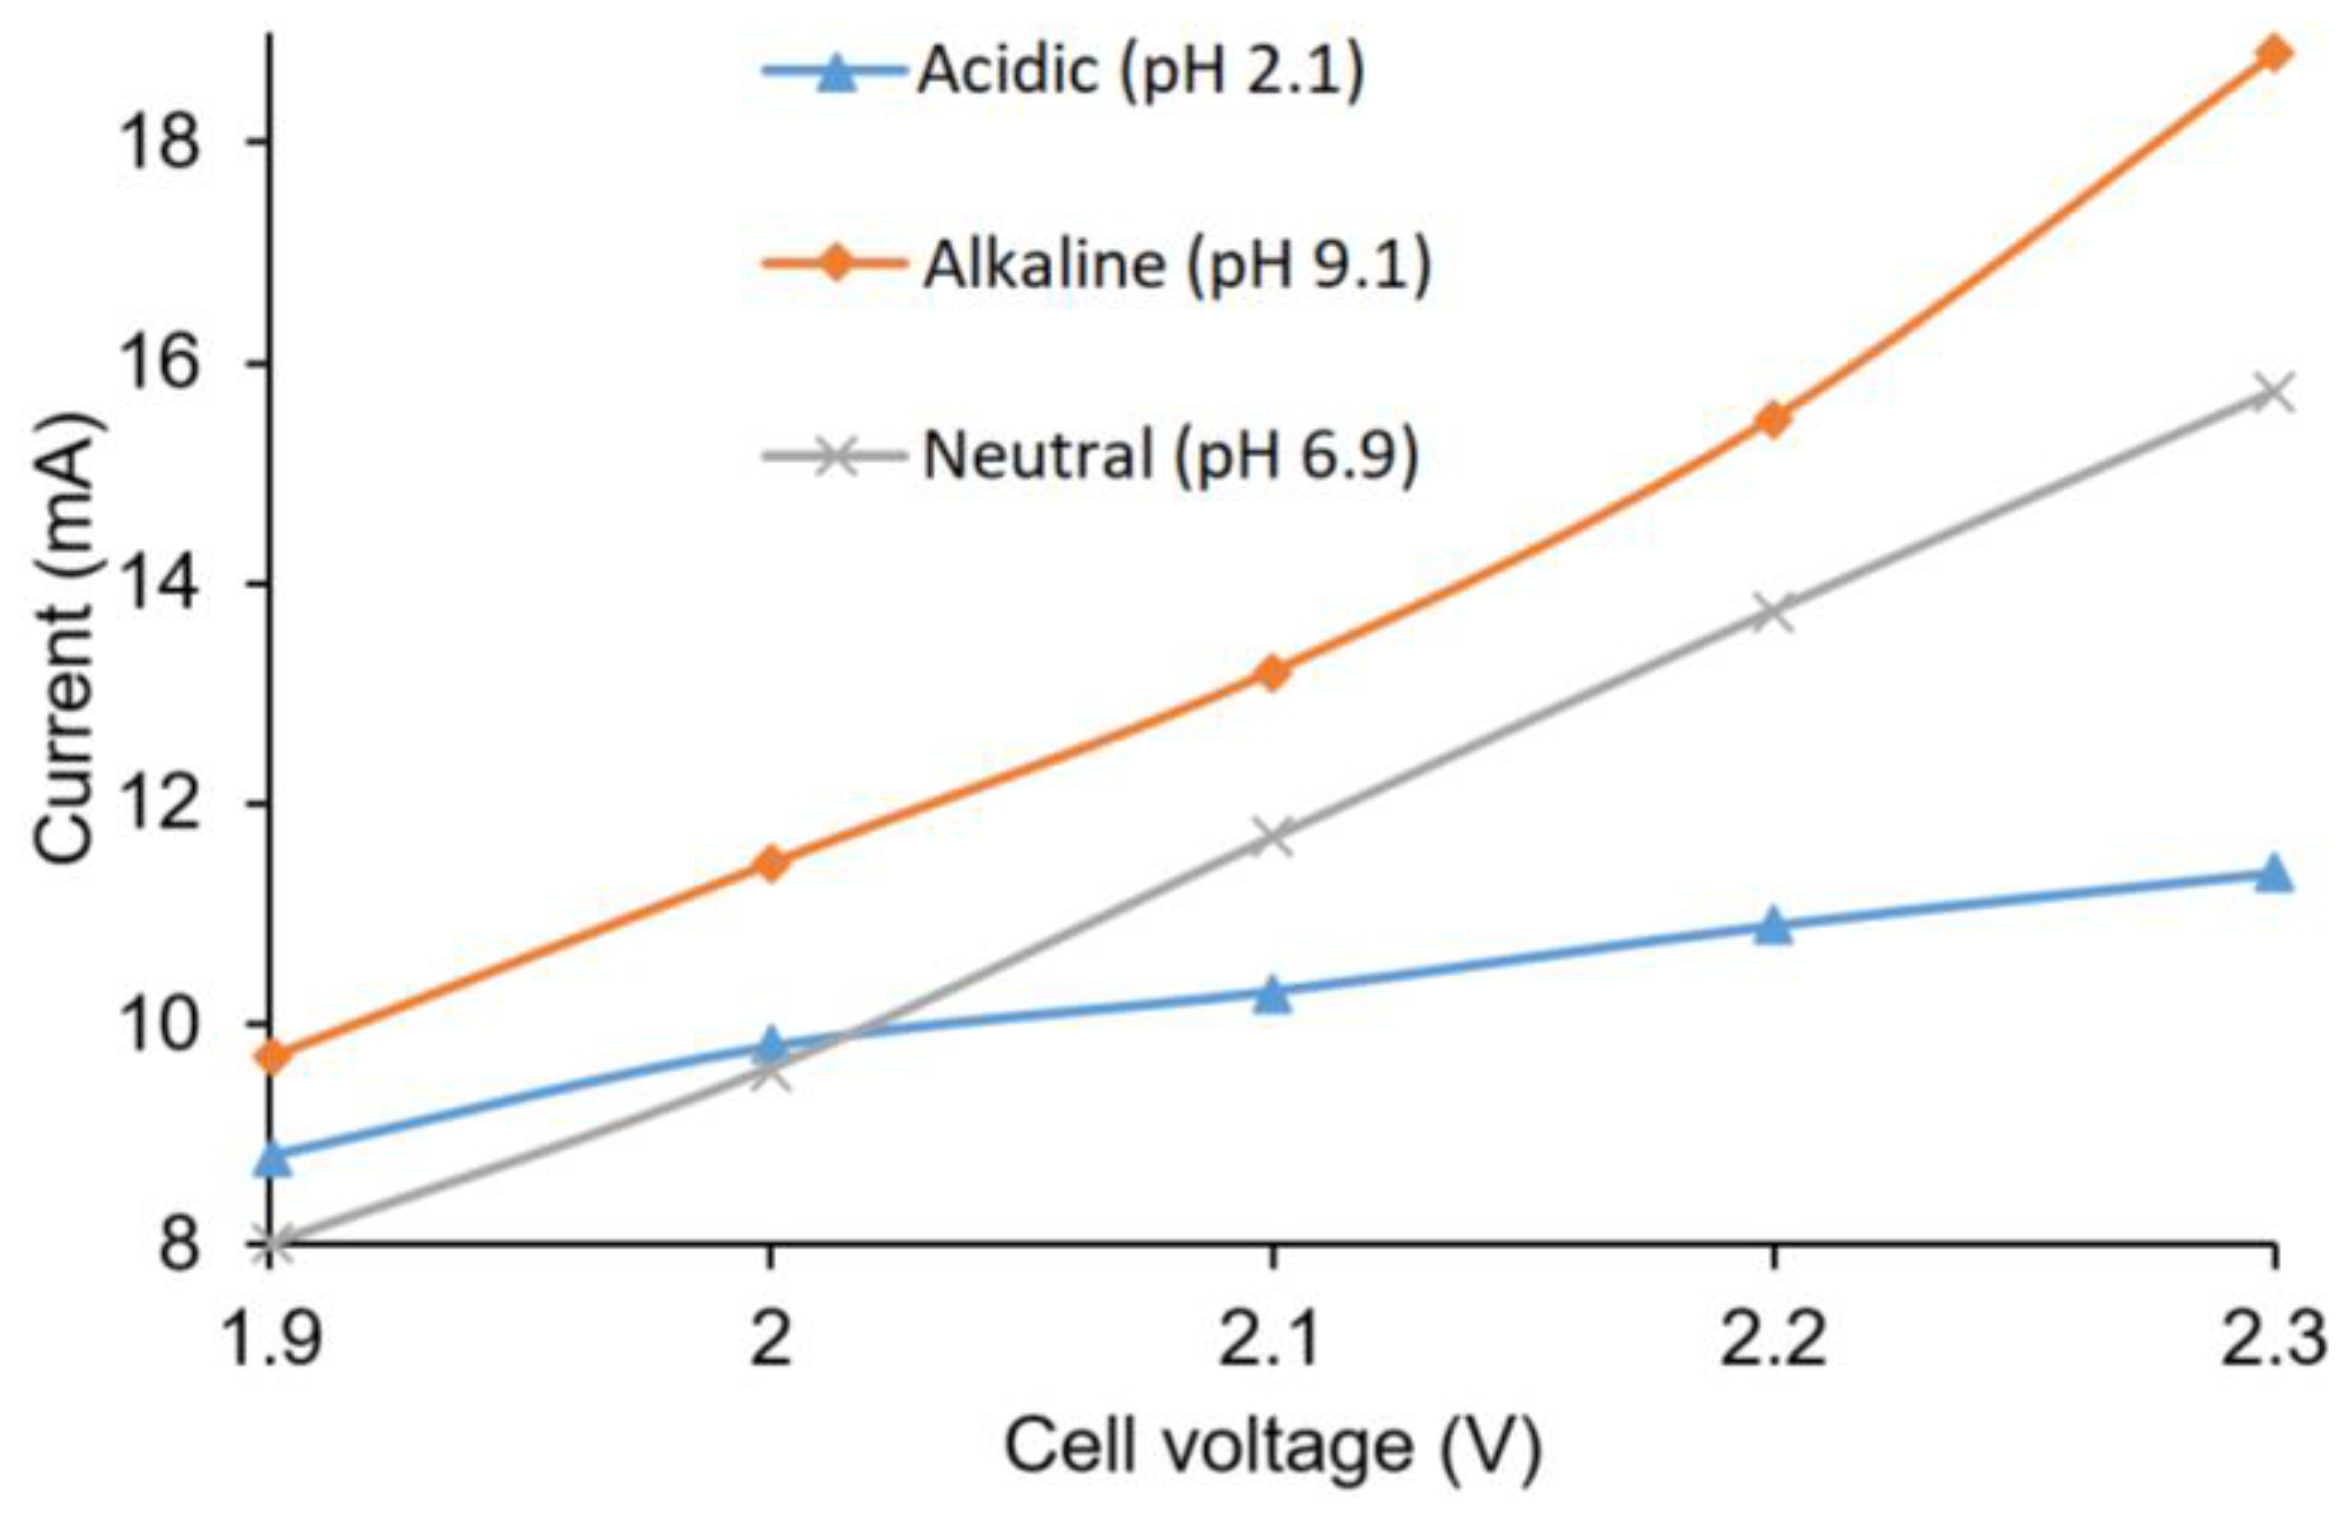
The current outputs in relation to cell voltage in acidic, basic, and neutral buffer solutions are shown in Figure 5. As expected, an increase in cell voltage increased the current output. The alkaline buffer anolyte showed the highest current output, followed by neutral and acidic anolytes. The conductivity of the solutions were considered responsible for such variation of current output, as the basic buffer had the highest conductivity (20 mS·cm−1), while the acidic buffer had the lowest (1.30 mS·cm−1).
The cathode potentials for the acidic, alkaline, and neutral solutions were also in the acceptable range at a cell voltage of 2.2 V. A too negative potential would cause hydrogen gas evolution. In the buffer solution, the potential ranges for the cathode for all solutions were in the range of 250 mV to −260 mV. The formation of hydrogen gas was not observed in the cell, and based on the overpotential for hydrogen production on silver, no significant side reactions were expected.
3.5. Physical Characterization of Cathode and CEM after Test
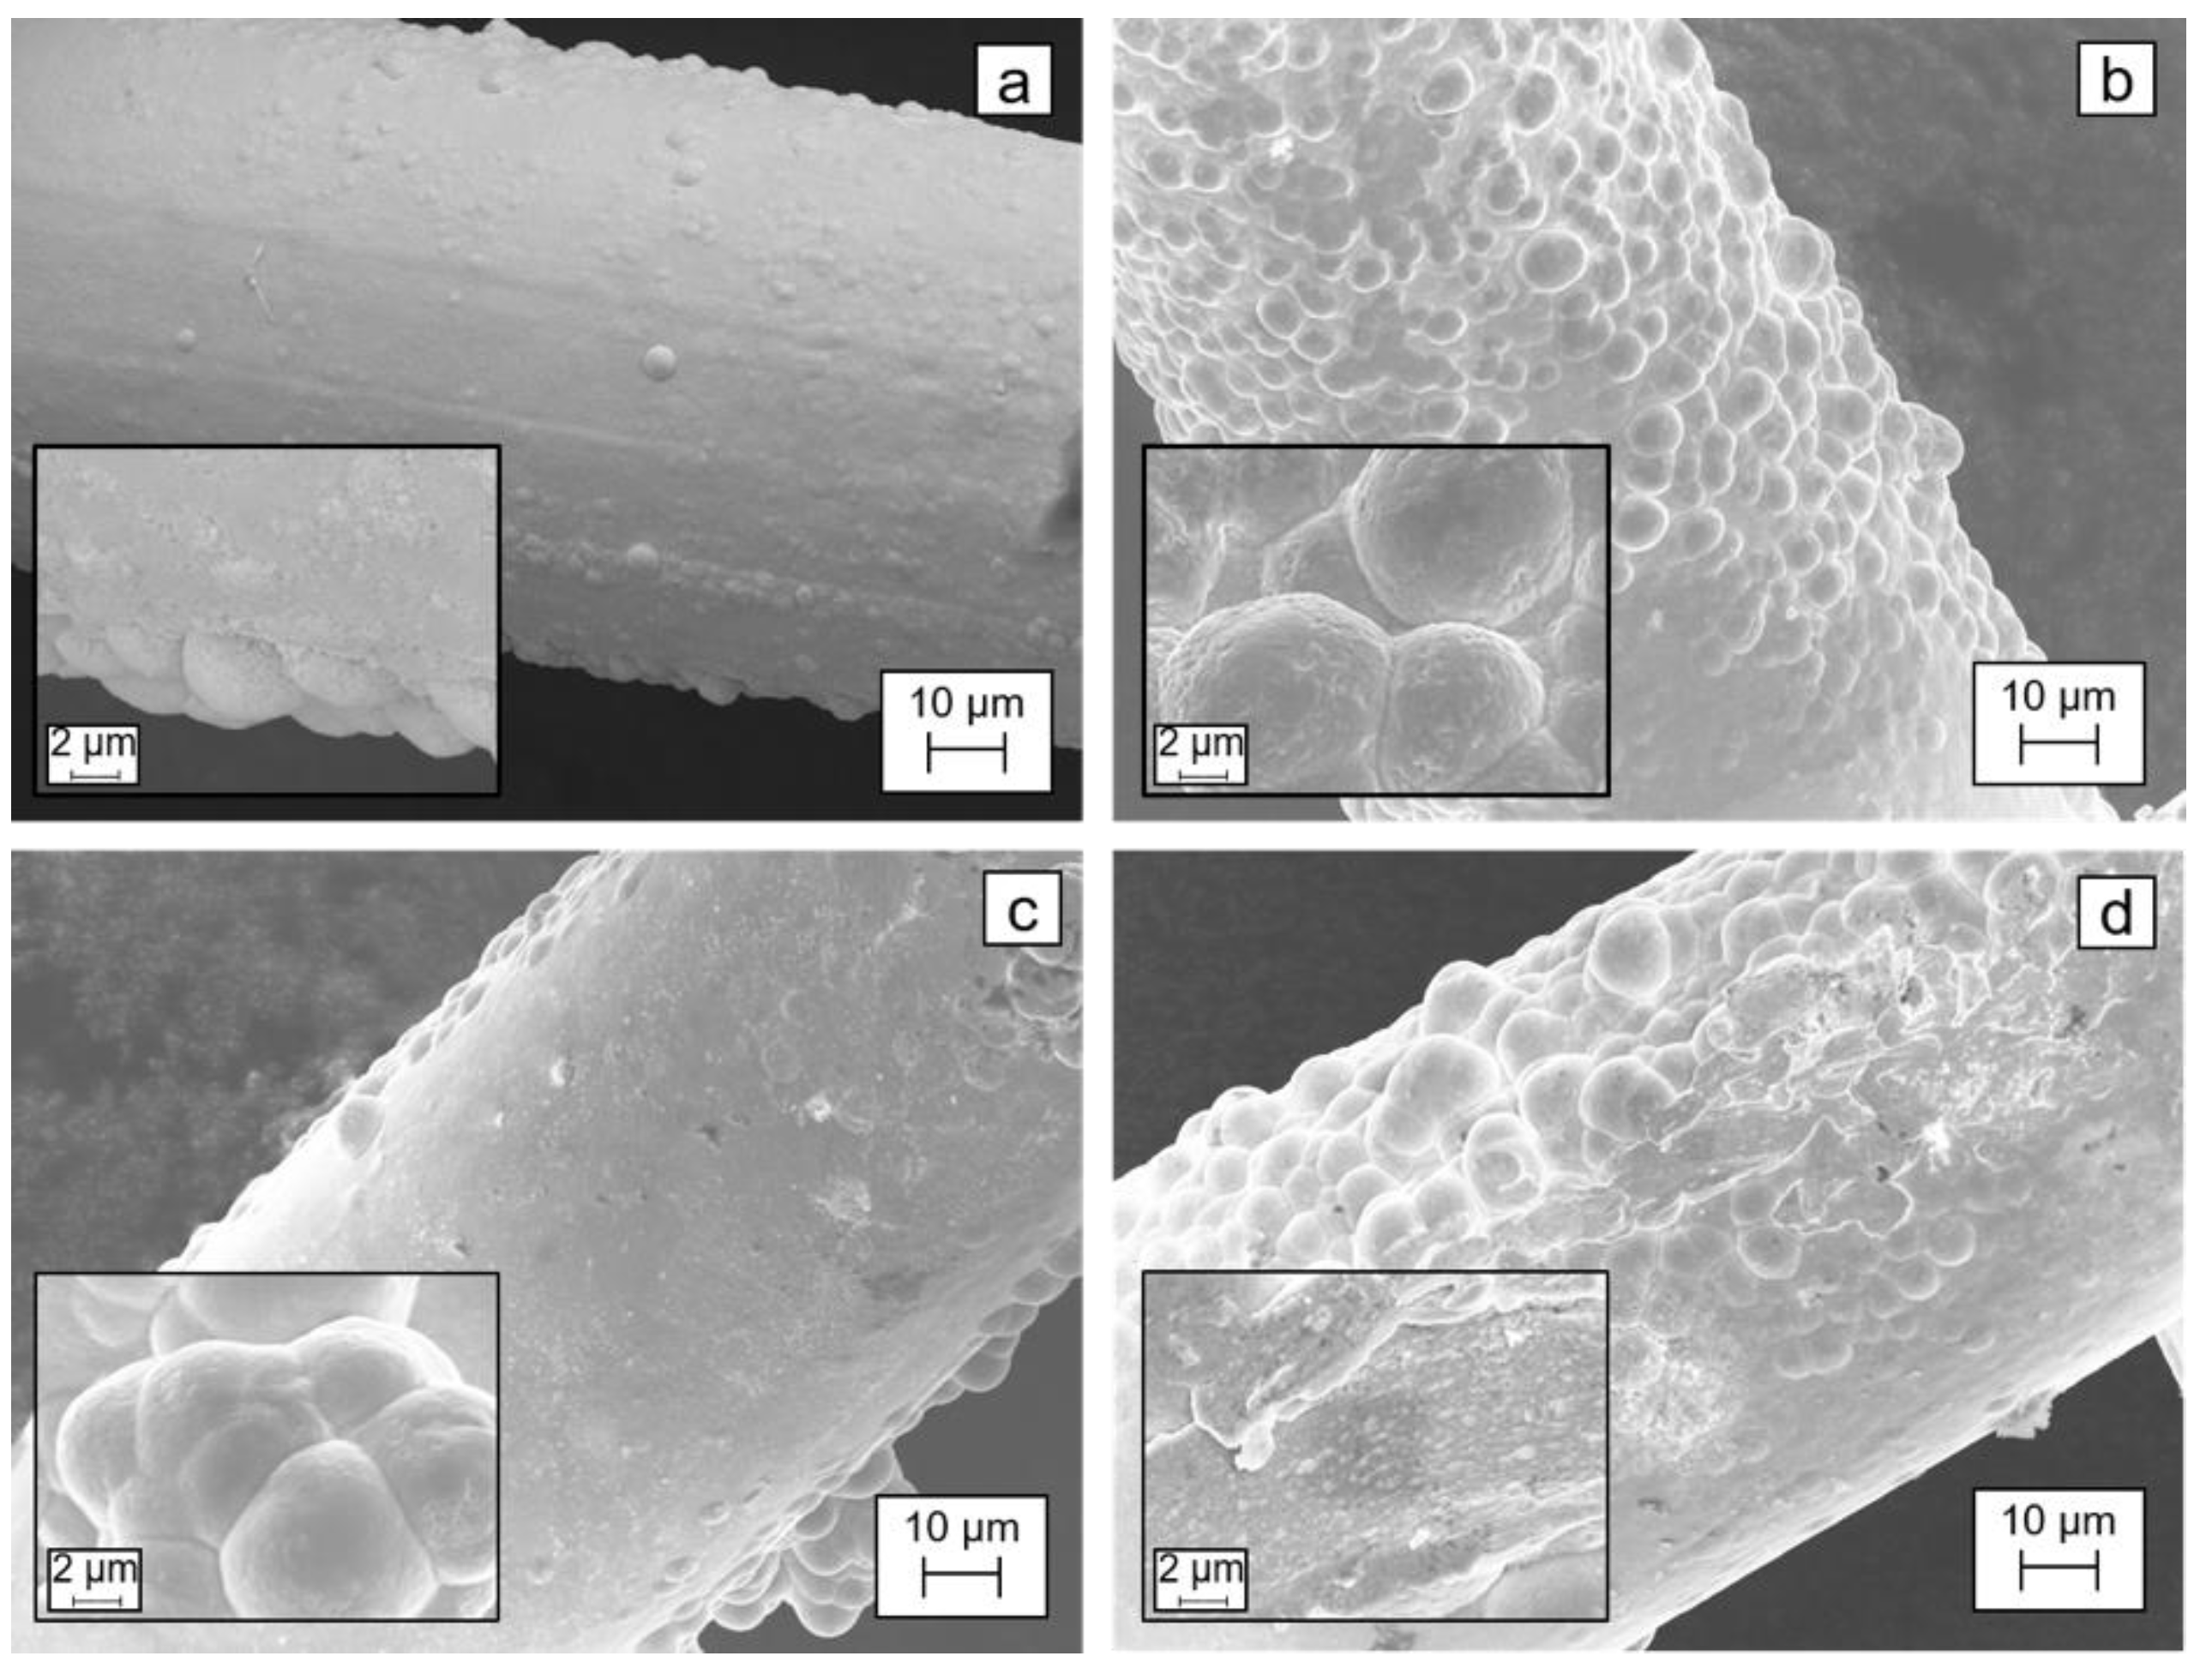
Iridium oxide is the state-of-the-art anode used in the chlor-alkali industry for chlorine production, and it is the best anode material for oxygen or chlorine evolution [21]. Iridium oxide has high durability and is not affected at the low current used in the deoxygenation cell. Due to the reported high stability for iridium oxide, only the silver mesh and cation exchange membrane were analyzed in SEM with EDS after experiments in Cell A. Figure 6 shows the images of the silver mesh before and after experiments in the deoxygenation cell using acidic, basic, and neutral anolytes. The insets in Figure 6 show the morphology of electroplated silver at 2500× magnification. The images at different parts of the mesh were different as the electroplated silver had different appearances (formation of structures similar to bubbles on the silver surface); however, the silver layer was intact and there was no observation of significant change in the amount of silver before and after the experiments. The mass of the silver mesh was unaltered after the test, suggesting that there was no loss of electroplated silver during the operation.
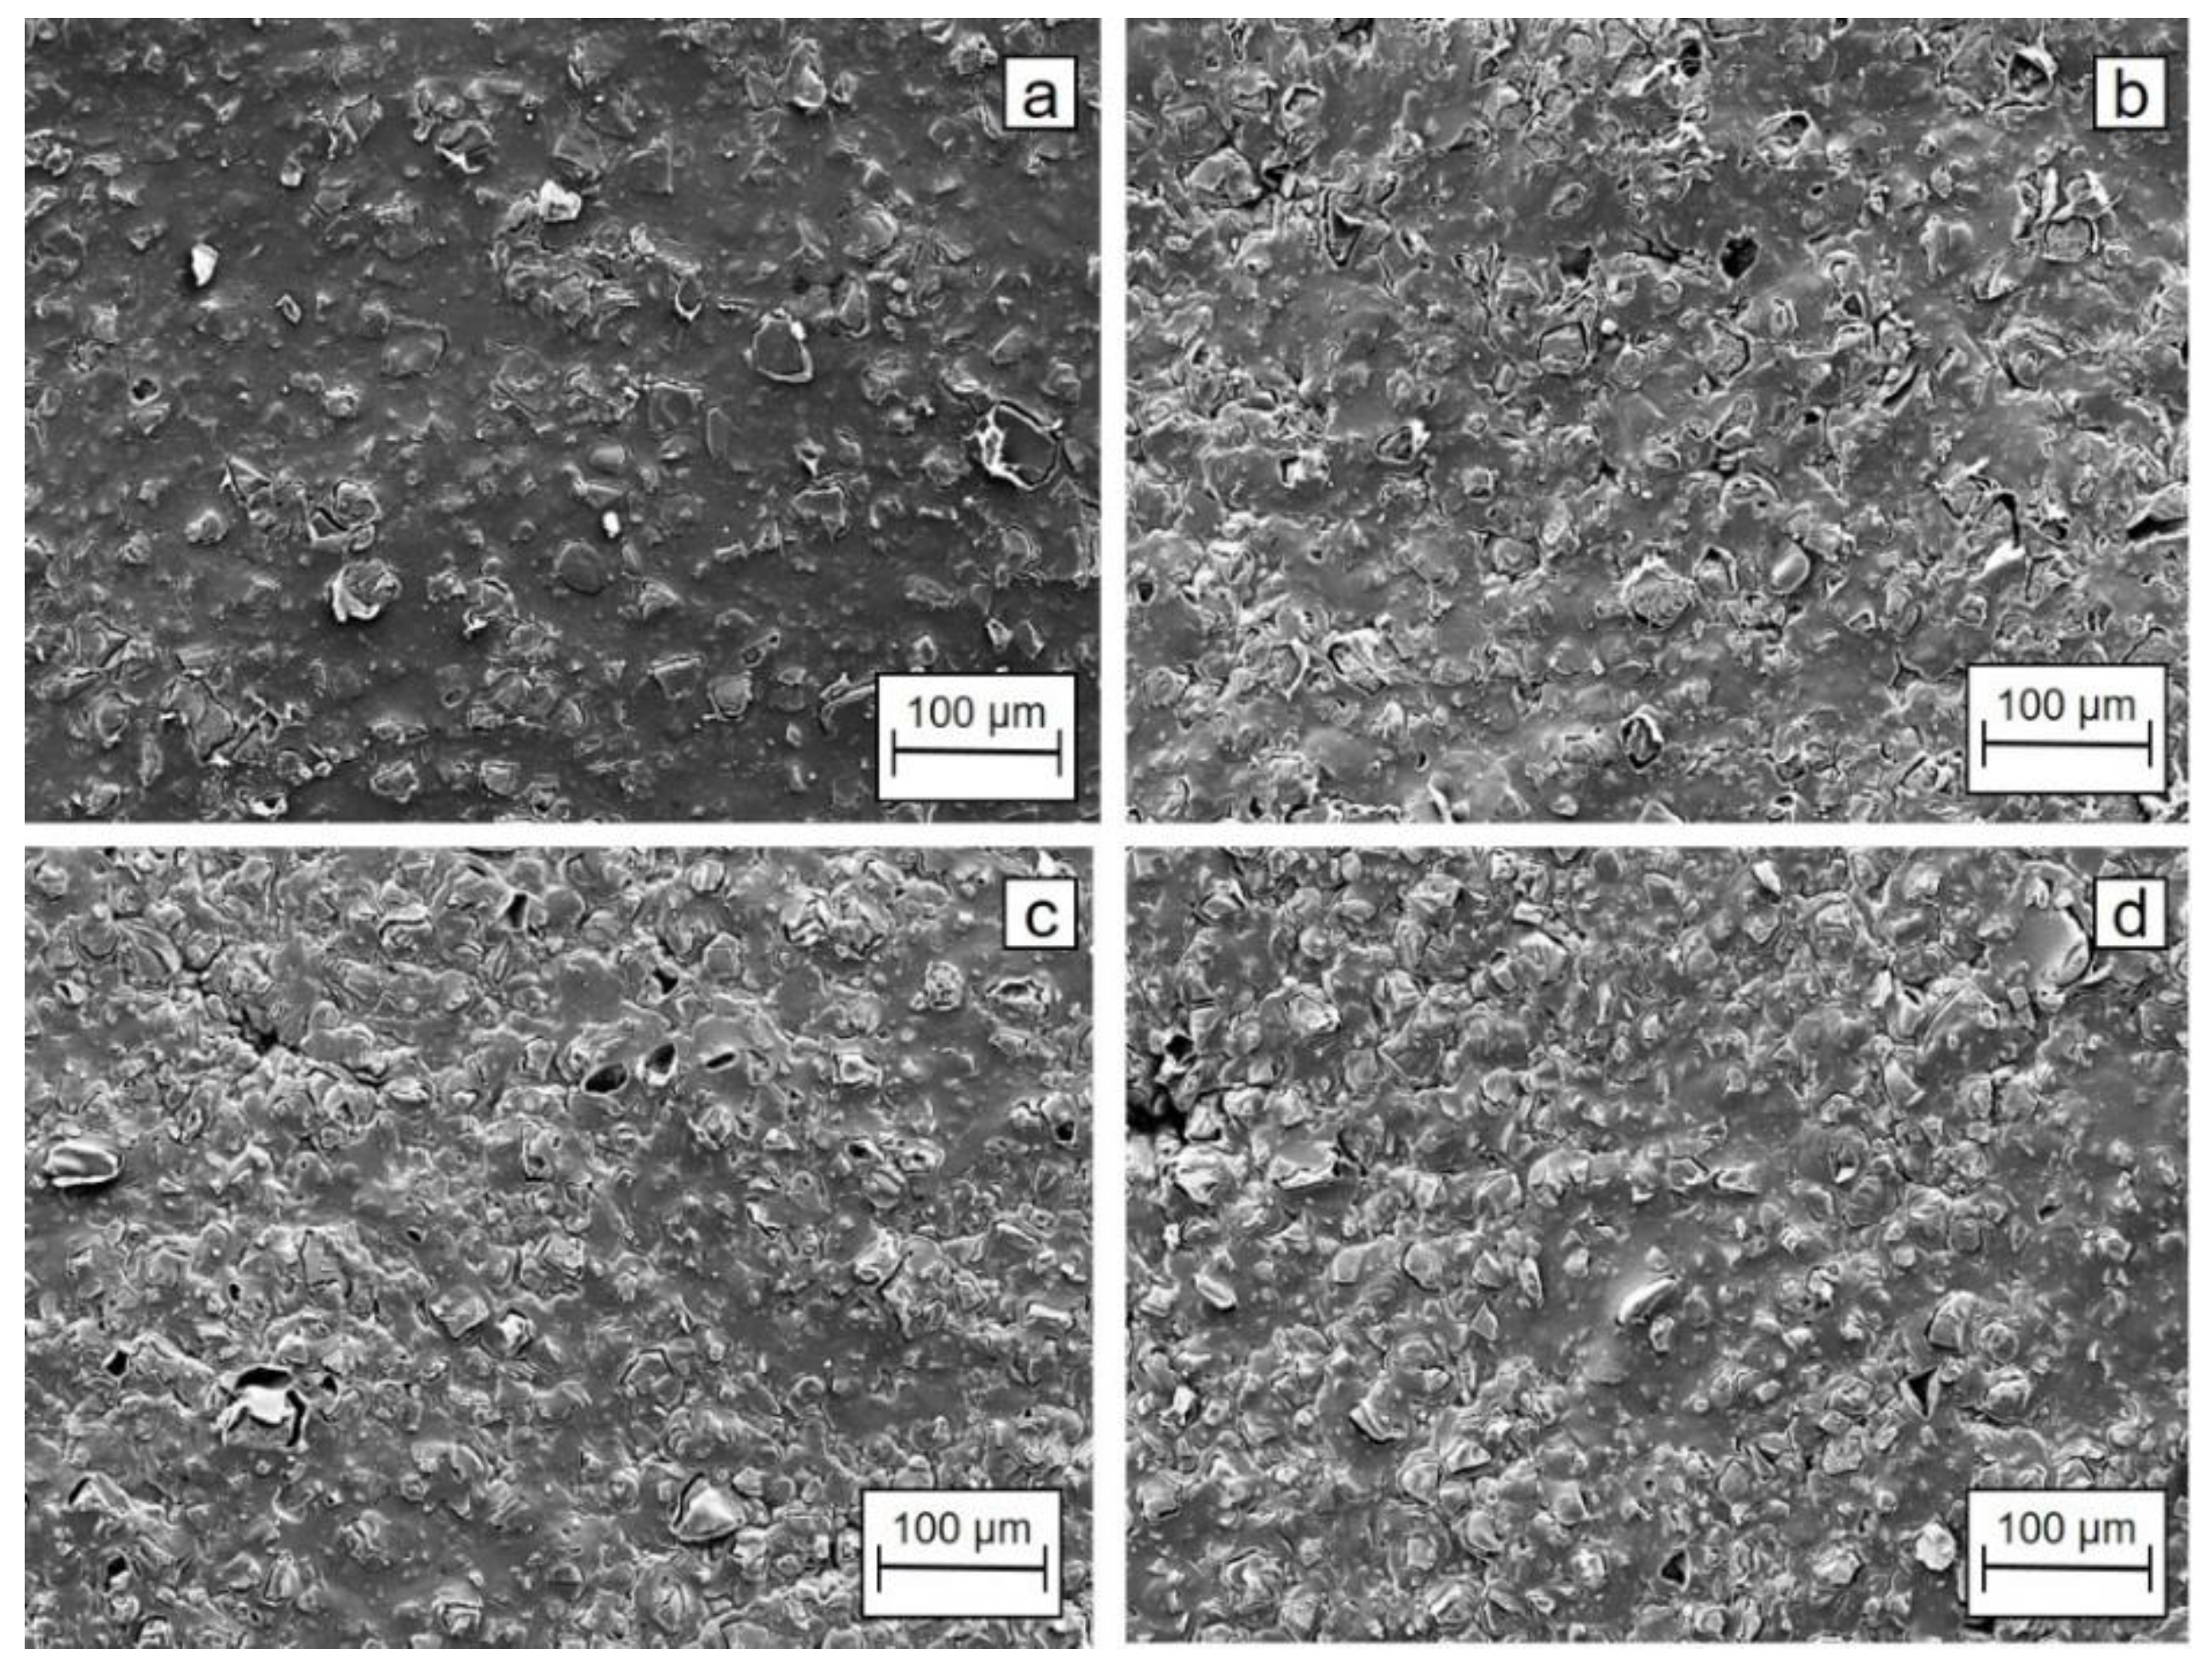
The SEM images of CEM before and after the test in acidic, basic, and neutral anolytes are depicted in Figure 7. The membrane was found to be working properly, and the results obtained in the deoxygenation cell were as expected. However, the specification for the membrane stated that the stability of the membrane might be affected by the use of solutions at very low or at very high pH values. Thus, it was recommended to use solutions with pH values in the range of 2–10. However, during these short experiments, the membrane was not found to be affected by acidic or neutral anolytes as determined by SEM examinations. However, the EDS results indicated an increase in F/C ratio of the elemental composition of the membrane tested. This was less pronounced in the alkaline electrolyte compared to the other electrolytes (more details in Supplementary Materials).
3.6. Assessment of Anolytes for Industrial Deoxygenation Cell
In our previous work, seawater was used both as an anolyte and catholyte [2]. The pH of the anolyte and catholyte were the same and, during operations, the anolyte became acidic and the catholyte became alkaline. However, at high flow rates of anolyte, the concentration of hydrogen ion does not increase significantly. Higher flow rates of anolyte and catholyte reduce the pH change in the solution, since the retention time of electrolytes in the anode and cathode chambers decreases with increasing flow rate.
The catholyte for the tests was 0.5 M NaCl (pH range 6–7); however, during stabilization before experiments, the acidic anolyte made the stagnant catholyte acidic (pH 5), and the alkaline anolyte made the catholyte slightly alkaline (pH 9). In our previous study [1], the pH of the anolyte that was stagnant decreased significantly from pH 8.00 to pH 2.16. Thus, for an industrial-scale deoxygenation cell, it is recommended to avoid keeping the anolyte stagnant. Instead, the anolyte should have a certain flow rate, and the pH should be monitored. Based on the results described herein, an alkaline buffer solution can be recommended as an anolyte because no production of hydrogen peroxide was detected under those conditions. In addition, this solution has a large pH operation range before having a negative effect on the membrane. Monitoring of the pH for the anolyte can ensure the desired performance of the deoxygenation cell.
4. Conclusions
The performance and side reactions in the deoxygenation cell were found to be affected upon using anolytes with different pH. The use of alkaline solution yielded the best results for maximum oxygen removal with minimal side reactions. A voltage of 2.2 V or lower was observed as optimal for minimal side reactions in these deoxygenation cells. Lower cell voltage can yield hydrogen peroxide at the cathode, and higher voltage can yield more negative potential at the cathode, which increases the risk of produce hydrogen gas. The monitoring of cathode potential is crucial in order to avoid side reactions. The silver mesh and membrane were not found to be affected significantly during these short-term experiments with different pH electrolytes.
Supplementary Materials
Materials for error bars and standard deviation calculated for the measured are available online at https://www.mdpi.com/2076-3417/8/11/2280/s1.
Author Contributions
Conceptualization, U.R.D.; methodology, U.R.D.; validation, U.R.D., M.O.S., H.U., and T.H.; formal analysis, U.R.D., M.O.S., and T.H.; writing—original draft preparation, U.R.D.; writing—review and editing, U.R.D., M.O.S., and T.H.; supervision, M.O.S., H.U., and T.H.; project administration, H.U.; funding acquisition, H.U.
Funding
This research was funded by the Research Council of Norway (Project 246533).
Acknowledgments
The authors are grateful for the provision of an industrial fellowship to U.R.D. from the Research Council of Norway (Project 246533). Authors acknowledge the help from Wakshum Mekonnen Tucho for the assistance with SEM analyses.
Conflicts of Interest
The authors declare no conflicts of interest. The funders had no role in the design of the study; in the collection, analyses, or interpretation of data; in the writing of the manuscript, or in the decision to publish the results.
References
- Dotel, U.R.; Vuorilehto, K.; Sydnes, M.O.; Urkedal, H.; Hemmingsen, T.H. Experimental Study of Silver Cathode for Electrochemical Deoxygenation of Seawater for Enhanced Oil Recovery. Ind. Eng. Chem. Res. 2016, 30, 8235–8242. [Google Scholar] [CrossRef]
- Dotel, U.R.; Vuorilehto, K.; Sydnes, M.O.; Urkedal, H.; Hemmingsen, T.H. Electrochemical Oxygen Removal from Seawater in Industrial Scale using Silver Cathode. Ind. Eng. Chem. Res. 2017, 31, 8954–9860. [Google Scholar] [CrossRef]
- Nørskov, J.K.; Rossmeisi, J.; Logadottir, A.; Lindqvist, L.; Kitchin, J.R.; Bligaard, T.; Jonsson, H. Origin of the Overpotential for Oxygen Reduction at a Fuel-Cell Cathode. J. Phys. Chem. B 2004, 46, 17886–17892. [Google Scholar] [CrossRef]
- Wang, B. Recent Development of Non-platinum Catalysts for Oxygen Reduction Reaction. J. Power Sources 2005, 152, 1–15. [Google Scholar] [CrossRef]
- Gasteiger, H.A.; Kocha, S.S.; Sompalli, B.; Wagner, F.T. Activity Benchmark and Requirements for Pt, Pt-Alloy, and Non-Pt Oxygen Reduction Catalysts for PEMFCs. Appl. Catal. B 2005, 56, 9–35. [Google Scholar] [CrossRef]
- Jaouen, F.; Proietti, E.; Lefevre, M.; Chenitz, R.; Dodelet, J.P.; Wu, G.; Chung, H.T.; Johnston, C.M.; Zeleney, P. Recent Advances in Non-precious Metal Catalysts for Oxygen-Reduction Reaction in Polymer Electrolyte Fuel Cells. Energy Environ. Sci. 2011, 4, 114–130. [Google Scholar] [CrossRef]
- Bezerra, C.W.B.; Zhang, L.; Lee, K.C.; Liu, H.S.; Marques, A.L.B.; Marques, E.P.; Wang, H.J.; Zhang, J.J. A Review of Fe–N/C and Co–N/C Catalysts for the Oxygen Reduction Reaction. Electrochim. Acta 2008, 15, 4937–4951. [Google Scholar] [CrossRef]
- Morozan, A.; Jousselme, B.; Palacin, S. Low-platinum and Platinum-Free Catalysts for the Oxygen Reduction Reaction at Fuel Cell Cathodes. Energy Environ. Sci. 2011, 4, 1238–1254. [Google Scholar] [CrossRef]
- Su, D.S.; Sun, G.Q. Nonprecious-Metal Catalysts for Low-cost Fuel Cells. Angew. Chem. Int. Ed. 2011, 50, 11570–11572. [Google Scholar] [CrossRef] [PubMed]
- Medard, C.; Lefevre, M.; Dodelet, J.P.; Jaouen, F.; Lindbergh, G. Oxygen Reduction by Fe-based Catalysts in PEM Fuel Cell Conditions: Activity and Selectivity of the Catalysts obtained with Two Fe Precursors and various Carbon Supports. Electrochim. Acta 2006, 51, 3202–3213. [Google Scholar] [CrossRef]
- Choi, C.H.; Lee, S.Y.; Park, S.H.; Woo, S.I. Highly Active N-doped-CNTs Grafted on Fe/C Prepared by Pyrolysis of Dicyandiamide on Fe2O3/C for Electrochemical Oxygen Reduction Reaction. Appl. Catal. B 2011, 103, 362–368. [Google Scholar] [CrossRef]
- Liang, Y.Y.; Li, Y.G.; Wang, H.L.; Zhou, J.G.; Wang, J.; Regier, T.; Dai, H.J. Co3O4 Nanocrystals on Graphene as a Synergistic Catalyst for Oxygen Reduction Reaction. Nat. Mater. 2011, 10, 780. [Google Scholar] [CrossRef] [PubMed]
- Chang, C.H.; Yuen, T.S.; Nagao, Y.; Yugami, H. Electrocatalytic Activity of Iridium Oxide Nanoparticles coated on Carbon for Oxygen Reduction as Cathode Catalyst in Polymer Electrolyte Fuel Cell. J. Power Sources 2010, 195, 5938–5941. [Google Scholar] [CrossRef]
- Charreteur, F.; Jaouen, F.; Ruggeri, S.; Dodelet, J.P. Fe/N/C Non-Precious Catalysts for PEM Fuel Cells: Influence of the Structural Parameters of Pristine Commercial Carbon Blacks on their Activity for Oxygen Reduction. Electrochim. Acta 2008, 53, 2925–2938. [Google Scholar] [CrossRef]
- Wang, S.Y.; Yu, D.S.; Dai, L.M.; Chang, D.W.; Baek, J.B. Polyelectrolyte-functionalized graphene as metal-free electrocatalysts for oxygen reduction. ACS Nano 2011, 5, 6202–6209. [Google Scholar] [CrossRef] [PubMed]
- Sun, M.; Liu, H.; Liu, Y.; Qu, J.; Li, J. Graphene-Based Transition Metal Oxide Nanocomposites for the Oxygen Reduction Reaction. Nanoscale 2015, 7, 1250–1269. [Google Scholar] [CrossRef] [PubMed]
- Sun, M.; Dong, Y.; Zhang, G.; Qu, J.; Li, J. α-Fe2O3 Spherical Nanocrystals Supported on CNTs as Efficient Non-Noble Electrocatalysts for the Oxygen Reduction Reaction. J. Mater. Chem. A 2014, 33, 13635–13640. [Google Scholar] [CrossRef]
- Sun, M.; Liu, H.; Qu, J.; Li, J. Earth-Rich Transition Metal Phosphide for Energy Conversion and Storage. Adv. Energy Mater. 2016, 13, 1600087. [Google Scholar] [CrossRef]
- Wang, Y.J.; Wilkinson, D.P.; Zhang, J.J. Noncarbon Support Materials for Polymer Electrolyte Membrane Fuel Cell Electrocatalysts. Chem. Rev. 2011, 111, 7625–7651. [Google Scholar] [CrossRef] [PubMed]
- Varcoe, J.R.; Slade, R.C.T.; Wright, G.L.; Chen, Y. Steady-State dc and Impedance Investigations of H2/O2 Alkaline Membrane Fuel Cells with Commercial Pt/C, Ag/C, and Au/C Cathodes. J. Phys. Chem. B 2006, 110, 21041–21049. [Google Scholar] [CrossRef] [PubMed]
- Chatenet, M.; Genies-Bultel, L.; Aurousseau, M.; Durand, R.; Andolfatto, F. Oxygen reduction on silver catalysts in solutions containing various concentrations of sodium hydroxide—Comparison with platinum. J. Appl. Electrochem. 2002, 32, 1131–1140. [Google Scholar] [CrossRef]
- Guo, J.; Hsu, A.; Chu, D.; Chen, R. Improving Oxygen Reduction Reaction Activities on Carbon-Supported Ag Nanoparticles in Alkaline Solutions. J. Phys. Chem. C 2010, 114, 4324–4330. [Google Scholar] [CrossRef]
- Fabbri, E.; Habereder, A.; Walter, K.; Kotz, R.; Schmidt, T.J. Developments and Prespectives of Oxide-Based Catalysts for the Oxygen Evolution Reaction. Catal. Sci. Technol. 2014, 4, 3800–3821. [Google Scholar] [CrossRef]
- Trasatti, S. Electrocatalysis: Understanding the Success of DSA®. Electrochim. Acta 2000, 45, 2377–2385. [Google Scholar] [CrossRef]
- Trasatti, S. Electrocatalysis in the Anodic Evolution of Oxygen and Chlorine. Electrochim. Acta 1984, 29, 1503–1512. [Google Scholar] [CrossRef]
- McCrory, C.C.L.; Jung, S.; Peters, J.C.; Jaramillo, T.F. Benchmarking Heterogeneous Electrocatalysts for the Oxygen Evolution Reaction. J. Am. Chem. Soc. 2013, 135, 16977–16987. [Google Scholar] [CrossRef] [PubMed] [Green Version]
- Giordano, L.; Han, B.; Risch, M.; Hong, W.T.; Rao, R.R.; Stoerzinger, K.A.; Shao-Horn, Y. pH Dependence of OER Activity of Oxides: Current and Future Perspectives. Catal. Today 2016, 262, 2–10. [Google Scholar] [CrossRef]
- Blizanac, B.B.; Ross, P.N.; Markovic, N.M. Oxygen Electroreduction on Ag (111): The pH Effect. Electrochim. Acta 2007, 6, 2264–2271. [Google Scholar] [CrossRef]
Figure 1.
(a) Side view of Cell A and Cell B; (b) front view of Cell A; (c) front view of Cell B.

Figure 2.
Schematic diagram of the experimental set-up.

Figure 3.
Theoretical currents calculated for different flow rates of catholyte.

Figure 4.
Cell voltage and resulting cathode potential (vs. reversible hydrogen electrode (RHE)) in different buffer solutions.
Figure 4.
Cell voltage and resulting cathode potential (vs. reversible hydrogen electrode (RHE)) in different buffer solutions.

Figure 5.
Cell voltage and current output in the buffer solutions.

Figure 6.
SEM images of (a) unused silver mesh, and after tests with (b) acidic anolyte, (c) neutral anolyte, and (d) alkaline anolyte.
Figure 6.
SEM images of (a) unused silver mesh, and after tests with (b) acidic anolyte, (c) neutral anolyte, and (d) alkaline anolyte.

Figure 7.
SEM images of (a) unused membrane, and after tests in (b) acidic anolyte, (c) neutral anolyte, and (d) alkaline anolyte.
Figure 7.
SEM images of (a) unused membrane, and after tests in (b) acidic anolyte, (c) neutral anolyte, and (d) alkaline anolyte.


Table 1.
Buffer solutions used as anolytes.
| Buffer Solutions | pH | |
|---|---|---|
| Acidic: 10 mM H3PO4/H2PO4− buffer | 0.78 g NaH2PO4.2H2O (5 mmol) 0.34 mL H3PO4 (85%, 14.7 M) (5 mmol) Diluted with water to 1 L | 2.6 |
| Neutral: 100 mM H2PO4−/HPO42− buffer | 500 mL 0.1 M KH2PO4.2H2O 291 mL 0.1 M NaOH Diluted with water to 1 L | 7.0 |
| Alkaline: 100 mM H3BO3/H2BO3− buffer | 6.18 g H3BO3 (100 mmol) 2.81 g KOH (50 mmol) Diluted with water to 1 L | 9.1 |
Table 2.
Effect of voltage on oxygen removal, pH, and conductivity in 0.1 M NaOH anolyte.
| Time (min) | Voltage (V) | Current (mA) | Oxygen Conc. (ppm) | Anolyte Conductivity (mS·cm−1) | Anolyte pH | Catholyte Conductivity (mS·cm−1) | Catholyte pH |
|---|---|---|---|---|---|---|---|
| 0 | - | - | 8.44 | 14.6 | 13 | 46.8 | 9 |
| 30 | 1.9 | 14 | 1.31 | 14.6 | 13 | 46.8 | 9 |
| 60 | 2.0 | 17 | 1.20 | 14.6 | 13 | 46.8 | 9 |
| 90 | 2.1 | 21 | 1.06 | 14.5 | 13 | 46.9 | 10 |
| 120 | 2.2 | 27 | 0.81 | 14.2 | 13 | 46.9 | 10 |
| 150 | 2.3 | 34 | 0.55 | 14.1 | 13 | 46.9 | 10 |
Table 3.
Effect of voltage on oxygen removal, pH, and conductivity in 0.1 M HNO3 anolyte.
| Time (min) | Voltage (V) | Current (mA) | Oxygen Conc. (ppm) | Anolyte Conductivity (mS·cm−1) | Anolyte pH | Catholyte Conductivity (mS·cm−1) | Catholyte pH |
|---|---|---|---|---|---|---|---|
| 0 | - | - | 8.18 | 42.8 | 1 | 47.1 | 5 |
| 30 | 1.9 | 10 | 2.99 | 43.2 | 1 | 46.8 | 5 |
| 60 | 2.0 | 12 | 2.25 | 43.1 | 1 | 46.8 | 5 |
| 90 | 2.1 | 15 | 2.20 | 43.1 | 1 | 46.8 | 5 |
| 120 | 2.2 | 21 | 2.13 | 43.1 | 1 | 46.7 | 5 |
| 150 | 2.3 | 27 | 1.60 | 43.0 | 1 | 46.7 | 5 |
Table 4.
Effect of voltage on oxygen removal, pH, and conductivity in 0.1 M NaNO3 anolyte.
| Time (min) | Voltage (V) | Current (mA) | Oxygen Conc. (ppm) | Anolyte Conductivity (mS·cm−1) | Anolyte pH | Catholyte Conductivity (mS·cm−1) | Catholyte pH |
|---|---|---|---|---|---|---|---|
| 0 | - | - | 8.10 | 10.0 | 6 | 46.5 | 6 |
| 30 | 1.9 | 10 | 2.72 | 10.0 | 4 | 46.5 | 8 |
| 60 | 2.0 | 11 | 2.52 | 10.0 | 4 | 46.5 | 8 |
| 90 | 2.1 | 10 | 2.00 | 10.2 | 4 | 46.6 | 8 |
| 120 | 2.2 | 11 | 1.81 | 10.2 | 4 | 46.6 | 9 |
| 150 | 2.3 | 12 | 1.86 | 10.2 | 4 | 46.7 | 9 |
© 2018 by the authors. Licensee MDPI, Basel, Switzerland. This article is an open access article distributed under the terms and conditions of the Creative Commons Attribution (CC BY) license (http://creativecommons.org/licenses/by/4.0/).
Share and Cite
MDPI and ACS Style
Dotel, U.R.; Sydnes, M.O.; Urkedal, H.; Hemmingsen, T. The Effects of Acidic, Alkaline, and Neutral Anolytes on Electrochemical Seawater Deoxygenation. Appl. Sci. 2018, 8, 2280. https://doi.org/10.3390/app8112280
AMA Style
Dotel UR, Sydnes MO, Urkedal H, Hemmingsen T. The Effects of Acidic, Alkaline, and Neutral Anolytes on Electrochemical Seawater Deoxygenation. Applied Sciences. 2018; 8(11):2280. https://doi.org/10.3390/app8112280
Chicago/Turabian StyleDotel, Utsav Raj, Magne Olav Sydnes, Hans Urkedal, and Tor Hemmingsen. 2018. "The Effects of Acidic, Alkaline, and Neutral Anolytes on Electrochemical Seawater Deoxygenation" Applied Sciences 8, no. 11: 2280. https://doi.org/10.3390/app8112280
Note that from the first issue of 2016, this journal uses article numbers instead of page numbers. See further details here.