Autocorrelation Analysis of Vibro-Acoustic Signals Measured in a Test Field for Water Leak Detection


1
DIN—Department of Industrial Engineering, University of Bologna, 40136 Bologna, Italy
2
CIRI—Advanced Applications in Mechanical Engineering and Materials Technology, University of Bologna, 40136 Bologna, Italy
*
Author to whom correspondence should be addressed.
Appl. Sci. 2018, 8(12), 2450; https://doi.org/10.3390/app8122450
Submission received: 21 October 2018
/
Revised: 22 November 2018
/
Accepted: 27 November 2018
/
Published: 1 December 2018
(This article belongs to the Special Issue Structural Damage Detection and Health Monitoring)
Abstract
:Featured Application
The proposed method may be adopted for developing and implementing an automated system for the early detection of leaks occurring in service pipes of water distribution networks.
Abstract
Reducing losses in water distribution networks is a worldwide challenge and all utilities are developing proper strategies for the active control of leaks. Temporary or permanent grids of units for the continuous monitoring of pipelines through vibro-acoustic measurements are probably the most commonly adopted leak detection systems. Such systems generally rely on the definition of proper thresholds to detect increments in the vibration levels associated with leaks. Since the thresholds are strongly dependent on the local boundary conditions of the monitored network, the initial setup is costly and time consuming, and the risk of undetected leaks or false alarms increases. This work aims to investigate leak detection methods based on the inherent properties of the measured signals instead of their relative amplitude. In particular, the possibility of detecting water leaks in small-diameter plastic pipes by analyzing the autocorrelation function of vibro-acoustic signals is assessed. An experimental campaign is conducted in a full-scale test facility that simulates the actual network. The measurements concerning artificially generated leaks are attained by two accelerometers and one hydrophone. The experimental results confirm the effectiveness of the proposed approach, which is therefore proven as a promising tool for leak detection.
1. Introduction
The active control of leaks is essential for limiting losses affecting water distribution networks, which may reach a sizeable percentage of the input volume [1,2,3]. Accordingly, numerous methods and technologies for detecting and locating leaks have been proposed, each one characterized by its own pros and cons [4,5,6,7,8,9,10,11,12,13,14,15,16]. The methods that proved the most effective are briefly summarized.
Techniques based on the monitoring of leak-related noise and vibrations are by far the most commonly adopted [4,5,6,7,8,9,10,15,16]. These techniques are non-invasive and can be applied without altering the operational conditions of the network. The detection process may be automated by means of proper indices [6,7,8,9]. Automated leak pinpointing can be also achieved by using the cross-correlation of signals measured by two different sensors [4,5,16]. Nevertheless, the technique’s effectiveness may be reduced in the case of plastic pipes, due to a higher signal attenuation with respect to metallic pipes; moreover, they are typically only effective over a limited distance range. Methods exploiting induced hydraulic transients can detect and locate leaks within a wide range, but the pressure peaks can potentially damage the pipes [10,16]. Acoustic emission (AE) monitoring has been proven as an effective method for detecting very small leaks over long distances [11,16]; however, its effectiveness may depend on the possibility of artificially amplifying the leak noise by injecting gas or increasing the fluid pressure in the monitored pipes (procedures that are not always allowed during normal operation), and it may be less effective with plastic pipes as well. Tracer gas techniques can reliably provide leak detection and location [4,16]; nonetheless, they are not suitable for all kinds of leaks and the isolation of the monitored pipe from the network is typically required. Thermography can detect and locate leaks over large areas [4,12], but its effectiveness may be affected by seasonal temperatures and thermal noise (e.g., large urban areas). Ground penetrating radar (GPR) is also characterized by a large monitoring area and high accuracy [4,13,14,15]; nonetheless, the detection may be hampered by underground anomalies and buried objects other than pipes, and also because of the sizeable amount of signal attenuation in wet soil with high clay content. Electrical resistivity tomography (ERT) can provide leak detection and location [14,15], but has a low resolution and requires inserting electrodes in the ground, which is not always viable. Time domain reflectometry (TDR) and quasi-static magnetic fields [14,15] are marginally affected by the environmental disturbances, but are basically suitable for metallic pipes only.
Leak detection systems based on devices that are temporarily or permanently deployed throughout the pipeline networks to measure vibro-acoustic signals (e.g., noise loggers [15,17]) are probably the most common in practical applications. These systems, although providing satisfactory results, may present some drawbacks, particularly when no cross-correlation techniques are adopted [18]. Typically, their operation is based on the detection of increments in the vibration levels, which are expected to occur when leaks start and grow [7,8,17]. Consequently, the correct definition of threshold values characterizing the background noise associated with the non-leaking state is essential for their effectiveness. In general, such thresholds are closely related to the local boundary conditions of the monitored locations of the pipeline network, hence a costly and time consuming initial setup being possibly required for each measuring unit. In addition, the presence of pre-existent leaks should be checked carefully to avoid missed detections. Finally, without a unique reference value, optimizing the threshold to achieve the desired sensitivity to leaks is problematic, thus possibly leading to an increased risk of false alarms.
The main objective of the present research is developing novel leak detection methods based on the inherent properties of the measured signals, rather than methods based on a comparison between vibration levels, thus being possibly independent from the local boundary conditions of the monitored pipe location. In particular, a technique based on the shape of the normalized autocorrelation function, whose trend is described by a single scalar parameter (namely the kurtosis), is presented and tested through experimental measurements.
This work focuses on the detection of burst leaks occurring in high-density polyethylene (HDPE) pipes of small-diameter, which are being increasingly adopted for service connections in water supply networks with respect to metal pipes [18,19,20]. Such leaks are often harder to detect, due to the low flow rates typically exhibited and the higher signal attenuation [4,5,18,19,20,21], hence resulting in longer total runtime. Since each water district generally includes thousands of service pipes, the overall losses generated by these leaks may be extremely high [1,22]. Therefore, efficiently managing such leaks is essential as well.
An experimental campaign is conducted in a test facility in order to assess the effectiveness of the proposed leak detection approach based on signal autocorrelation. In particular, leaks are artificially generated on a HDPE small-diameter pipe that closely mimics a service pipe of typical water distribution networks. The vibro-acoustic signals related to the active leaks and the non-leaking condition are measured by using a hydrophone (fluid-borne pressure waves) and two accelerometers (radial and longitudinal pipe wall vibrations). Two datasets are gathered in different periods of the year to verify the influence of seasonal modifications in the conditions of the surrounding medium. The detection performances provided by the different transducers are evaluated and compared.
2. Materials and Methods
The experiments were conducted in a test facility that replicates a typical portion of a water distribution network (Figure 1), which had already been used by the authors previously for investigating and developing other leak detection algorithms [19]. One polyvinyl chloride (PVC) pipe with an outer diameter of 90 mm (DN 90) was used as water main. Several plastic pipes of smaller diameter (DN 32) were connected to the larger one as customer service pipes. A two-way shut-off valve was installed at each termination of each service pipe, inside manholes. All the pipes were buried under ~0.5 m of backfill soil. A pressure tank fed the rig at constant (and adjustable) water pressure.
All measurements were performed on a HDPE pipe of length 28 m. Pressure was kept constant at 350 kPa, which is a common operating condition in the networks of interest.
Leaks were artificially induced at three different locations along the pipe, accessible through manholes (Figure 1), in order to assess the detection performance for different distances between the leaks and transducers. The distance values from the terminal valve port are reported in Table 1. The k-th leak (Lk) was generated by damaging the pipe wall with a single longitudinal cut of 20 mm (parallel to the pipe axis), which simulates one the most common kind of cracks characterizing burst leaks occurring in HDPE service pipes [19]. Each crack was expected to generate a leaking flow of about 200 L/h at 350 kPa, which is the minimum leak rate to detect. Pipe repair clamps were installed for each leak to allow rapid switching between leaking and non-leaking conditions (Figure 1b,c). A static electromagnetic flow meter, namely a SENSUS iPERL (Xylem Inc., Rye Brook, NY, USA) with a low starting flow rate (about 4 L/h) was installed at the pipe T-joint, monitoring the leaking flow (Figure 1a). This kind of flow meter does not include mechanical moving parts, hence it does not affect the measurements with additional undesired noise/vibrations. The measured flow rates are reported in Table 1. Leak L3, generated for previous experiments and having a flow rate more than an order of magnitude greater than the other two leaks, is included in the measurements to test the proposed method on a large but relatively distant leak.
Three sensors were installed on the pipe terminal valve (Figure 2), to simulate a possible setup of real distribution networks (where the transducers should be located some meters away from the water main, near the customer water meter). Two integrated electronic piezoelectric excitation (IEPE) monoaxial accelerometers (PCB 333B55, PCB Piezotronics, Depew, NY, USA, sensitivity 1 V/g) detected radial (referred to as Ard) and axial (i.e., longitudinal, referred to as Aax) shell/wall vibrations, respectively. A piezoelectric hydrophone (Wilcoxon Research H571LD-1A, Meggitt PLC, Christchurch, UK, sensitivity −187 dB, ref. 1 V/μPa) measured fluid-borne leak-related noise (referred to as Hyd). The hydrophone was fastened to the threaded port of the terminal valve, thus causing no water flow to exit the pipe when the valve was open, also.
It is worth noting that the axial accelerometer (Aax) was expected to be more sensitive to the presence of leaks than the radial one (Ard). Indeed, in the frequency band of interest, vibration energy propagates along the pipelines mainly with the axisymmetric waves, termed s = 1 and s = 2, whose displacements are normally characterized by preponderant axial components [23]. However, in actual pipelines the presence of elbow fittings between the leak and the transducer may alter the vibration transmission path and/or the monitoring of axial vibrations may be unpractical. Therefore, radial vibrations of the pipe wall were examined as well.
Experimental data have been recorded in two test sessions in order to assess the robustness of the proposed method with respect to modifications in the boundary conditions of the pipeline. In particular, measurements were performed in different periods of the year, characterized by different conditions of the surrounding medium. The first test session (referred to as Test-1) was carried out during winter after a period characterized by low precipitation. The second test session (referred to as Test-2) was conducted in spring, after a very long period with unusually intense rainfall, during which the test bed remained completely submerged by water. Hence, during Test-1 the soil moisture content was at a minimum, whereas in Test-2 it was extremely high.
All the signals were measured simultaneously by means of a LMS SCADAS Recorder SCR-01 (Siemens PLM Software, Plano, Texas, USA, 24 bit ΣΔ analog-to-digital converter with a 150 dB dynamic range, 8 channels, ±10 V input range, 204.8 kHz maximum sampling frequency and analog anti-alias filter), which also provided signal conditioning. The following acquisition parameters were adopted: Sampling frequency, Fs = 5120 Hz; duration, Ts = 10 s. A high-pass filter (cutoff frequency of 10 Hz) was applied to all signals due to the hydrophone frequency response limits.
Measurements were performed for both the non-leaking and the leaking conditions to monitor the environmental noise and the vibro-acoustic phenomena related to active leaks, respectively. For the k-th leak, the following procedure was applied:
- The leaking condition (Lk) was set by temporarily unfastening the corresponding repair clamp and shifting it to one side of the damage (Figure 1c), i.e., only one active leak at a time was present.
- The leaking flow was covered with a plastic sack filled with soil to simulate the condition of water leaking against backfill soil (this solution was adopted to allow for fast removal of the soil, in order to rapidly switch between the different conditions).
- Every 30 s, an acquisition was started and recorded, hence collecting a total of six measurements for the condition Lk.
- The sack was removed and the repair clamp was reinstalled again to deactivate the leak Lk.
- Six measurements in the non-leaking state (referred to as NLk) were carried out after leak deactivation (one acquisition every 30 s).
It was shown that the analysis of the autocorrelation function, , of vibro-acoustic signals may represent a viable tool for reliably detecting leaks. The autocorrelation function, , of an infinite continuous function of time, x(t), is defined as [24]:
where τ represents the time lag and the asterisk denotes complex conjugation. For a finite discrete signal, x = {xn}, with n = 1, …, NS, an estimation of the autocorrelation function, , can be computed as [25]:
where the asterisk denotes complex conjugation and
where NR = (2NS − 1). The autocorrelation function in the desired form (i.e., in the time lag domain), , can be obtained from Equation (2) by considering that the lag related to the m-th value of the autocorrelation function, τm, is simply given by:
where Fs is the sampling frequency of the signal.
Figure 3a,b shows an example of the autocorrelation function of two signals related to conditions L1 and NL1, respectively, measured by sensor Aax in Test-2 and normalized with respect to its value at zero lag (τ = 0):
Hence being:
Figure 3c shows the normalized autocorrelation of a synthesized Gaussian white noise signal having the same number of samples, NS, of the measured signals (namely, NS = 51,200). It is worth noting that the normalized autocorrelation function of Gaussian white noise is not affected by the signal amplitude.
The shape of the function characterizing condition L1 (Figure 3a) appears to be more similar to the one observed in Figure 3c than the shape characterizing condition NL1 (Figure 3b). Hence, the similarity between the shape of the normalized autocorrelation associated with the measured signals and the case of Gaussian white noise may be adopted for assessing the presence of leaks. The observed phenomenon may be qualitatively interpreted with the following considerations. The zero-lag value of the autocorrelation represents the signal energy (as it can be inferred from Parseval’s theorem [24]). Energy is higher for the leak-related signals than for the non-leaking condition measurements, and it is distributed over a wider frequency range as well. Hence, the corresponding normalized autocorrelation functions are characterized by lower side bands, which are further reduced by normalization.
In order to quantitatively estimate such similarity, the kurtosis of the normalized autocorrelation (referred to as KR) is computed using the following equation:
where
where y is a generic vector of length N and has a mean value .
It is observed that the value of KR also depends on the length of the autocorrelation function, NR. For example, it can be easily proven that for the limit case of a normalized autocorrelation function, having only null terms except for the zero-lag value, i.e.:
the kurtosis is provided by:
Therefore, the possible influence of NS on the leak detection performance was also investigated. For this purpose, for each condition and each transducer, signals with extended duration were generated by aggregating the available acquisitions, i.e., by simply concatenating the arrays of the measured data. In particular, two signals of duration Ts = 30 s were created, each one resulting from the aggregation of three acquisitions. Moreover, a single signal with Ts = 60 s was generated by aggregating all the available acquisitions. Then, the KR values associated with the extended signals were computed and compared to the values characterizing the original acquisitions.
Signal processing was carried out by using Mathworks Matlab R2017b. In particular, the normalized autocorrelation, namely Equation (5), was computed by using the function “xcorr” (option “coeff”); the kurtosis of the normalized autocorrelation, i.e., Equation (7), was computed by means of the function “kurtosis” (without bias correction, which is the default option).
3. Results
3.1. Test-1
Figure 4 shows the results of the experimental measurements perfomed in Test-1. In particular, each KR bar was determined as the arithmetic mean of the six KR values of the corresponding six acquisitions available for each combination of sensor and measurement conditions. The corresponding standard deviation (σR) is also reported through vertical segments indicating ±σR intervals.
For each sensor, measurements associated with the non-leaking conditions were characterized by similar values of KR. Therefore, no significant variations in the background noise were observed.
Leak detection based on KR does not seem achievable through the Ard sensor, since similar values are observed for all the conditions.
Sensors Aax and Hyd appear very sensitive to leaks L1 and L2, as the corresponding signals exhibit a sizeable increase in KR, with respect to the non-leaking conditions. In particular, for the closest leak, such an increment is extremely significant. Hence, leaks L1 and L2 can be clearly identified through sensor Aax. The detection of such leaks seems viable by using the Hyd signals as well, although with lower robustness, due to the high values of the standard deviation. Conversely, distinguishing leak L3 from the non-leaking conditions by means of the proposed method could not be attained with either of the two sensors.
3.2. Test-2
The results related to Test-2 are shown in Figure 5. Consistent with Section 3.1, the mean KR values and the corresponding standard deviations (σR) are reported using bar charts (with uncertainty ±σR intervals).
The values of KR that characterize the non-leaking conditions are consistent with the ones measured in Test-1. Furthermore, like for Test-1, leak L3 could not be distinguished from the background noise. Conversely, the behavior of all the three transducers for leaks L1 and L2 appeared fairly different from the previous test. In particular, sensor Ard seems to be now capable of detecting both leaks with an adequate robustness, since a sizeable increment in KR was observed.
Regarding sensor Aax, the sensitivity to leak L1 appears significantly lower than in Test-1. Nonetheless, both leaks L1 and L2 could be still identified effectively.
Finally, sensor Hyd also exhibited a reduction in the sensitivity to leak L1, but leak detection could still be achieved satisfactorily for both leaks L1 and L2.
The different behavior in comparison to Test-1 can reasonably be attributed to the modified conditions of the surrounding medium, namely the extremely high soil moisture content, which may alter the signal attenuation of the pipe. However, it is worth noting that the experimental results for the non-leaking state seem to not be affected by the changed boundary conditions.
3.3. Analysis on the Influence of the Signal Duration
On the basis of the comparison between the two tests, sensor Aax provides a satisfactory performance. Conversely, sensor Ard appears overly affected by the modifications occurring in the soil conditions, therefore exhibiting inadequate reliability. The performance of the hydrophone can be deemed poor as well, due to the high variability associated with leak L1, which was the nearest leak. Hence, potential strategies for enhancing the reliability of sensors Ard and Hyd, and for possibly further improving the sensitivity of sensor Aax, are investigated. In particular, since the value of KR may depend on the signal length, as shown by Equation (10), the possibility of enhancing the leak detection performance by optimizing the acquisition duration was assessed in this study.
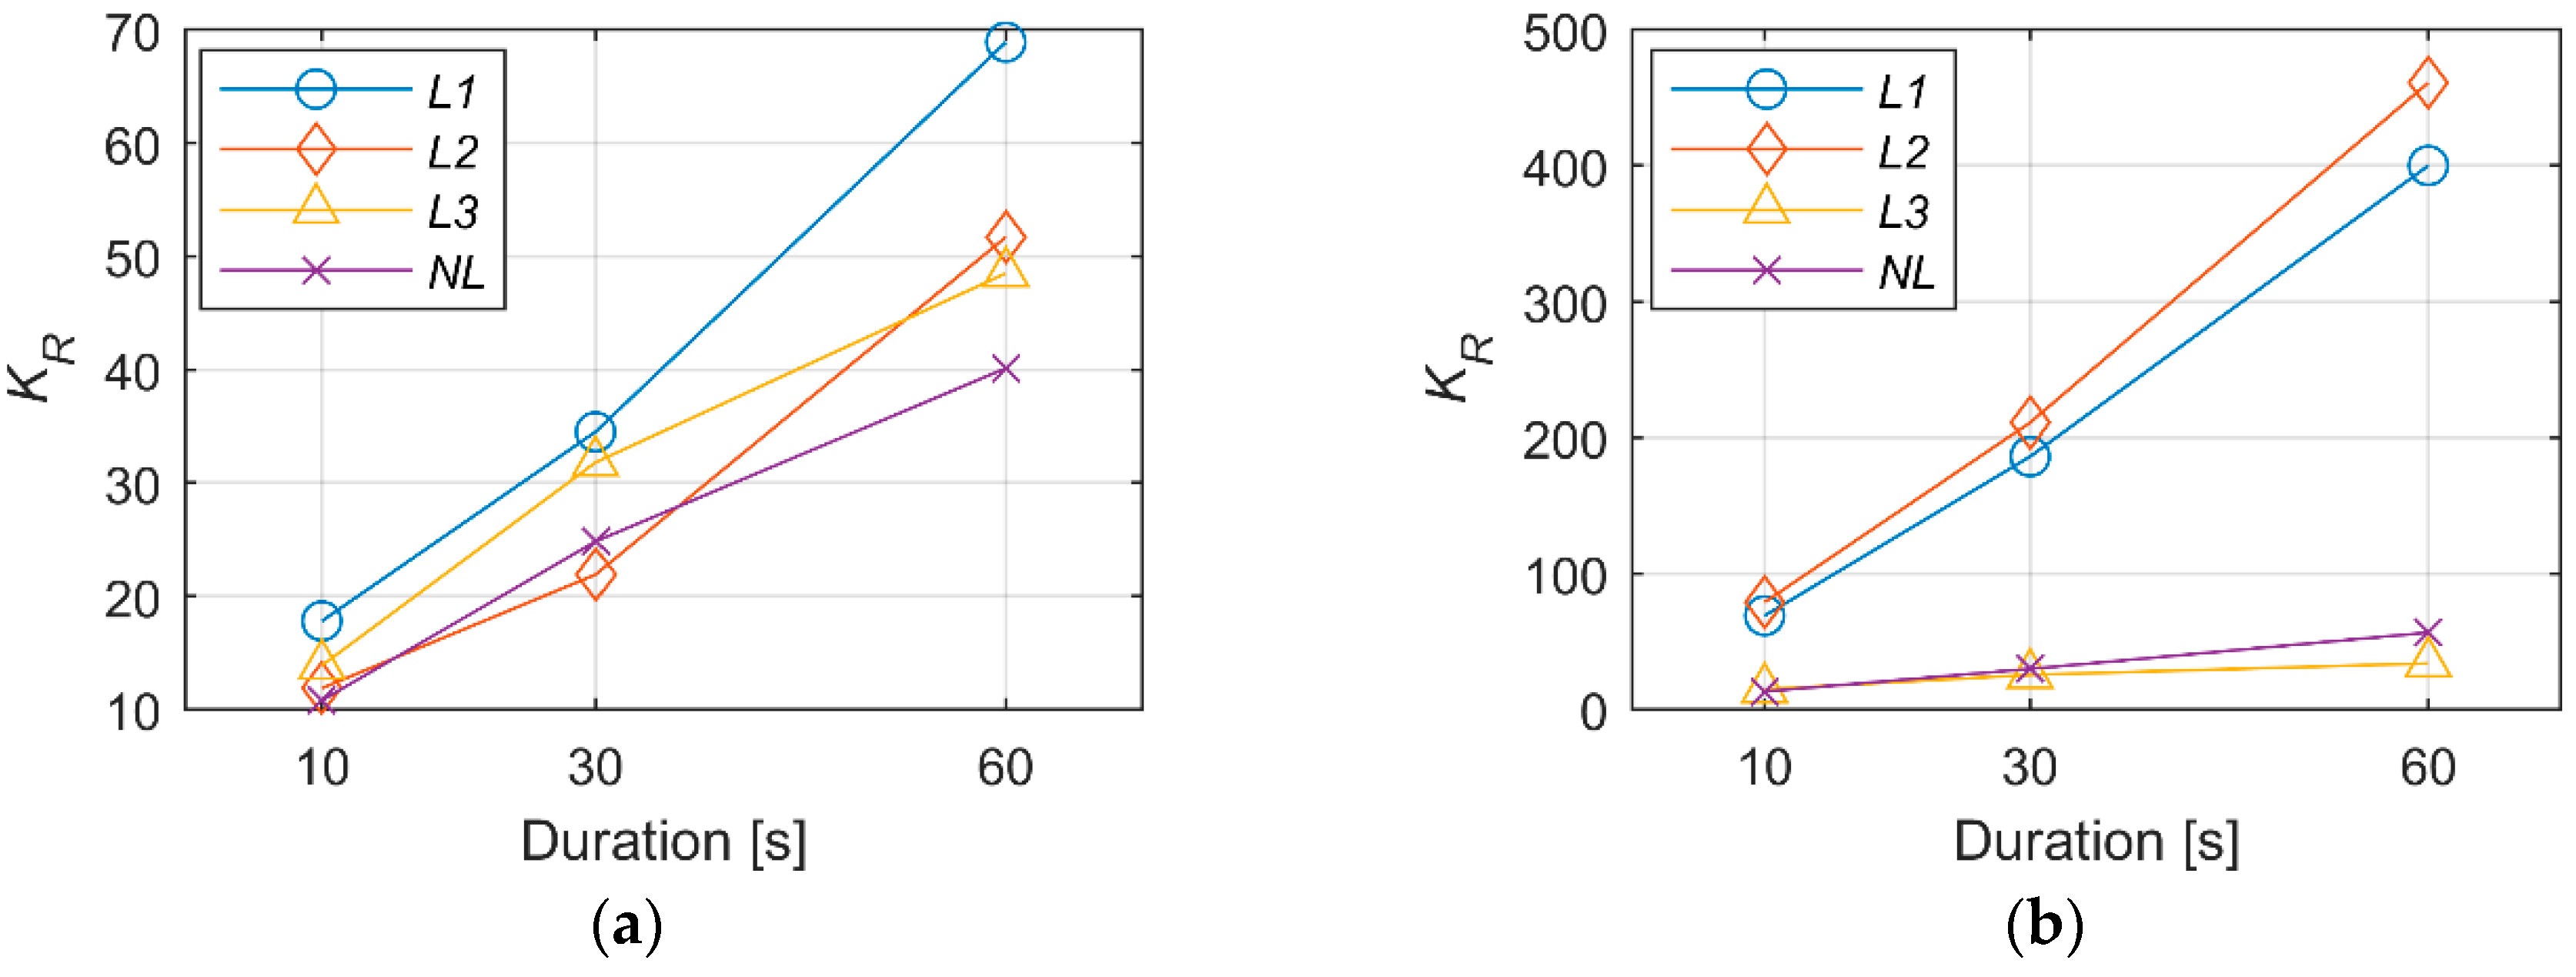
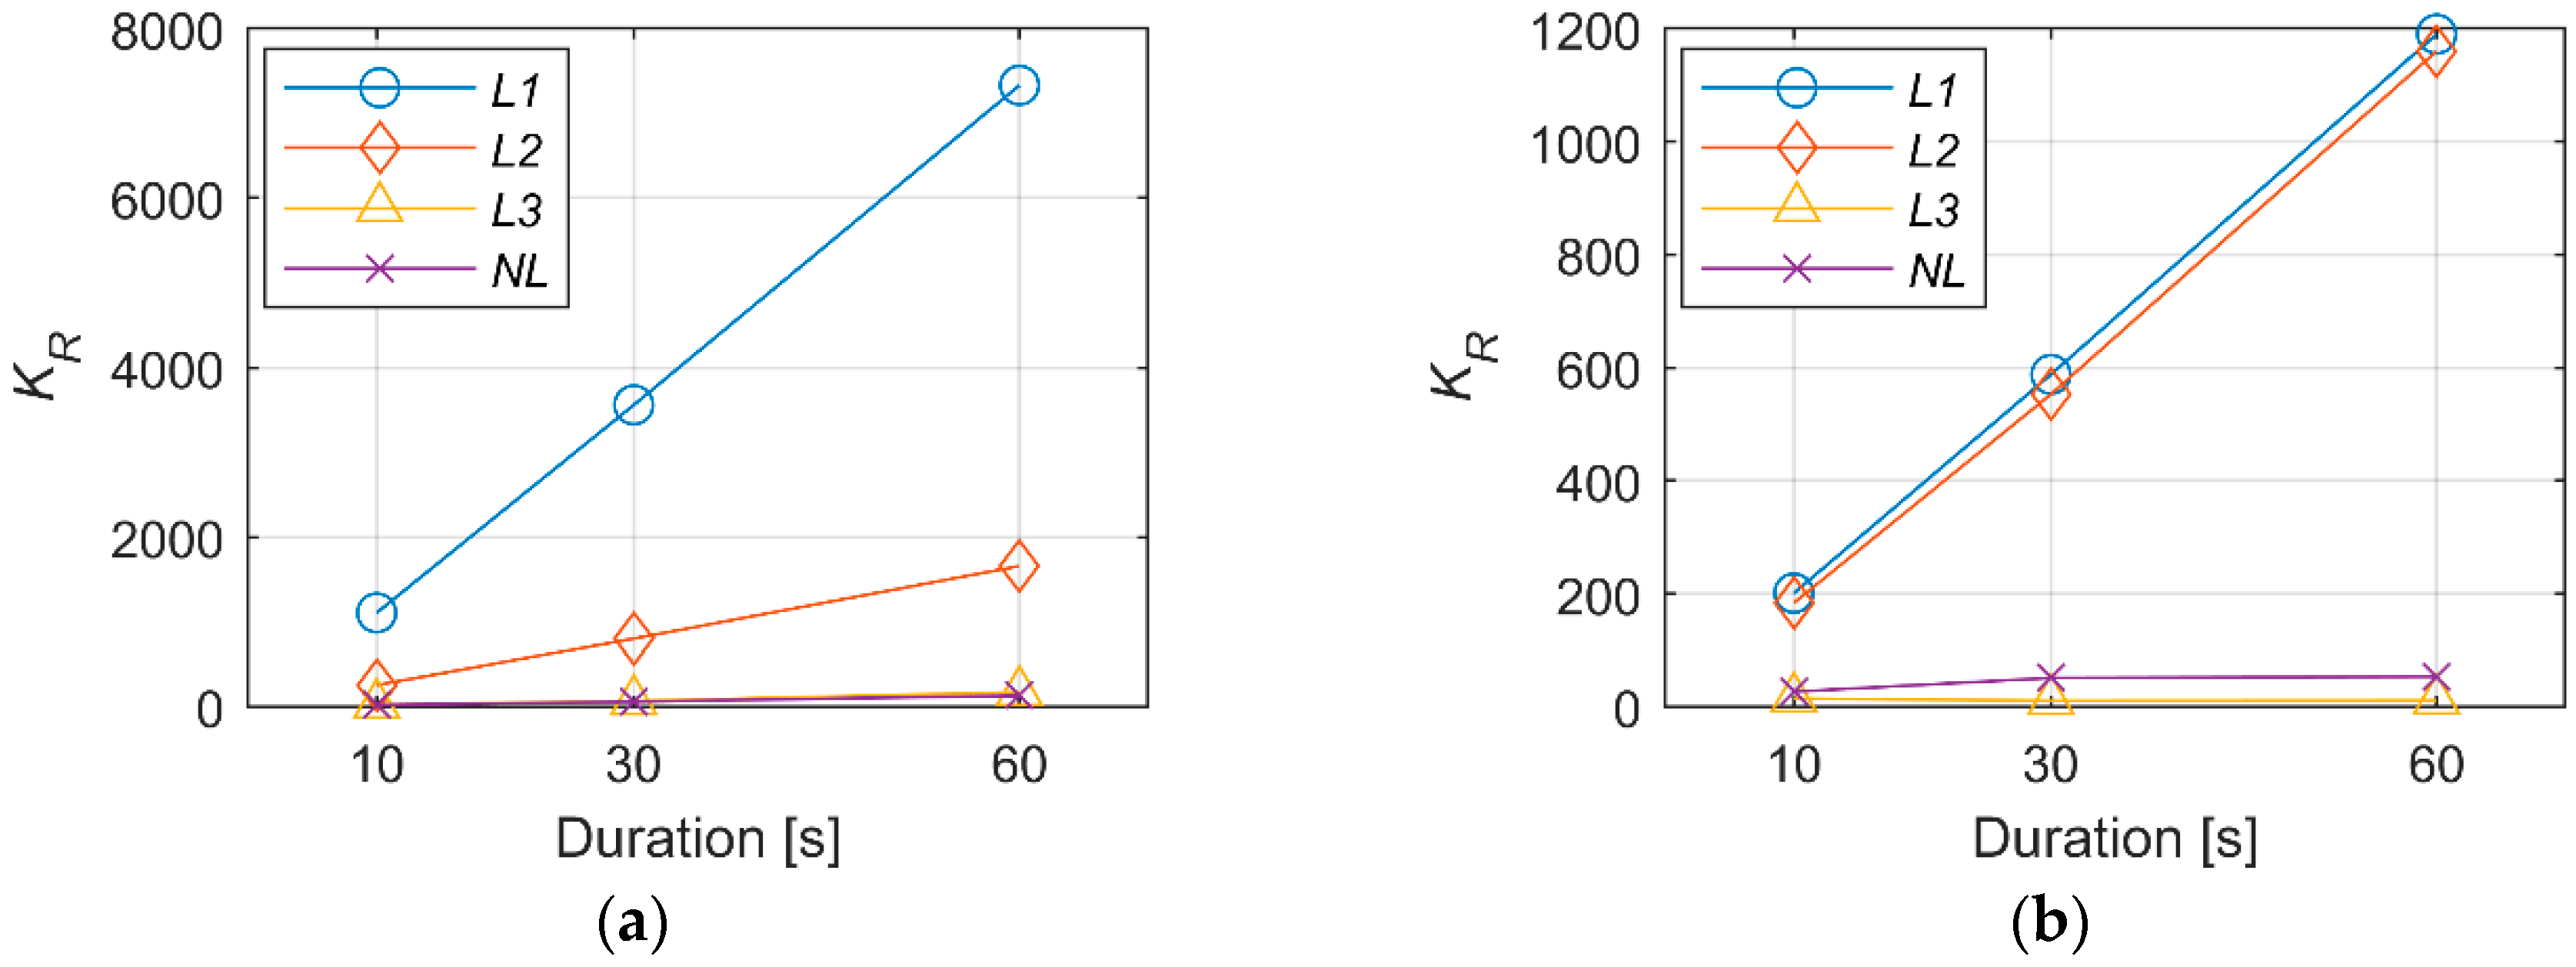
Figure 6, Figure 7 and Figure 8 show the trend of KR as a function of the acquisition duration. For the sake of clarity, a single KR value was reported for the non-leaking conditions, referred to as NL, and computed as the mean of the three values related to conditions NL1, NL2 and NL3.
As expected on the basis of the behavior observed for the Gaussian noise (Section 2), the curves associated with leaks L1 and L2 exhibit a sizeable growth as the duration was increased, except for one case (namely the Hyd sensor, with duration of 60 s). The curves related to the non-leaking condition were characterized by an increment as well, but the growth rate appeared lower. As for leak L3, it exhibited a trend similar to the non-leaking condition, hence confirming that such a leak can not be distinguished from the environmental noise on the basis of the parameter KR.
In order to better appreciate the effects of the observed behavior on detection performance, the ratios between the KR values of the k-th leak (Lk) and of the non-leaking condition (NL), respectively, were computed as:
where j = 1, …, 3 and T = {Tj} = {10; 30; 60}, reported in Figure 9, Figure 10 and Figure 11. The KR ratio index is meant to quantify the sensitivity of the method to a specific leak; the higher its value, the higher the sensitivity to the corresponding leak. Hence, an increment in the ratio indicates an improved leak detection performance. Due to the trend of KR characterizing the leaking and non-leaking conditions, a general growth was observed for the KR ratio. For the Aax sensor, an actual improvement of the performance can be achieved by using longer acquisitions. Conversely, both the Ard and the Hyd sensors still could not provide a satisfactory identification of the leaks in Test-1.
3.4. Comparison with the Results of Previous Experiments
The results of a previous study on leak detection, carried out with a similar experimental setup and test conditions [19], referred to as Exp-0, are reported here for comparison of the detection performance. Therein, leak detection could be achieved by using a scalar index, referred to as Monitoring Index (MI), based on the standard deviation of vibro-acoustic signals (see Reference [7] for the analytical definition). The sensitivity to the leak was evaluated through a parameter referred to as Monitoring Index Efficiency (MIE), defined as the ratio of the MI in leaking condition to the MI in non-leaking state, hence being conceptually analogous to the KR ratio. Detection was considered as achieved for MIE values greater than 1.5 (which was arbitrarily chosen as a reasonable threshold), while sensitivity to the leak was deemed satisfactory for MIE values greater than 2. Moreover, the performance could be significantly enhanced by filtering the measured signals with band-pass filters. The MIE values obtained in Reference [19] for a 100–600 Hz passband are reported in Table 2.
In Exp-0, the hydrophone (Hyd) provided remarkably good results, where it showed a very high sensitivity to all the leaks. The accelerometers were not capable of detecting the farthest leak (i.e., L3), but had proved effective for detecting leaks L1 and L2. In particular, sensor Ard had exhibited a sufficient sensitivity, whereas the performance of sensor Aax was significantly superior.
A comparison between the KR ratio values of Test-1 and Test-2, and the MIE values of Exp-0 shows that for the Aax sensor, the new method based on the KR can apparently provide a sizeable enhancement of the leak detection performance, due to the almost doubling of sensitivity to both leaks L1 and L2. Conversely, the hydrophone was revealed as neither adequately sensitive nor sufficiently reliable with the new method. Regarding sensor Ard, an increased sensitivity (more than +150% with respect to Exp-0) was be observed for Test-2, in which the leaks L1 and L2 were correctly detected. Hence, the use of radial vibration signals with the new detection method may be still viable, in case its robustness can be improved.
4. Discussion
On the basis of the above analysis, the use of pressure signals does not seem suitable for the proposed technique, due to the excessive variability of the adopted index (i.e., a high standard deviation) and also in light of the superior performance of the hydrophone in the previous experiments reported in Section 3.4.
The experimental results proved the effectiveness of the proposed leak detection method when using accelerometers with a sensing direction parallel to the pipe axis. Indeed, a remarkable performance could be achieved in all the tests through the analysis of the longitudinal vibration signals, in terms of both a high sensitivity to the leak and the robustness of the detection. Moreover, the new technique is still in an early stage of development and promising future investigations may show that this technique can outperform other approaches, in terms of the sensitivity to the leak (cf. Section 3.4).
Conversely, the monitoring of radial vibrations provided inadequate results, since leaks could not be identified at all in one of the tests and the experiments revealed a significant influence of the modifications in the properties of the surrounding medium. This behavior may represent a critical limitation of the proposed method. Indeed, the presence of elbow fittings between the leak and the transducer (possibly characterizing the layout of actual service pipes near the connections of the customers’ water meters) may significantly alter the transmission path of vibrations, thus hindering direct measurements of the longitudinal vibrations generated by leaks. Hence, further verification of the actual detection capabilities in the case of radial accelerometers is recommended. In particular, filtering the acquired raw signals in proper frequency bands may be investigated as a possible solution to solve this issue. In fact, in the previous studies reported in Section 3.4, the sensitivity to the leak for the radial accelerometer could be remarkably enhanced by using a convenient band-pass filter. Accordingly, extending the database with additional measurements (possibly from real service pipes) is considered mandatory in order to properly test and optimize the desired filter. Reasonably, achieving a sufficient performance is deemed feasible, in light of the good results provided by Test-2.
A second limitation of the proposed method may be the distance range of detection, which appeared modest in the experiments, since the farthest leak (exhibiting a sizeable flow rate) could not be detected with any of the tested transducers. On one side, the possibility of further improvements appears hardly achievable, due to the expected significant attenuation of vibration signals [19]. On the other side, it should be noted that this is not a real problem in practice, where the targeted application requires monitoring service pipes which are shorter than 10 m in the networks of interest.
Increasing the acquisition duration appears to be a viable strategy in improving detection reliability. It is worth noting that long acquisitions may be deemed undesirable, due to the increasing probability of transients and external disturbances affecting the measured signals. However, signals with the required duration may be attained by simply aggregating shorter signals, as proven by the procedure adopted in the presented analysis.
The values of the kurtosis of the normalized autocorrelation function associated with the non-leaking state appeared sufficiently insensitive to the variations in both the conditions of the surrounding soil and the acquisition duration. In addition, such an index is expected to be also adequately unaffected by variations in the signal amplitude, in virtue of the normalized autocorrelation. Reasonably, it should be possible to define a threshold value, associated with the non-leaking condition, which does not depend either on the local boundary conditions of the network or the vibration levels, thus accomplishing the main objective of the research.
Finally, since the proposed detection method is based on a single scalar index, it appears potentially suitable for a fairly straightforward implementation as an automated process.
5. Conclusions
This paper presented a new leak detection method primarily developed to monitor plastic service pipes in typical water distribution networks. The method is based on the computation of the kurtosis of the normalized autocorrelation of vibro-acoustic signals. The method was assayed in a test bed by measuring vibration and pressure signals induced by artificially generated leaks. The experimental results confirmed its effectiveness when monitoring the longitudinal vibrations of the pipe wall. The main potential benefits of the proposed method are summarized as follows:
- The method exhibits a high sensitivity to leaks in the range of interest, hence appearing appropriate for early leak detection.
- Reasonably, it should be possible to define a universal threshold associated with the onset of leaks, hence simplifying the initial setup as no calibration would be required.
- The method should be sufficiently insensitive to variations in the amplitude of the measured signals, thus the method is unaffected by the local boundary conditions of pipelines.
- The method appears suitable for the implementation of an automated leak detection algorithm.
- Further improvements of the method’s sensitivity seem achievable through proper optimization of the acquisition length.
In light of the expected advantages, the implementation of a leak detection system based on the proposed method appears promising.
Further experiments will be conducted by performing measurements of real leaks occurring in the service pipes of a water distribution network, to pursue two main goals. The first goal is to further assess the robustness of the method in real operating conditions. The second goal is to define an optimal filter to possibly enhance the reliability of the method with radial vibration measurements, hence overcoming its current main limitation.
Author Contributions
Conceptualization, A.M., M.T. and A.R.; methodology, A.M.; validation, A.M. and M.T.; formal analysis, A.M.; investigation, A.M. and M.T.; resources, A.R.; data curation, A.M.; writing—original draft preparation, A.M.; writing—review and editing, M.T. and A.R.; supervision, A.R.; project administration, M.T.; funding acquisition, A.R.
Conflicts of Interest
The authors declare no conflict of interest.
References
- EPA—United States Environmental Protection Agency. Control and Mitigation of Drinking Water Losses in Distribution Systems; EPA 816-R-10-019 Report; United States Environmental Protection Agency: Washington, DC, USA, 2010.
- BDEW—German Association of Energy and Water Industries. VEWA Survey: Comparison of European Water and Waste Water Prices. 2010. Available online: www.bdew.de (accessed on 23 November 2016).
- Mutikanga, H.E.; Sharma, S.K.; Vairavamoorthy, K. Methods and tools for managing losses in water distribution systems. J. Water Res. Plan. Manag. 2012, 139, 166–174. [Google Scholar] [CrossRef]
- Hunaidi, O.; Chu, W.; Wang, A.; Guan, W. Detecting leaks in plastic pipes. J. AWWA 2000, 92, 82–94. [Google Scholar] [CrossRef] [Green Version]
- Gao, Y.; Brennan, M.J.; Joseph, P.F.; Muggleton, J.M.; Hunaidi, O. On the selection of acoustic/vibration sensors for leak detection in plastic water pipes. J. Sound Vib. 2005, 283, 927–941. [Google Scholar] [CrossRef]
- Martini, A.; Troncossi, M.; Rivola, A.; Nascetti, D. Preliminary investigations on automatic detection of leaks in water distribution networks by means of vibration monitoring. In Advances in Condition Monitoring of Machinery in Non-Stationary Operations (Lecture Notes in Mechanical Engineering); Springer: Berlin, Germany, 2014; Volume 5, pp. 535–544. [Google Scholar]
- Martini, A.; Troncossi, M.; Rivola, A. Automatic Leak Detection in Buried Plastic Pipes of Water Supply Networks by Means of Vibration Measurements. Shock Vib. 2015, 2015, 165304. [Google Scholar] [CrossRef]
- El-Zahab, S.; Mohammed Abdelkader, E.; Zayed, T. An accelerometer-based leak detection system. Mech. Syst. Signal Proc. 2018, 108, 58–72. [Google Scholar] [CrossRef]
- Yazdekhasti, S.; Piratla, K.R.; Atamturktur, S.; Khan, A. Experimental evaluation of a vibration-based leak detection technique for water pipelines. Struct. Infrastruct. Eng. 2018, 14, 46–55. [Google Scholar] [CrossRef]
- Ghazali, M.F.; Beck, S.B.M.; Shucksmith, J.D.; Boxall, J.B.; Staszewski, W.J. Comparative study of instantaneous frequency based methods for leak detection in pipeline networks. Mech. Syst. Signal Proc. 2012, 29, 187–200. [Google Scholar] [CrossRef] [Green Version]
- Martini, A.; Troncossi, M.; Rivola, A. Leak Detection in Water-Filled Small-Diameter Polyethylene Pipes by Means of Acoustic Emission Measurements. Appl. Sci. 2017, 7, 2. [Google Scholar] [CrossRef]
- Fahmy, M.; Moselhi, O. Detecting and locating leaks in Underground Water Mains Using Thermography. In Proceedings of the 26th International Symposium on Automation and Robotics in Construction (ISARC 2009), Austin, TX, USA, 24–27 June 2009. [Google Scholar]
- Bimpas, M.; Amditis, A.; Uzunoglu, N. Detection of water leaks in supply pipes using continuous wave sensor operating at 2.45 GHz. J. Appl. Geophys. 2010, 70, 226–236. [Google Scholar] [CrossRef]
- Cataldo, A.; Persico, R.; Leucci, G.; De Benedetto, E.; Cannazza, G.; Matera, L.; De Giorgi, L. Time domain reflectometry, ground penetrating radar and electrical resistivity tomography: A comparative analysis of alternative approaches for leak detection in underground pipes. NDT E Int. 2014, 62, 14–28. [Google Scholar] [CrossRef]
- Metje, N.; Atkins, P.R.; Brennan, M.J.; Chapman, D.N.; Lim, H.M.; Machell, J.; Muggleton, J.M.; Pennock, S.; Ratcliffe, J.; Redfern, M.; et al. Mapping the Underworld—State-of-the-art review. Tunn. Undergr. Space Technol. 2007, 22, 568–586. [Google Scholar] [CrossRef]
- Puust, R.; Kapelan, Z.; Savic, D.A.; Koppel, T. A review of methods for leakage management in pipe networks. Urban Water J. 2010, 7, 25–45. [Google Scholar] [CrossRef]
- Li, W.; Ling, W.; Liu, S.; Zhao, J.; Liu, R.; Chen, Q.; Qiang, Z.; Qu, J. Development of systems for detection, early warning, and control of pipeline leakage in drinking water distribution: A case study. J. Environ. Sci. 2011, 23, 1816–1822. [Google Scholar] [CrossRef]
- Hunaidi, O.; Wang, A. A new system for locating leaks in urban water distribution pipes. Manag. Environ. Qual. Int. J. 2006, 17, 450–466. [Google Scholar] [CrossRef] [Green Version]
- Martini, A.; Troncossi, M.; Rivola, A. Vibroacoustic Measurements for Detecting Water Leaks in Buried Small-Diameter Plastic Pipes. J. Pipeline Syst. Eng. Pract. 2017, 8, 04017022. [Google Scholar] [CrossRef]
- Hunaidi, O.; Chu, W.T. Acoustical characteristics of leak signals in plastic water distribution pipes. Appl. Acoust. 1999, 58, 235–254. [Google Scholar] [CrossRef] [Green Version]
- Pal, M.; Dixon, N.; Flint, J. Detecting & Locating Leaks in Water Distribution Polyethylene Pipes. In Proceedings of the World Cong. on Engineering 2010, London, UK, 30 June–2 July 2010; Volume II, pp. 889–894. [Google Scholar]
- Butler, D. Leakage Detection and Management; Palmer Environmental: Cwmbran, UK, 2000. [Google Scholar]
- Pavic, G. Vibroacoustical energy flow through straight pipes. J. Sound Vib. 1992, 143, 411–429. [Google Scholar] [CrossRef]
- Rao, D.G.; Gejji, V.P. Digital Signal Processing, 2nd ed.; Pearson Education: Noida, India, 2010; ISBN 9788131732427. [Google Scholar]
- Buck, J.R.; Daniel, M.M.; Singer, A.C. Computer Explorations in Signals and Systems Using MATLAB®, 2nd ed.; Prentice Hall: Upper Saddle River, NJ, USA, 2002; ISBN 9780130421555. [Google Scholar]
Figure 1.
Test facility: (a) Pipeline schematics; (b) clamped leak; (c) active leak.

Figure 2.
Sensor setup: (a) Schematics; (b) close-up of the transducers.

Figure 3.
Normalized autocorrelation function of: (a) Condition L1 acceleration signal (Test-2, radial accelerometer sensor (Aax), 2nd acquisition of the dataset); (b) Condition NL1 acceleration signal (Test-2, sensor Aax, 2nd acquisition of the dataset); (c) Gaussian white noise. The kurtosis value (KR) of the normalized autocorrelation function is reported in the upper right corner.

Figure 4.
Mean kurtosis values (KR) in Test-1 (± standard deviation (σR) intervals are indicated by the orange vertical bars), for sensors: (a) radial accelerometer sensor (Ard); (b) axial accelerometer sensor (Aax); (c) hydrophone sensor (Hyd).
Figure 4.
Mean kurtosis values (KR) in Test-1 (± standard deviation (σR) intervals are indicated by the orange vertical bars), for sensors: (a) radial accelerometer sensor (Ard); (b) axial accelerometer sensor (Aax); (c) hydrophone sensor (Hyd).

Figure 5.
Mean values of KR in Test-2 (±σR intervals indicated by the orange vertical bars), for sensors: (a) Ard; (b) Aax; (c) Hyd.
Figure 5.
Mean values of KR in Test-2 (±σR intervals indicated by the orange vertical bars), for sensors: (a) Ard; (b) Aax; (c) Hyd.

Figure 6.
Trend of KR as function of the acquisition duration for Ard signals: (a) Test-1; (b) Test-2.
Figure 6.
Trend of KR as function of the acquisition duration for Ard signals: (a) Test-1; (b) Test-2.

Figure 7.
Trend of KR as function of the acquisition duration for Aax signals: (a) Test-1; (b) Test-2.
Figure 7.
Trend of KR as function of the acquisition duration for Aax signals: (a) Test-1; (b) Test-2.

Figure 8.
Trend of KR as function of the acquisition duration for Hyd signals: (a) Test-1; (b) Test-2.
Figure 8.
Trend of KR as function of the acquisition duration for Hyd signals: (a) Test-1; (b) Test-2.

Figure 9.
KR ratio as function of the acquisition duration for Ard signals: (a) Test-1; (b) Test-2.

Figure 10.
KR ratio as function of the acquisition duration for Aax signals: (a) Test-1; (b) Test-2.
Figure 10.
KR ratio as function of the acquisition duration for Aax signals: (a) Test-1; (b) Test-2.

Figure 11.
KR ratio as function of the acquisition duration for Hyd signals: (a) Test-1; (b) Test-2.
Figure 11.
KR ratio as function of the acquisition duration for Hyd signals: (a) Test-1; (b) Test-2.


Table 1.
Characteristics of the generated leaks.
| Leak | Distance [m] | Leak Rate [L/h] |
|---|---|---|
| L1 | 3 | 200 |
| L2 | 8 | 295 |
| L3 | 26 | 4000 |
Table 2.
Comparison between the KR ratio computed for Test-1 and Test-2 with T = 60 s, and the results of previous experiments (Exp-0).
Table 2.
Comparison between the KR ratio computed for Test-1 and Test-2 with T = 60 s, and the results of previous experiments (Exp-0).
| Leak | Sensor | ||||||||
|---|---|---|---|---|---|---|---|---|---|
| Ard | Aax | Hyd | |||||||
| Test-1 (KRratio) | Test-2 (KRratio) | Exp-0 (MIE) | Test-1 (KRratio) | Test-2 (KRratio) | Exp-0 (MIE) | Test-1 (KRratio) | Test-2 (KRratio) | Exp-0 (MIE) | |
| L1 | 1.72 | 7.07 | 2.77 | 55.62 | 22.47 | 13.17 | 5.56 | 5.61 | 144.60 |
| L2 | 1.29 | 8.15 | 2.73 | 12.57 | 21.90 | 8.83 | 1.19 | 11.10 | 91.85 |
| L3 | 1.21 | 0.60 | 1.07 | 1.32 | 0.21 | 1.10 | 1.55 | 0.86 | 6.24 |
© 2018 by the authors. Licensee MDPI, Basel, Switzerland. This article is an open access article distributed under the terms and conditions of the Creative Commons Attribution (CC BY) license (http://creativecommons.org/licenses/by/4.0/).
Share and Cite
MDPI and ACS Style
Martini, A.; Rivola, A.; Troncossi, M. Autocorrelation Analysis of Vibro-Acoustic Signals Measured in a Test Field for Water Leak Detection. Appl. Sci. 2018, 8, 2450. https://doi.org/10.3390/app8122450
AMA Style
Martini A, Rivola A, Troncossi M. Autocorrelation Analysis of Vibro-Acoustic Signals Measured in a Test Field for Water Leak Detection. Applied Sciences. 2018; 8(12):2450. https://doi.org/10.3390/app8122450
Chicago/Turabian StyleMartini, Alberto, Alessandro Rivola, and Marco Troncossi. 2018. "Autocorrelation Analysis of Vibro-Acoustic Signals Measured in a Test Field for Water Leak Detection" Applied Sciences 8, no. 12: 2450. https://doi.org/10.3390/app8122450
Note that from the first issue of 2016, this journal uses article numbers instead of page numbers. See further details here.