High Resolution Brillouin Sensing of Micro-Scale Structures


1
Institute of Photonics and Optical Science (IPOS), School of Physics, The University of Sydney, Sydney NSW 2006, Australia
2
The University of Sydney Nano Institute (Sydney Nano), Sydney NSW 2006, Australia
*
Author to whom correspondence should be addressed.
Appl. Sci. 2018, 8(12), 2572; https://doi.org/10.3390/app8122572
Submission received: 24 October 2018
/
Revised: 23 November 2018
/
Accepted: 25 November 2018
/
Published: 11 December 2018
(This article belongs to the Special Issue Optical Correlation-domain Distributed Fiber Sensors)
Abstract
:Brillouin distributed measurement techniques have been extensively developed for structural health monitoring using fibre optic nerve systems. The recent advancement in the spatial resolution capabilities of correlation-based Brillouin distributed technique have reached the sub-mm regime, making this approach a suitable candidate for monitoring and characterizing integrated photonic devices. The small dimension associated with the short length of these devices—on the order of the cm- and mm-scale—requires high sensitivity detection techniques and sub-mm spatial resolution. In this paper, we provide an overview of the different Brillouin sensing techniques in various micro-scale structures such as photonic crystal fibres, microfibres, and on-chip waveguides. We show how Brillouin sensing is capable of detecting fine transverse geometrical features with the sensitivity of a few nm and also extremely small longitudinal features on the order of a few hundreds of . We focus on the technique of Brillouin optical correlation domain analysis (BOCDA), which enables such high spatial resolution for mapping the opto-acoustic responses of micro-scale waveguides.
1. Introduction
Micro-scale waveguides—specifically, microfibres, photonic crystal fibres (PCFs), and on-chip waveguides—offer enhanced nonlinearity due to their small core dimensions and also allow for group velocity dispersion tailoring [1]. Due to these unique features, micro-scale waveguides have found applications in supercontinuum generation [2,3,4], Raman amplification [5], self-phase [6] and cross-phase modulation [7], four-wave mixing [8], and frequency combs [9]. In these waveguides, not only the optical modes are confined, but also the acoustic modes, which, due to their efficient overlap [1,10,11,12,13,14,15], enable applications ranging from sensing in micro-structures [16,17,18,19] to RF signal processing [20,21], RF sources [22,23], narrow-linewidth lasers [24,25,26,27,28], frequency combs [29], and light storage [30,31]. The performance of the on-chip waveguides in terms of gain and linewidth is influenced by the geometrical variation along the structure [32,33,34]. For example, in micro-fibres, the effect of Brillouin scattering can be suppressed by controlling the core diameter [10]. The diameter of the core also becomes important when coupling in and out of photonic circuits [35]. It was shown that structural irregularities in a PCF lead to a different Brillouin response compared to what is expected from a perfect PCF [36]. Therefore, a detection technique is required to monitor and characterize the opto-acoustic interactions in these structures.
The same opto-acoustic interaction, called Brillouin scattering, that enables such functionalities in micro-scale waveguides can be exploited to detect structural irregularities and characterize their opto-acoustic responses. Stimulated Brillouin scattering (SBS) is an optical nonlinear effect resulting in inelastic scattering of a light wave by an acoustic wave in a medium. SBS involves an optical pump and signal waves and an acoustic wave, which interact with each other under the phase matching and energy conservation condition. The phase matching condition implies that: , where and are the propagation constants of the pump and signal waves, respectively, and is the propagation constant of the acoustic wave. Energy conservation implies that: , where and are the pump and signal frequencies, respectively, and is the acoustic angular frequency. The acoustic field takes the form of either transverse, longitudinal, or a superposition of both waves, which can be utilized to measure the geometrical features of the waveguide such as the core diameter [37] and detect waveguide irregularities [38]. However, in order to make a distributed measurement along the waveguide, the SBS response needs to be localized.
A conventional SBS measurement involves continuous wave (cw) pump and signal waves which interfere along the entire length of the medium, and therefore, the measured back-scattered signal is an integrated opto-acoustic response. In contrast, a distributed SBS response can be achieved by modifying the intensity or the phase of the pump and signal waves such that the SBS interaction is limited to a certain length in the medium and suppressed elsewhere. The most conventional distributed Brillouin measurement technique, which is called Brillouin optical time domain analysis (BOTDA), is based on a pulsed pump and a cw probe [39,40,41], where the pulse duration determines the spatial resolution of the measurement [42]. A more recent technique is the correlation-based Brillouin sensing, which employs low-coherence pump and probe sources, whose correlation length determines the spatial resolution of the measurement [43,44]. While the spatial resolution in the time domain technique is limited by the pulse duration, the latter overcomes this restriction by three orders of magnitude [45]. Therefore, mm- and sub-mm spatial resolution have been achieved using BOCDA [45,46,47,48], which opened up a new paradigm by bringing SBS distributed measurement to much shorter and more compact devices such as on-chip waveguides [46,48,49] and micro-structures [50]. Therefore, the functionality of the distributed Brillouin measurement in micro-scale structures has changed from the more common temperature and strain monitoring in optical fibres to mapping the uniformity of these devices.
In this paper, we review Brillouin sensing techniques for micro-scale waveguides in the form of (a) non-distributed backward scattering to highlight the effects of waveguide dimensions—which can reach the sub-wavelength limit—on the overall opto-acoustic responses, (b) non-distributed forward scattering, which enables core diameter measurement, and (c) distributed backward scattering, which enables detection of fine longitudinal features along the waveguides with cm- and mm-length scales. Although there are already some insightful reviews in the field of Brillouin-based fibre sensors [51,52,53,54] and in general fibre optic-based distributed sensing [55,56], the motivation of this work is to provide a more focused review of Brillouin-based micro-structure and on-chip waveguides monitoring. The structure of this paper is as follows: The second section discusses the basic SBS principle and the dependence of the opto-acoustic response on environmental variables. We then discuss various distributed Brillouin measurement techniques with an emphasis on the spatial resolution evolution in the time domain and correlation domain and provide deeper details and the state-of-the-art of correlation domain Brillouin sensing in Section 3 and Section 4, respectively. In Section 5, we discuss opto-acoustic interactions in micro-structures and short-length scale devices. Finally, we provide an outlook for mm and sub-mm spatial resolution Brillouin sensing based on the recent advancements in the field.
2. Brillouin Sensing Principle
The properties of the Brillouin gain spectrum including the linewidth and its frequency shift relative to the pump—called Brillouin frequency shift (BFS)—can be studied to obtain information about the environmental parameters such as temperature and strain, as well as the geometry of the waveguide. Brillouin scattering can be observed as backward or forward scattering involving longitudinal and transverse acoustic waves, respectively. Transverse acoustic waves mean that their propagation is mostly in the transverse direction to the propagation of the optical waves in the waveguide.
2.1. Backward Brillouin Scattering
Backward Brillouin scattering occurs when optical pump and probe waves counter-propagate through a medium with the probe being frequency shifted from the pump by the BFS (). In this scenario, the pump and probe interference creates a moving refractive index grating, which back scatters the pump wave with a Doppler shift associated with the velocity of the moving grating, as shown in Figure 1. This process is called backward Brillouin scattering, which under the phase-matching and energy conservation conditions, results in the coherent energy transfer from the pump wave to the signal wave through the acoustic wave.
The BFS in the backward scattering process () is defined by Equation (1):
In this equation, BFS is a function of the effective refractive index (), the pump wavelength (), and the longitudinal acoustic mode velocity (), which itself is dependent on material properties [43] and is sensitive to strain and temperature [54,57]. The relation between the BFS and temperature and strain have been experimentally demonstrated in different platforms such as standard silica fibres [58,59,60], -doped fibre [57], dispersion-shifted fibre (DSF) [61], and PCF [62].
2.2. Forward Brillouin Scattering
Forward Brillouin scattering occurs when the optical pump and the probe co-propagate through the medium with the probe being frequency-shifted from the pump by the forward BFS. In this process, the propagation constants of the pump and probe waves are almost equal; therefore, according to the phase-matching condition, the propagation constant of the acoustic wave approaches zero. As a result, the acoustic waves in the forward Brillouin process do not propagate along the waveguide, but mostly propagate transversely. The BFS in the forward Brillouin process for a cylindrical medium such as optical fibre and for a certain acoustic mode (m) is expressed by [63]:
where d is the fibre outer diameter, is the transverse mode acoustic velocity, and the zero of the Bessel function describing the boundary conditions for the free fibre surface [64]. This forward BFS as described in Equation (2) has been utilized to determine the strain coefficient in silica fibre [65] and the temperature coefficient in highly nonlinear fibre [66] and PCF [67], sound velocity in silica fibre [63], and the core diameter of the tapered fibre [37]. The intrinsic linewidth of the Brillouin gain spectrum is determined by the phonon lifetime and the structural irregularities of the waveguide. In the forward Brillouin interaction, an extra component contributes to the linewidth of the Brillouin gain spectrum of a given mode due to the transmission losses at the boundaries of the core [68]. These losses are dependent on the acoustic impedance of the surrounding medium and vary from one material to the other. Therefore, the linewidth of the Brillouin gain spectrum has been exploited for chemical sensing purposes in the forward Brillouin scattering process [68,69,70].
The expressions represented in Equations (1) and (2) are valid under the assumption that the waveguide dimensions are much larger than the acoustic wavelength () [34], where w and h stand for the waveguide width and thickness, respectively. However, as the waveguide dimensions approach the acoustic wavelength, the waveguide is no longer considered as isotropic [34], and the effect of boundary forces becomes important [71]. Therefore, a fully-vectorial calculation is required to obtain an accurate estimation of the BFS [32,33,34].
3. Distributed Brillouin Sensing Techniques
In this section, we provide a brief overview of various Brillouin-based distributed sensing techniques. Brillouin optical time domain analysis (BOTDA) employs a pulsed pump and a cw probe to limit the SBS interaction length to the pump pulse duration. The first BOTDA demonstration in optical fibre using counter-propagating pulsed pump and cw probe waves was reported by Horiguchi et al. [72]. This approach has improved the signal to noise ratio (SNR) and the sensitivity in comparison to the Brillouin time domain reflectometry (BOTDR) method, which is based on spontaneous Brillouin scattering [73]. The first distributed temperature measurement using BOTDA was reported by Kurashima et al., where the temperature distribution along a silica single-mode optical fibre with a spatial resolution of 100 m was measured [39]. This demonstration was followed by the works of Bao et al. [40] reporting a distributed temperature measurement in an optical fibre with 5 m spatial resolution and Nikles et al. [41] measuring distributed strain and temperature with a stabilized probe using a single laser source. The spatial resolution of the BOTDA technique, however, is limited to 1 m. This is due to the fact that for pump pulses shorter than the the phonon lifetime (approximately 10 ns in silica fibre), the Brillouin spectrum experiences a broadening, which makes the measurement inaccurate [42]. Different techniques including dark pulses [74] and phase pulses, which were based on the initial work of Bao et al. [75,76], were introduced to overcome the spatial resolution limit of BOTDA [77,78,79]. These techniques are based on a sudden change in the phase pulse like Brillouin echo distributed sensing (BEDS) [53] or a sudden drop in amplitude of the pump wave (dark pulses), which affects the Brillouin response and can be detected by a fast detection scheme [53,80]. Spatial resolutions of 5 cm and 2 cm were reported using phase pulse [81] and dark pulse [80], respectively. Another technique, called pre-pump Brillouin optical time domain analysis (PPP-BOTDA), is based on the long pump pulse to excite the phonon followed by a short pump pulse to enable high spatial resolution measurement, while the probe is in the form of a continuous wave, counter propagating the pump [82,83,84,85]. Spatial resolution down to 2 cm was demonstrated using this technique [83].
Other distributed Brillouin measurement techniques include Brillouin optical frequency domain analysis (BOFDA) and Brillouin dynamic grating (BDG). BOFDA is based on the intensity modulation of the pump with a sinusoidal wave such that by sweeping the modulation frequency, a distributed SBS response can be obtained [86]. Although this technique does not have the spatial resolution limitations of the time domain and a spatial resolution of 3 cm was demonstrated using this technique, it requires heavy post-processing to recover the Brillouin gain spectrum, and therefore, the measurement time is relatively long for cm-long spatial resolutions [86]. BDG employs the refractive index grating generated in one polarization to Bragg reflect the pump wave in the orthogonal polarization [87]. This technique could achieve sub-cm spatial resolution (5.5 mm) [88]; however, it requires polarization-maintaining fibre and more than one pump laser to realize SBS in two orthogonal directions.
Although time domain, frequency domain, and dynamic gratings have been improved significantly in terms of spatial resolution and performance, the record spatial resolution in Brillouin distributed sensing is achieved based on a technique called Brillouin optical correlation domain analysis (BOCDA), which is described in detail in the next section. Figure 2 compares the spatial resolution evolution of the time domain techniques versus correlation domain techniques. The solid blue line in the plot shows the overall trend of the spatial resolution in time domain techniques, which has improved from 100 m to a few cm. The dashed red line indicates the progress in spatial resolution of correlation domain techniques since their introduction in 1999. It becomes clear from this plot that the highest spatial resolutions so far belong to this technique. This plot does not include all the works in the field of distributed Brillouin sensing, which is rather vast and out of the scope of this review, but only gives an indication of the progress in the time domain and correlation domain Brillouin distributed sensing techniques in terms of the spatial resolution capabilities.
4. Correlation-Based Brillouin Sensing
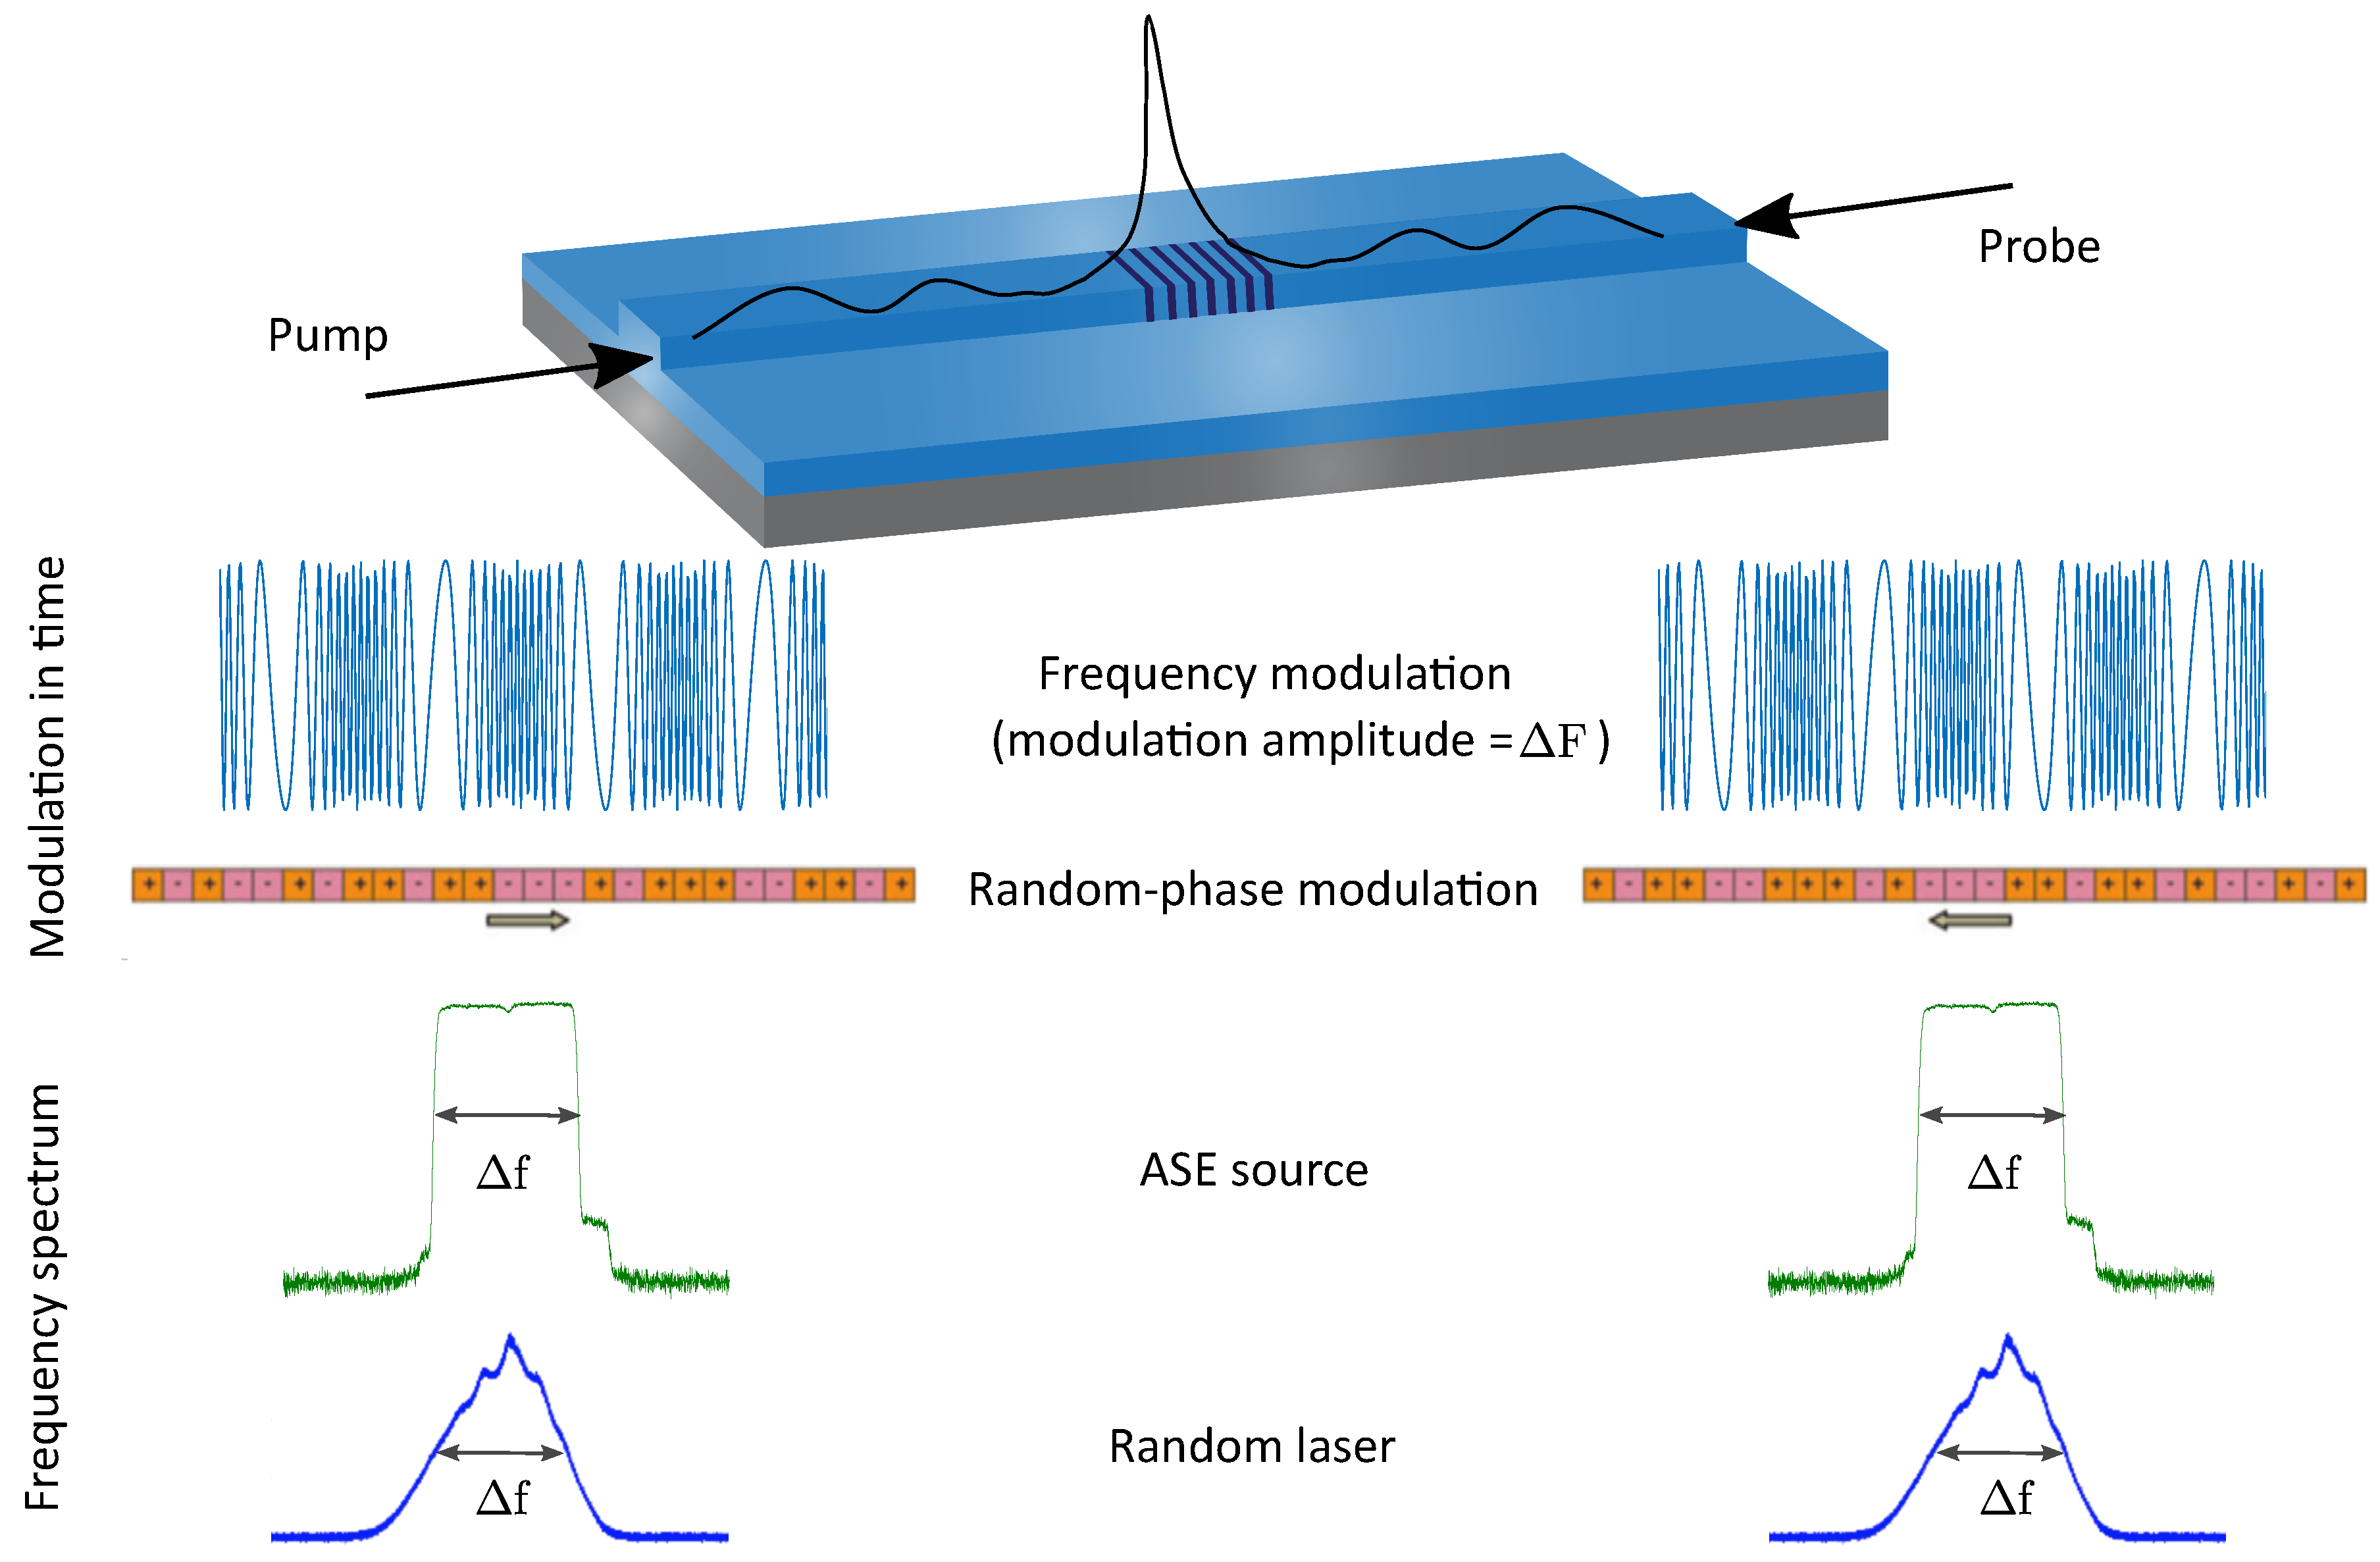
BOCDA, first introduced by Hotate et al. [43,89], relies on the correlation between the counter-propagating optical pump and probe waves. The pump and probe waves are driven from a low coherence source so that their interference in time is only partially correlated and can be defined by the auto-correlation function between the two counter-propagating waves. The length of the correlation peak determines the spatial resolution in this technique. Low-coherence sources involved so far in BOCDA include frequency-modulated [43] or random-phase-modulated laser source [44], amplified spontaneous emission (ASE) source [47], and random lasers [90]. As illustrated in Figure 3, all these techniques involve a source whose spectral bandwidth is defined either by frequency and phase modulation or a random process. This source is then split into pump and probe signals, which are frequency shifted by the BFS. The interference of the pump and probe signals in the medium results in the generation of the correlation peak in a certain positions along the waveguide, as illustrated in Figure 3. Different BOCDA approaches are discussed in the following.
The first demonstration of BOCDA was based on frequency-modulated pump and probe waves to create a localized correlation peak for the local excitation and detection of SBS response along an optical fibre with a spatial resolution of 40 cm, as shown in Figure 4a [43]. The spatial resolution () and the measurement range () of this technique are determined by the following equations [45]:
where is the modulation frequency, is the group velocity, is the Brillouin gain bandwidth, and is the modulation amplitude, as shown in Figure 3. From Equations (3) and (4), for a fixed measurement range, the spatial resolution is inversely related to the modulation amplitude. However, increasing the modulation amplitude beyond raises the problem of spectral overlap between the residual pump back-reflection—due to Rayleigh scattering and, in photonic chip experiments, a strong reflection from the chip facets—and the amplified probe, which cannot be separated using an optical filter. This issue was addressed by introducing two lock-in amplifiers (LIA) in the detection stage to distinguish electronically between the slow intensity-modulated pump and the amplified probe [92]. A distributed strain measurement with a spatial resolution of 1.6 mm based on this technique was demonstrated by Song et al. [92]. In this technique, the frequency modulation of the pump and probe results in the generation of periodic correlation peaks, which in turn limit the measurement range, as expressed in Equation (3). In addition, from Equations (3) and (4), it becomes clear that there is a trade-off between the measurement range and the spatial resolution.
BOCDA measurement based on random phase-coded pump and probe waves introduced by Zadok et al. [44] significantly extended the measurement range while achieving high spatial resolution. In this technique, the pump and the probe are coded by a binary pseudo random bit sequence (PRBS) with a symbol duration of T, where the spatial resolution is determined by . Two adjacent correlation peaks are separated by , where M is the length of the PRBS stream, which can be chosen to be considerably long to increase the measurement range [44]. This technique achieved a high spatial resolution of 1 cm, as shown in Figure 4b, with a theoretical measurement range of 1 km and experimental measurement range of 200 m. The SNR in this measurement was relatively weak due to the existence of the off-peak scattering, which scales with the measurement length. By introducing the Golomb-coded pump and probe and comparing it with the PRBS, Antman et al. showed that a higher SNR and lower off-peak reflectivity can be achieved [93]. This technique was later combined with a time gating approach to demonstrate a distributed measurement with a spatial resolution of 2 cm and the measurement range of 400 m [94]. Combining BOCDA with the time gating technique has improved the SNR and the measurement range by eliminating the noise attributed to the locations outside the correlation [94,95,96].
A novel adaptation of BOCDA, introduced by Cohen et al. [47], is based on the ASE of an erbium-doped fibre. This technique introduced a single correlation peak whose spatial resolution relied on the bandwidth of the ASE source according to: , where represents the ASE bandwidth. Unlike the frequency modulation technique, where specialized lasers capable of large modulation amplitude are required, this approach offers a simple and less expensive solution based on an ASE source to obtain mm-scale spatial resolution in optical fibres. Using this technique, a 4-mm hot spot was detected in an optical fibre [47]. The SNR in this approach is affected by the stochastic nature of the ASE source, which introduces an amplitude fluctuation to the SBS response and can be calculated by [47]:
where T is the detector integration time and is the spatial resolution. It becomes clear from Equation (5) that a system with a small and longer integration time could improve the SNR significantly. This was demonstrate in [48], which reported an 800-m spatial resolution BOCDA measurement of an on-chip photonic waveguide with a small and large compared to the optical fibre and a phase-sensitive detection technique to increase the integration time, and consequently the SNR. Figure 4c shows the detection of the waveguide facet with an 800-m spatial resolution using this technique. The practical spatial resolution in this technique is limited due to two main reasons. First, the probe amplification scales exponentially with the effective opto-acoustic interaction length; therefore, reduction in the effective opto-acoustic length as a result of increasing the spatial resolution leads to a lower SNR. Second, to achieve sub-mm spatial resolutions, the ASE bandwidth exceeds the BFS, which results in a spectral overlap between the amplified probe and the back-reflected pump, which cannot be optically filtered. In the case of on-chip waveguides, this back-reflection is much stronger due to the additional reflection from the waveguide facets, which sets a limit on the spatial resolution of the on-chip sensing experiments [48,49,97].
A low-coherence chaotic laser has also been employed to detect a 5-cm hot spot in an optical fibre based on the BOCDA principle [90]. In this method, the coherence of the random laser source is controlled by the feedback loop to the laser, which in turn determines the spatial resolution of the measurement.
Table 1 provides a summary of BOCDA distributed sensing techniques on different platforms including their spatial resolution with an emphasis on mm- and sub-mm resolutions. Noticeable from this table is the change of platforms from optical fibres to on-chip waveguides as we move from cm-scale to mm and sub-mm spatial resolutions. It is also clear from Figure 2 that the introduction and evolution of the BOCDA technique have increased the detection capabilities of Brillouin distributed sensing and put more emphasis on applications such as mapping opto-acoustic responses along the waveguide [46,48], in addition to the more traditional distributed strain and temperature sensing applications in optical fibres.
The high spatial resolution achieved by BOCDA can be applied to the short-length scale micro-scale waveguides to map the opto-acoustic responses of those structures.
In the next section, we look at the opto-acoustic interactions in micro-scale waveguides and provide an overview of the applications of Brillouin scattering in detecting very small transverse and longitudinal features in those structures using different setups.
5. Sensing of Micro-Scale Structures
Brillouin scattering in micro-scale structures including PCFs, micro-fibres, and on-chip waveguides has been studied to detect different geometrical parameters through either transverse or longitudinal opto-acoustic interactions. In this section, we explain how Brillouin scattering of micro-scale waveguides is affected by their geometries. Then, we discuss the detection of transverse and longitudinal variations along the waveguide based on forward and distributed backward scattering.
5.1. Non-Distributed Backward Brillouin Measurement
The dependence of Brillouin backward scattering on the waveguide geometry in micro-structures is evident in the work of Dainese et al. [102], where it is shown that the spectrum of the spontaneous Brillouin scattering in a small-core diameter PCF is significantly different from that in a large core diameter PCF, as shown in Figure 5. The large core PCF shows a single peak at frequency 11.2 GHz, corresponding to the dominant longitudinal acoustic mode in the bulk silica, while the small core PCF shows a family of peaks due to the existence of hybrid shear and longitudinal acoustic modes in the sub-wavelength core structure.
Unlike the conventional silica fibre, where the acoustic modes are in the form of pure longitudinal or shear modes, in the sub-wavelength regime, the acoustic wave could take the form of a surface acoustic wave (SAW) or a hybrid acoustic wave (HAW), consisting both of longitudinal and shear components [34,102]. SAWs propagate in the direction of the pump, on the surface of the micro-structure with a velocity lower than a pure longitudinal wave and scatter the light wave. Figure 6a shows the SAW spectrum in a microfibre, which was first observed by Beugnot et al. [11]. Tchahame et al. reported the first observation of SAWs in a PCF and experimentally demonstrated that the spectrum of SAW is highly dependent on the structure of the PCF, as well as the surface irregularities [12]. The two spectra shown in Figure 6b belong to PCFs with different core diameters. The shift in the Brillouin peak between the two spectra is due to the core diameter difference, while the difference between the amplitudes is linked to the microstructure irregularities [12].
The backward Brillouin spectrum was utilized to estimate the core diameter of micro-fibres based on the sensitivity of the opto-acoustic interactions to the geometrical variations in the micro-scale waveguides. Godet et al. [103] demonstrated an in situ measurement of the micro-fibre core diameter with a sensitivity of a few nm based on backward SAW and HAW measurement. After collecting the Brillouin spectrum, it was compared with a numerically-calculated map of the surface, longitudinal, and shear acoustic waves at different core diameters (refer to Figure 7) to estimate the diameter of the core. Florez et al. [10] demonstrated an effect called Brillouin self-cancellation based on the dependence of the backward Brillouin scattering on the core diameter of a microfibre. In this work, it was shown that the opposite effect of moving boundaries and photo-elasticity in the sub-wavelength regime could reduce the back-scattered signal and even cancel it at certain core diameters. This experiment suggests that the spectrum of the backward Brillouin scattering could be less sensitive to the core diameter than forward Brillouin scattering sensing, which will be discussed in the next section.
5.2. Non-Distributed Forward Brillouin Measurement
Forward Brillouin scattering has been exploited to measure the core diameter of a micro-fibre by monitoring the forward BFS [37], which is inversely related to the diameter of the micro-fibre, as expressed in Equation (2). In addition, the effect of geometry on the transverse opto-acoustic responses in micro-scale waveguides has been studied in different platforms. Beugnot et al. [104] showed that the existence of the air hole areas in a PCF enhances some transverse acoustic modes while suppressing the others by introducing additional boundary conditions over which phonons are spatially distributed, a behaviour that is different from a conventional dispersion-compensation fibre (DCF). Kang et al. in [1] showed that unlike the conventional silica fibre, which has a weak forward Brillouin interaction, a sub-wavelength PCF provides a strong interaction between the laser light and the transverse acoustic modes by tightly trapping them together within the small core of the PCF. The effect of boundary forces, namely radiation pressure on opto-acoustic responses of an on-chip silicon nano-structure, has been experimentally demonstrated by Van Laer et al. [14], where a pillar-shaped silicon waveguide exhibited significant Brillouin gain due to the trapping of the acoustic mode in the under-etched silicon waveguide and its strong overlap with the transverse optical mode as a result of the radiation pressure. In a different study, Kittlaus et al. [15] demonstrated an enhancement on the Brillouin amplification in on-chip silicon waveguides by designing a suspended silicon membrane, which guides optical and acoustic modes separately and ensures strong opto-acoustic coupling between them.
In order to characterize fully the opto-acoustic interactions in the micro-scale waveguides, information regarding the longitudinal fluctuations along the waveguide is required. This is evident from the work of Stiller et al. [36], where it is experimentally demonstrated that the spectral width of the integrated Brillouin spectrum in a PCF is affected by structural imperfections. The existence of degenerate acoustic peaks in the elasto-optic coefficient plot shown in Figure 8a, which is calculated for the actual PCF sample compared to that of a perfect PCF (Figure 8b), is attributed to the transverse structural irregularities such as defect holes, angles, and pitches, which cannot be detected by a non-distributed SBS measurement. In addition, Wolff et al. [105] theoretically showed that the opto-acoustic strength and the spectral linewidth of the Brillouin response in the nano-scale Brillouin waveguides are sensitive to fabrication imperfections.
The mentioned works so far showed how to detect geometry-dependent opto-acoustic responses and estimate the core diameter of the entire micro-structure with high sensitivity. However, in order to detect longitudinal variations along the waveguide, a distributed SBS measurement is required, which is discussed in the following section.
Characterization of the opto-acoustic responses in terms of the longitudinal fluctuations in micro-scale waveguides requires a distributed measurement of the backward Brillouin spectrum with high spatial resolution. Several studies were conducted using the distributed Brillouin sensing techniques mentioned previously to characterize the opto-acoustic responses of micro-scale waveguides, which are discussed in this section.
5.3. Distributed Backward Brillouin Measurement
The longitudinal map of the opto-acoustic responses of a PCF based on BOTDA was reported by Beugnot et al. [106], where the BFS and the full-width half-maximum (FWHM) of the Brillouin spectrum along the PCF was resolved with a spatial resolution of 2 m. Figure 9a shows the mapping of the Brillouin responses based on BEDS reported by Stiller et al. [38], where the effect of the strain and the waveguide irregularities on the local backward SBS responses of the PCF with the spatial resolution of 30 cm was studied. Chow et al. [100] mapped the uniformity of a micro-fibre by capturing the distributed backward SBS responses using phase-coded BOCDA measurement. Figure 9b shows the local Brillouin spectrum along the 13 cm-long microwire with the spatial resolution of 9 mm. Later, Chow et al. demonstrated a local excitation and capturing of the surface acoustic waves along a microwire [50]. Their setup allows for the local excitation and monitoring of the core diameter by analysing the surface opto-acoustic responses along the waveguide based on the phase-coded BOCDA technique with a spatial resolution of 5.2 cm. Distinct acoustic resonances along the tapered fibre are shown in Figure 10.
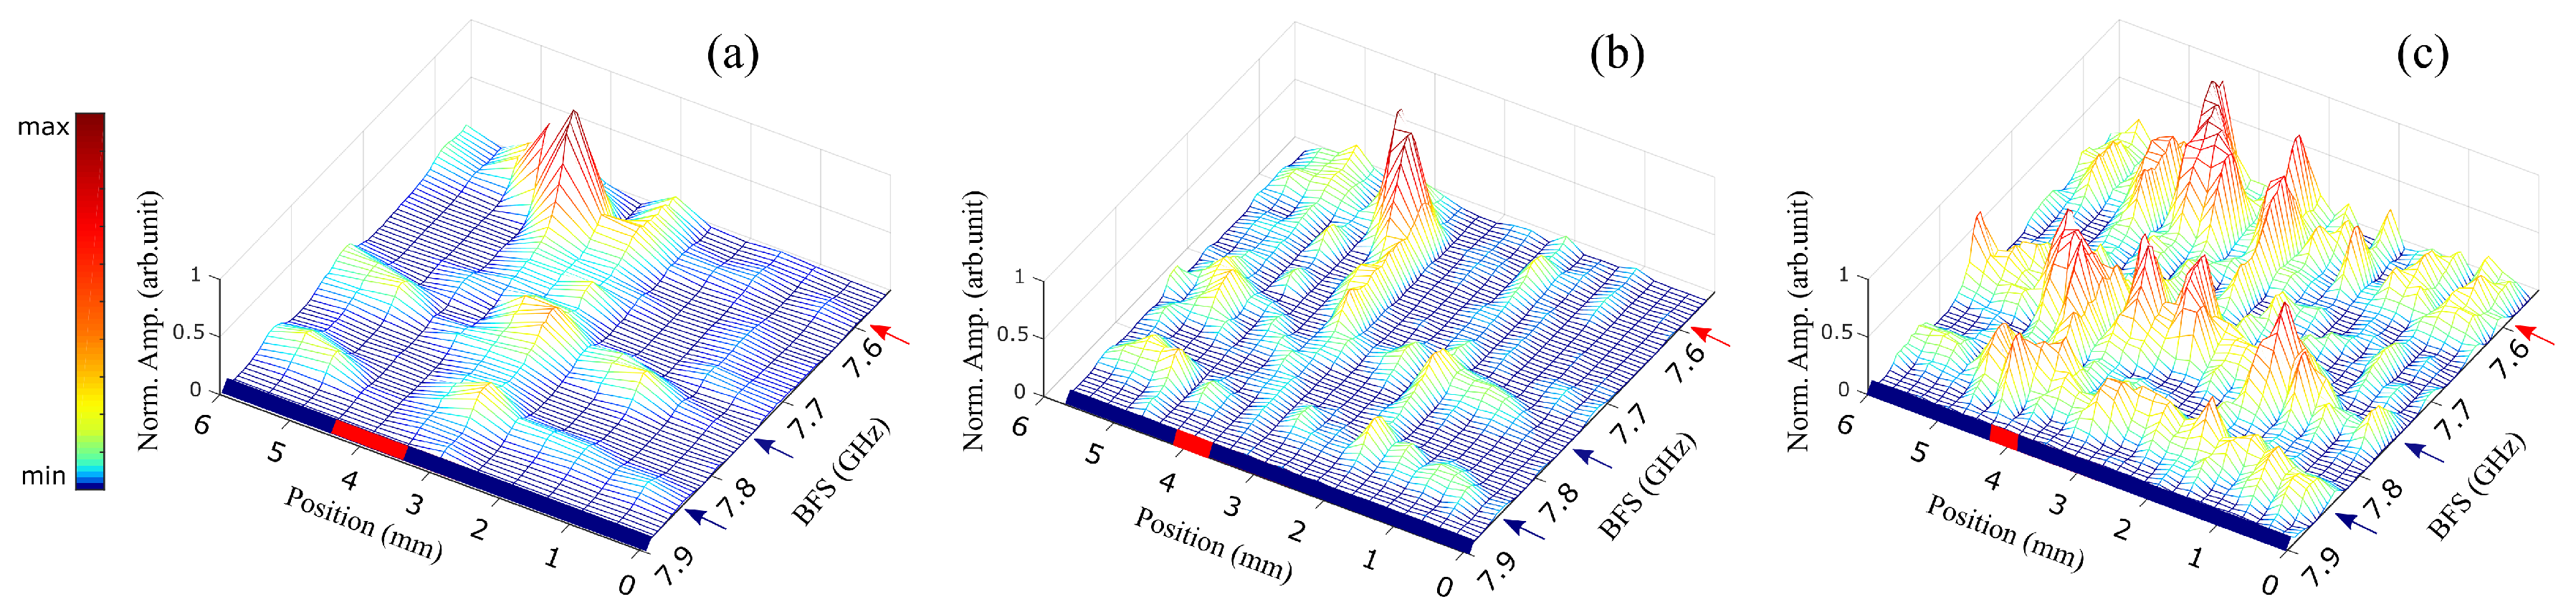
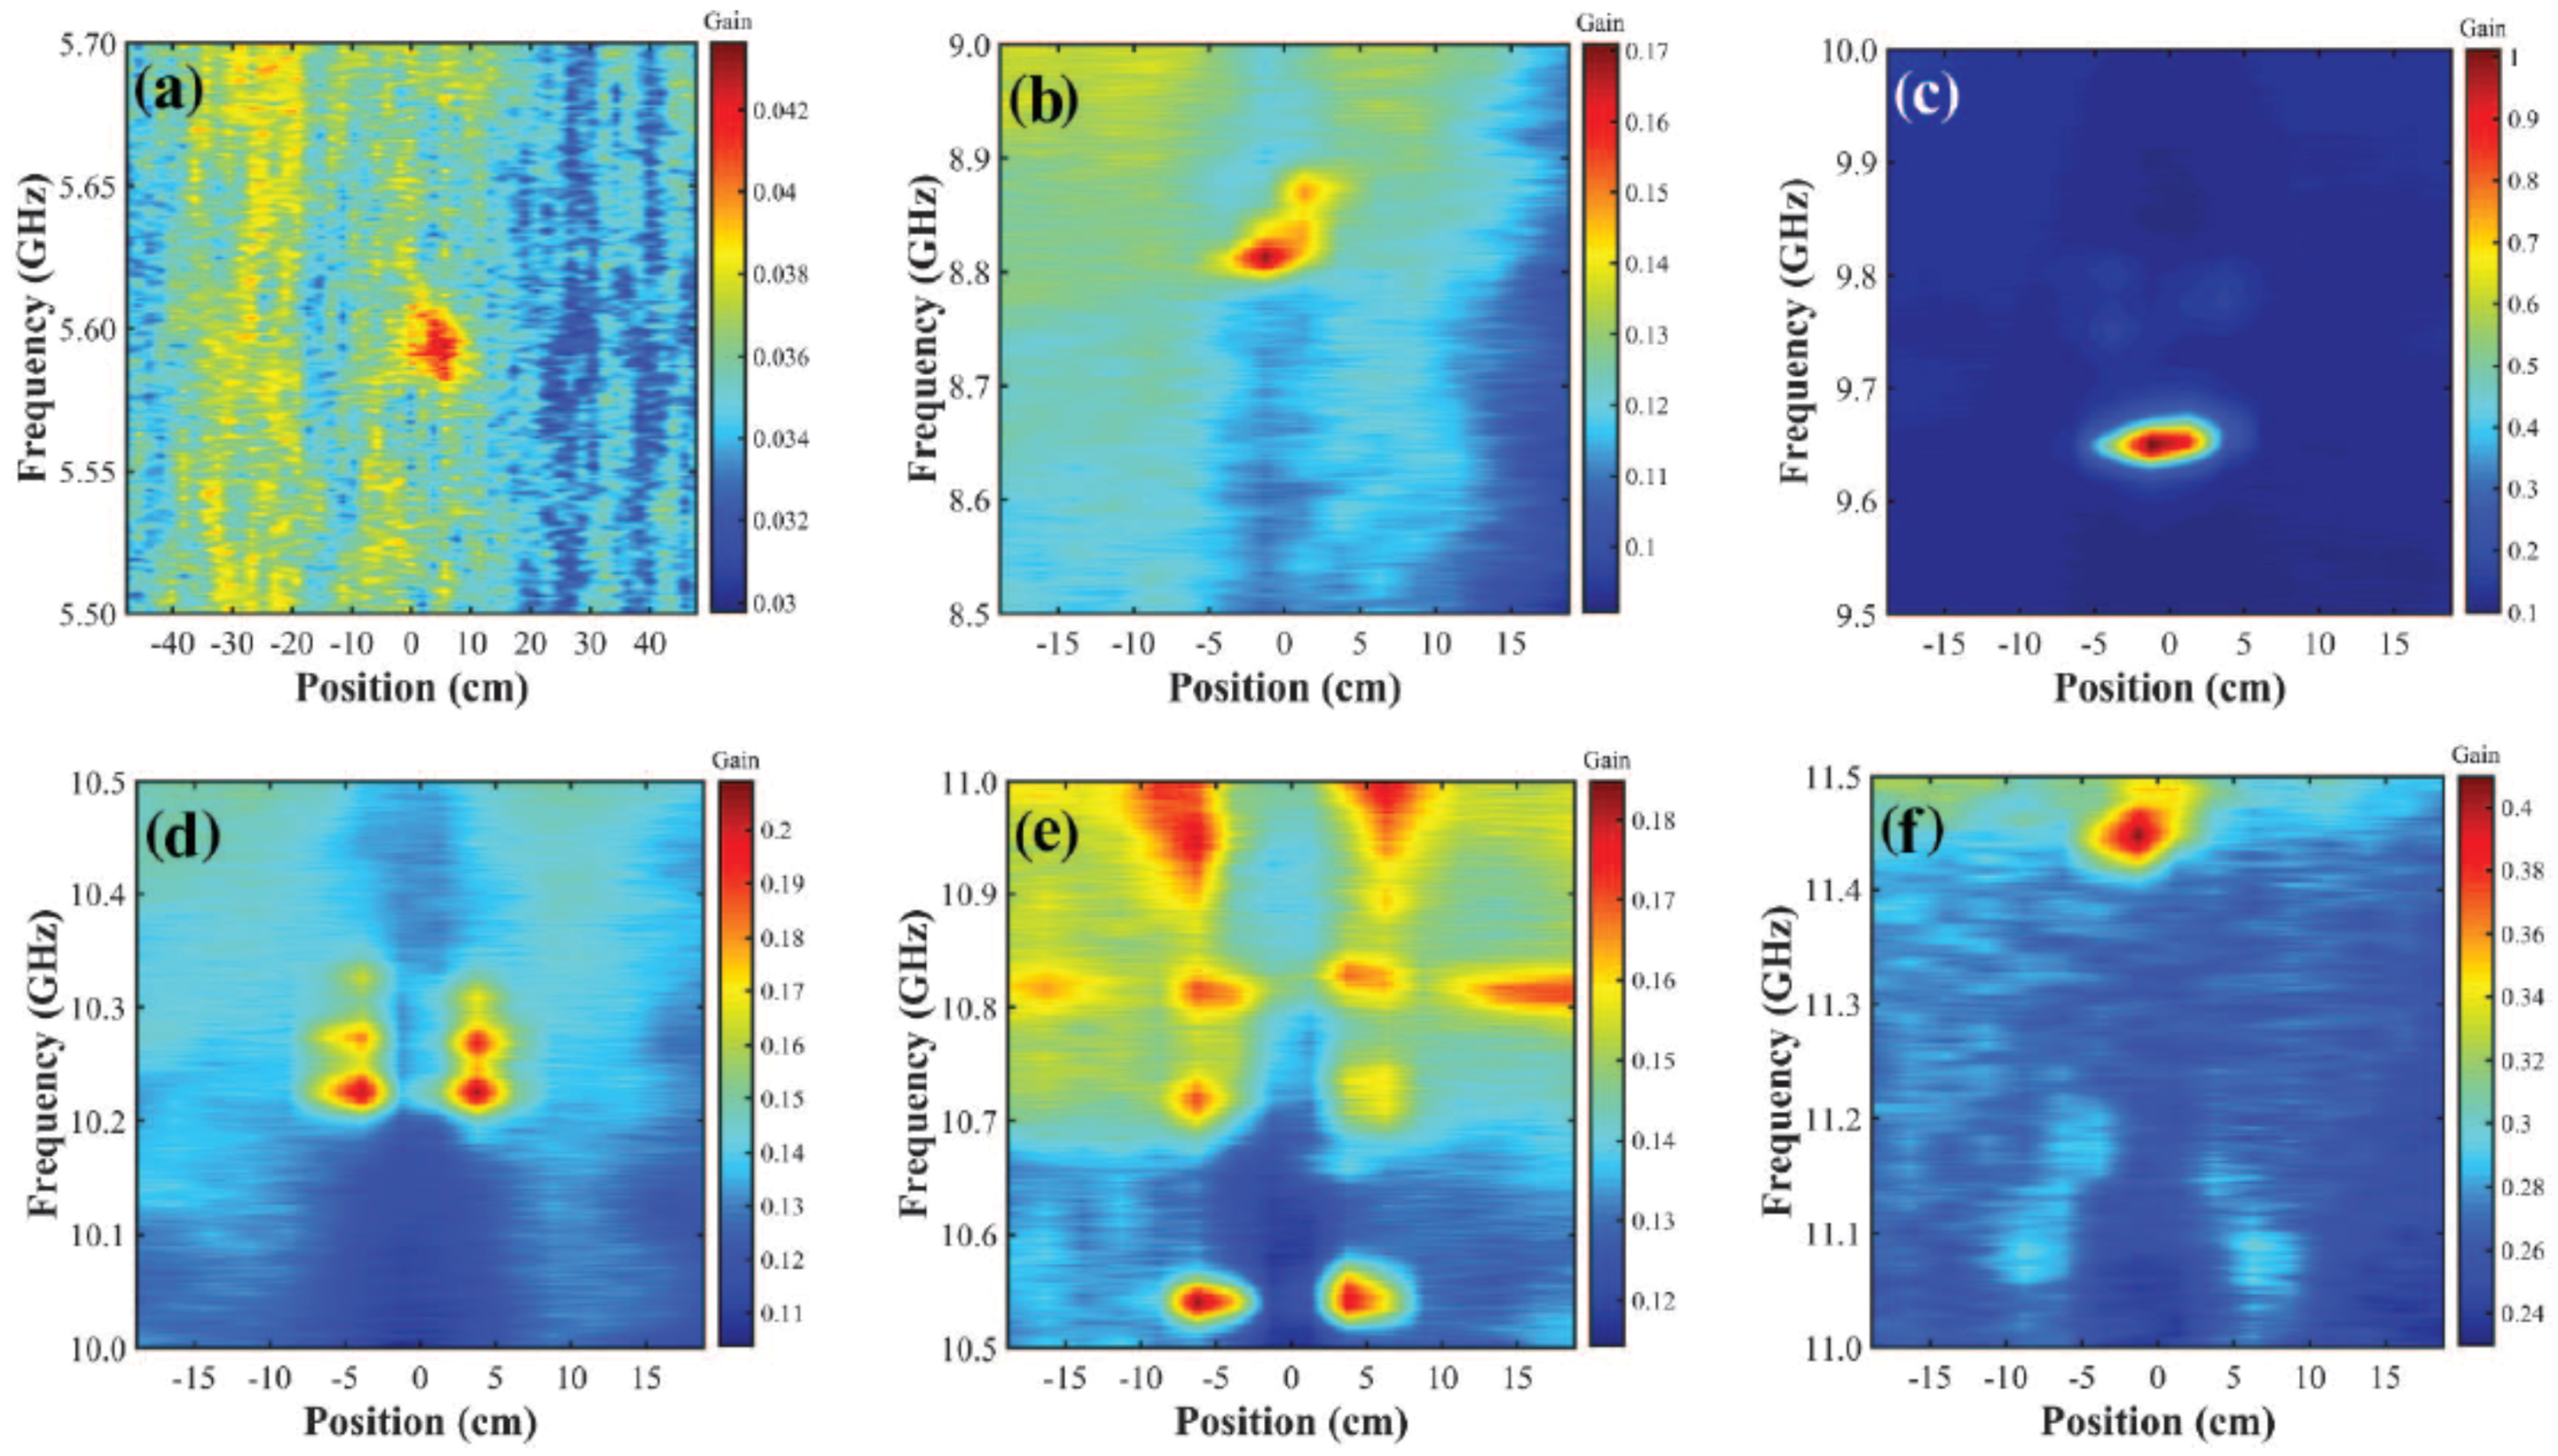
The high spatial resolution offered by BOCDA also enables monitoring of opto-acoustic responses along the cm- and mm-scale on-chip waveguides. Hotate et al. [46] studied the effect of bends on the backward SBS responses in a silica planar waveguide using BOCDA. In this experiment, a frequency-modulated BOCDA measurement with a spatial resolution of 5.9 mm was demonstrated. In Figure 11a, the fluctuations in the BFS determine the positions of the bends along the waveguide. Following the introduction of the ASE-based BOCDA measurement by [47], which offers simplicity and high spatial resolution, the local backward SBS responses of a short chalcogenide photonic waveguide were measured as shown in Figure 11b [48]. This experiment achieved 800-m spatial resolution thanks to the improved SNR compared to the optical fibre. The enhancement in the SNR was the result of a phase-sensitive detection technique, the large gain coefficient, and small opto-acoustic interaction area in the waveguide. In order to confirm the on-chip spatial resolution, a 6-mm waveguide with a 2-mm-long longitudinal feature in the form of a width variation was designed in a hybrid silicon-chalcogenide platform [49]. The Brillouin back-scattering from different sections of this waveguide was detected, as shown in Figure 12. A follow up of this work demonstrated a jump in the detection capability by detecting a 200-m longitudinal feature in the form of a width variation on a chip by further optimizing the filtering between the back-reflected pump and the amplified probe. Figure 13 shows the detection of 1-mm, 500-m, and 200-m features on hybrid silicon-chalcogenide waveguides [97]. In this experiment, both pump and probe waves are driven from a polarized ASE source with a bandwidth of 80 GHz centred at a 1550-nm wavelength. More detail about the experimental setup can be found in [97].
6. Conclusions and Outlook
In this paper, we provided a summary of various Brillouin sensing techniques in micro-scale waveguides capable of detecting small transverse and longitudinal features in these structures. We gave an overview of different techniques for mapping the longitudinal features along the waveguide using distributed Brillouin scattering and showed that the highest spatial resolution among these techniques is offered by BOCDA. We then highlighted applications of Brillouin sensing in detecting various geometrical features in PCFs, microfibres, and on-chip waveguides using non-distributed measurement with high sensitivity and mapping the opto-acoustic responses using distributed SBS measurements with high spatial resolution, featuring today’s state-of-the-art spatial resolution. The potential to further increase the spatial resolution to the scale of molecular vibrations (approximately 100 ) [88] will enable the study of the phonon-photon interaction at this limit.
In addition to the discussed distributed Brillouin measurements techniques, which deal with the detection of backward Brillouin scattering, the distributed forward Brillouin measurement was reported recently for the first time by Bashan et al. [69] and Chow et al. [70] with a spatial resolution of 100 m and 15 m, respectively. The main novelty in both approaches is the simultaneous activation (in the forward direction) and detection (in the backward direction) of the transverse acoustic waves, which involves heavy data processing and dealing with very weak SNR. These experiments open up new opportunities for characterizing on-chip silicon devices in the future, which was not possible using Brillouin distributed measurement before. This was mainly due to the fact that silicon as one of the main platforms of photonic integration exhibits strong forward Brillouin scattering, which has found applications in lasers [28], non-reciprocal modulators [107], and RF photonic filters [108], and therefore, opto-acoustic characterization of such devices is of great interest in this field. While the spatial resolution demonstrated by these techniques is not sufficient for monitoring cm- and mm-scale waveguides, there is room for spatial resolution improvement, as suggested by the authors.
Funding
This research was funded by the Australian Research Council (ARC) Laureate Fellowship (FL120100029) and the Centre of Excellence program (CUDOS CE110001018).
Conflicts of Interest
The authors declare no conflict of interest.
References
- Kang, M.S.; Nazarkin, A.; Brenn, A.; Russell, P.S.J. Tightly trapped acoustic phonons in photonic crystal fibres as highly nonlinear artificial Raman oscillators. Nat. Phys. 2009, 5, 276–280. [Google Scholar] [CrossRef]
- Gattass, R.R.; Svacha, G.T.; Tong, L.; Mazur, E. Supercontinuum generation in submicrometer diameter silica fibres. Opt. Express 2006, 14, 9408. [Google Scholar] [CrossRef] [PubMed]
- Leon-Saval, S.G.; Birks, T.A.; Wadsworth, W.J.; Russell, P.S.J.; Mason, M.W. Supercontinuum generation in submicron fibre waveguides. Opt. Express 2004, 12, 2864. [Google Scholar] [CrossRef] [PubMed]
- Foster, M.A.; Turner, A.C.; Lipson, M.; Gaeta, A.L. Nonlinear optics in photonic nanowires. Opt. Express 2008, 16, 1300. [Google Scholar] [CrossRef] [PubMed]
- Espinola, R.L.; Dadap, J.I.; Osgood, R.M., Jr.; McNab, S.J.; Vlasov, Y.A. Raman amplification in ultrasmall silicon-on-insulator wire waveguides. Opt. Express 2004, 12, 3713. [Google Scholar] [CrossRef] [PubMed]
- Dulkeith, E.; Vlasov, Y.A.; Chen, X.; Panoiu, N.C.; Osgood, R.M. Self-phase-modulation in submicron silicon-on-insulator photonic wires. Opt. Express 2006, 14, 5524–5534. [Google Scholar] [CrossRef]
- Hsieh, I.W.; Chen, X.; Dadap, J.I.; Panoiu, N.C.; Osgood, R.M.; McNab, S.J.; Vlasov, Y.A. Ultrafast-pulse self-phase modulation and third-order dispersion in Si photonic wire-waveguides. Opt. Express 2006, 14, 12380–12387. [Google Scholar] [CrossRef]
- Foster, M.A.; Turner, A.C.; Sharping, J.E.; Schmidt, B.S.; Lipson, M.; Gaeta, A.L. Broad-band optical parametric gain on a silicon photonic chip. Nature 2006, 441, 960–963. [Google Scholar] [CrossRef]
- Levy, J.S.; Gondarenko, A.; Foster, M.A.; Turner-Foster, A.C.; Gaeta, A.L.; Lipson, M. CMOS-compatible multiple-wavelength oscillator for on-chip optical interconnects. Nat. Photonics 2010, 4, 37–40. [Google Scholar] [CrossRef]
- Florez, O.; Jarschel, P.F.; Espinel, Y.A.V.; Cordeiro, C.M.B.; Mayer Alegre, T.P.; Wiederhecker, G.S.; Dainese, P. Brillouin scattering self-cancellation. Nat. Commun. 2016, 7, 11759. [Google Scholar] [CrossRef] [Green Version]
- Beugnot, J.C.; Lebrun, S.; Pauliat, G.; Maillotte, H.; Laude, V.; Sylvestre, T. Brillouin light scattering from surface acoustic waves in a subwavelength-diameter optical fibre. Nat. Commun. 2014, 5, 5242. [Google Scholar] [CrossRef] [PubMed] [Green Version]
- Tchahame, J.C.; Beugnot, J.C.; Huy, K.P.; Laude, V.; Kudlinski, A.; Sylvestre, T. Surface Brillouin scattering in photonic crystal fibres. Opt. Lett. 2016, 41, 3269. [Google Scholar] [CrossRef] [PubMed]
- Pant, R.; Poulton, C.G.; Choi, D.Y.; Mcfarlane, H.; Hile, S.; Li, E.; Thevenaz, L.; Luther-Davies, B.; Madden, S.J.; Eggleton, B.J. On-chip stimulated Brillouin scattering. Opt. Express 2011, 19, 8285. [Google Scholar] [CrossRef] [PubMed] [Green Version]
- Van Laer, R.; Kuyken, B.; Van Thourhout, D.; Baets, R. Interaction between light and highly confined hypersound in a silicon photonic nanowire. Nat. Photonics 2015, 9, 199–203. [Google Scholar] [CrossRef] [Green Version]
- Kittlaus, E.A.; Shin, H.; Rakich, P.T. Large Brillouin amplification in silicon. Nat. Photonics 2016, 10, 463–467. [Google Scholar] [CrossRef] [Green Version]
- Lu, P.; Men, L.; Sooley, K.; Chen, Q. Tapered fibre Mach–Zehnder interferometer for simultaneous measurement of refractive index and temperature. Appl. Phys. Lett. 2009, 94, 131110. [Google Scholar] [CrossRef]
- Ritari, T.; Tuominen, J.; Ludvigsen, H. Gas sensing using air-guiding photonic bandgap fibres. Opt. Express 2004, 12, 4080. [Google Scholar] [CrossRef]
- Wu, D.K.C.; Kuhlmey, B.T.; Eggleton, B.J. Ultrasensitive photonic crystal fibre refractive index sensor. Opt. Lett. 2009, 34, 322. [Google Scholar] [CrossRef]
- Dicaire, I.; De Rossi, A.; Combrié, S.; Thévenaz, L. Probing molecular absorption under slow-light propagation using a photonic crystal waveguide. Opt. Lett. 2012, 37, 4934. [Google Scholar] [CrossRef] [Green Version]
- Marpaung, D.; Morrison, B.; Pagani, M.; Pant, R.; Choi, D.Y.; Luther-Davies, B.; Madden, S.J.; Eggleton, B.J. Low-power, chip-based stimulated Brillouin scattering microwave photonic filter with ultrahigh selectivity. Optica 2015, 2, 76. [Google Scholar] [CrossRef] [Green Version]
- Sancho, J.; Primerov, N.; Chin, S.; Antman, Y.; Zadok, A.; Sales, S.; Thévenaz, L. Tunable and reconfigurable multi-tap microwave photonic filter based on dynamic Brillouin gratings in fibres. Opt. Express 2012, 20, 6157. [Google Scholar] [CrossRef] [PubMed]
- Li, J.; Lee, H.; Vahala, K.J. Microwave synthesizer using an on-chip Brillouin oscillator. Nat. Commun. 2013, 4, 2097. [Google Scholar] [CrossRef] [PubMed]
- Merklein, M.; Stiller, B.; Kabakova, I.V.; Mutugala, U.S.; Vu, K.; Madden, S.J.; Eggleton, B.J.; Slavík, R. Widely tunable, low phase noise microwave source based on a photonic chip. Opt. Lett. 2016, 41, 4633. [Google Scholar] [CrossRef] [PubMed] [Green Version]
- Loh, W.; Green, A.A.S.; Baynes, F.N.; Cole, D.C.; Quinlan, F.J.; Lee, H.; Vahala, K.J.; Papp, S.B.; Diddams, S.A. Dual-microcavity narrow-linewidth Brillouin laser. Optica 2015, 2, 225. [Google Scholar] [CrossRef] [Green Version]
- Lee, H.; Chen, T.; Li, J.; Yang, K.Y.; Jeon, S.; Painter, O.; Vahala, K.J. Chemically etched ultrahigh-Q wedge-resonator on a silicon chip. Nat. Photonics 2012, 6, 369–373. [Google Scholar] [CrossRef] [Green Version]
- Kabakova, I.V.; Pant, R.; Choi, D.y.; Debbarma, S.; Luther-Davies, B.; Madden, S.J.; Eggleton, B.J. Narrow linewidth Brillouin laser based on chalcogenide photonic chip. Opt. Lett. 2013, 38, 3208. [Google Scholar] [CrossRef] [Green Version]
- Morrison, B.; Casas-Bedoya, A.; Ren, G.; Vu, K.; Liu, Y.; Zarifi, A.; Nguyen, T.G.; Choi, D.Y.; Marpaung, D.; Madden, S.J.; et al. Compact Brillouin devices through hybrid integration on silicon. Optica 2017, 4, 847. [Google Scholar] [CrossRef] [Green Version]
- Otterstrom, N.T.; Behunin, R.O.; Kittlaus, E.A.; Wang, Z.; Rakich, P.T. A silicon Brillouin laser. Science 2018, 360, 1113–1116. [Google Scholar] [CrossRef]
- Büttner, T.F.S.; Merklein, M.; Kabakova, I.V.; Hudson, D.D.; Choi, D.Y.; Luther-Davies, B.; Madden, S.J.; Eggleton, B.J. Phase-locked, chip-based, cascaded stimulated Brillouin scattering. Optica 2014, 1, 311. [Google Scholar] [CrossRef]
- Dong, C.H.; Shen, Z.; Zou, C.L.; Zhang, Y.L.; Fu, W.; Guo, G.C. Brillouin-scattering-induced transparency and non-reciprocal light storage. Nat. Commun. 2015, 6, 6193. [Google Scholar] [CrossRef] [Green Version]
- Merklein, M.; Stiller, B.; Vu, K.; Madden, S.J.; Eggleton, B.J. A chip-integrated coherent photonic-phononic memory. Nat. Commun. 2017, 8, 574. [Google Scholar] [CrossRef] [PubMed] [Green Version]
- Qiu, W.; Rakich, P.T.; Shin, H.; Dong, H.; Soljačić, M.; Wang, Z. Stimulated Brillouin scattering in nanoscale silicon step-index waveguides: A general framework of selection rules and calculating SBS gain. Opt. Express 2013, 21, 31402. [Google Scholar] [CrossRef] [PubMed]
- Wolff, C.; Steel, M.J.; Eggleton, B.J.; Poulton, C.G. Stimulated Brillouin scattering in integrated photonic waveguides: Forces, scattering mechanisms, and coupled-mode analysis. Phys. Rev. A 2015, 92, 013836. [Google Scholar] [CrossRef]
- Poulton, C.G.; Pant, R.; Eggleton, B.J. Acoustic confinement and stimulated Brillouin scattering in integrated optical waveguides. J. Opt. Soc. Am. B 2013, 30, 2657. [Google Scholar] [CrossRef] [Green Version]
- Barclay, P.; Srinivasan, K.; Painter, O. Evanescent coupling from optical fibre tapers to photonic crystal waveguides and resonators. In Proceedings of the IEEE Postconference Digest Quantum Electronics and Laser Science, Baltimore, MD, USA, 1–6 June 2003; Volume 88, p. 2. [Google Scholar] [CrossRef]
- Stiller, B.; Delqué, M.; Beugnot, J.C.; Lee, M.W.; Mélin, G.; Maillotte, H.; Laude, V.; Sylvestre, T. Frequency-selective excitation of guided acoustic modes in a photonic crystal fibre. Opt. Express 2011, 19, 7689. [Google Scholar] [CrossRef] [PubMed]
- Jarschel, P.F.; Magalhaes, L.S.; Aldaya, I.; Florez, O.; Dainese, P. Fiber taper diameter characterization using forward Brillouin scattering. Opt. Lett. 2018, 43, 995. [Google Scholar] [CrossRef] [PubMed]
- Stiller, B.; Foaleng, S.M.; Beugnot, J.C.; Lee, M.W.; Delqué, M.; Bouwmans, G.; Kudlinski, A.; Thévenaz, L.; Maillotte, H.; Sylvestre, T. Photonic crystal fibre mapping using Brillouin echoes distributed sensing. Opt. Express 2010, 18, 20136. [Google Scholar] [CrossRef]
- Kurashima, T.; Horiguchi, T.; Tateda, M. Distributed-temperature sensing using stimulated Brillouin scattering in optical silica fibres. Opt. Lett. 1990, 15, 1038. [Google Scholar] [CrossRef]
- Bao, X.; Webb, D.J.; Jackson, D.A. 32-km distributed temperature sensor based on Brillouin loss in an optical fibre. Opt. Lett. 1993, 18, 1561. [Google Scholar] [CrossRef]
- Niklès, M.; Thévenaz, L.; Robert, P.A. Simple distributed fibre sensor based on Brillouin gain spectrum analysis. Opt. Lett. 1996, 21, 758. [Google Scholar] [CrossRef]
- Fellay, A.; Thévenaz, L.; Facchini, M.; Niklès, M.; Robert, P. Distributed sensing using stimulated Brillouin scattering: Towards ultimate resolution. In Proceedings of the 12th International Conference on Optical Fiber Sensors, Williamsburg, VA, USA, 28–31 October 1997; OSA: Washington, DC, USA; Volume 16, p. OWD3. [Google Scholar]
- Hotate, K.; Hasegawa, T. Measurement of Brillouin Gain Spectrum Distribution along an Optical Fiber Using a Correlation-Based Technique—Proposal, Experiment and Simulation. IEICE Trans. Electron. 2000, E83, 405–412. [Google Scholar]
- Zadok, A.; Antman, Y.; Primerov, N.; Denisov, A.; Sancho, J.; Thevenaz, L. Random-access distributed fibre sensing. Laser Photonics Rev. 2012, 6, L1–L5. [Google Scholar] [CrossRef]
- Song, K.Y.; He, Z.; Hotate, K. Distributed strain measurement with millimeter-order spatial resolution based on Brillouin optical correlation domain analysis. Opt. Lett. 2006, 31, 2526. [Google Scholar] [CrossRef] [PubMed]
- Hotate, K.; Watanabe, R.; He, Z.; Kishi, M. Measurement of Brillouin frequency shift distribution in PLC by Brillouin optical correlation domain analysis. In Proceedings of the OFS2012 22nd International Conference on Optical Fiber Sensors, Beijing, China, 26 October 2012; Volume 8421. [Google Scholar]
- Cohen, R.; London, Y.; Antman, Y.; Zadok, A. Brillouin optical correlation domain analysis with 4 millimeter resolution based on amplified spontaneous emission. Opt. Express 2014, 22, 12070. [Google Scholar] [CrossRef] [PubMed]
- Zarifi, A.; Stiller, B.; Merklein, M.; Li, N.; Vu, K.; Choi, D.Y.; Ma, P.; Madden, S.J.; Eggleton, B.J. Highly localized distributed Brillouin scattering response in a photonic integrated circuit. APL Photonics 2018, 3, 036101. [Google Scholar] [CrossRef]
- Zarifi, A.; Stiller, B.; Merklein, M.; Liu, Y.; Morrison, B.; Casas-Bedoya, A.; Ren, G.; Nguyen, T.G.; Vu, K.; Choi, D.Y.; et al. Brillouin spectroscopy of a hybrid silicon-chalcogenide waveguide with geometrical variations. Opt. Lett. 2018, 43, 3493. [Google Scholar] [CrossRef] [PubMed]
- Chow, D.M.; Beugnot, J.C.; Godet, A.; Huy, K.P.; Soto, M.A.; Thévenaz, L. Local activation of surface and hybrid acoustic waves in optical microwires. Opt. Lett. 2018, 43, 1487. [Google Scholar] [CrossRef] [PubMed]
- Motil, A.; Bergman, A.; Tur, M. [INVITED] State of the art of Brillouin fibre-optic distributed sensing. Opt. Laser Technol. 2016, 78, 81–103. [Google Scholar] [CrossRef]
- Bao, X.; Chen, L. Recent Progress in Brillouin Scattering Based Fiber Sensors. Sensors 2011, 11, 4152–4187. [Google Scholar] [CrossRef] [PubMed] [Green Version]
- Thévenaz, L. Brillouin distributed time-domain sensing in optical fibres: State of the art and perspectives. Front. Optoelectron. China 2010, 3, 13–21. [Google Scholar] [CrossRef]
- Hotate, K. Fiber distributed Brillouin sensing with optical correlation domain techniques. Opt. Fiber Technol. 2013, 19, 700–719. [Google Scholar] [CrossRef]
- Bao, X.; Chen, L. Recent Progress in Distributed Fiber Optic Sensors. Sensors 2012, 12, 8601–8639. [Google Scholar] [CrossRef] [PubMed] [Green Version]
- Masoudi, A.; Newson, T. Contributed Review: Distributed optical fibre dynamic strain sensing. Rev. Sci. Instrum. 2016, 87, 011501. [Google Scholar] [CrossRef] [PubMed] [Green Version]
- Zou, W.; He, Z.; Hotate, K. Investigation of Strain- and Temperature-Dependences of Brillouin Frequency Shifts in GeO2-Doped Optical Fibers. J. Lightwave Technol. 2008, 26, 1854–1861. [Google Scholar] [CrossRef]
- Horiguchi, T.; Shimizu, K.; Kurashima, T.; Tateda, M.; Koyamada, Y. Development of a distributed sensing technique using Brillouin scattering. J. Lightwave Technol. 1995, 13, 1296–1302. [Google Scholar] [CrossRef]
- Nikles, M.; Thevenaz, L.; Robert, P. Brillouin gain spectrum characterization in single-mode optical fibres. J. Lightwave Technol. 1997, 15, 1842–1851. [Google Scholar] [CrossRef]
- Thévenaz, L. Monitoring of large structure using distributed Brillouin fibre sensing. In Proceedings of the 13th International Conference on Optical Fiber Sensors, Kyongju, Korea, 1 September 1999; Volume 374642, p. 145. [Google Scholar] [CrossRef]
- Li, Y.; Zhang, F.; Yoshino, T. Wide-range temperature dependence of Brillouin shift in a dispersion-shifted fibre and its annealing effect. J. Lightwave Technol. 2003, 21, 1663–1667. [Google Scholar] [CrossRef]
- Zou, L.; Bao, X.; Afshar, V.S.; Chen, L. Dependence of the Brillouin frequency shift on strain and temperature in a photonic crystal fibre. Opt. Lett. 2004, 29, 1485. [Google Scholar] [CrossRef] [PubMed]
- Shiraki, K.; Ohashi, M. Sound velocity measurement based on guided acoustic-wave Brillouin scattering. IEEE Photonics Technol. Lett. 1992, 4, 1177–1180. [Google Scholar] [CrossRef]
- Shelby, R.M.; Levenson, M.D.; Bayer, P.W. Guided acoustic-wave Brillouin scattering. Phys. Rev. B 1985, 31, 5244–5252. [Google Scholar] [CrossRef]
- Tanaka, Y.; Ogusu, K. Tensile-strain coefficient of resonance frequency of depolarized guided acoustic-wave Brillouin scattering. IEEE Photonics Technol. Lett. 1999, 11, 865–867. [Google Scholar] [CrossRef]
- Hayashi, N.; Suzuki, K.; Set, S.Y.; Yamashita, S. Temperature coefficient of sideband frequency produced by polarized guided acoustic-wave Brillouin scattering in highly nonlinear fibres. Appl. Phys. Express 2017, 10, 092501. [Google Scholar] [CrossRef]
- Carry, E.; Beugnot, J.C.; Stiller, B.; Lee, M.W.; Maillotte, H.; Sylvestre, T. Temperature coefficient of the high-frequency guided acoustic mode in a photonic crystal fibre. Appl. Opt. 2011, 50, 6543. [Google Scholar] [CrossRef] [PubMed]
- Antman, Y.; Clain, A.; London, Y.; Zadok, A. Optomechanical sensing of liquids outside standard fibres using forward stimulated Brillouin scattering. Optica 2016, 3, 510. [Google Scholar] [CrossRef]
- Bashan, G.; Diamandi, H.H.; London, Y.; Preter, E.; Zadok, A. Optomechanical time-domain reflectometry. Nat. Commun. 2018, 9, 2991. [Google Scholar] [CrossRef]
- Chow, D.M.; Yang, Z.; Soto, M.A.; Thévenaz, L. Distributed forward Brillouin sensor based on local light phase recovery. Nat. Commun. 2018, 9, 2990. [Google Scholar] [CrossRef]
- Rakich, P.T.; Reinke, C.; Camacho, R.; Davids, P.; Wang, Z. Giant Enhancement of Stimulated Brillouin Scattering in the Subwavelength Limit. Phys. Rev. X 2012, 2, 011008. [Google Scholar] [CrossRef]
- Horiguchi, T.; Tateda, M. Optical-fibre-attenuation investigation using stimulated Brillouin scattering between a pulse and a continuous wave. Opt. Lett. 1989, 14, 408. [Google Scholar] [CrossRef]
- Horiguchi, T.; Tateda, M. BOTDA-nondestructive measurement of single-mode optical fibre attenuation characteristics using Brillouin interaction: Theory. J. Lightwave Technol. 1989, 7, 1170–1176. [Google Scholar] [CrossRef]
- Brown, A.; Colpitts, B.; Brown, K. Distributed sensor based on dark-pulse Brillouin scattering. IEEE Photonics Technol. Lett. 2005, 17, 1501–1503. [Google Scholar] [CrossRef]
- Bao, X.; Brown, A.; DeMerchant, M.; Smith, J. Characterization of the Brillouin-loss spectrum of single-mode fibres by use of very short (<10-ns) pulses. Opt. Lett. 1999, 24, 510. [Google Scholar] [CrossRef] [PubMed]
- Zou, L.; Bao, X.; Wan, Y.; Chen, L. Coherent probe-pump-based Brillouin sensor for centimeter-crack detection. Opt. Lett. 2005, 30, 370. [Google Scholar] [CrossRef] [PubMed]
- Foaleng, S.M.; Tur, M.; Beugnot, J.C.; Thévenaz, L. High spatial and spectral resolution long-range sensing using Brillouin echoes. J. Lightwave Technol. 2010, 28, 2993–3003. [Google Scholar] [CrossRef]
- Beugnot, J.C.; Tur, M.; Mafang, S.F.; Thévenaz, L. Distributed Brillouin sensing with sub-meter spatial resolution: Modeling and processing. Opt. Express 2011, 19, 7381. [Google Scholar] [CrossRef] [PubMed]
- Soto, M.A.; Bolognini, G.; Di Pasquale, F. Analysis of pulse modulation format in coded BOTDA sensors. Opt. Express 2010, 18, 14878. [Google Scholar] [CrossRef] [Green Version]
- Brown, A.W.; Colpitts, B.G.; Brown, K. Dark-Pulse Brillouin Optical Time-Domain Sensor With 20-mm Spatial Resolution. J. Lightwave Technol. 2007, 25, 381–386. [Google Scholar] [CrossRef]
- Thévenaz, L.; Foaleng Mafang, S. Distributed fibre sensing using Brillouin echoes. Proc. SPIE 2008, 7004, 70043N. [Google Scholar] [CrossRef]
- Bao, Y.; Meng, W.; Chen, Y.; Chen, G.; Khayat, K.H. Measuring mortar shrinkage and cracking by pulse pre-pump Brillouin optical time domain analysis with a single optical fibre. Mater. Lett. 2015, 145, 344–346. [Google Scholar] [CrossRef]
- Kishida, K.; Li, C.H. Pulse Pre-Pump-BOTDA technology for new generation of distributed strain measuring system. In Structural Health Monitoring and Intelligent Infrastructure, Proceedings of the 2nd International Conference on Structural Health Monitoring of Intelligent Infrastructure, Shenzhen, China, 16–18 November 2005; CRC Press: Boca Raton, FL, USA, 2006; Volume 1, pp. 471–477. [Google Scholar]
- Bao, Y.; Chen, G. High-temperature measurement with Brillouin optical time domain analysis of an annealed fused-silica single-mode fibre. Opt. Lett. 2016, 41, 3177. [Google Scholar] [CrossRef]
- Bao, Y.; Chen, G. Temperature-dependent strain and temperature sensitivities of fused silica single mode fibre sensors with pulse pre-pump Brillouin optical time domain analysis. Meas. Sci. Technol. 2016, 27, 065101. [Google Scholar] [CrossRef]
- Bernini, R.; Minardo, A.; Zeni, L. Distributed Sensing at Centimeter-Scale Spatial Resolution by BOFDA: Measurements and Signal Processing. IEEE Photonics J. 2012, 4, 48–56. [Google Scholar] [CrossRef] [Green Version]
- Song, K.Y.; Zou, W.; He, Z.; Hotate, K. All-optical dynamic grating generation based on Brillouin scattering in polarization-maintaining fibre. Opt. Lett. 2008, 33, 926. [Google Scholar] [CrossRef] [PubMed]
- Chin, S.; Primerov, N.; Thevenaz, L. Sub-Centimeter Spatial Resolution in Distributed Fiber Sensing Based on Dynamic Brillouin Grating in Optical Fibers. IEEE Sens. J. 2012, 12, 189–194. [Google Scholar] [CrossRef] [Green Version]
- Hasegawa, T.; Hotate, K. Measurement of Brillouin gain spectrum distribution along an optical fibre by direct frequency modulation of a laser diode. Proc. SPIE 1999, 3860, 306–316. [Google Scholar] [CrossRef]
- Zhang, J.; Zhang, M.; Zhang, M.; Liu, Y.; Feng, C.; Wang, Y.; Wang, Y. Chaotic Brillouin optical correlation-domain analysis. Opt. Lett. 2018, 43, 1722. [Google Scholar] [CrossRef] [PubMed]
- Zhang, J.; Feng, C.; Zhang, M.; Liu, Y.; Wu, C.; Wang, Y. Brillouin optical correlation domain analysis based on chaotic laser with suppressed time delay signature. Opt. Express 2018, 26, 6962. [Google Scholar] [CrossRef]
- Song, K.Y.; Hotate, K. Enlargement of measurement range in a Brillouin optical correlation domain analysis system using double lock-in amplifiers and a single-sideband modulator. IEEE Photonics Technol. Lett. 2006, 18, 499–501. [Google Scholar] [CrossRef]
- Antman, Y.; Yaron, L.; Langer, T.; Tur, M.; Levanon, N.; Zadok, A. Experimental demonstration of localized Brillouin gratings with low off-peak reflectivity established by perfect Golomb codes. Opt. Lett. 2013, 38, 4701. [Google Scholar] [CrossRef]
- Elooz, D.; Antman, Y.; Levanon, N.; Zadok, A. High-resolution long-reach distributed Brillouin sensing based on combined time-domain and correlation-domain analysis. Opt. Express 2014, 22, 6453. [Google Scholar] [CrossRef]
- Hotate, K.H.; Rai, H.A.; Ong, K.Y.S. Range-Enlargement of Simplified Brillouin Optical Correlation Domain Analysis Based on a Temporal Gating Scheme. SICE J. Control Meas. Syst. Integr. 2008, 1, 271–274. [Google Scholar] [CrossRef] [Green Version]
- Denisov, A.; Soto, M.A.; Thévenaz, L. Time gated phase-correlation distributed Brillouin fibre sensor. Proc. SPIE 2013, 8794, 87943I. [Google Scholar] [CrossRef]
- Zarifi, A.; Stiller, B.; Merklein, M.; Liu, Y.; Morrison, B.; Casas-Bedoya, A.; Ren, G.; Nguyen, T.G.; Vu, K.; Choi, D.Y.; et al. On-chip correlation-based Brillouin sensing: Design, experiment and simulation. arXiv, 2018; arXiv:1809.07160. [Google Scholar]
- Jeong, J.H.; Lee, K.; Song, K.Y.; Jeong, J.M.; Lee, S.B. Differential measurement for Brillouin optical correlation domain analysis. Opt. Express 2012, 20, 11091. [Google Scholar] [CrossRef] [PubMed]
- Hotate, K.; He, Z. Synthesis of optical-coherence function and its applications in distributed and multiplexed optical sensing. J. Lightwave Technol. 2006, 24, 2541–2557. [Google Scholar] [CrossRef]
- Chow, D.; Tchahame Nougnihi, J.C.; Denisov, A.; Beugnot, J.C.; Sylvestre, T.; Li, L.; Ahmad, R.; Rochette, M.; Tow, K.H.; Soto, M.A.; et al. Mapping the Uniformity of Optical Microwires Using Phase-Correlation Brillouin Distributed Measurements. In Proceedings of the Frontiers in Optics 2015, San Jose, CA, USA, 18–22 October 2015; OSA: Washington, DC, USA, 2015; p. FW4F.4. [Google Scholar] [CrossRef] [Green Version]
- Hotate, K.; Abe, K.; Song, K.Y. Suppression of Signal Fluctuation in Brillouin Optical Correlation Domain Analysis System Using Polarization Diversity Scheme. IEEE Photonics Technol. Lett. 2006, 18, 2653–2655. [Google Scholar] [CrossRef]
- Dainese, P.; Russell, P.S.J.; Joly, N.; Knight, J.C.; Wiederhecker, G.S.; Fragnito, H.L.; Laude, V.; Khelif, A. Stimulated Brillouin scattering from multi-GHz-guided acoustic phonons in nanostructured photonic crystal fibres. Nat. Phys. 2006, 2, 388–392. [Google Scholar] [CrossRef]
- Godet, A.; Ndao, A.; Sylvestre, T.; Pecheur, V.; Lebrun, S.; Pauliat, G.; Beugnot, J.C.; Phan Huy, K. Brillouin spectroscopy of optical microfibres and nanofibres. Optica 2017, 4, 1232. [Google Scholar] [CrossRef]
- Beugnot, J.C.; Sylvestre, T.; Maillotte, H.; Mélin, G.; Laude, V. Guided acoustic wave Brillouin scattering in photonic crystal fibres. Opt. Lett. 2007, 32, 17. [Google Scholar] [CrossRef]
- Wolff, C.; Laer, R.V.; Steel, M.J.; Eggleton, B.J.; Poulton, C.G. Brillouin resonance broadening due to structural variations in nanoscale waveguides. New J. Phys. 2016, 18, 025006. [Google Scholar] [CrossRef] [Green Version]
- Beugnot, J.C.; Sylvestre, T.; Alasia, D.; Maillotte, H.; Laude, V.; Monteville, A.; Provino, L.; Traynor, N.; Mafang, S.F.; Thévenaz, L. Complete experimental characterization of stimulated Brillouin scattering in photonic crystal fibre. Opt. Express 2007, 15, 15517. [Google Scholar] [CrossRef]
- Kittlaus, E.A.; Otterstrom, N.T.; Kharel, P.; Gertler, S.; Rakich, P.T. Non-reciprocal interband Brillouin modulation. Nat. Photonics 2018, 12, 613–619. [Google Scholar] [CrossRef]
- Kittlaus, E.A.; Kharel, P.; Otterstrom, N.T.; Wang, Z.; Rakich, P.T. RF-Photonic Filters via On-Chip Photonic–Phononic Emit–Receive Operations. J. Lightwave Technol. 2018, 36, 2803–2809. [Google Scholar] [CrossRef]
Figure 1.
Backward Brillouin scattering under phase-matching and energy conservation conditions.
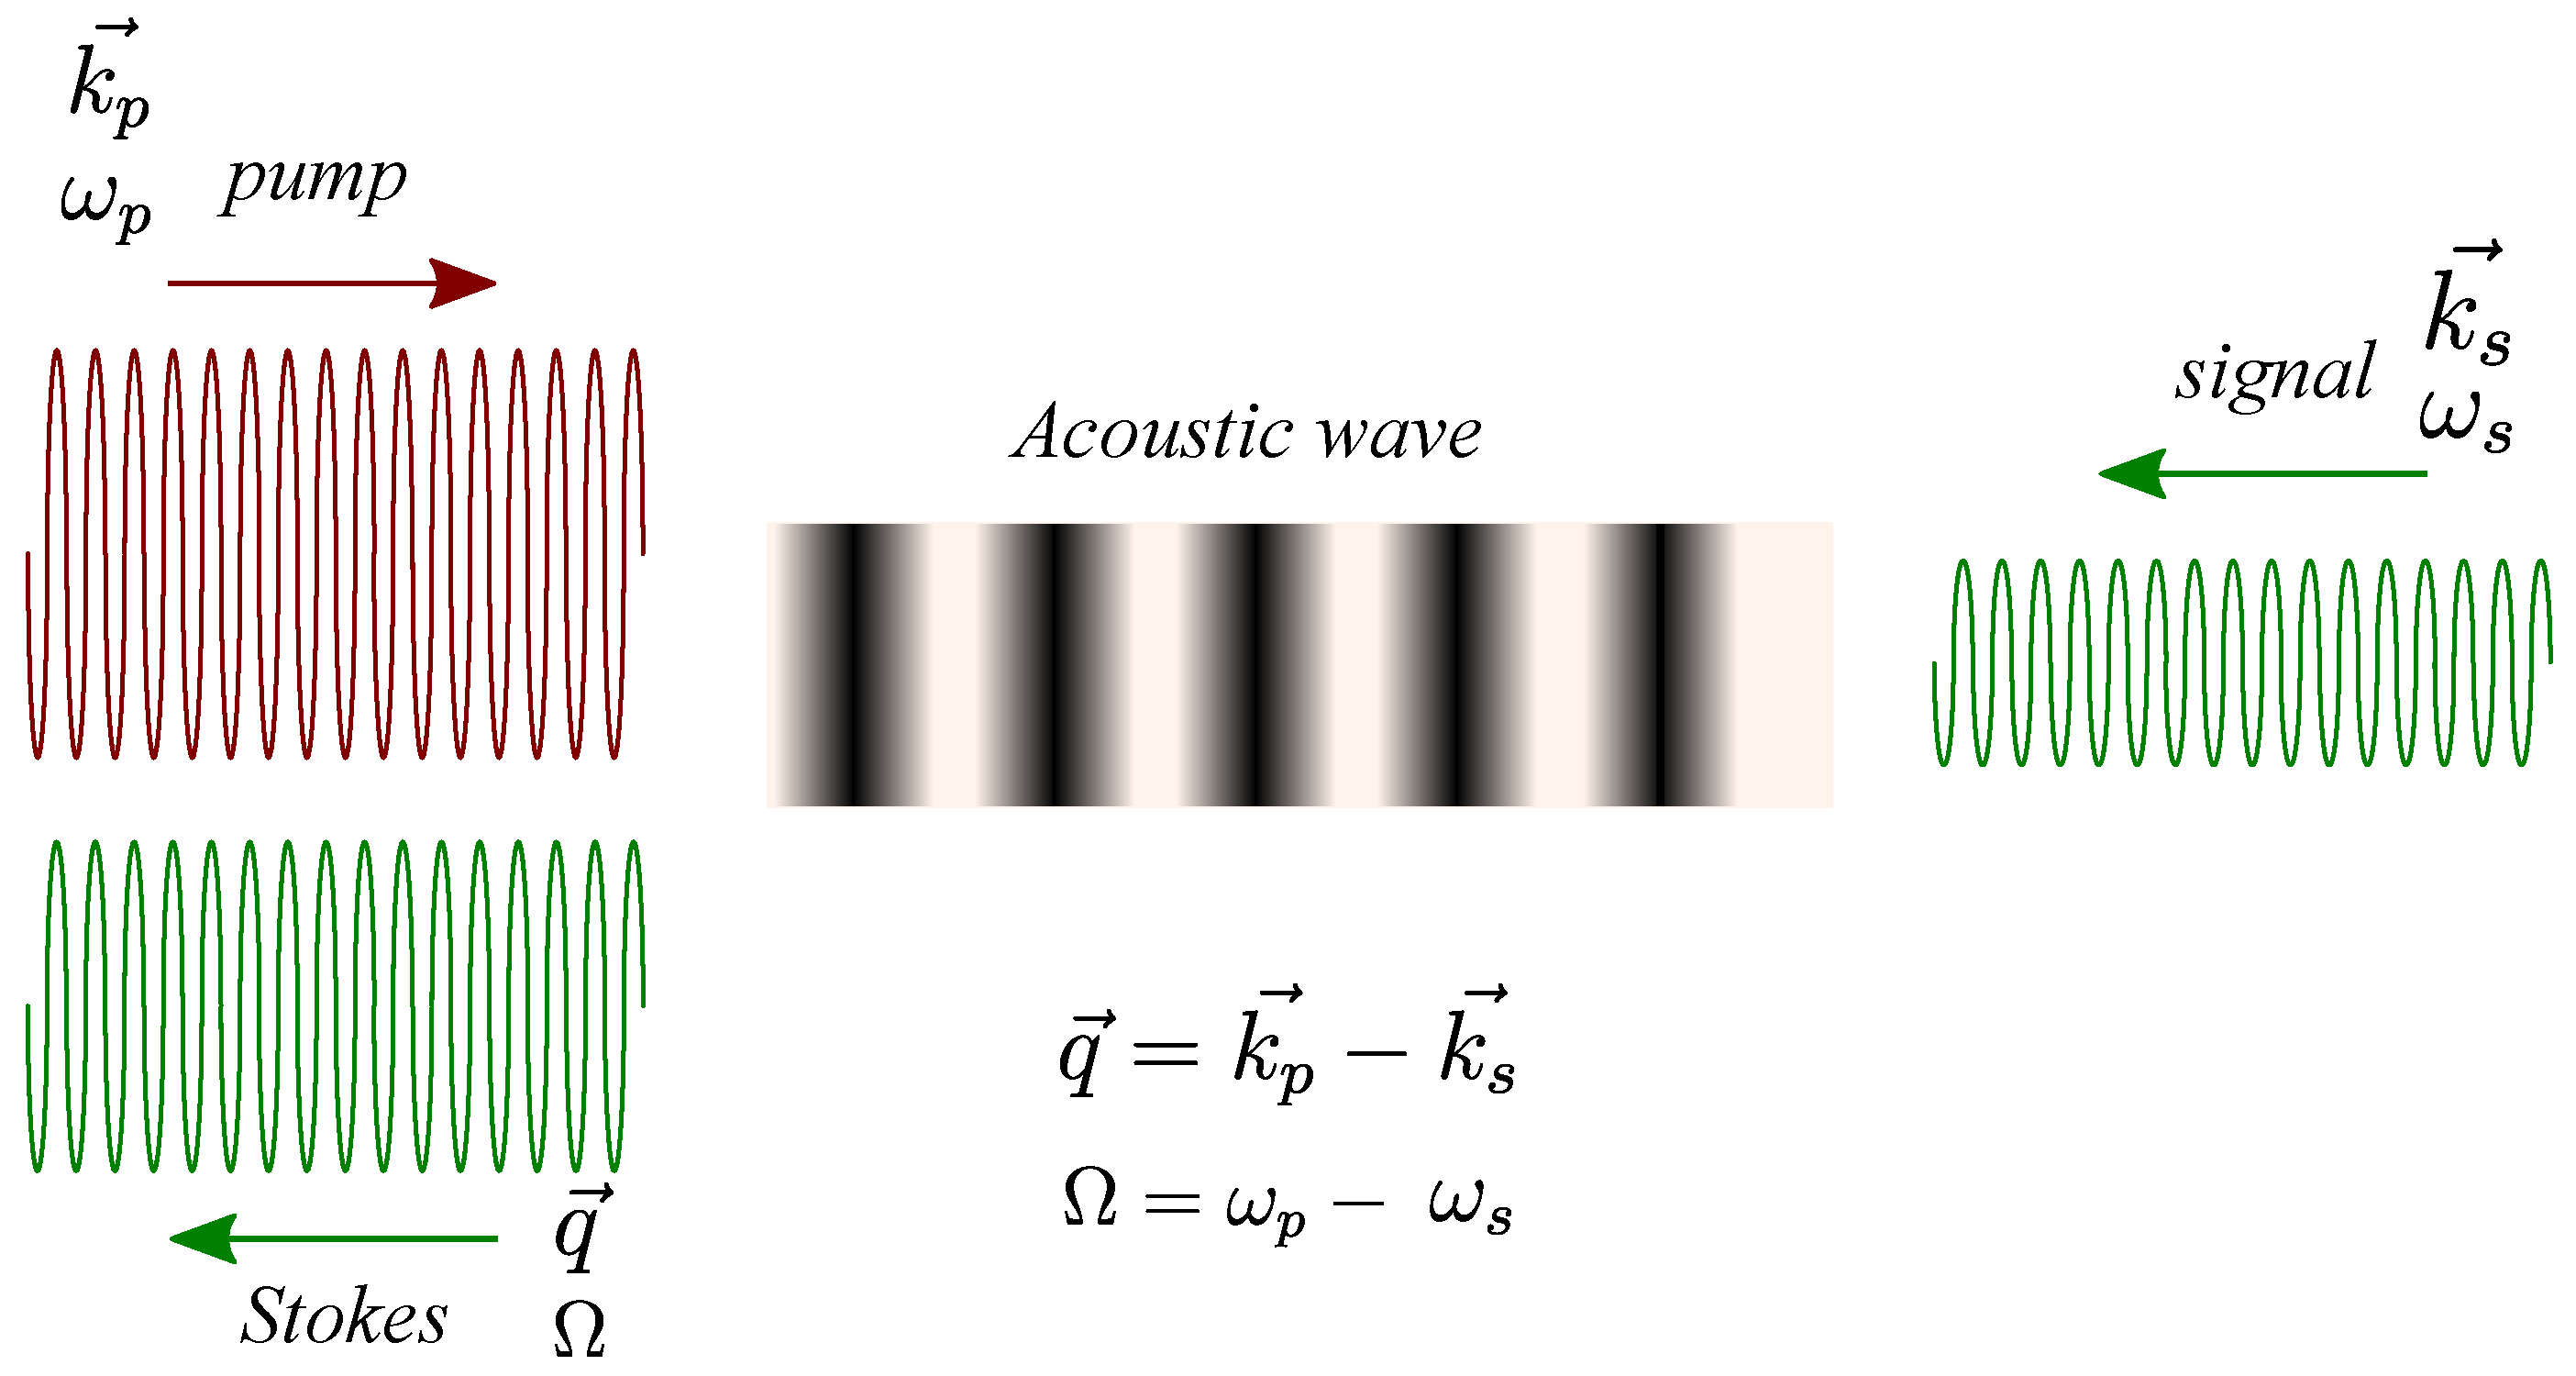
Figure 2.
Overview of the spatial resolution evolution the time domain and correlation domain techniques.
Figure 2.
Overview of the spatial resolution evolution the time domain and correlation domain techniques.
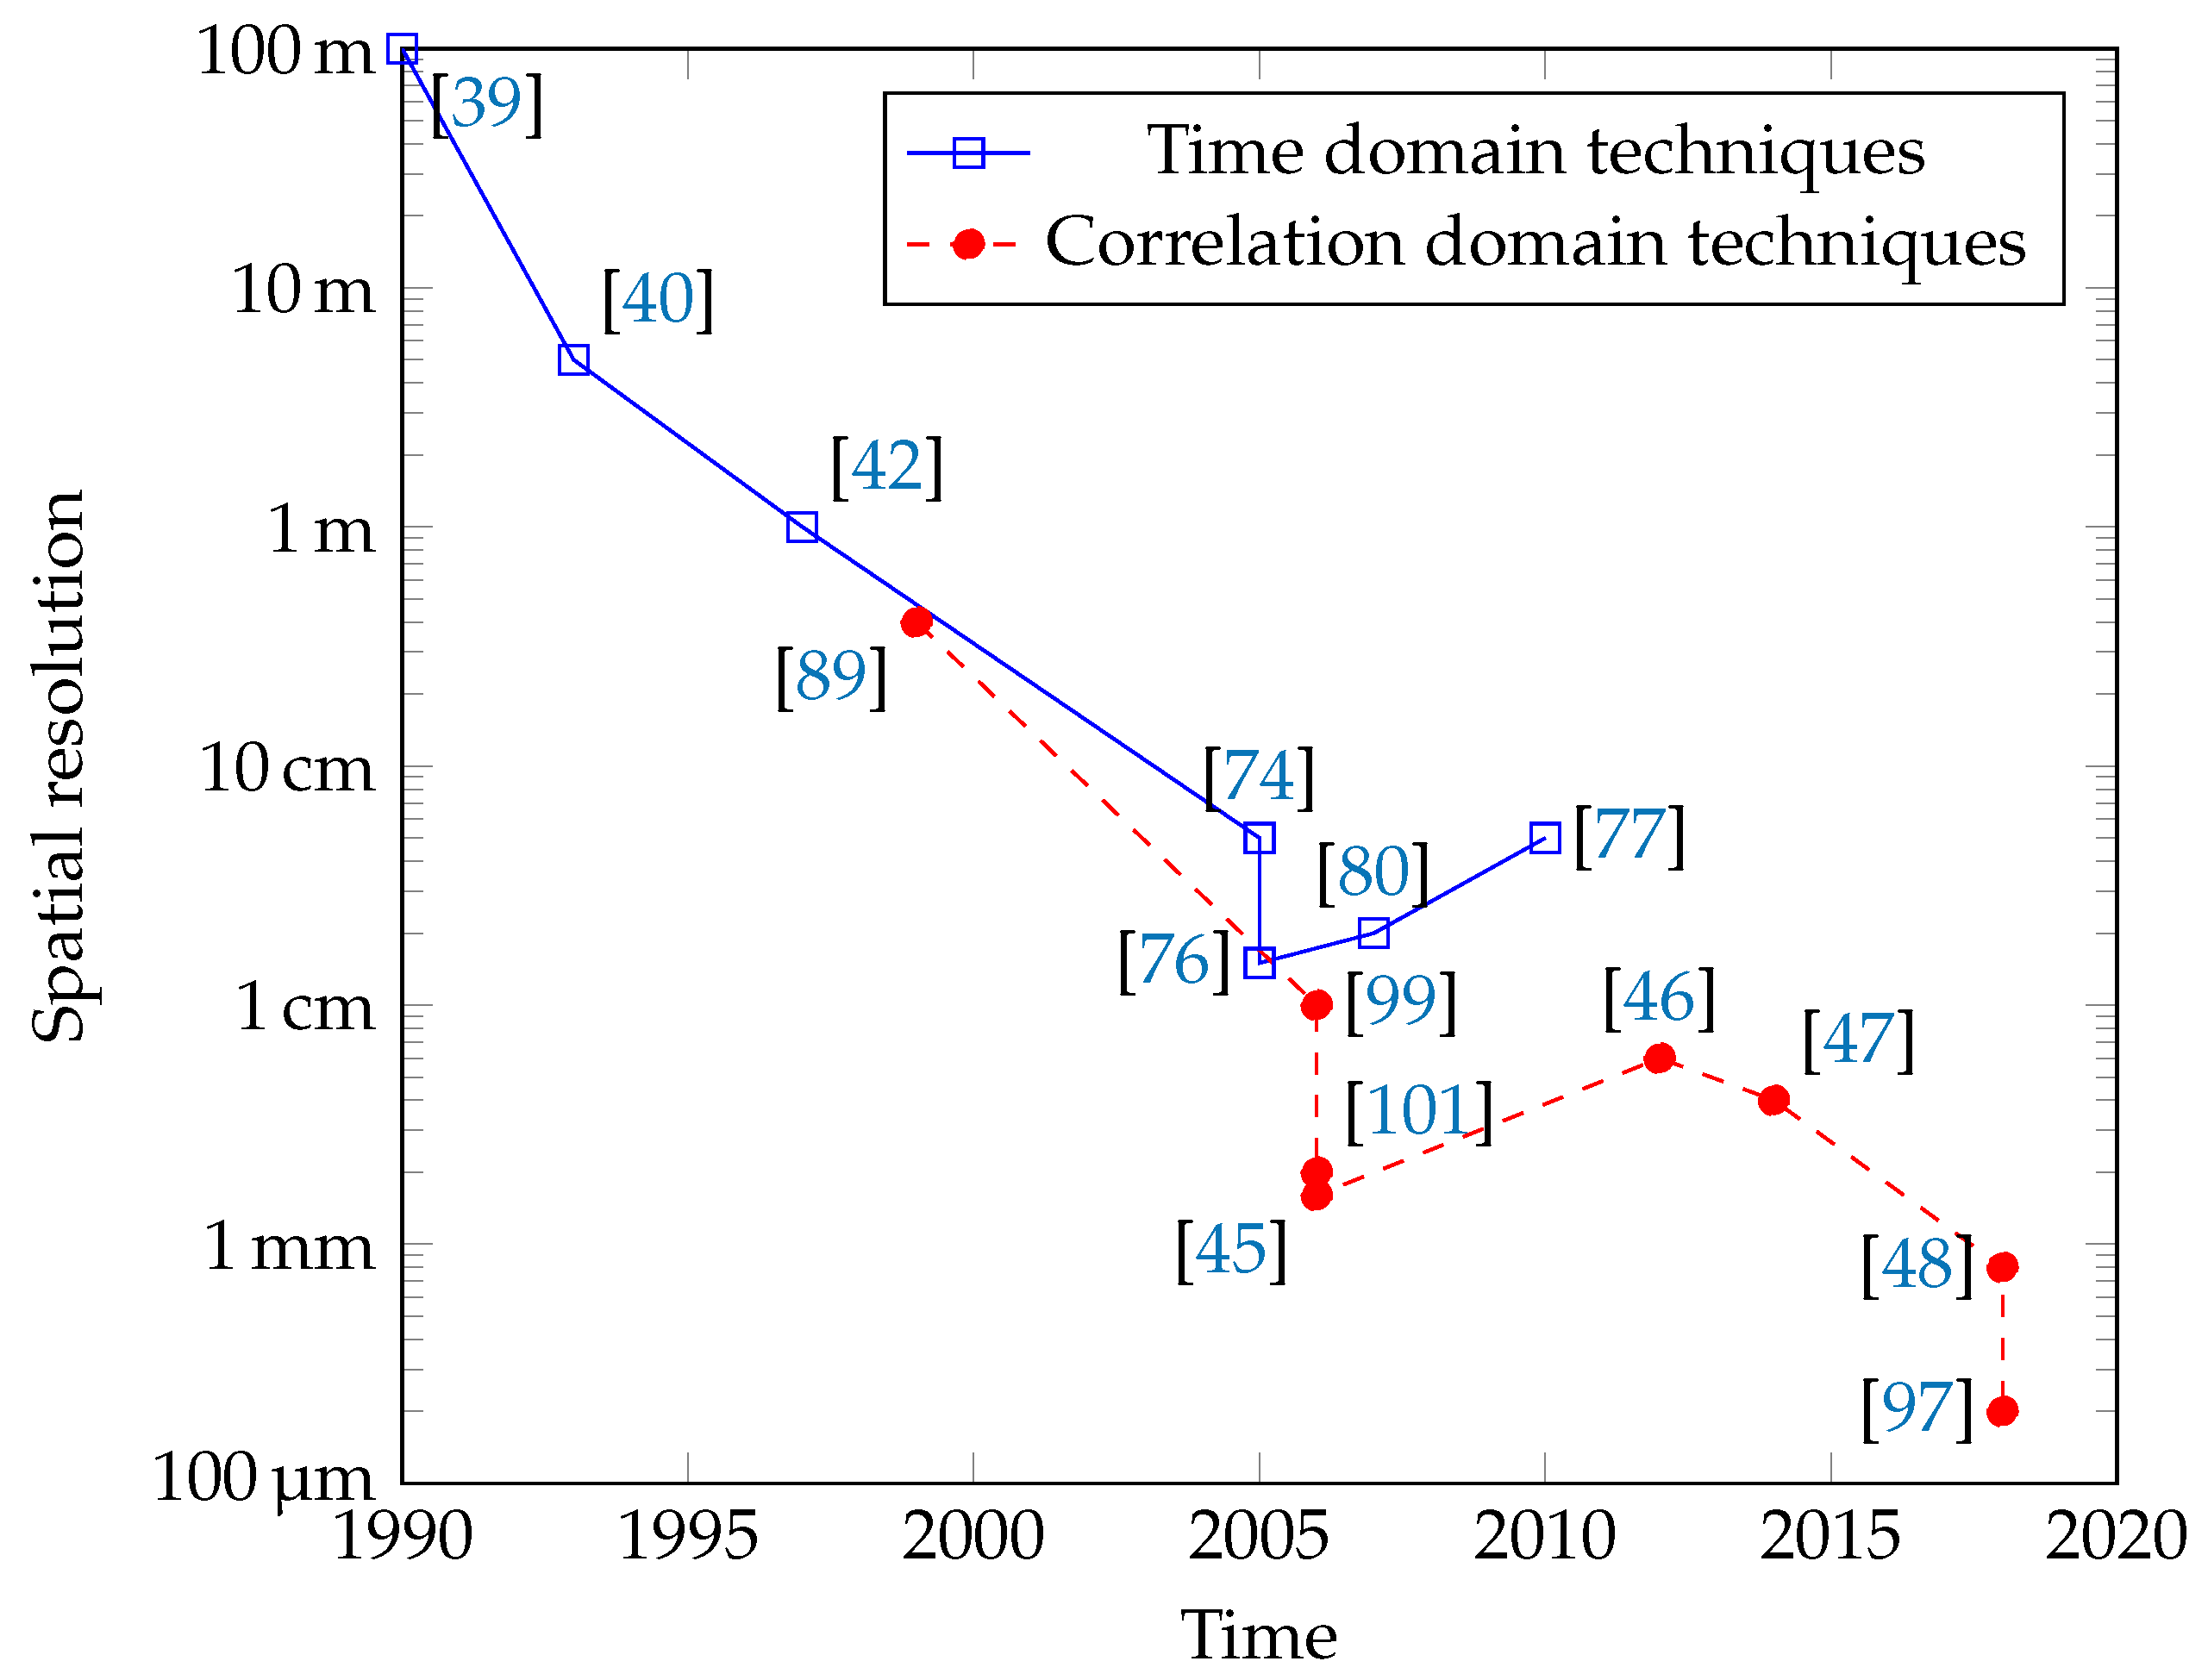
Figure 3.
Schematic of various sources for BOCDA measurement from the top to the bottom: frequency-modulated laser source with a modulation amplitude of [43], random phase coded laser source [44] (Copyright ©2012 WILEY-VCH Verlag GmbH & Co. KGaA, Weinheim), amplified spontaneous emission (ASE) source with spectral width of [47,48] (adapted from [48] under a Creative Commons Attribution 4.0 International Public License), and a random laser based on a distributed feedback laser diode in an external feedback cavity [91] with a spectral width of (adapted with permission from [91], OSA.).

Figure 4.
BOCDA techniques based on (a) frequency modulation [43] (reprinted with permission from [43], Copyright ©2012 IEICE, Permission No. 18RA0091), (b) phase-coding [44] (reprinted from [44], Copyright ©2012 WILEY-VCH Verlag GmbH & Co. KGaA, Weinheim), and (c) ASE [48] (reprinted from [48] under a Creative Commons Attribution 4.0 International Public License.

Figure 5.
Comparison of the Brillouin spectrum in a large core diameter photonic crystal fibre (PCF) and a small core diameter PCF [102]. Reprinted with permission from Springer Nature: Nature, Nat. Phys., [102], Copyright 2006. BFS, Brillouin frequency shift.
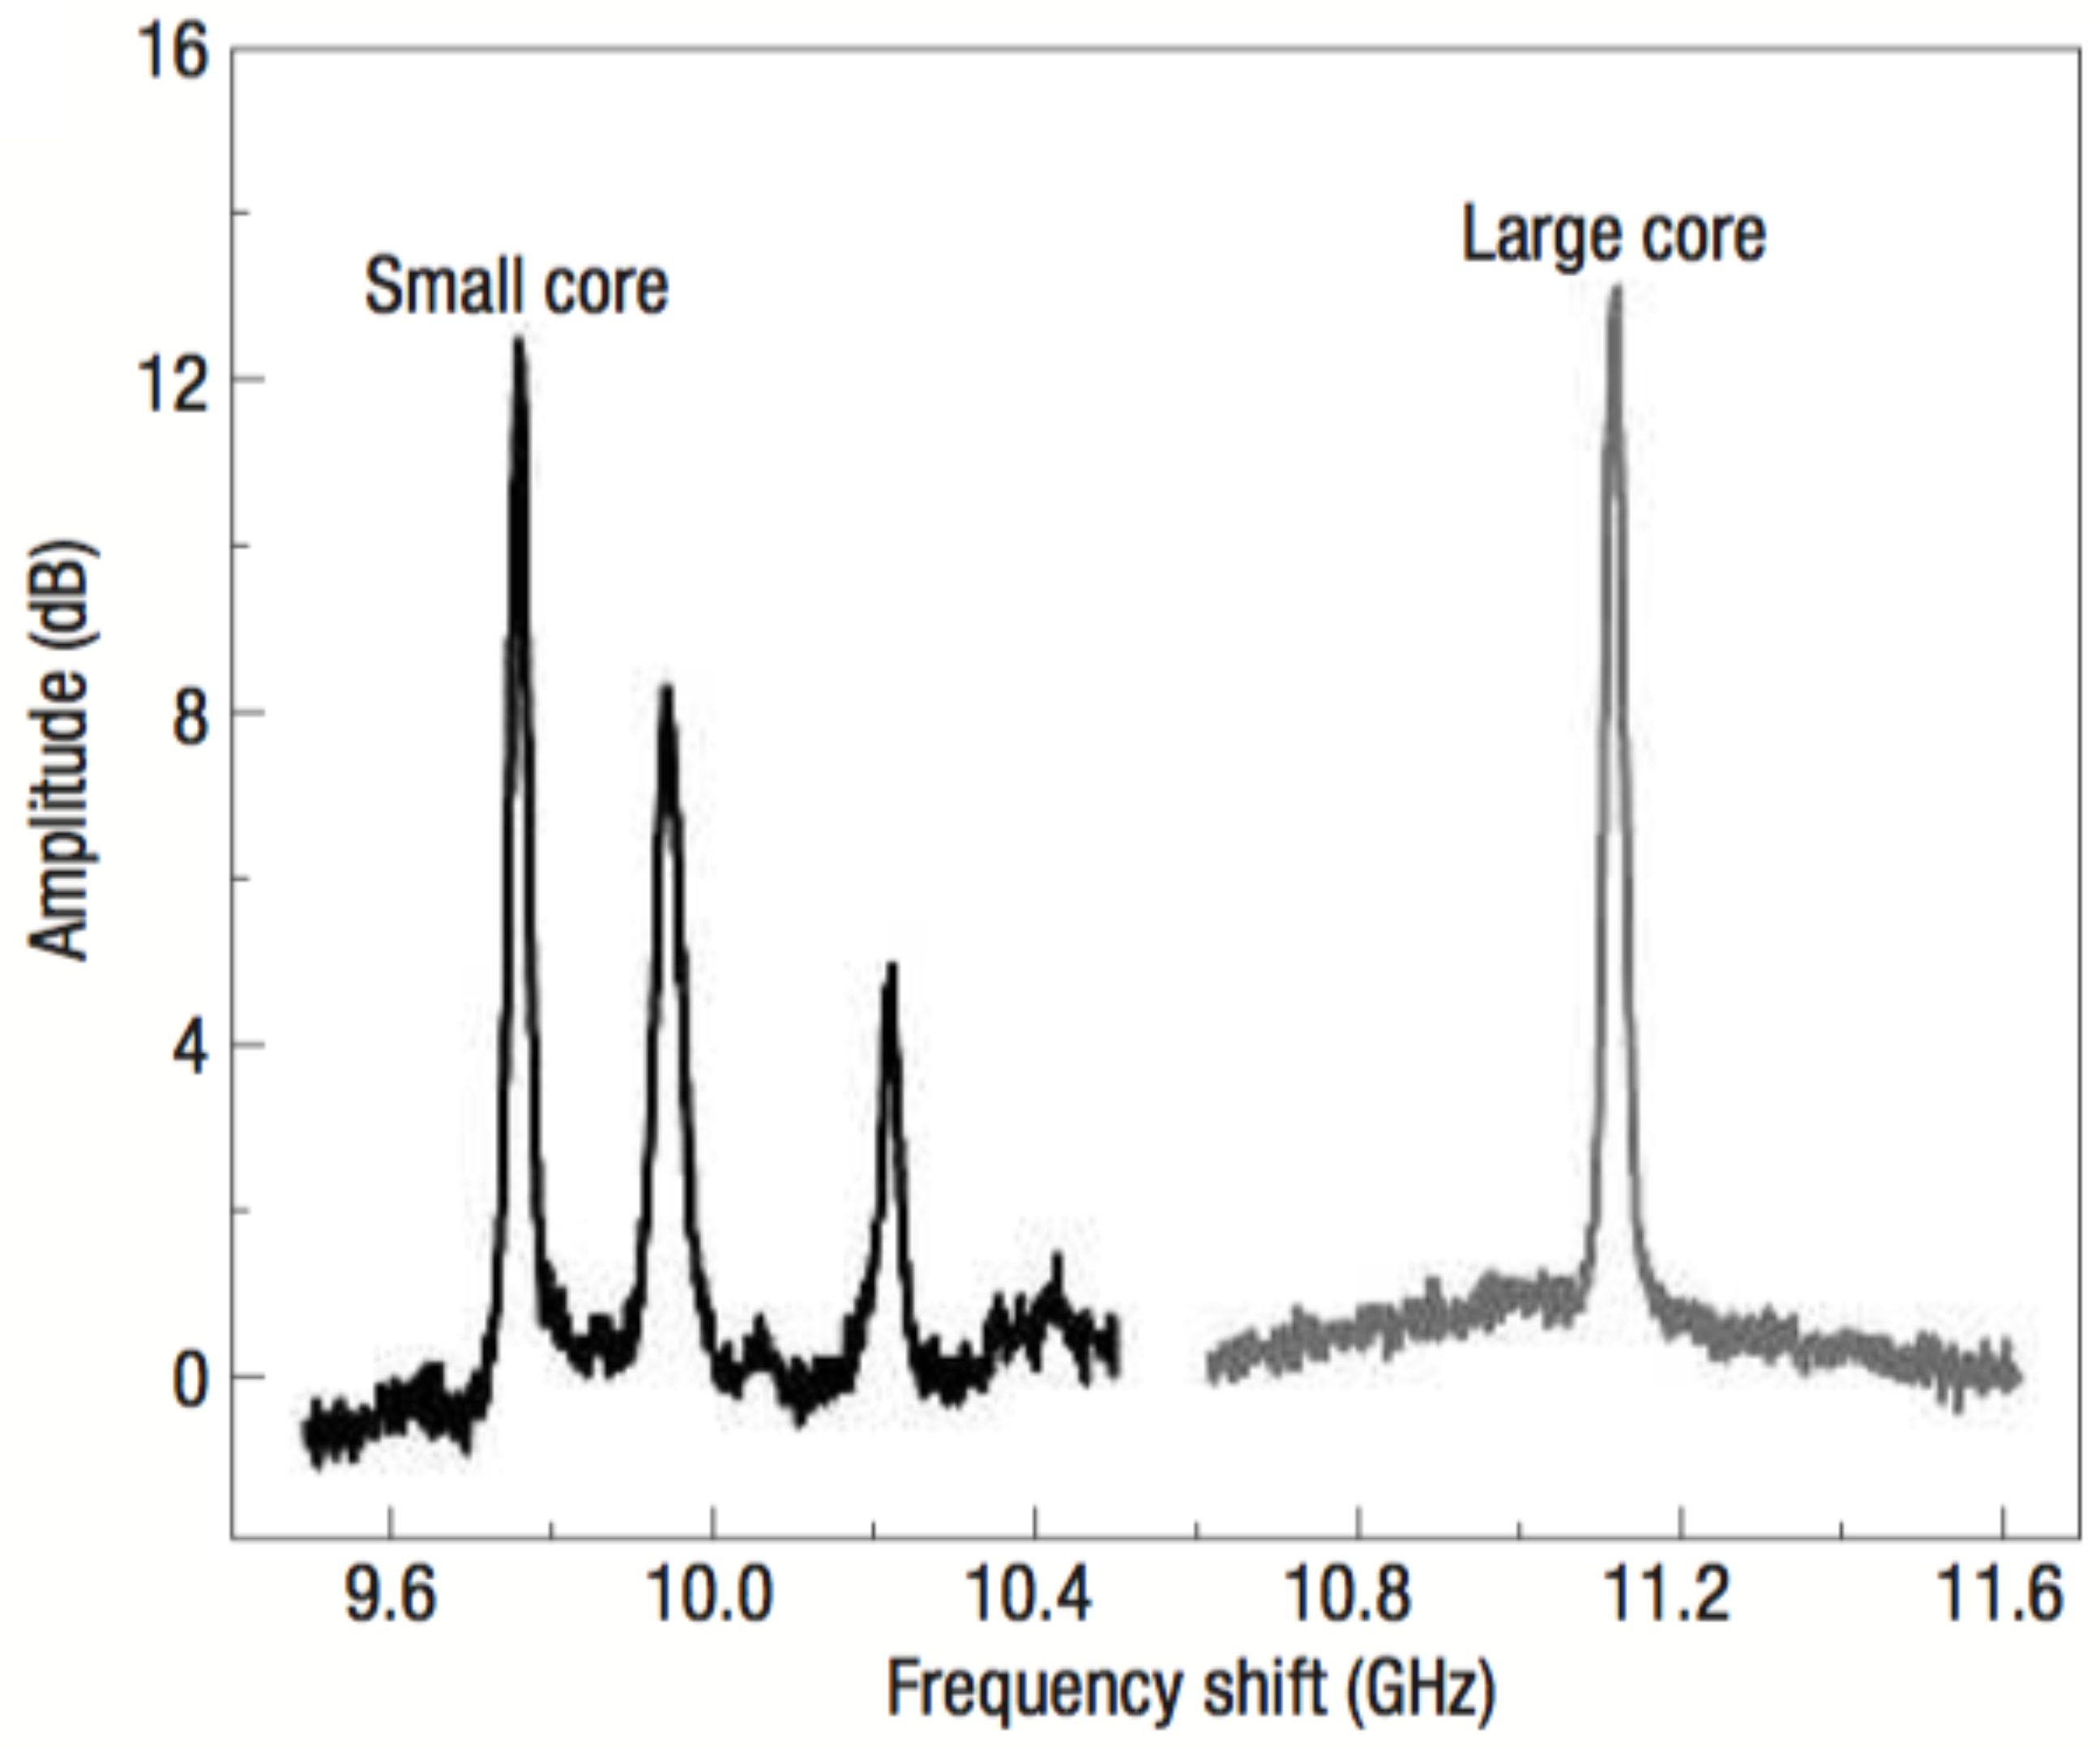
Figure 6.
Spectrum of surface acoustic wave (SAW) in (a) a microfibre [11] (reprinted from [11] and licensed under a Creative Commons Attribution-NonCommercial-ShareAlike 4.0 International License) and (b) two PCFs with different core diameters [12] (reprinted with permission from [12], OSA).
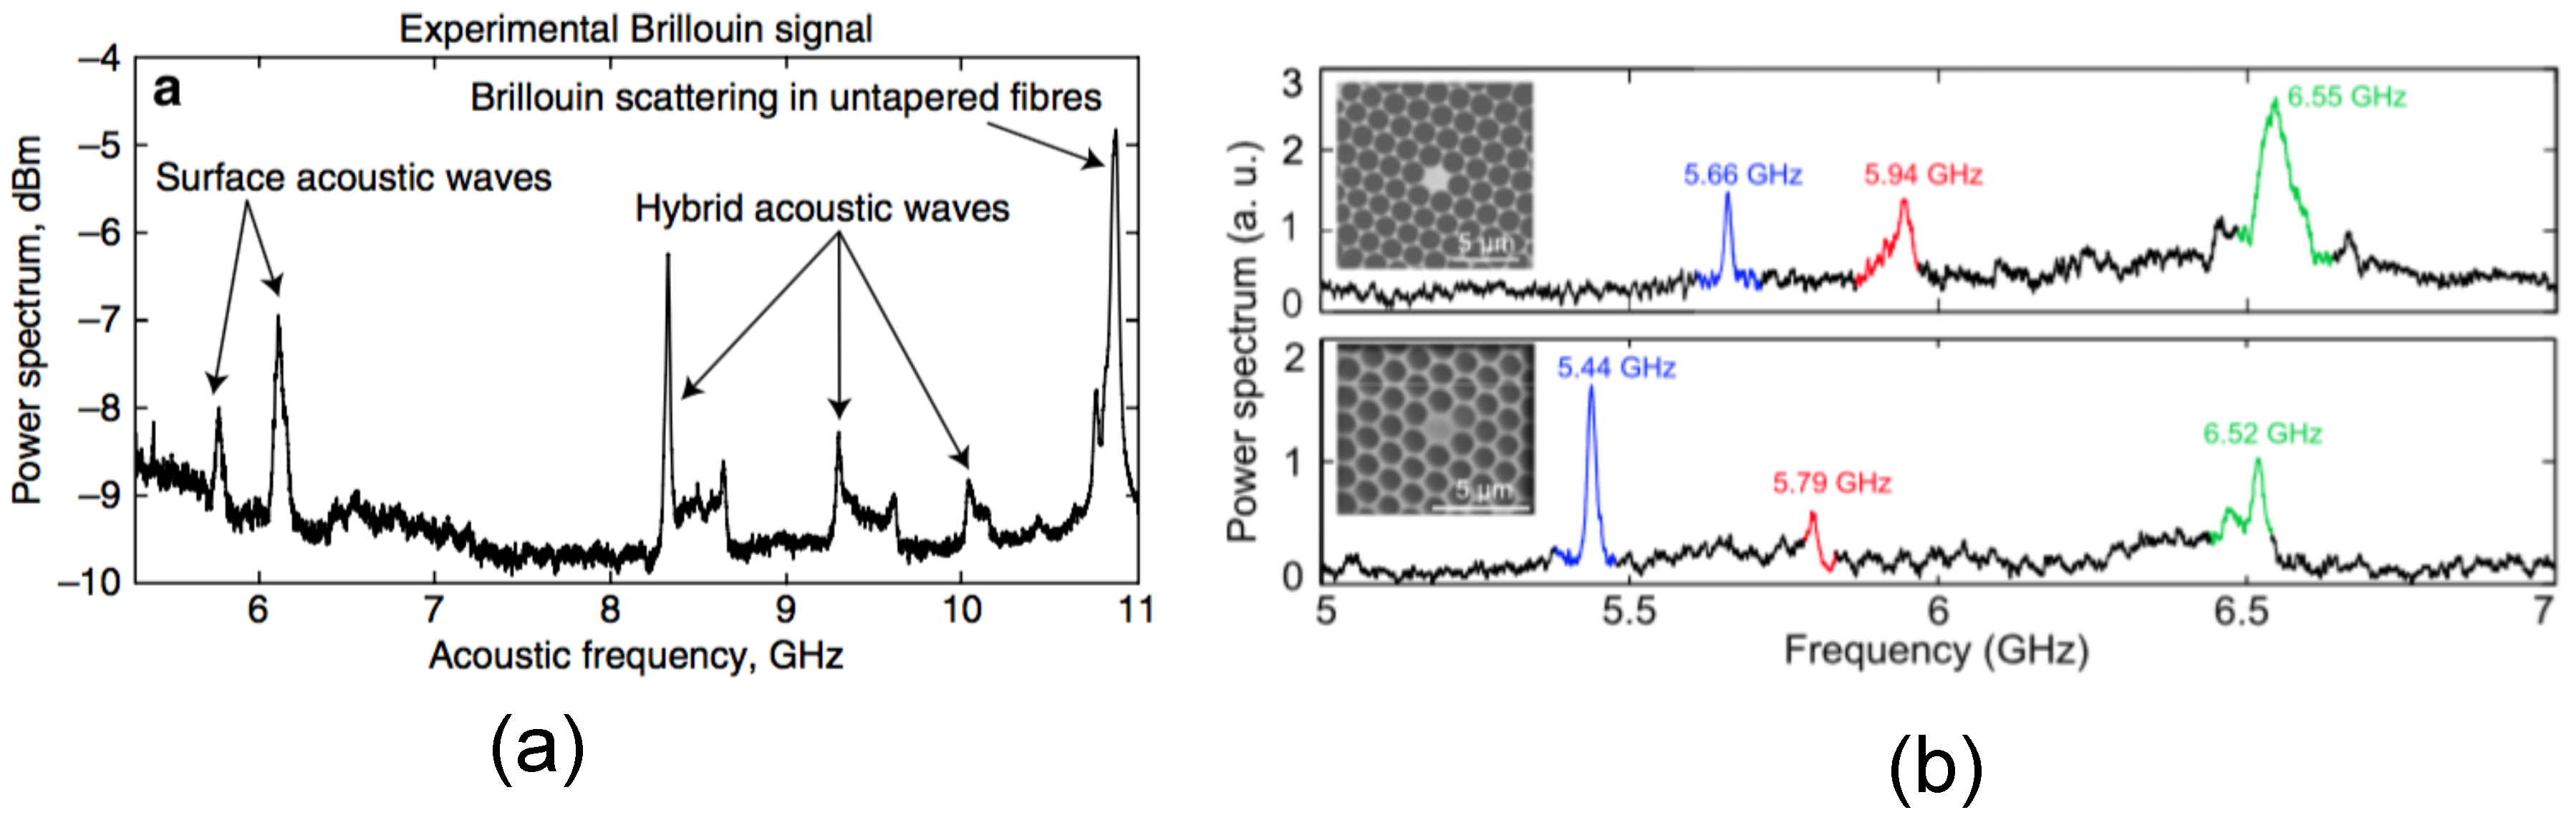
Figure 7.
Mapping of the experimental surface Brillouin spectrum with the numerically-calculated responses to detect the core diameter of the microfibre under fabrication [103]. Reprinted with permission from [103], OSA.
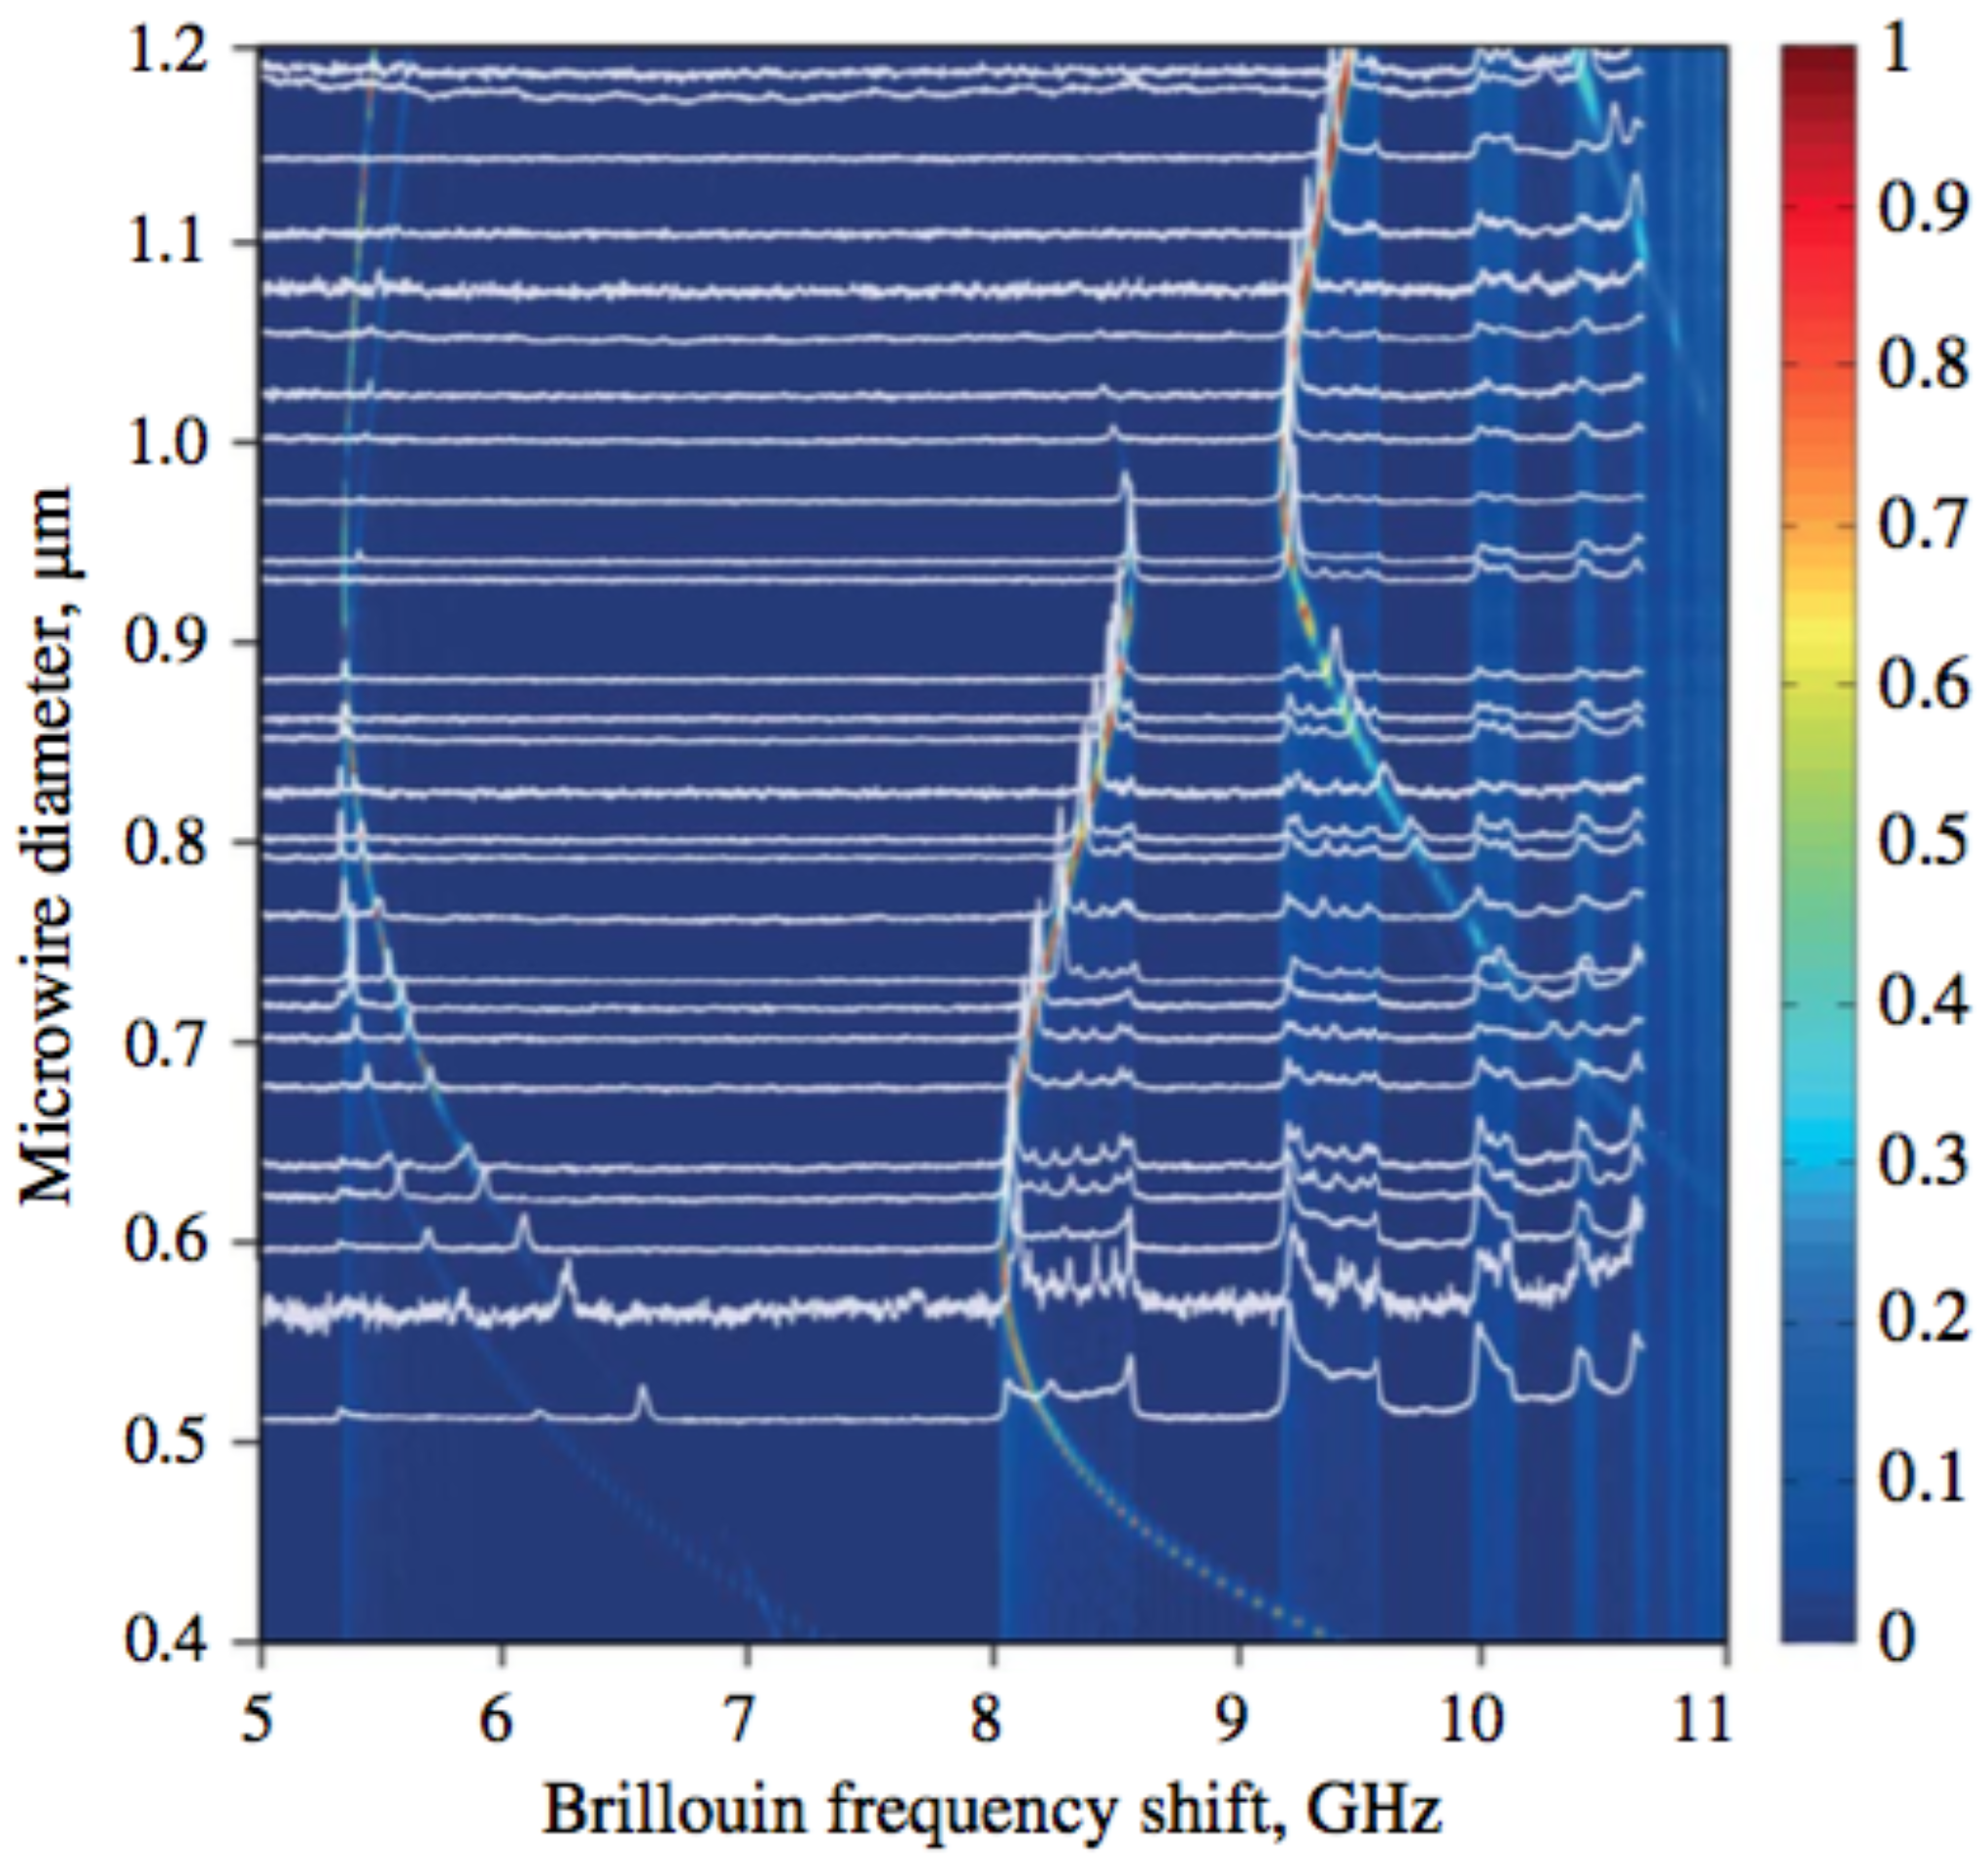
Figure 8.
Finite element model (FEM)-based numerical simulation of (a) the elasto-optic coefficient of the PCF under test (reprinted with permission from [36], OSA) and (b) the elasto-optic coefficient of the perfect PCF [36] (reprinted with permission from [36], OSA).

Figure 9.
Longitudinal map of (a) a PCF using Brillouin echo distributed sensing (BEDS) techniques with a spatial resolution of 30 cm [38] (reprinted with permission from [38], OSA) and (b) a microfibre based on phase-coded BOCDA [100] (reprinted with permission from [100], OSA).

Figure 10.
Brillouin spectrum of the tapered fibre using phase-coded BOCDA measurement at different frequency ranges (a–f) [50] (reprinted with permission from [50], OSA).

Figure 11.
Mapping of (a) a silica planar waveguide with a spatial resolution of 5.9 mm using frequency-modulated BOCDA [46] (reprinted with permission from [46], SPIE) and (b) a chalcogenide photonic waveguide with a spatial resolution of 2.5 mm using ASE-based BOCDA measurement [48] (reprinted from [48] under a Creative Commons Attribution 4.0 International Public License).

Figure 12.
Detection of a 2-mm feature size in a silicon-chalcogenide platform [49] (reprinted from [49] with permission from OSA).
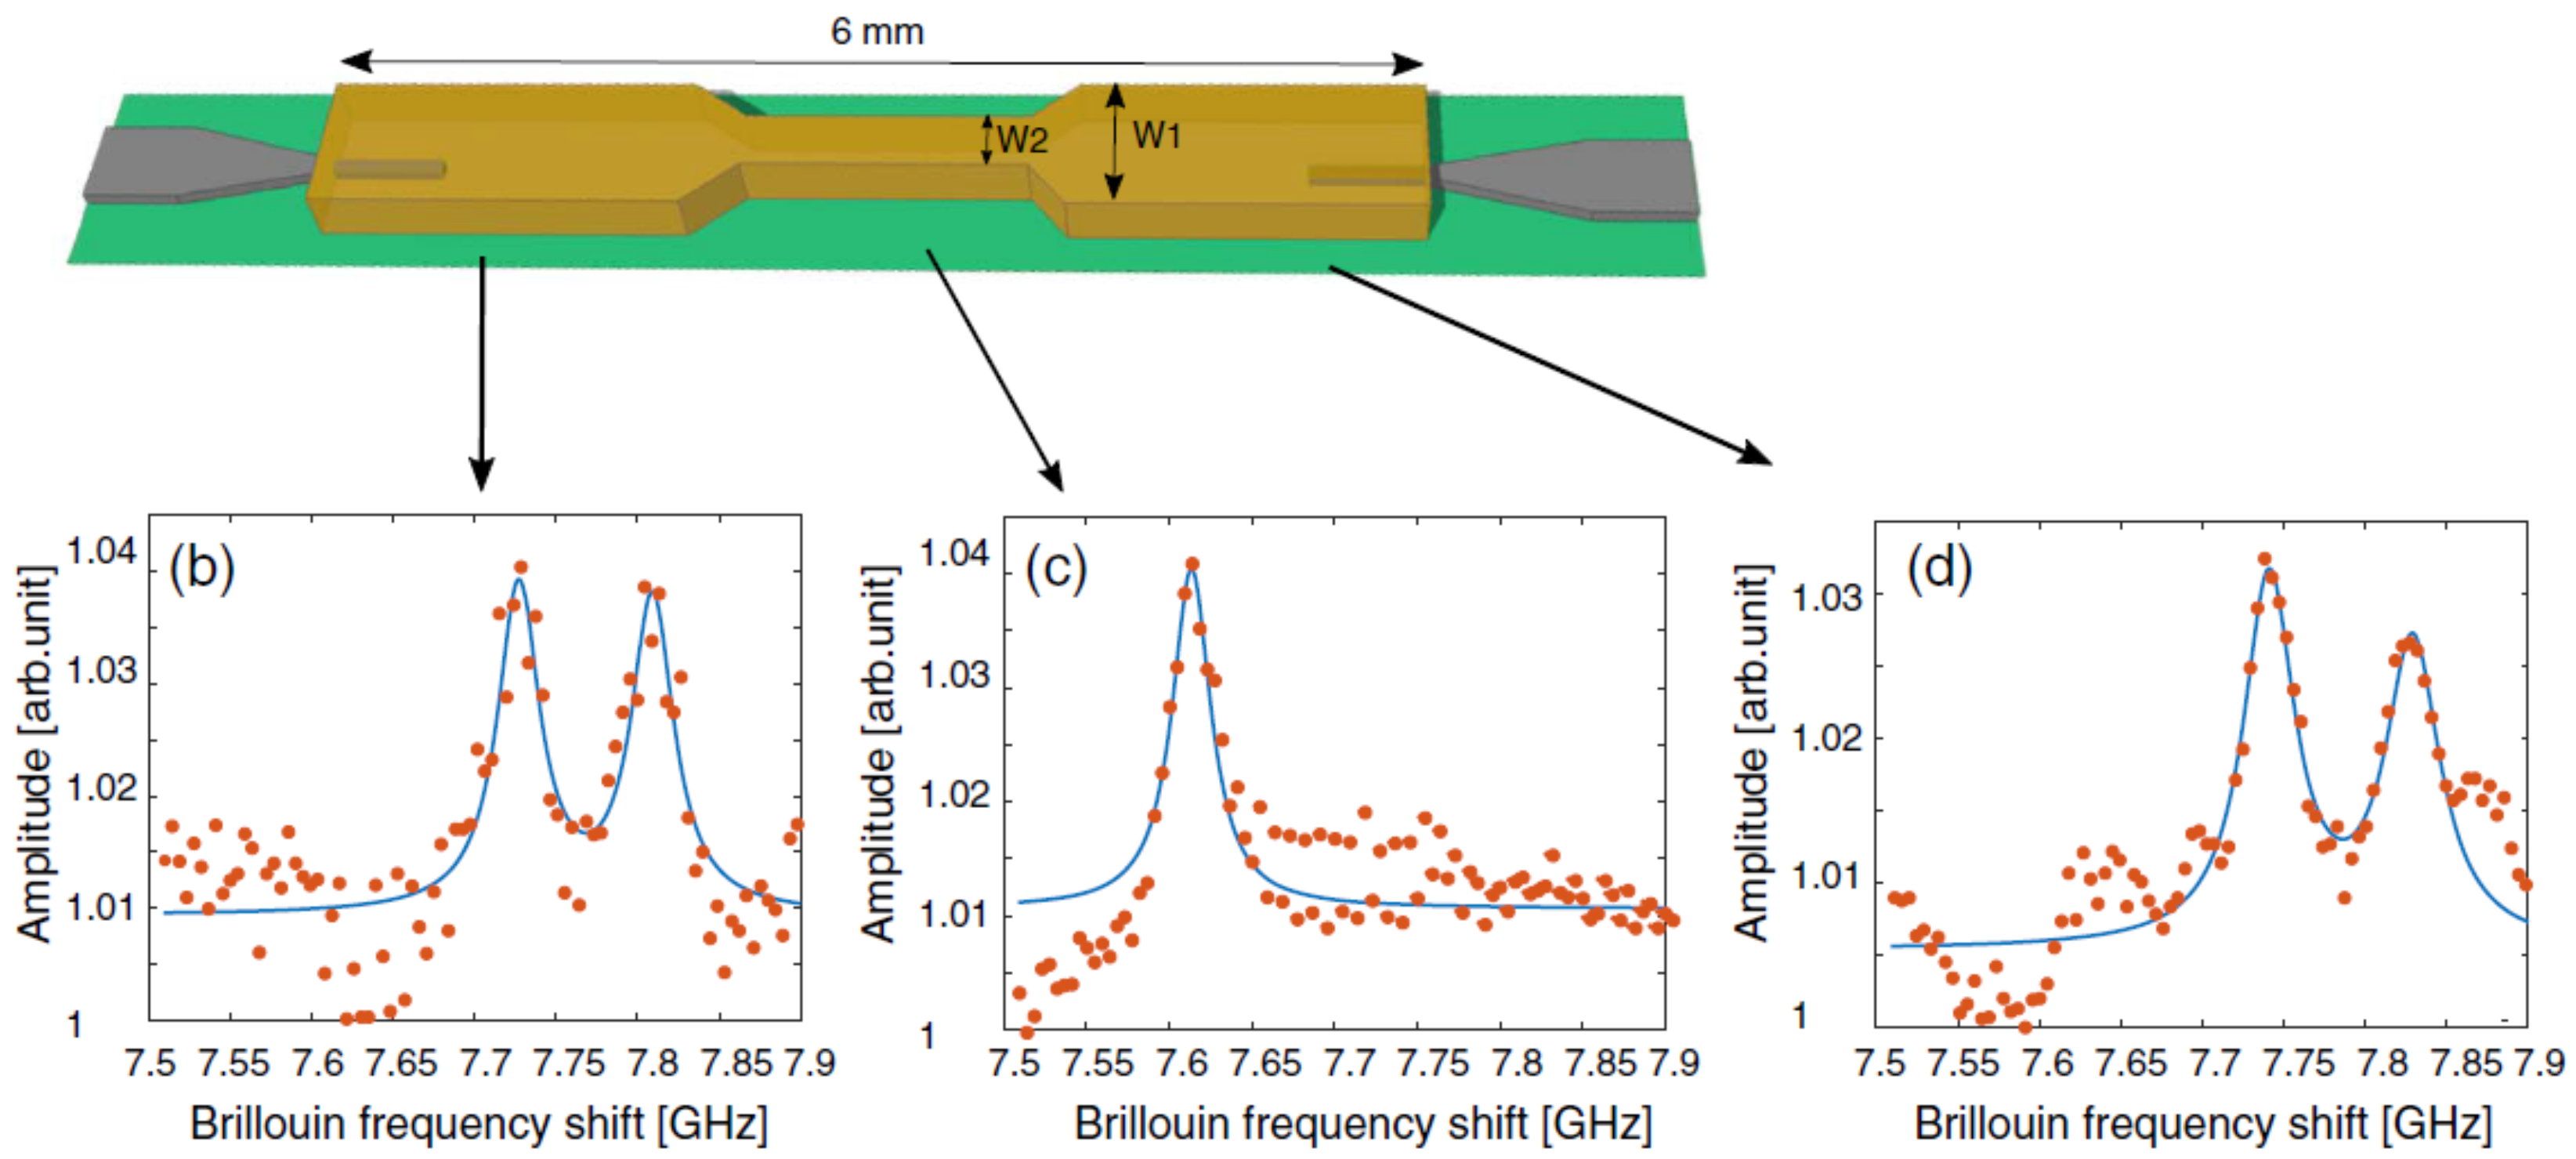
Figure 13.
Detection of a (a) 1-mm, (b) 500-m, and (c) 200-m longitudinal feature in silicon- chalcogenide waveguides [97].
Figure 13.
Detection of a (a) 1-mm, (b) 500-m, and (c) 200-m longitudinal feature in silicon- chalcogenide waveguides [97].

Table 1.
Spatial resolution achievements in BOCDA techniques with a focus on mm- and sub-mm- scale resolutions.
Table 1.
Spatial resolution achievements in BOCDA techniques with a focus on mm- and sub-mm- scale resolutions.
| Spatial Resolution | Technique | Ref. | Platform |
|---|---|---|---|
| 40 cm | FM | [89] | optical fibre |
| 10 cm | FM | [98] | optical fibre |
| 5 cm | Random laser | [90] | optical fibre |
| 3 cm | Random-phase code | [50] | microwire |
| 1 cm | FM | [99] | optical fibre |
| 1 cm | Random-phase code | [44,100] | optical fibre, microwire |
| 6 mm | FM | [46] | silica planar waveguide |
| 4 mm | ASE | [47] | optical fibre |
| 2 mm | FM | [101] | optical fibre |
| 1.6 mm | FM | [45] | optical fibre |
| 800 | ASE | [48] | on-chip waveguide |
| 200 * | ASE | [97] | on-chip waveguide |
* This value reflects the experimental detection capability and not the spatial resolution.
© 2018 by the authors. Licensee MDPI, Basel, Switzerland. This article is an open access article distributed under the terms and conditions of the Creative Commons Attribution (CC BY) license (http://creativecommons.org/licenses/by/4.0/).
Share and Cite
MDPI and ACS Style
Zarifi, A.; Stiller, B.; Merklein, M.; Eggleton, B.J. High Resolution Brillouin Sensing of Micro-Scale Structures. Appl. Sci. 2018, 8, 2572. https://doi.org/10.3390/app8122572
AMA Style
Zarifi A, Stiller B, Merklein M, Eggleton BJ. High Resolution Brillouin Sensing of Micro-Scale Structures. Applied Sciences. 2018; 8(12):2572. https://doi.org/10.3390/app8122572
Chicago/Turabian StyleZarifi, Atiyeh, Birgit Stiller, Moritz Merklein, and Benjamin J. Eggleton. 2018. "High Resolution Brillouin Sensing of Micro-Scale Structures" Applied Sciences 8, no. 12: 2572. https://doi.org/10.3390/app8122572
Note that from the first issue of 2016, this journal uses article numbers instead of page numbers. See further details here.