Article

Fiber Optic Sensing for Geomechanical Monitoring: (1)-Distributed Strain Measurements of Two Sandstones under Hydrostatic Confining and Pore Pressure Conditions

1
Geological Carbon Dioxide Storage Technology Research Association, 9-2 Kizugawadai, Kizugawa-shi, Kyoto 619-0292, Japan
2
Research Institute of Innovative Technology for the Earth, 9-2 Kizugawadai, Kizugawa-shi, Kyoto 619-0292, Japan
3
Department of Earth Science and Engineering, Royal School of Mines, Imperial College London, London SW7 2AZ, UK
4
Neubrex Co., Ltd. Sakaemachidori 1-1-24, Chuo-ku, Kobe, Hyogo 650-0023, Japan
*
Author to whom correspondence should be addressed.
Appl. Sci. 2018, 8(11), 2103; https://doi.org/10.3390/app8112103
Submission received: 5 October 2018 / Revised: 28 October 2018 / Accepted: 28 October 2018 / Published: 1 November 2018
(This article belongs to the Special Issue Optical Correlation-domain Distributed Fiber Sensors)

Abstract

:

Featured Application

Fiber optic distributed strain sensing has high potential to interpret uplift or subsidence of ground surface due to pressure change in subsurface at CO2 storage and oil/gas fields.

Abstract

In this study distributed optic fiber has been used to measure both the Rayleigh and Brillouin frequency shift of two different sandstone core samples under controlled hydrostatic confining and pore pressure in the laboratory. The Berea sandstone core is relatively homogeneous, whereas the Tako sandstone core is visibly heterogeneous with a coarse-grain and a fine-grain region. Rayleigh frequency has been found to have a superior performance over Brillouin frequency in terms of better consistency (less scattering) in the tests carried out. The strain gauge readings reveal considerable anisotropy in the stiffness of the Berea core between perpendicular (vertical) and parallel to the bedding (hoop) directions. The strains converted from Rayleigh frequency shift measurements agree reasonably well with readings by one of the four hoop strain gauge channels under increasing confining/pore pressure. For the Tako sandstone core, the contrast in the grain-size, and thus rock elastic properties, is clearly reflected in the hoop strain measurement by both strain gauges and distributed optic fiber. The outcomes of the test have demonstrated successfully the use of a single optic fiber for measuring rock strain response at different regions of a heterogeneous core sample along a continuous trajectory.

Graphical Abstract

1. Introduction

Interferometric Synthetic Aperture Radar (InSAR) is a geodetic technique that can identify subsidence and uplift induced by anthropogenic activities such as subsurface fluid extraction, or injection into reservoir formations. This technique has been widely used at CO2 injection sites since the first application at the In Salah CO2 storage project in central Algeria [1,2,3]. CO2 injection may cause pressure buildup, depending reservoir property such as porosity and permeability, or CO2 injection rate and volume. Uplift is caused by the migration to the ground surface of the expansion of the target formation due to pressure buildup. From a geomechanical point of view, challenges remain in relating uplift at ground surface to pressure buildup in deep formation. We propose the distributed optical fiber sensing technology to monitor the deformation profile along the wellbore during CO2 injection.
Fiber optics sensing (FOS) systems consist of a laser, optical fiber, sensing element, and detector. Optical fiber is composed of three parts: a core generally made of glass, cladding, and coating. It can be used as a sensor if properties of propagating light wave, such as intensity, phase, polarization, and frequency, are appropriately modulated to the environment parameter of interest. Light from a laser is sent through an optical fiber, which acts as an optical waveguide. The modulated light wave then travels back to the detector. FOS systems used as sensors have such advantages as being passive, immune to electromagnetic interference, working well in harsh environment, resistant to high temperature, and easily embedded or attached due to its small size.
A variety of sensing technologies has been developed over the years, including distributed sensors which are capable of measuring strain and/or temperature changes along the entire fiber based on Rayleigh, Raman, and Brillouin backscattering techniques [4,5,6,7,8,9,10]. The Raman scattering is widely used in Distributed Temperature Sensing (DTS) application. On the other hand, the Brillouin and Rayleigh backscattering phenomena are sensitive to both temperature and strain. Brillouin scattered light is generated by acoustic vibration of glass molecules. When light enters the optical fiber, a weak acoustic lattice vibration (acoustic phonon) is generated due to the thermal oscillation of the material silicon dioxide. The interaction between this acoustic lattice vibration (acoustic phonon) and incident light produces backscattering of the light, which is down-shifted in frequency due to the Doppler effect. The resulting frequency shift is proportional to changes in local temperature and strain at a measurement point of the optical fiber. Here a measurement point refers to the place where backscattered light is generated.
The Brillouin scattering can be spontaneous or stimulated. The former is referred to as Brillouin time domain reflectometry (BOTDR), while the latter as Brillouin time domain analysis (BOTDA). Figure 1 presents a typical scheme of BOTDA system. In comparison to BOTDR systems, BOTDA systems in general have higher spatial resolutions and better accuracy. However, they require double-end access (closed fiber loop) because the light is injected from both ends, as opposed to BOTDR systems where light is injected from one end only. The standard implementations of BOTDR and BOTDA are limited to the 1-m spatial resolution. The technologies of the pulse-pre-pump (PPP) BOTDA [11] and Synthetic-BOTDR [12] have reduced the spatial resolutions to 2 cm and 10 cm, respectively.
Rayleigh scattered light is generated due to fluctuation in the refractive index of the glass material (random change in glass density) when light is incident on the optical fiber. The scattered light itself does not involve a frequency change. The time change of the Rayleigh scattered light intensity obtained at the incident end by sending the coherent laser light pulse is a waveform (referred to as a time-intensity waveform) in which the interference effect between the scattered lights is conspicuous. Rayleigh scattered light changes its time-intensity waveform as the environment (strain or temperature) around the optical fiber changes. The resulting shift in the frequency of the incident light, which reflects the magnitude of the environmental change, may be determined by recovering the same time-intensity waveform prior to the environmental change. Meanwhile, the location at which the scattered light is generated can be found from the arrival time of the scattered wave. In this way, the magnitude of environmental change at any location may be evaluated.
The optical frequency domain reflectometry (OFDR) is the first attempt to utilize the principle of Rayleigh backscattering in optical fibers for strain measurement [6]. The time-domain approach proposed by Koyamada [13] has the important advantages of long distance and high accuracy. Table 1 summarizes and compares the key parameters of Brillouin and Rayleigh-based sensing technologies. It is noted that Rayleigh-based sensing has a much higher resolution than Brillouin-based sensing does.
Rayleigh and Brillouin backscattering techniques have been successfully applied in measuring metallic plate strains [14]. In this study, they are applied to measure frequency shift along the interval of a single optical fiber which is attached to and circles around the peripheral of two different sandstone cylindrical core samples under controlled confining/pore pressure conditions in the laboratory. The frequency shift measurements are then converted to strains using conversion coefficients. The strains thus obtained are compared with those measured by strain gauges attached to the same core samples.

2. Experimental Set Up and Test Procedure

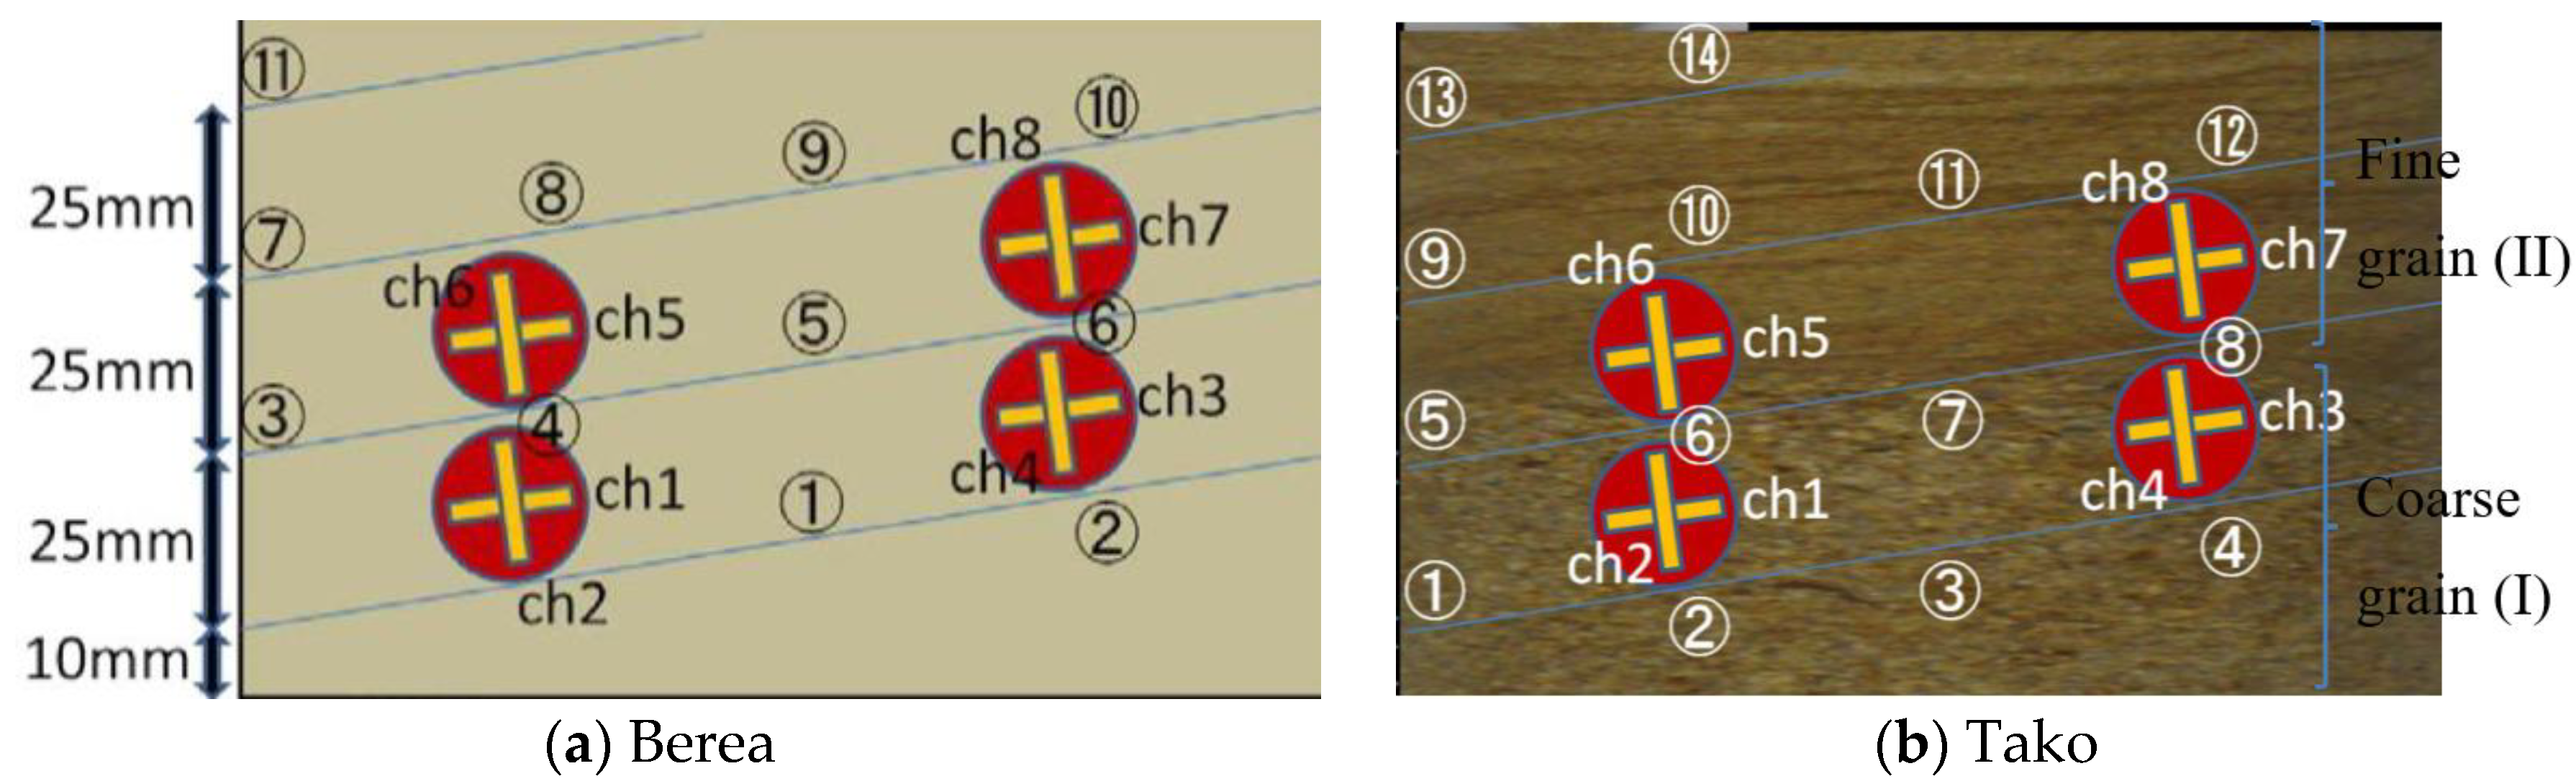
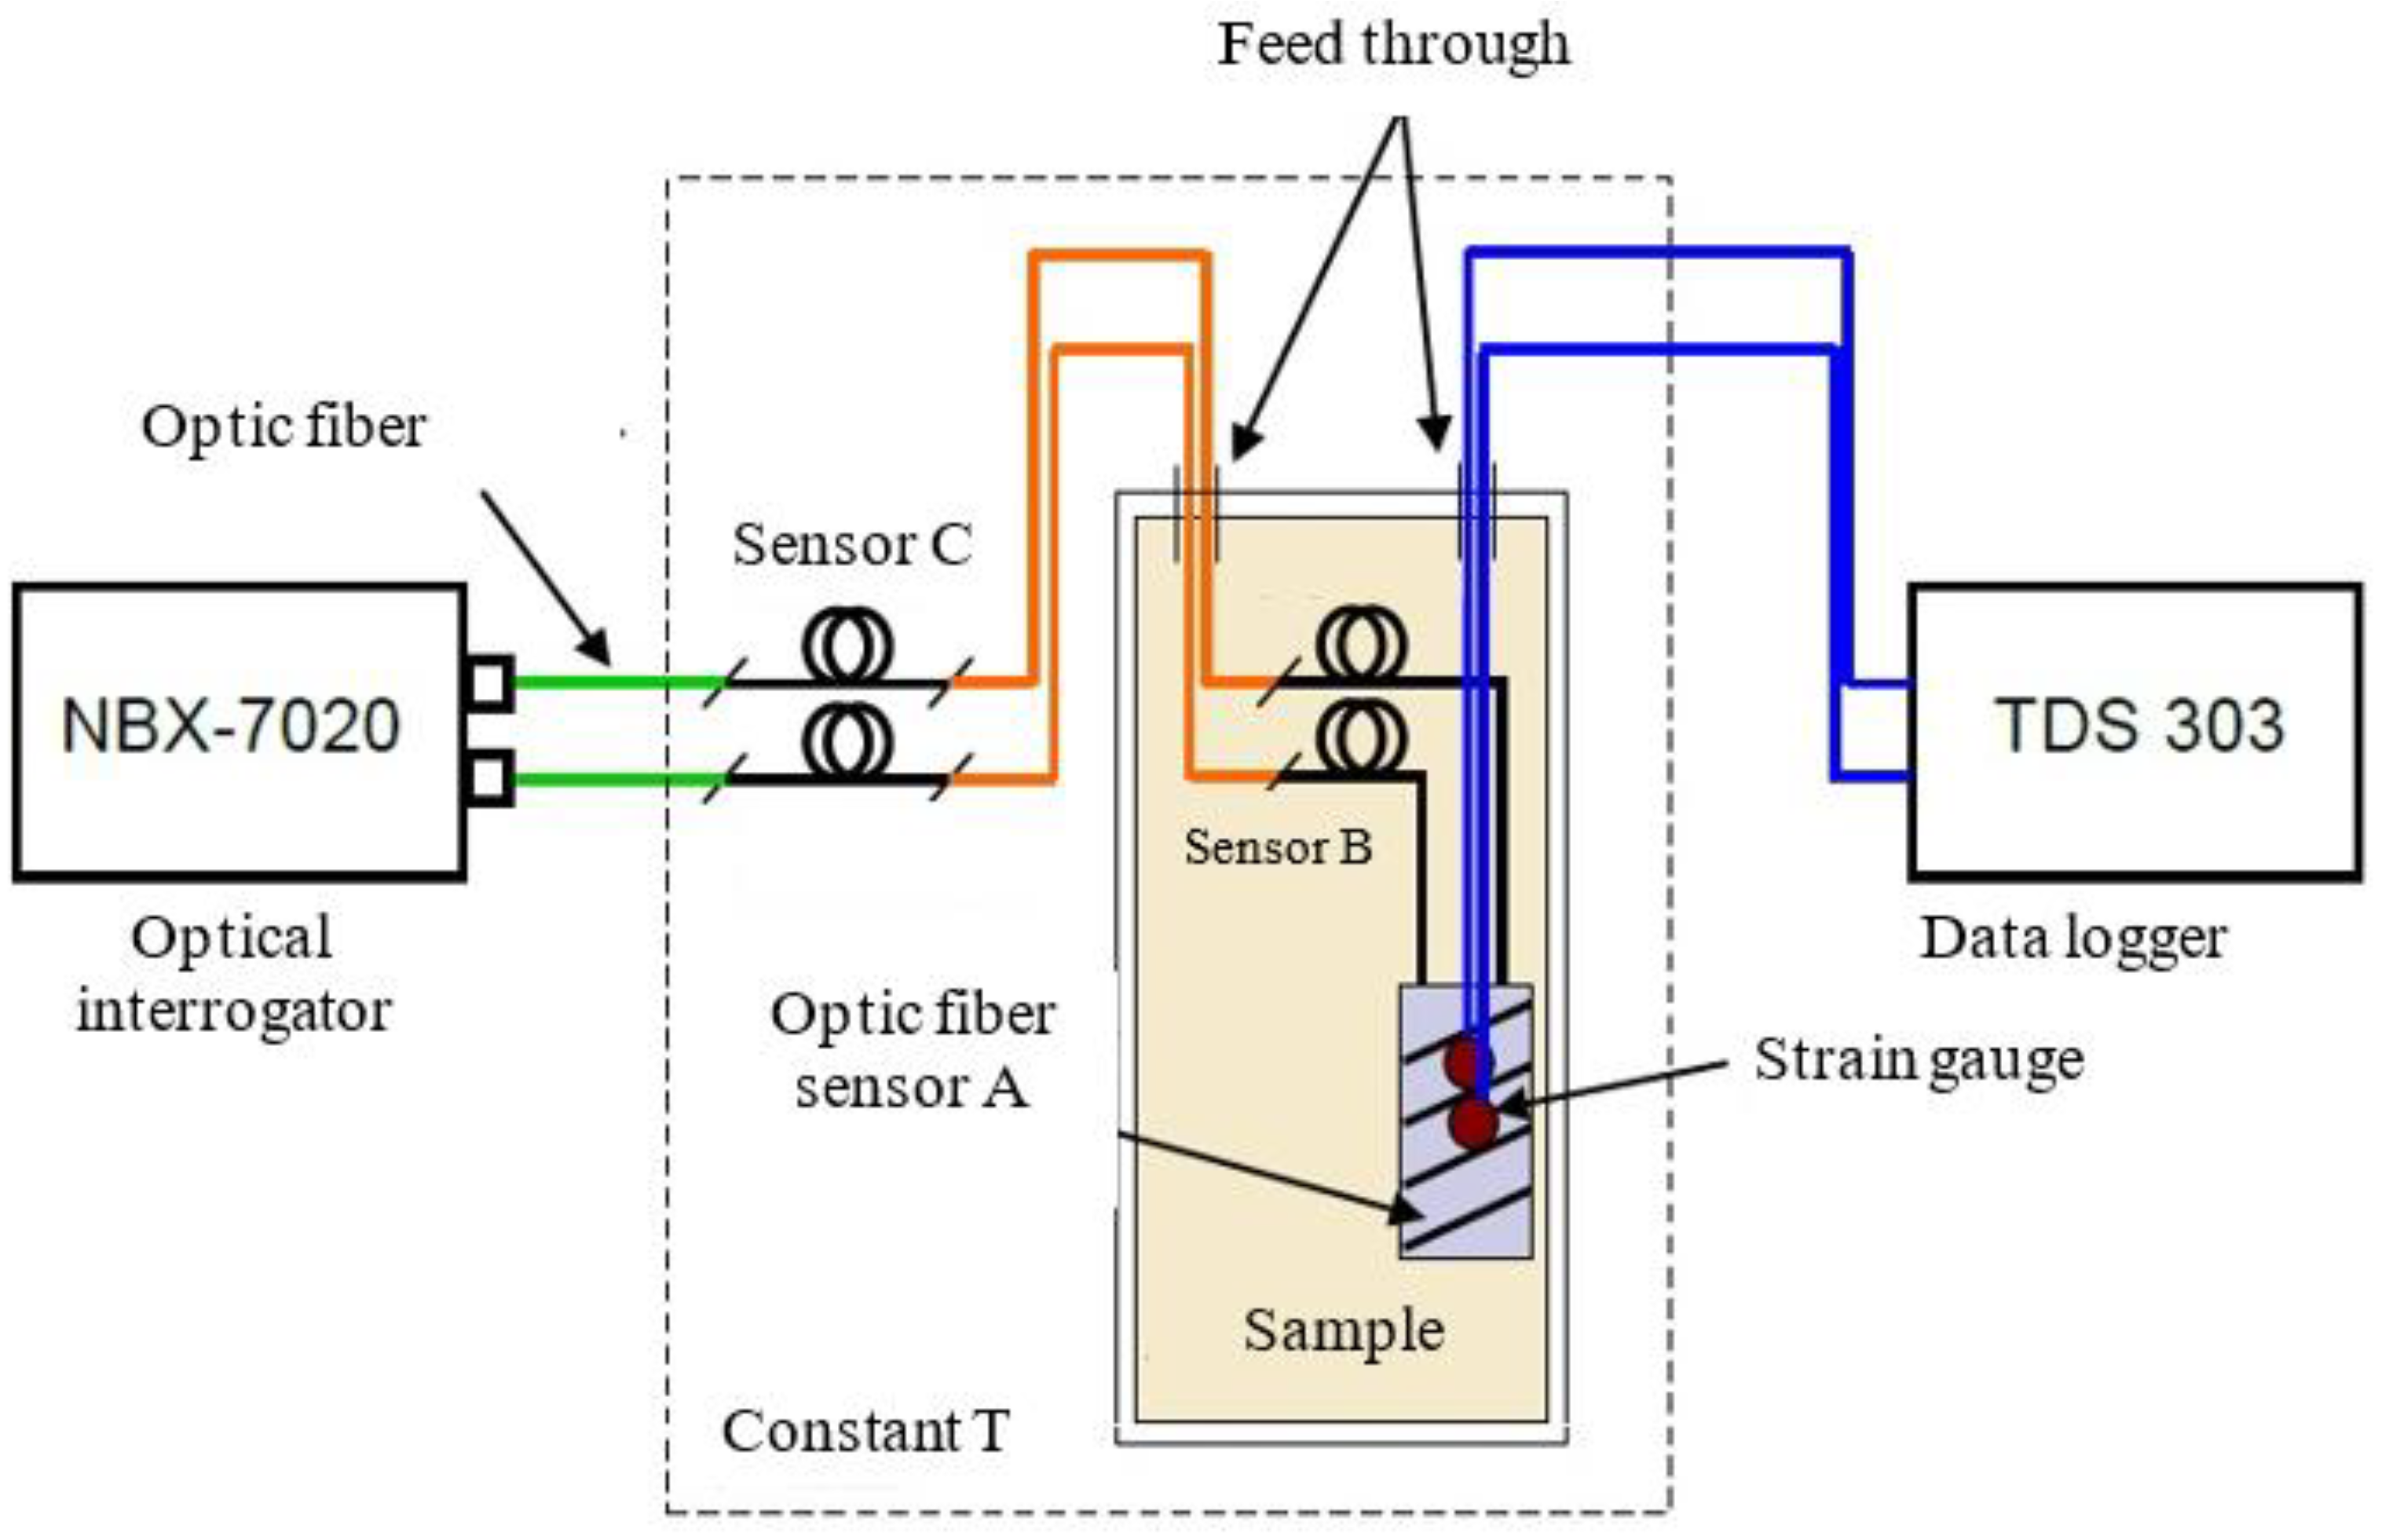
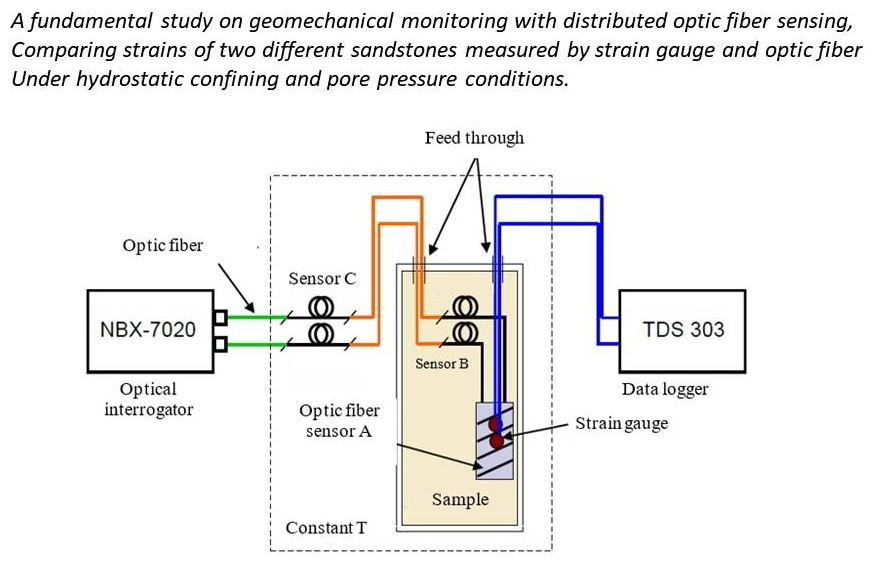
2.1. Experimental Setup

One Berea and one Tako sandstone core samples, both measuring 100 mm in length and 50 mm in diameter, are used for strain measurement. The Berea cylindrical sample is cored perpendicular to the bedding plane. Unlike the Berea core sample which is relatively homogeneous, the Tako sample is composed of a lower coarse-grained layer and an upper fine-grained layer (see Figure S1 in the Supplement). After drying the sample, an optical fiber (single-mode optical fiber element) is attached to peripheral of the sample (using Araldite and curing for 3 h). In addition, four cross-type strain gauges, each with two 1 cm long arms, are also attached to the sample (using Araldite and curing for 12 h), with one of the arms (channels) aligned along the length of the optical fiber. The instrumented sample is coated with silicone rubber to prevent oil in the high-pressure vessel penetrating into the sample during the experiment (see Figure S1 in the Supplement).
Figure 2 presents a schematic showing the position of the four strain gauges attached to the two samples, and in relation to the optic fiber. Each strain gauge has two arms (channels). Channels 1, 3, 5 and 7 (Ch1, Ch3, Ch5 and Ch7) are aligned with the direction of optic fiber, while channels 2, 4, 6 and 8 (Ch2, Ch4, Ch6 and Ch8) are orientated in the near-vertical direction. Also shown are the position of the selected points, 11 for the Berea sample and 14 for the Tako sample, where the frequency shifts are monitored at each confining/pore pressure step. Among the 14 monitoring points for the Tako sample, points 1 to 7 are located in the lower coarse grain region, with the rest (points 8 to 14) in the upper fine grain region. Similarly, the four strain gauges are also split into two groups: Ch 1 to Ch4 in the coarse grain portion, and Ch5 to Ch8 are in the fine grain portion.
Figure 3 shows a schematic diagram of the experimental setup, which features a high-pressure vessel where the instrumented sandstone sample is placed. In addition to being attached to the rock sample (sensor region A), free-standing optic fiber sensors are also employed, inside (sensor region B) as well as outside (sensor region C) the vessel to provide two different baseline readings. All the sensors are enclosed in a container where a constant temperature is maintained. The strain gauges are connected to a data logger, and the strain measurements are recorded on the computer via RS-232C interface. The optical fiber with sub-centimeter bending radius was attached to the measurement sample and then it was connected to the optical interrogator NBX-7020. The frequency shifts measured by NBX-7020 are recorded on another computer.

2.2. Experimental Procedure

The static strain measurements are carried out in two consecutive stages, (1) the confining pressure (oil pressure in the high-pressure vessel) is increased incrementally from 0.5 to 12 MPa. (2) the pore pressure is increased incrementally from 0 to 10 MPa by injection of pure water into the sample. Two syringe pumps are employed for applying the confining pressure and water injection respectively. The temperature of the fluid in the two syringe pumps is controlled at 40 °C. by a circulator. The high-pressure vessel is covered with a heating rubber heater and maintained at 40 °C The syringe pump for water injection is connected to the bottom end of the sample.
The experimental procedure at each stage is as follows.
  • Measurements while increasing confining (oil) pressure
    • After placing the sandstone sample into the high-pressure vessel, the system is vacuumed to remove residual air from the sample and the pure water injection line.
    • Increase the oil pressure inside the high-pressure vessel to 0.5 MPa and monitor the strain readings until they stabilize (no change for 30 minutes). Then set the strain readings to zero (initialization).
    • Perform Brillouin and Rayleigh frequency shift measurement respectively.
    • Increase the oil pressure to 2 MPa, then incrementally up by 2 MPa to 12 MPa. After stabilization at each step, perform the frequency shift measurement respectively.
  • Measurements while increasing pore pressure
    • The oil pressure in the high-pressure vessel is maintained at 12 MPa.
    • Set the flow rate of pure water syringe pump to 0.05 mL/min and a target pressure of 0.5 MPa, then put it in run state and open the water valve. When the water injection pressure is stabilized at 0.5 MPa, the strain readings are initialized (set to zero), and Brillouin and Rayleigh frequency shift measurements are performed respectively.
    • Increase the water injection pressure to 2 MPa, then incrementally up by 2 MPa to 10 MPa at injection rate of is 0.05 mL/min. At each pore pressure step, take strain readings and perform Brillouin and Rayleigh frequency shift measurements when the injection pressure is stabilized.

3. Strain Gauges and Distributed Optic Fiber Strain Measurements

In this section laboratory strain measurements on the Berea and Tako cores using both strain gauges and optic fiber are presented.

3.1. Berea Sandstone—Increasing Confining Pressure

3.1.1. Strain Gauge Readings

Out of the eight channels mounted on the sample, four appeared to be damaged during the test. Figure 4 presents the strain readings (negative for compressive strain) from the four working channels (the others are damaged/malfunctioned during the test) with increasing confinement, including two (Ch5 and Ch7) aligned with the optic fiber direction (measuring predominantly the hoop strain) and two (Ch2 and Ch8) in the near-vertical strain. It is noted that the vertical strains (Ch2 and Ch8) are markedly greater than the hoop strains (Ch5 and Ch7). For example, the hoop strain measured by gauge Ch8 reaches ~1100 με, compared to ~650 με by Ch7, when the confining pressure is increased to 12 MPa. Moreover, there is also notable discrepancy between the channels orientated in the same direction. It is further observed that the strain readings increased with the confining pressure in a bi-linear manner, indicating a change (increase) in the sandstone bulk modulus when the confining pressure is increased beyond 6–8 MPa.

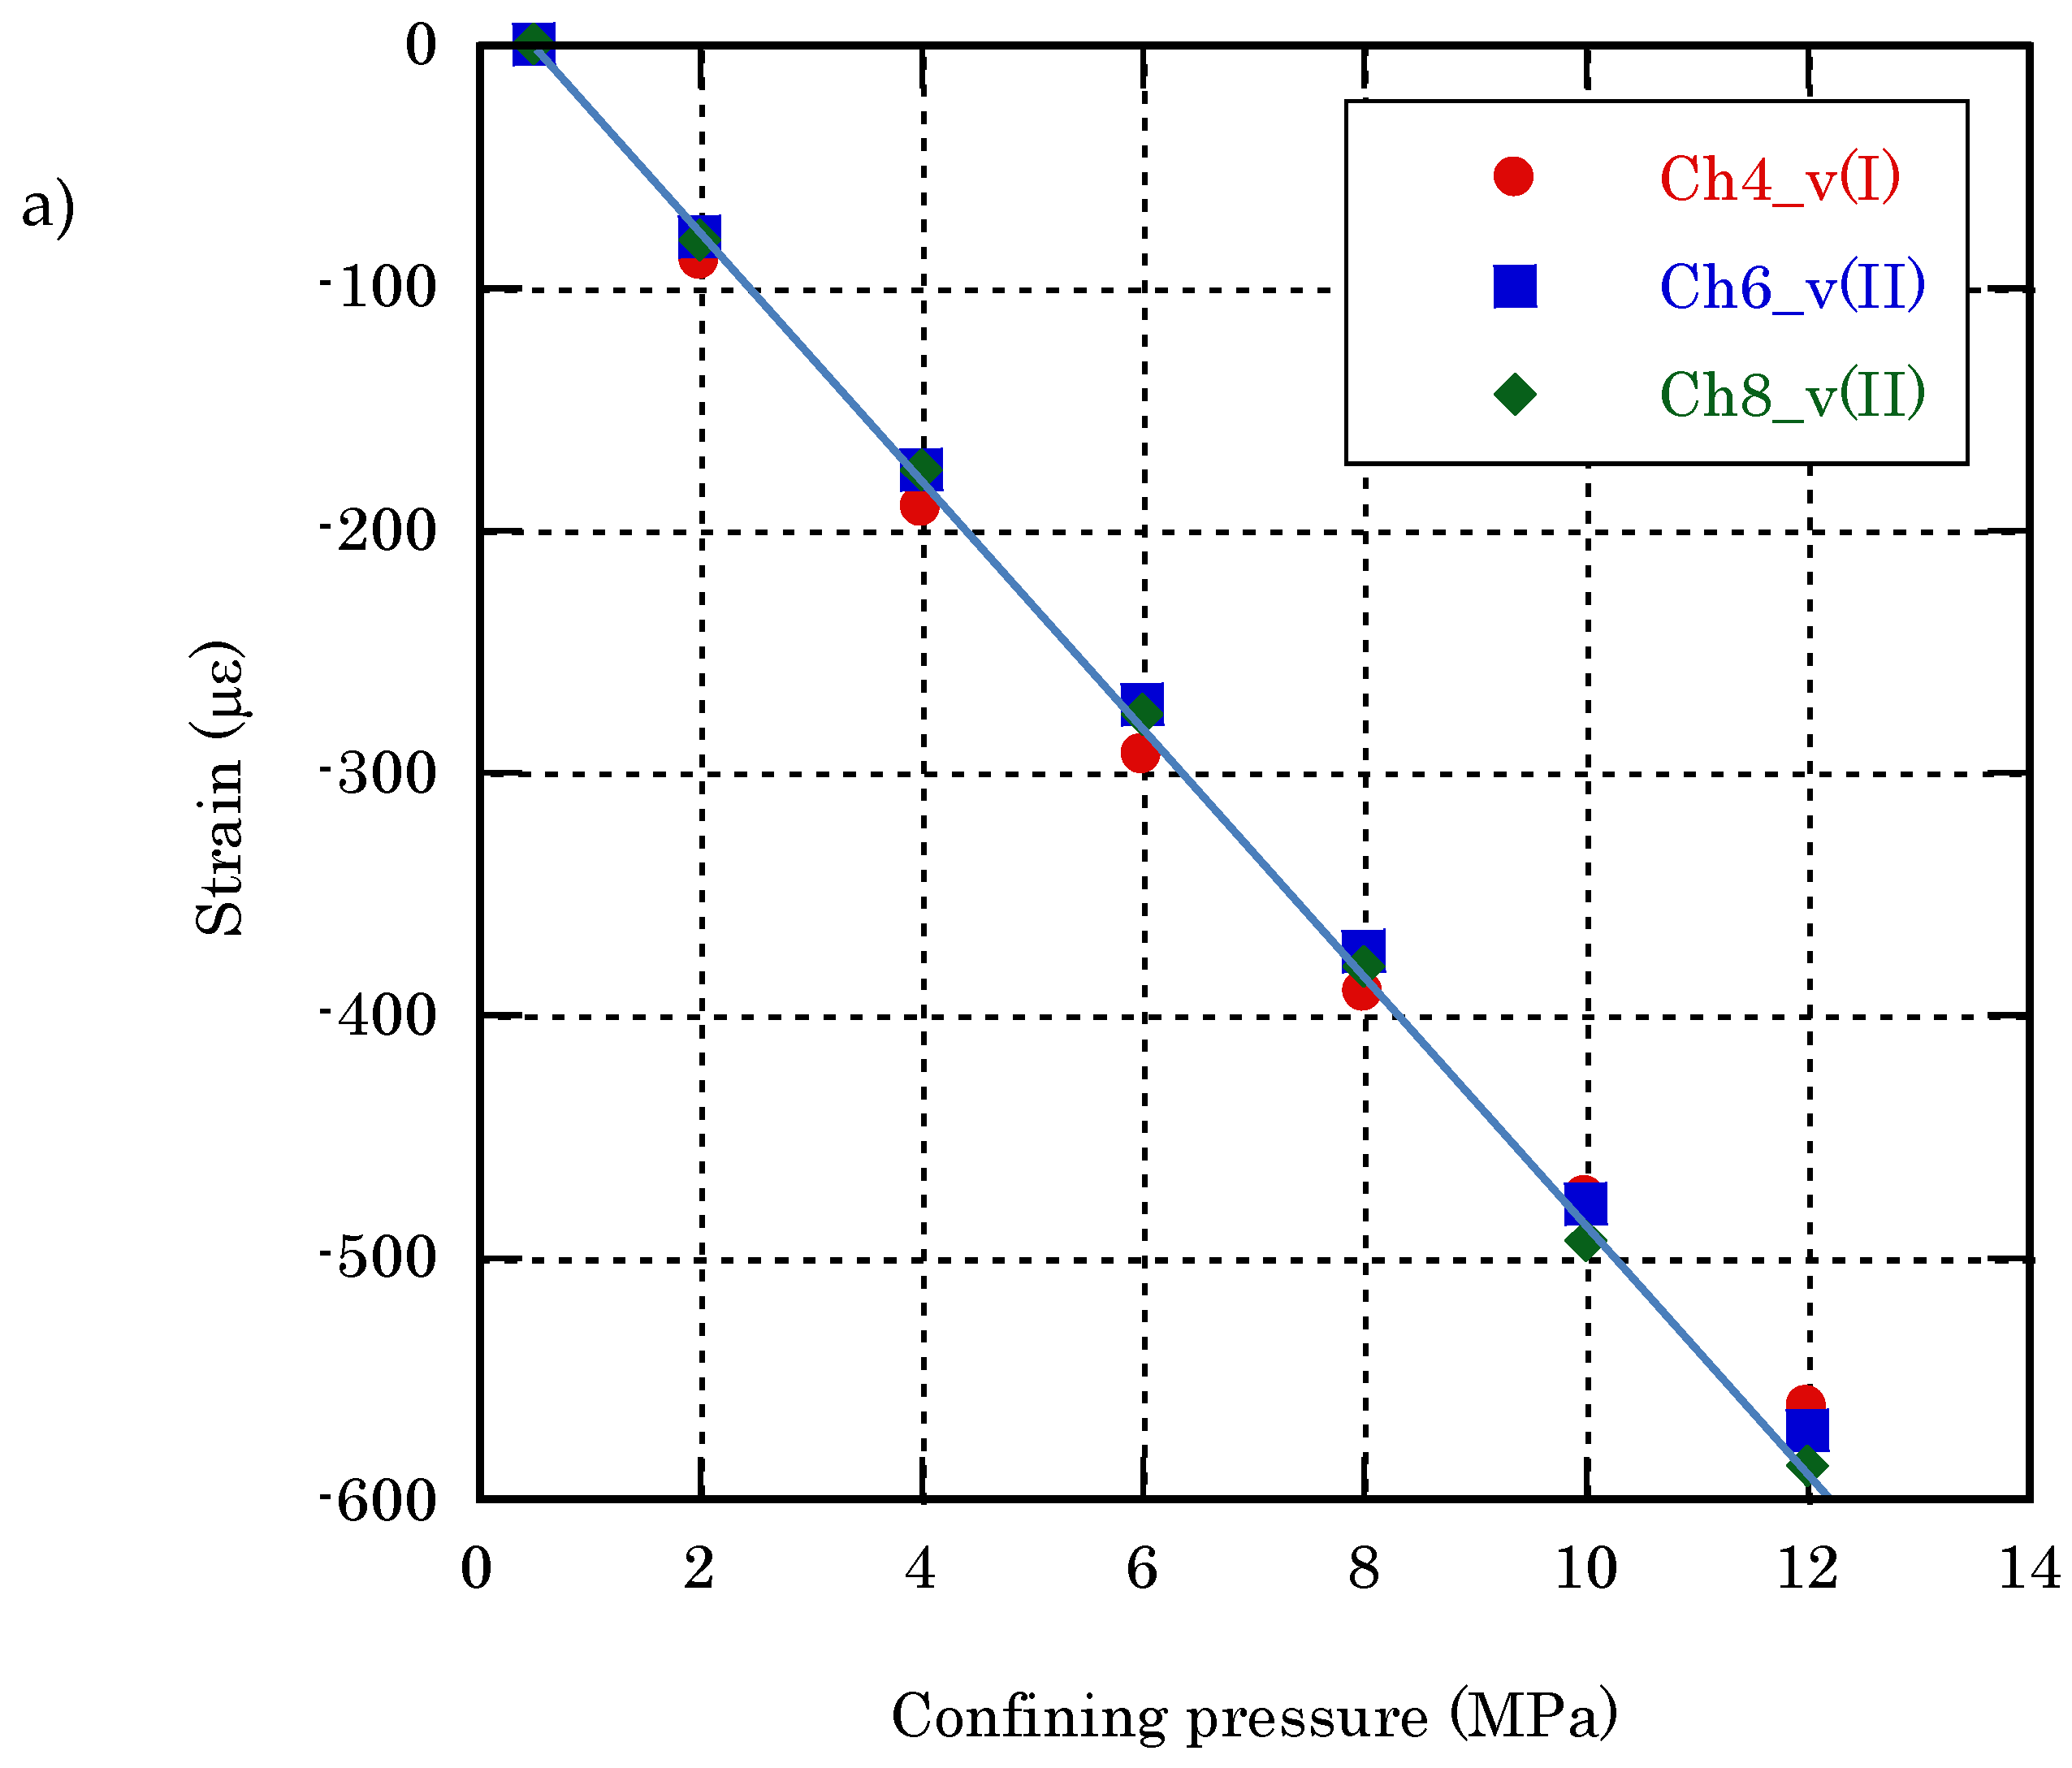
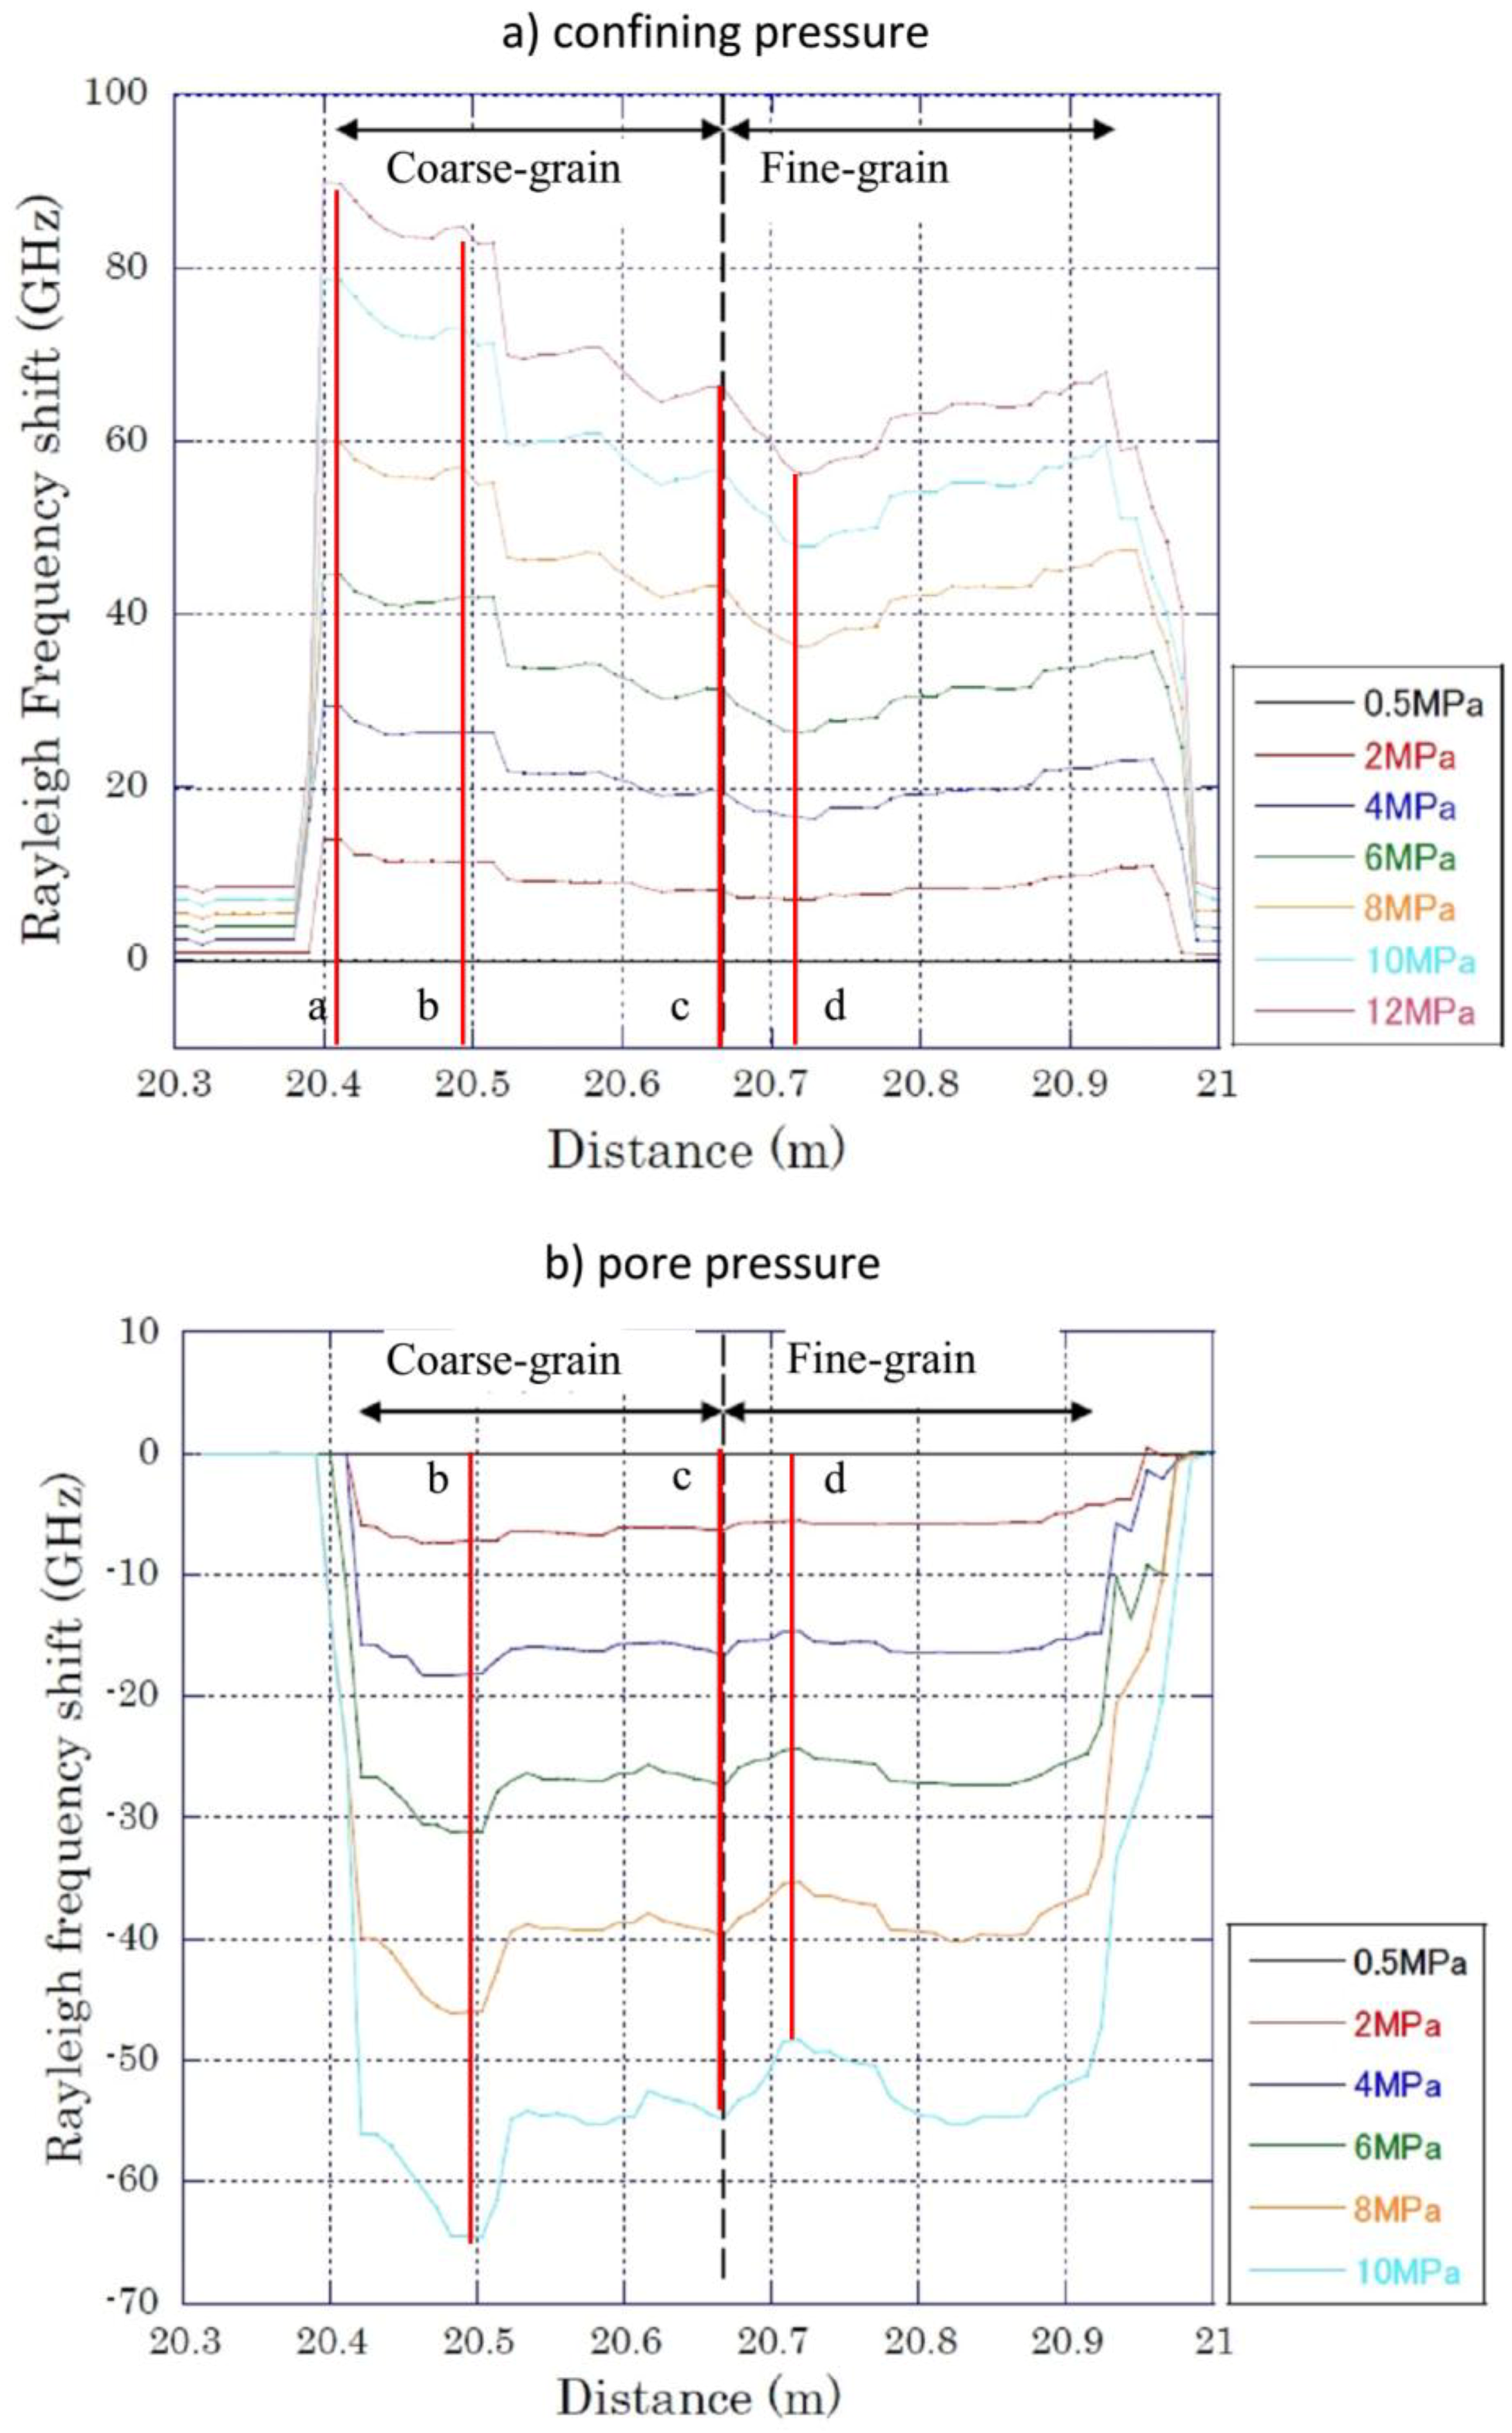
3.1.2. Optic Fiber Measurement—Rayleigh Frequency Shift

Figure 5a presents the Rayleigh frequency shift measurements encompassing the three sensor regions with increasing confining pressure. The horizontal axis represents the distance along the optical fiber from the end of the pump light. A close-up over the sensor region A (rock sample) is presented in Figure 5b. The Rayleigh frequency shift is seen to increase (indicating compressive strain) with increasing confining pressure.
It is noted that the measured increase in the frequency shift is not uniform over the length interval attached to the core sample. Instead, from the monitoring points 1 to 11 within the length interval 18.89–19.30 m, a down-then-up trend may be identified as the optic fiber goes around the core sample peripheral in spiral; and this spatial trend becomes increasingly pronounced at higher confining pressure. The difference between the highest and lowest measured frequency shift between points 1 and 11 when the confining pressure is increased to 12 MPa is approximately 15 GHz, which is about 15% of the mean value (~100 GHz).
Figure 6 presents the mean value of frequency shifts measured at the 11 monitoring points (which are plotted separately in Figure S2) as the confining pressure is increased from 0.5 MPa to 12 MPa, and their mean value at each pressure step compared with the baseline value (sensor region B). It is seen that the frequency shift for the free-standing optic fiber in the pressure vessel is only a small fraction (<10%) of that measured from the rock, while there is practically no response from the free-standing optic fiber outside the pressure vessel (sensor region C in Figure 5a).

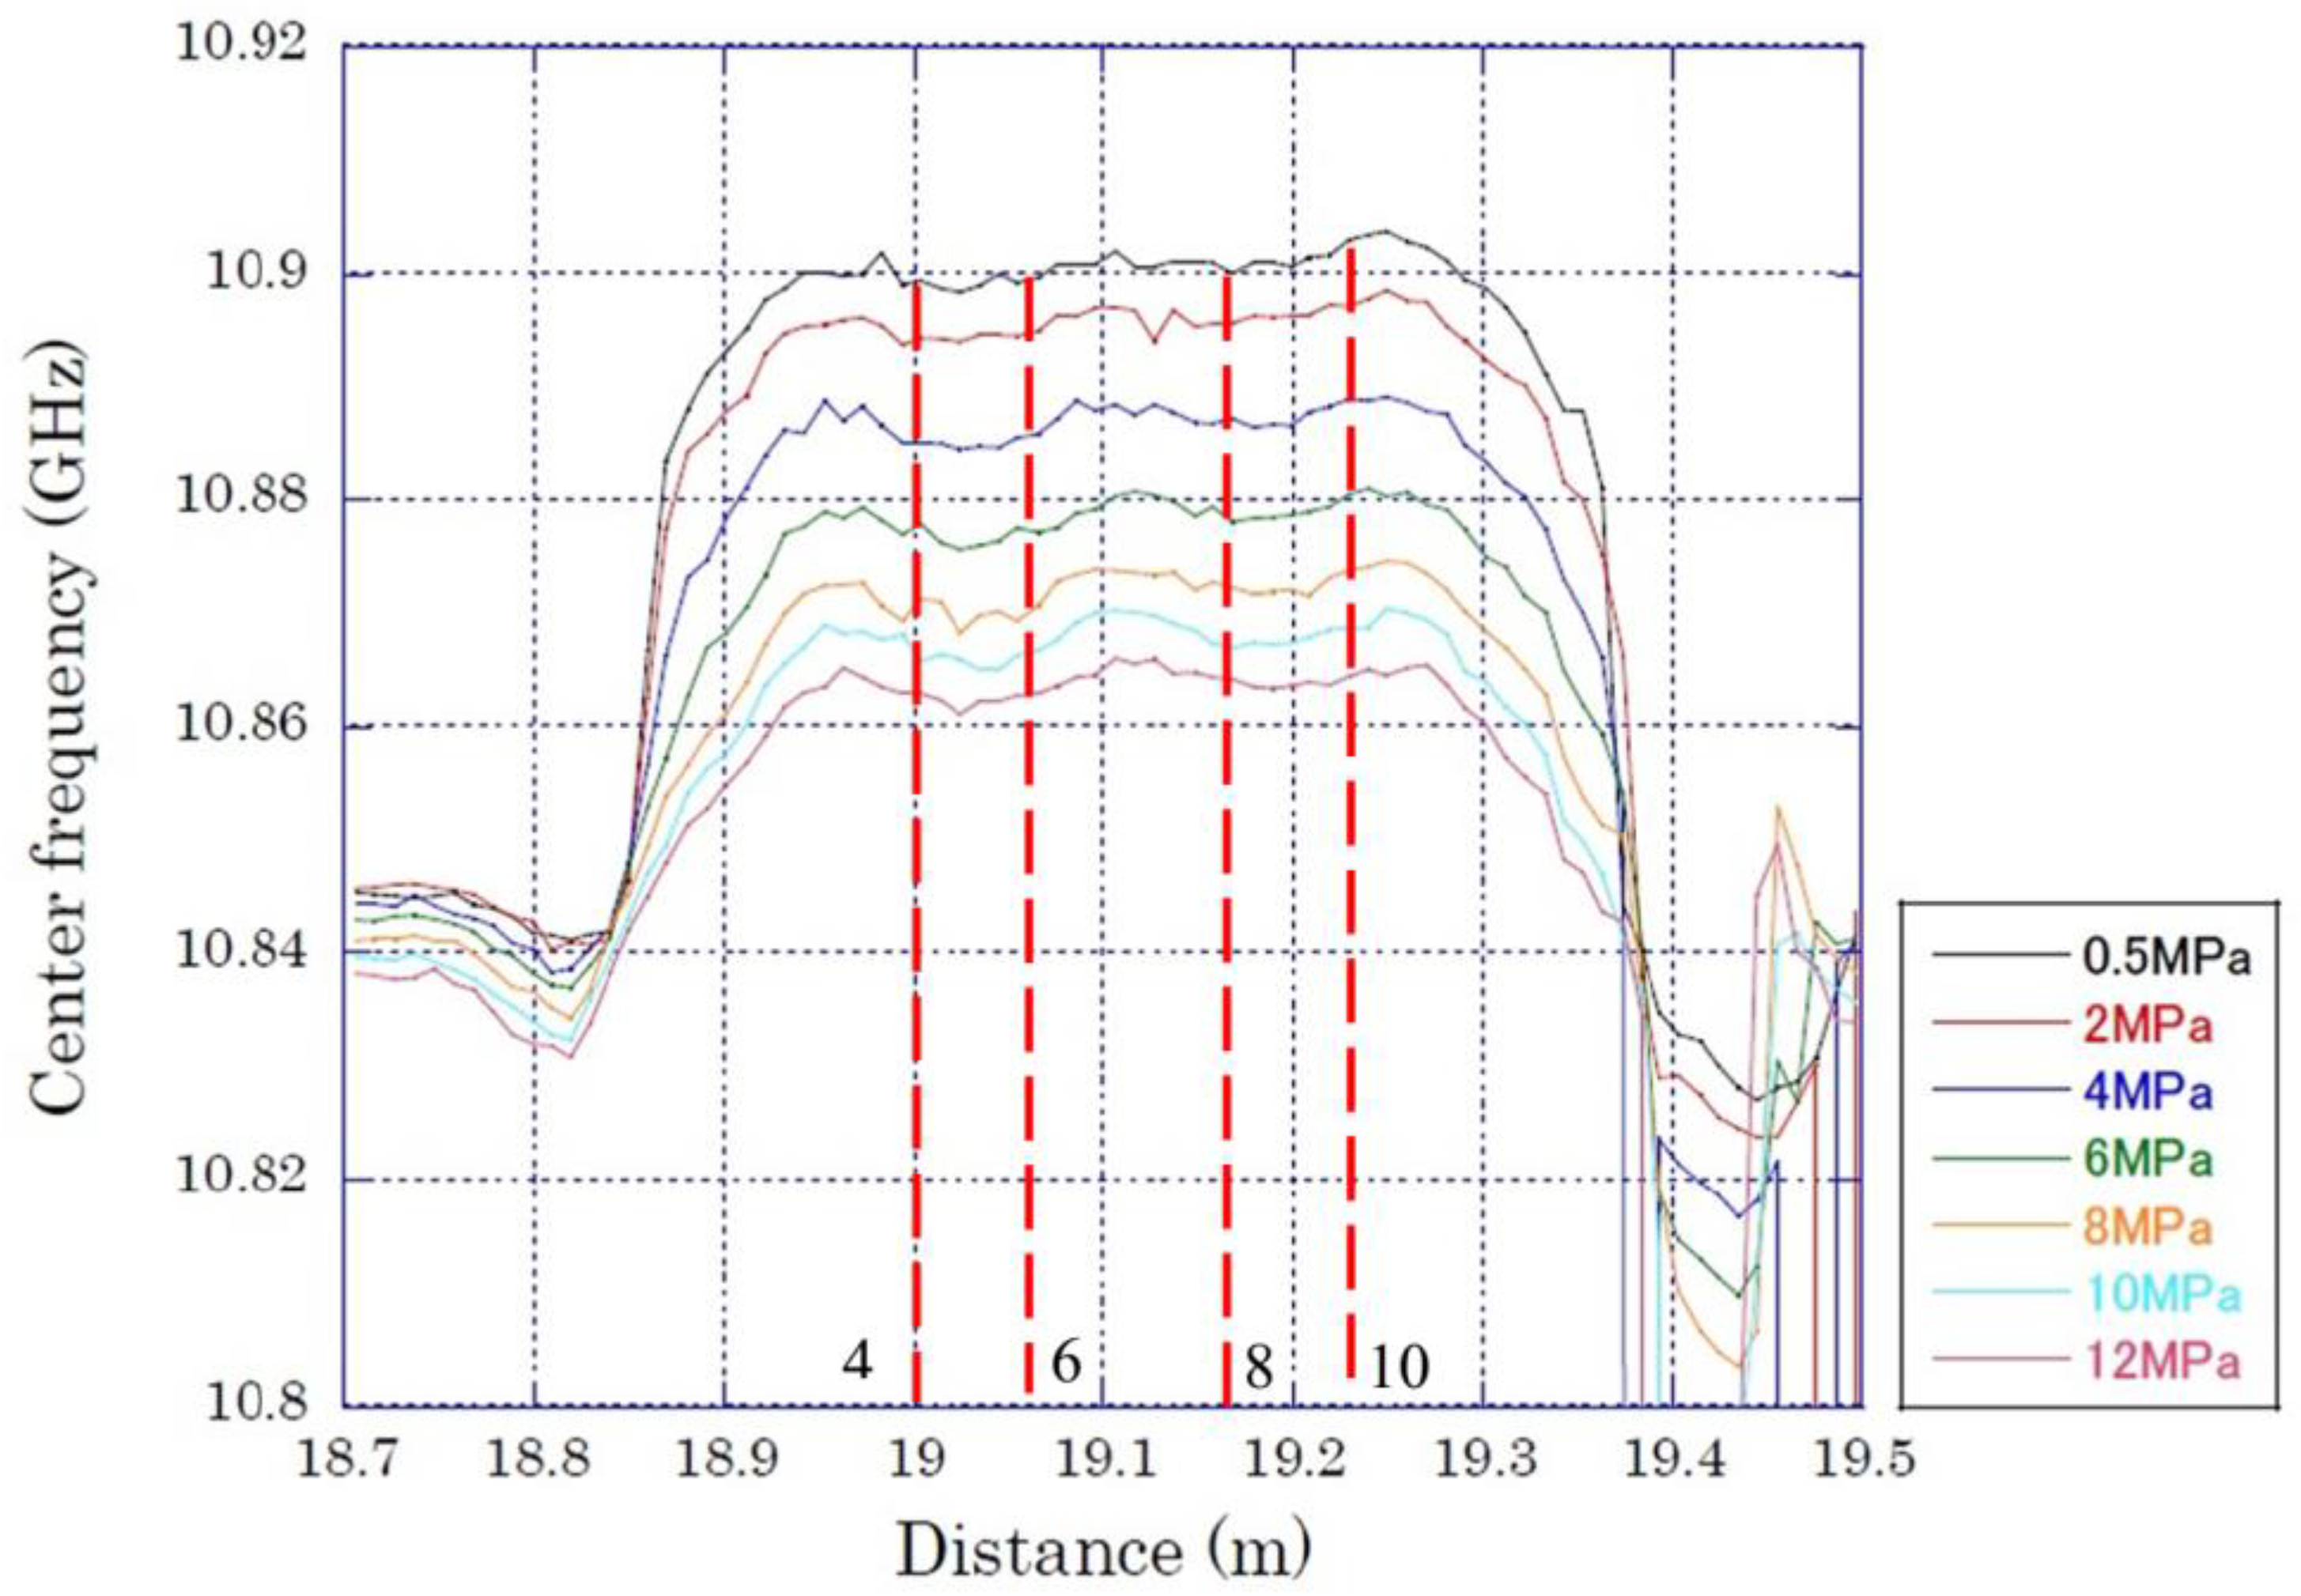
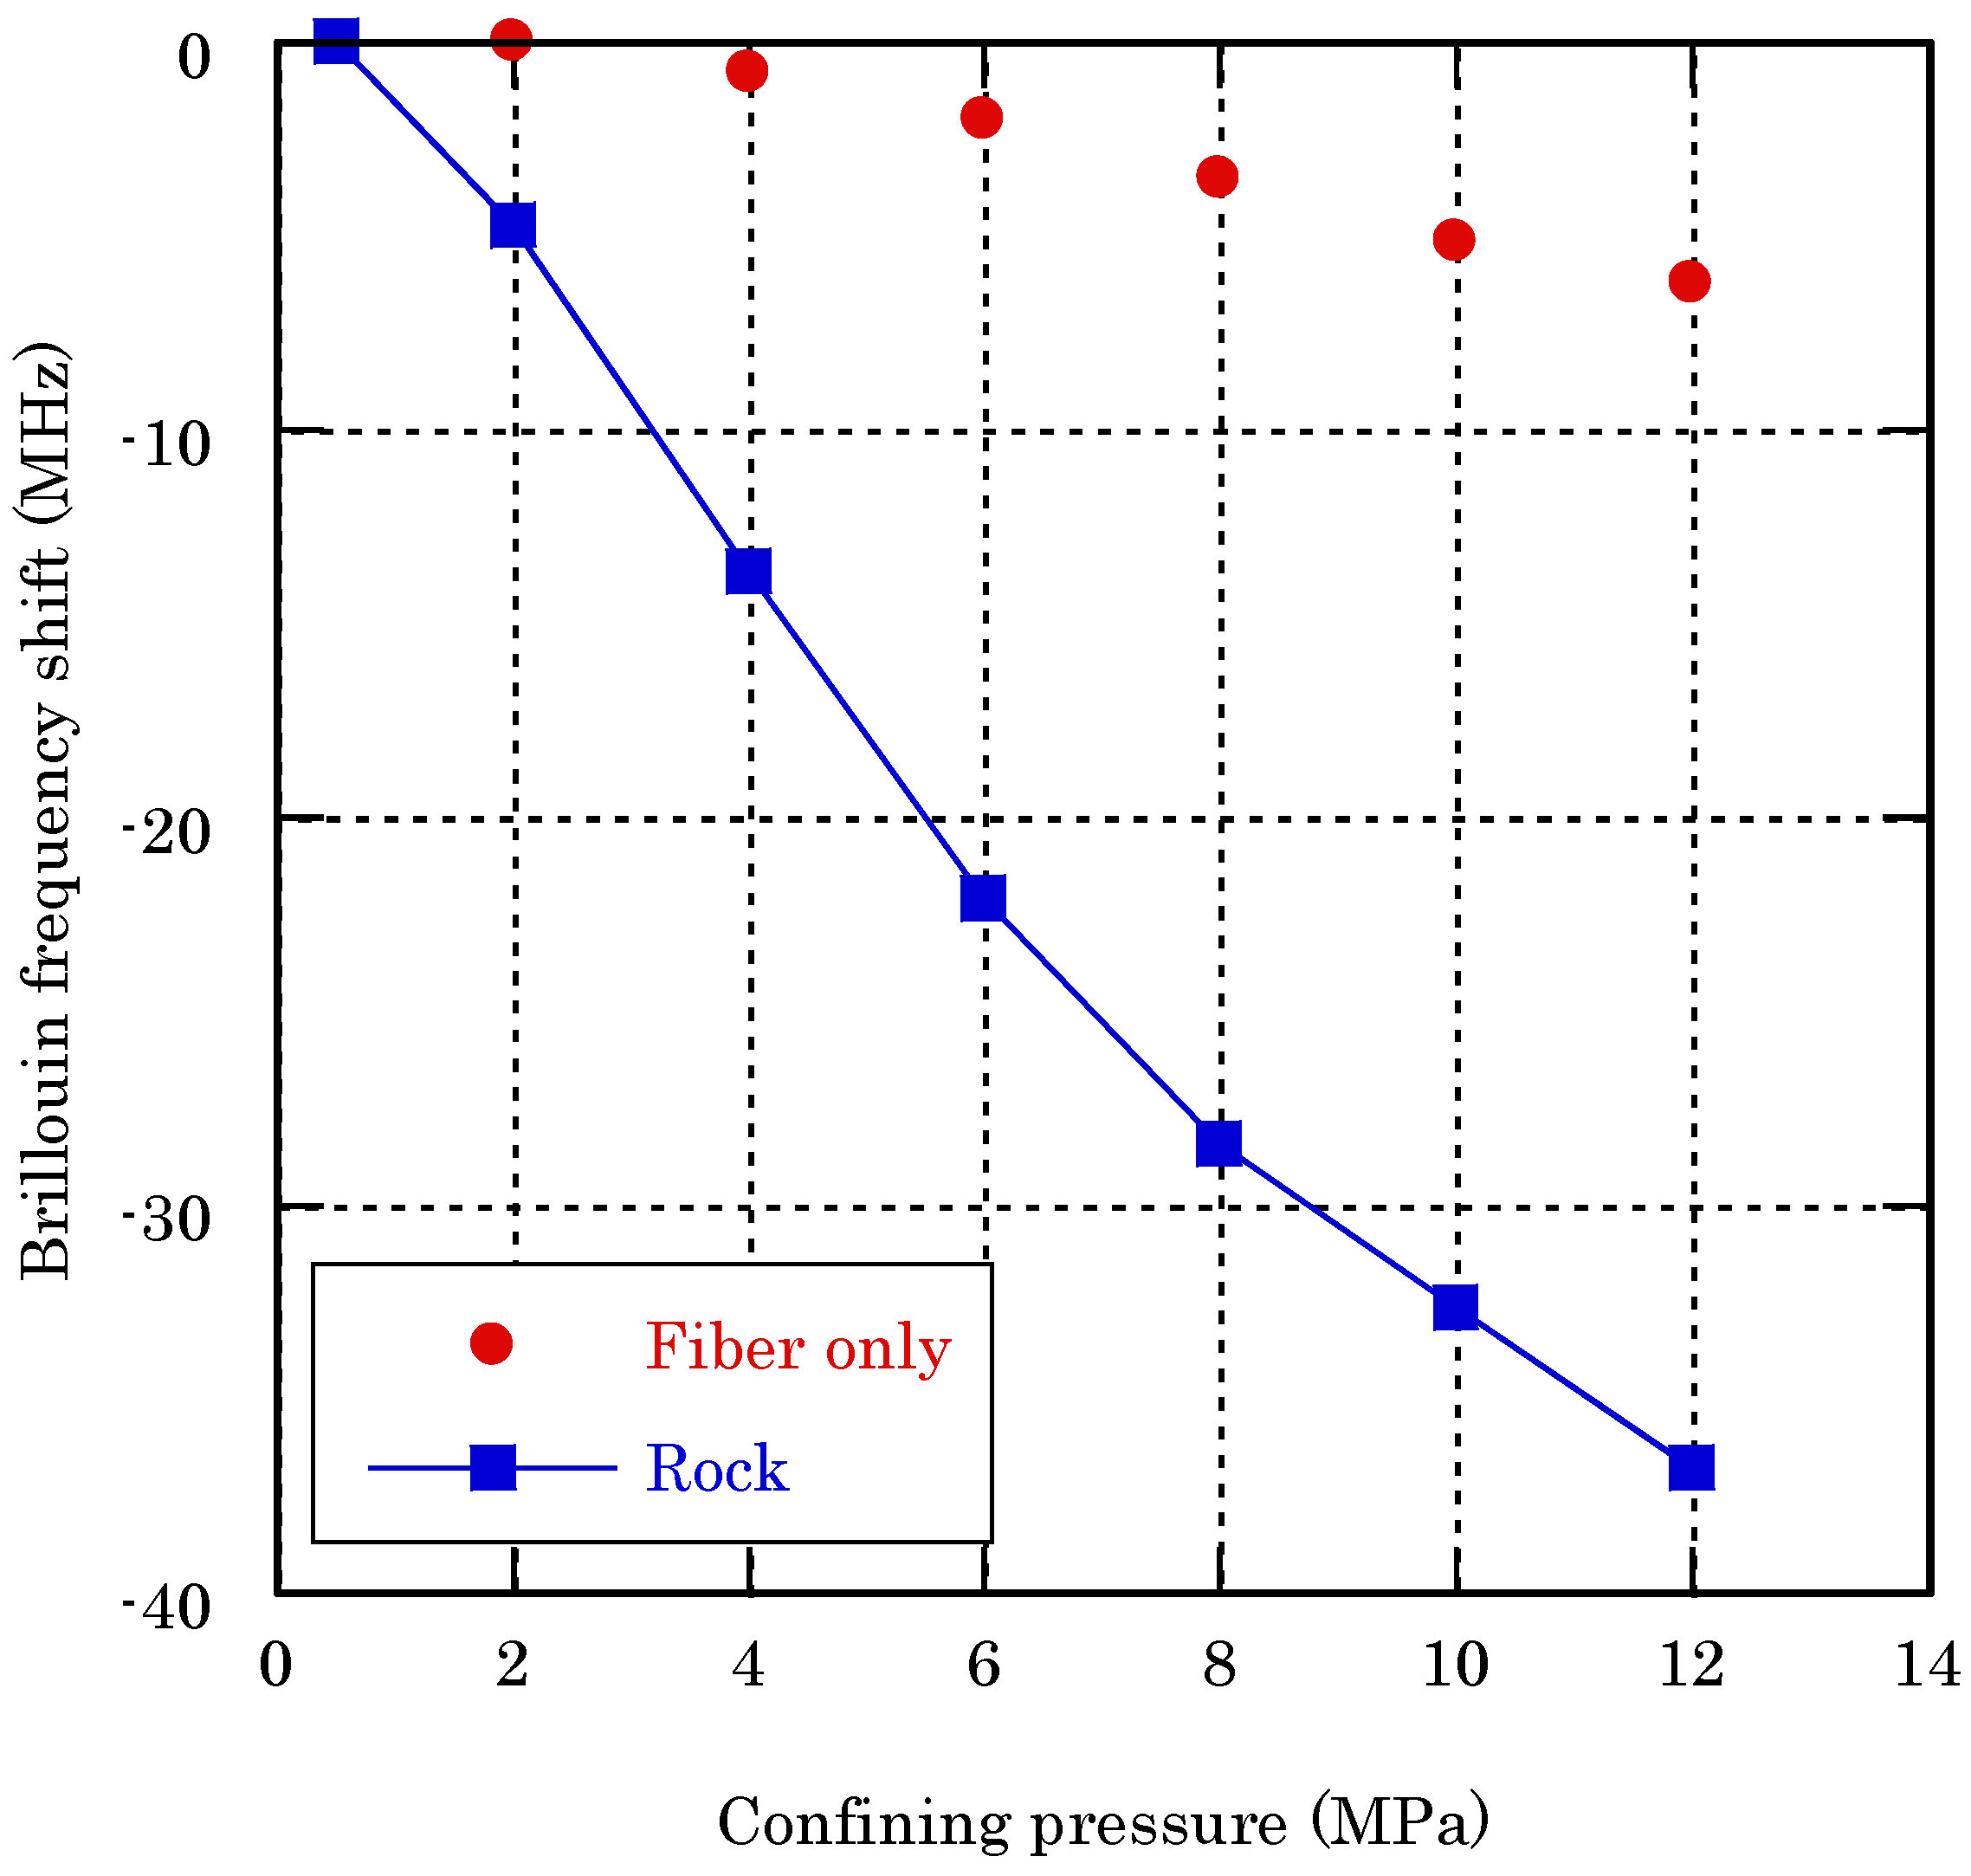
3.1.3. Optic Fiber Measurement—Brillouin Frequency Shift

Figure 7 presents the corresponding Brillouin frequency measurements over at the sandstone core (sensor region A). In contrast to the Rayleigh frequency, the Brillouin frequency is reduced (from ~10.9 GHz) with increasing confining pressure. Furthermore, the measured Brillouin frequency displays low-magnitude spatial fluctuations which are absent from the Rayleigh frequency measurement. Figure 8 presents the frequency shifts measured at the 11 monitoring points (which are plotted separately in Figure S3) as the confining pressure is increased from 0.5 MPa to 12 MPa, and their mean value at each pressure step compared with the baseline value (sensor region B). As with the Brillouin frequency shift, the mean frequency shift value also increases in a bi-linear manner (though the transition occurs at a higher confining pressure of 8 MPa) with increasing confining pressure. The frequency shift for the free-standing optic fiber in the pressure vessel is about 1/6th of that measured from the rock.

3.2. Berea—Increasing Pore Pressure

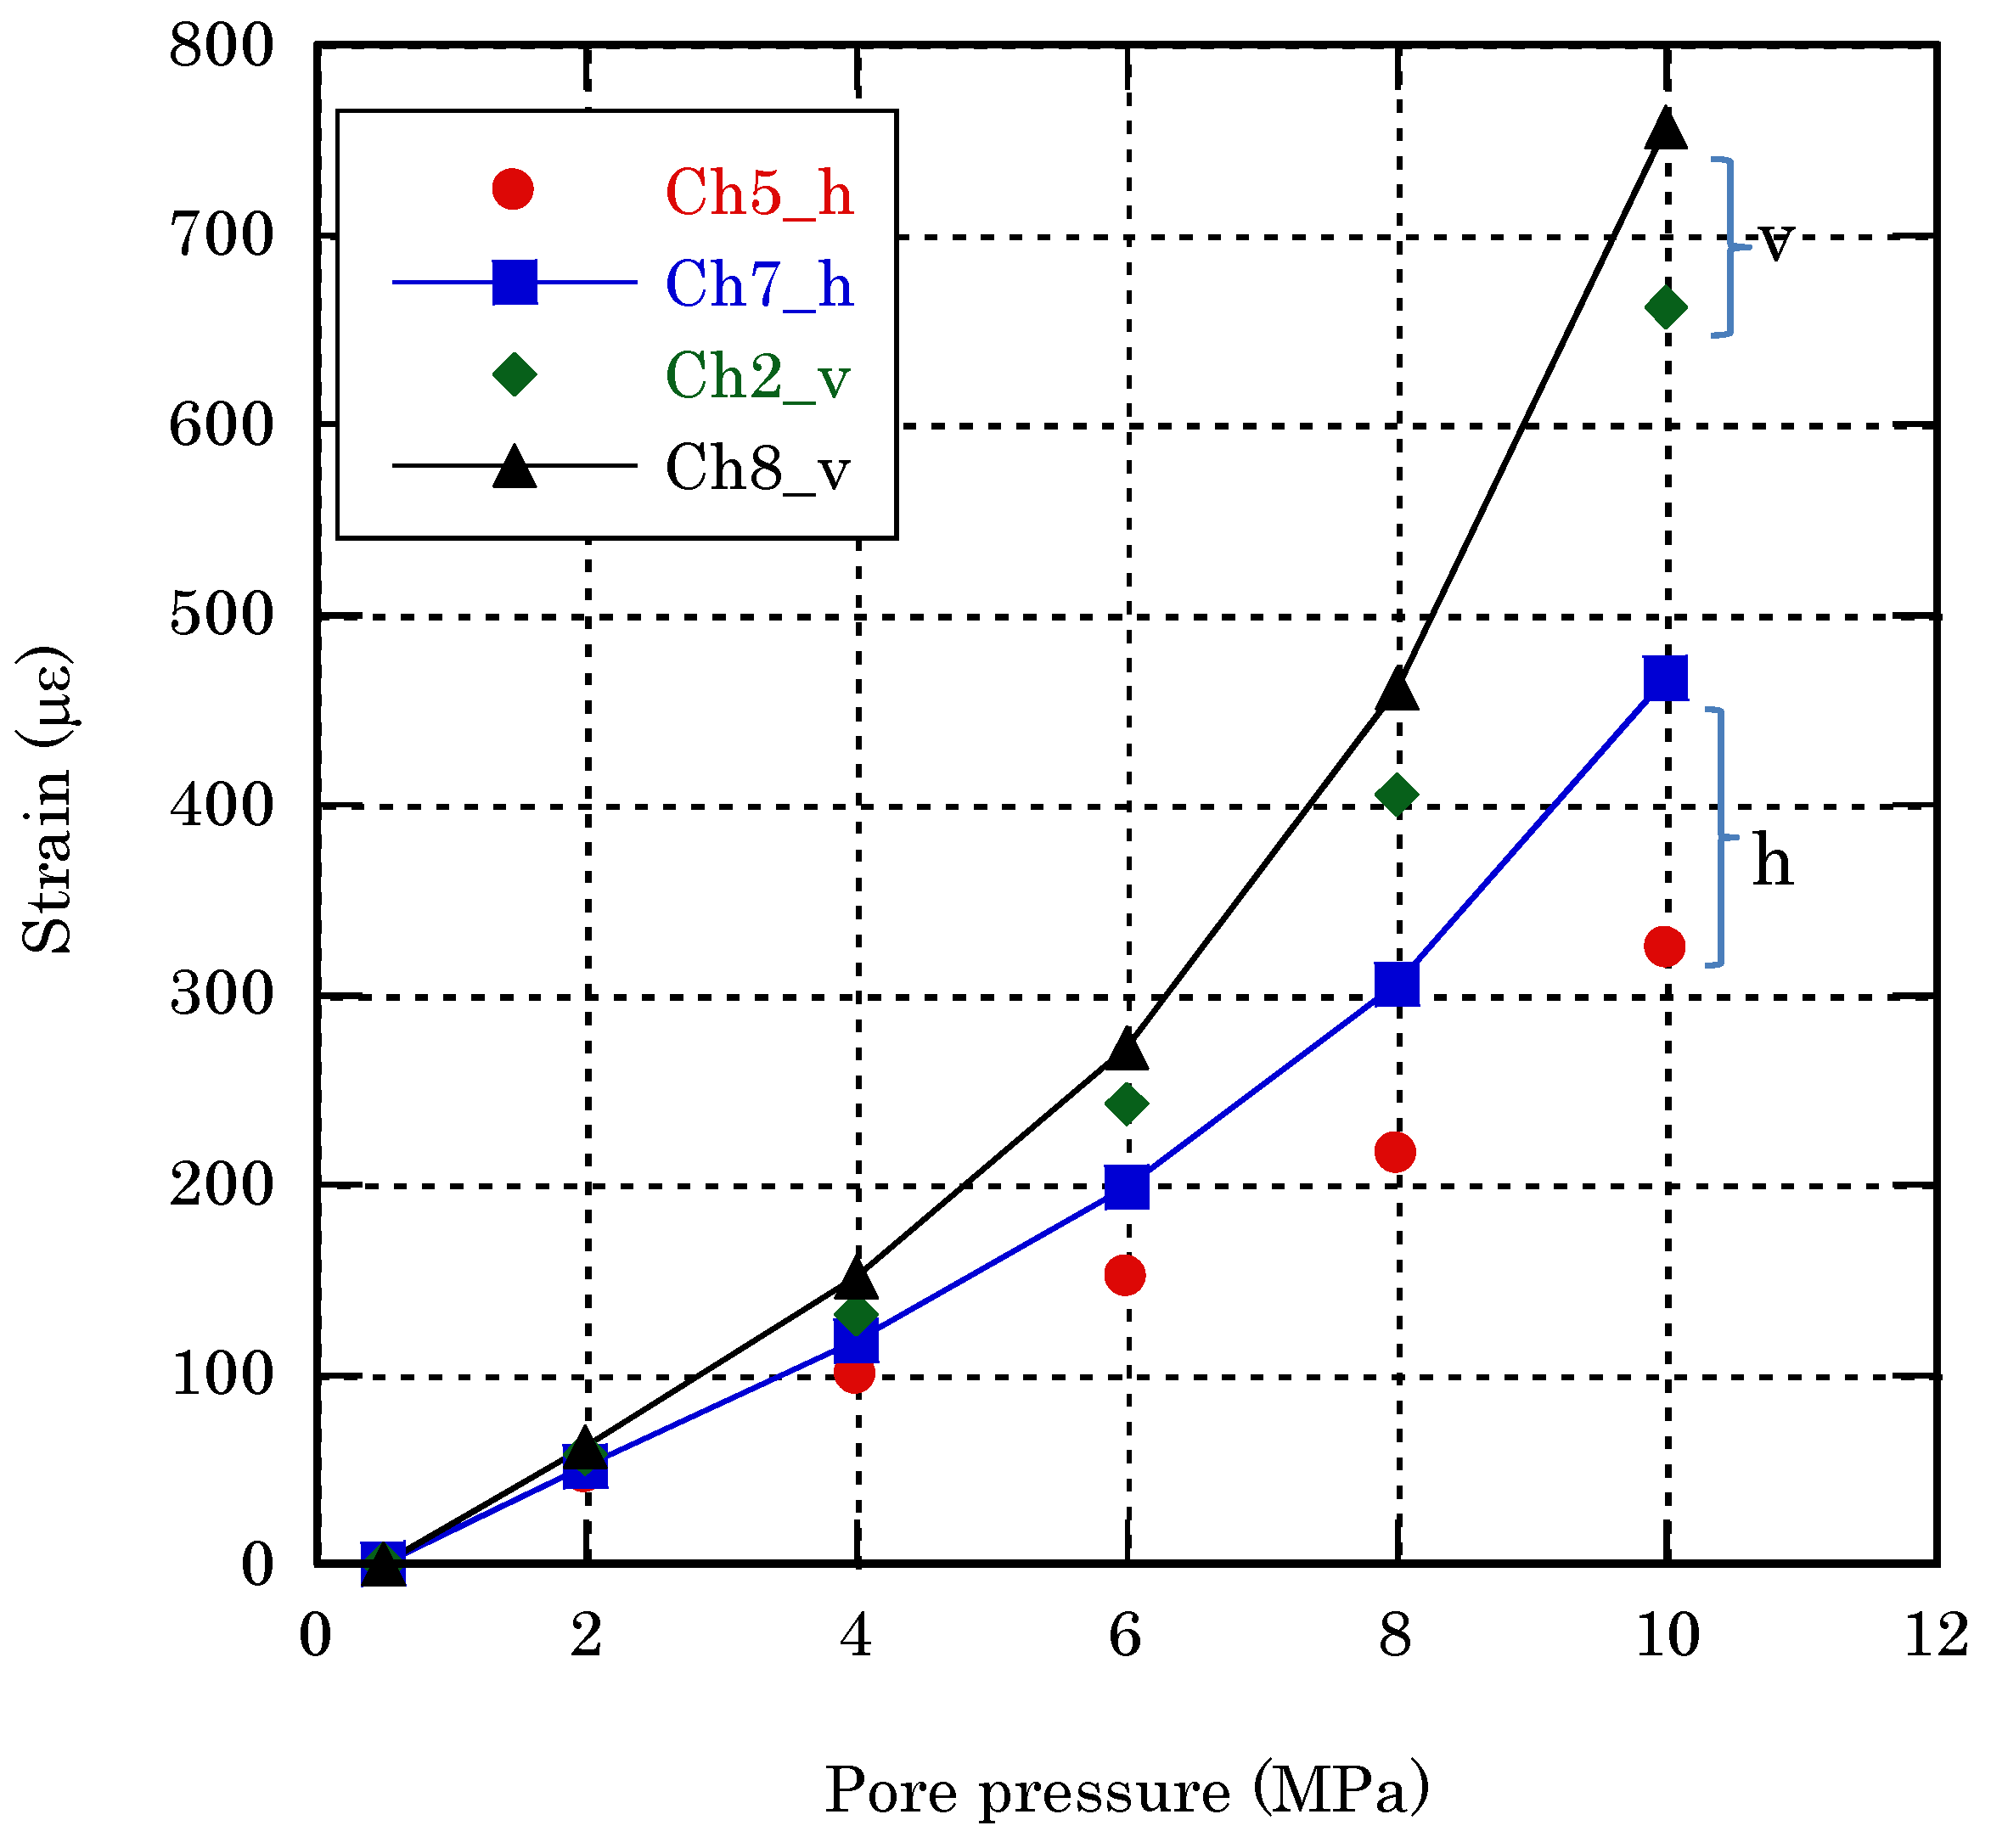
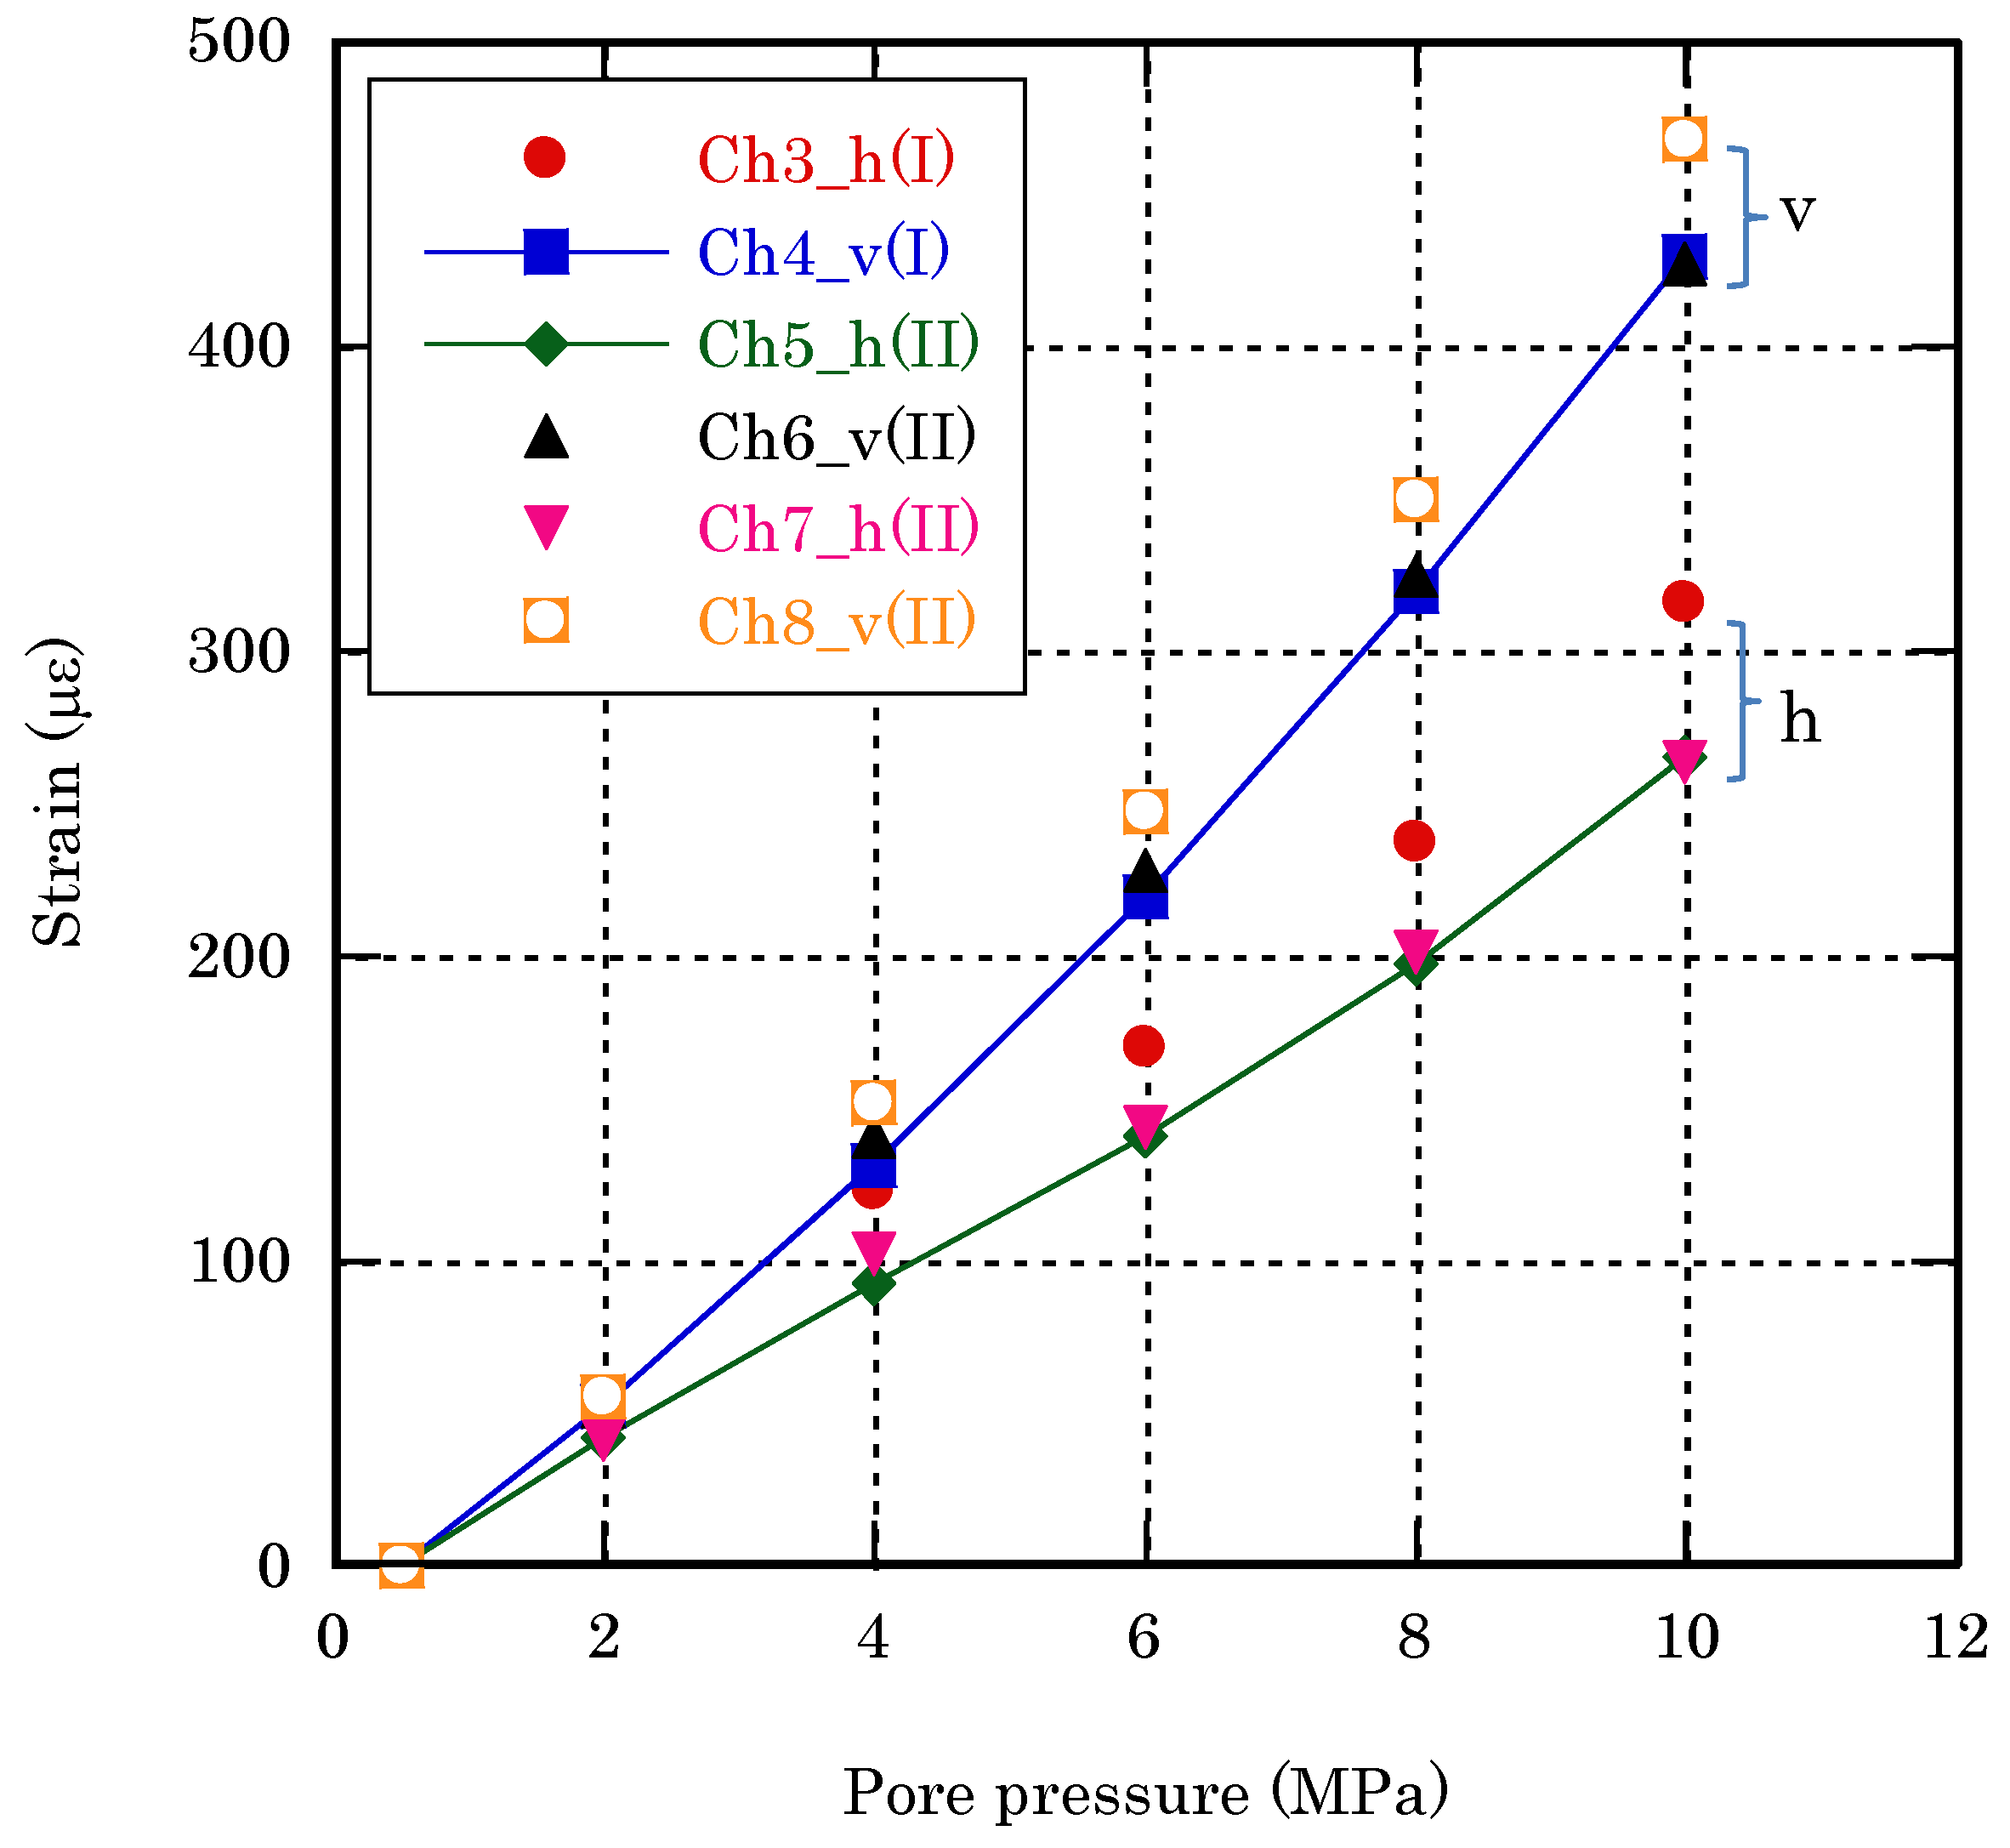
3.2.1. Strain Gauge Readings

Figure 9 presents the strain gauge readings for the four working channels when the pore pressure is increased to 10 MPa. As with pore pressure increase above, the vertical strains (Ch2 and Ch8) are markedly greater than the hoop strains (Ch5 and Ch7). For example, the hoop strain measured by gauge Ch8 reaches ~760 με, compared to ~470 με by Ch7, when the pore pressure is increased to 10 MPa. Discrepancy between the channels orientated in the same direction is also noted. It is further observed that the strain readings increased positively (less compressive) with the pore pressure in a largely piecewise manner, indicating successive changes (reduction) in the sandstone bulk modulus when the pore pressure is increased beyond 4–6 MPa.

3.2.2. Optic Fiber Measurement

Unlike previously, with confining pressure (Figure 6b), the measured frequency is more or less uniform over the length interval between 18.89 and 19.30 m (see Figure S4). Figure 10 presents the mean of the frequency shift measured at the 11 monitoring points as the pore pressure is increased from 0.5 MPa to 10 MPa. Note that that mean frequency shift value increases also in a piece-wise manner when the pore pressure exceeds 6 MPa. In comparison, no change is recorded by the free-standing optic fiber inside the pressure vessel, which is to be expected.
In contrast to the Rayleigh shift data, considerable scattering in the Brillouin frequency shift measurements is observed (see Figure S5).

3.3. Tako Core

Strain readings for the two stages are presented in Section 3.2.1. Unlike for the Berea core, only the Rayleigh frequency measurement is presented here, as it seems to give superior performance in terms of consistency (less spatial scattering) than the Brillouin frequency shift.

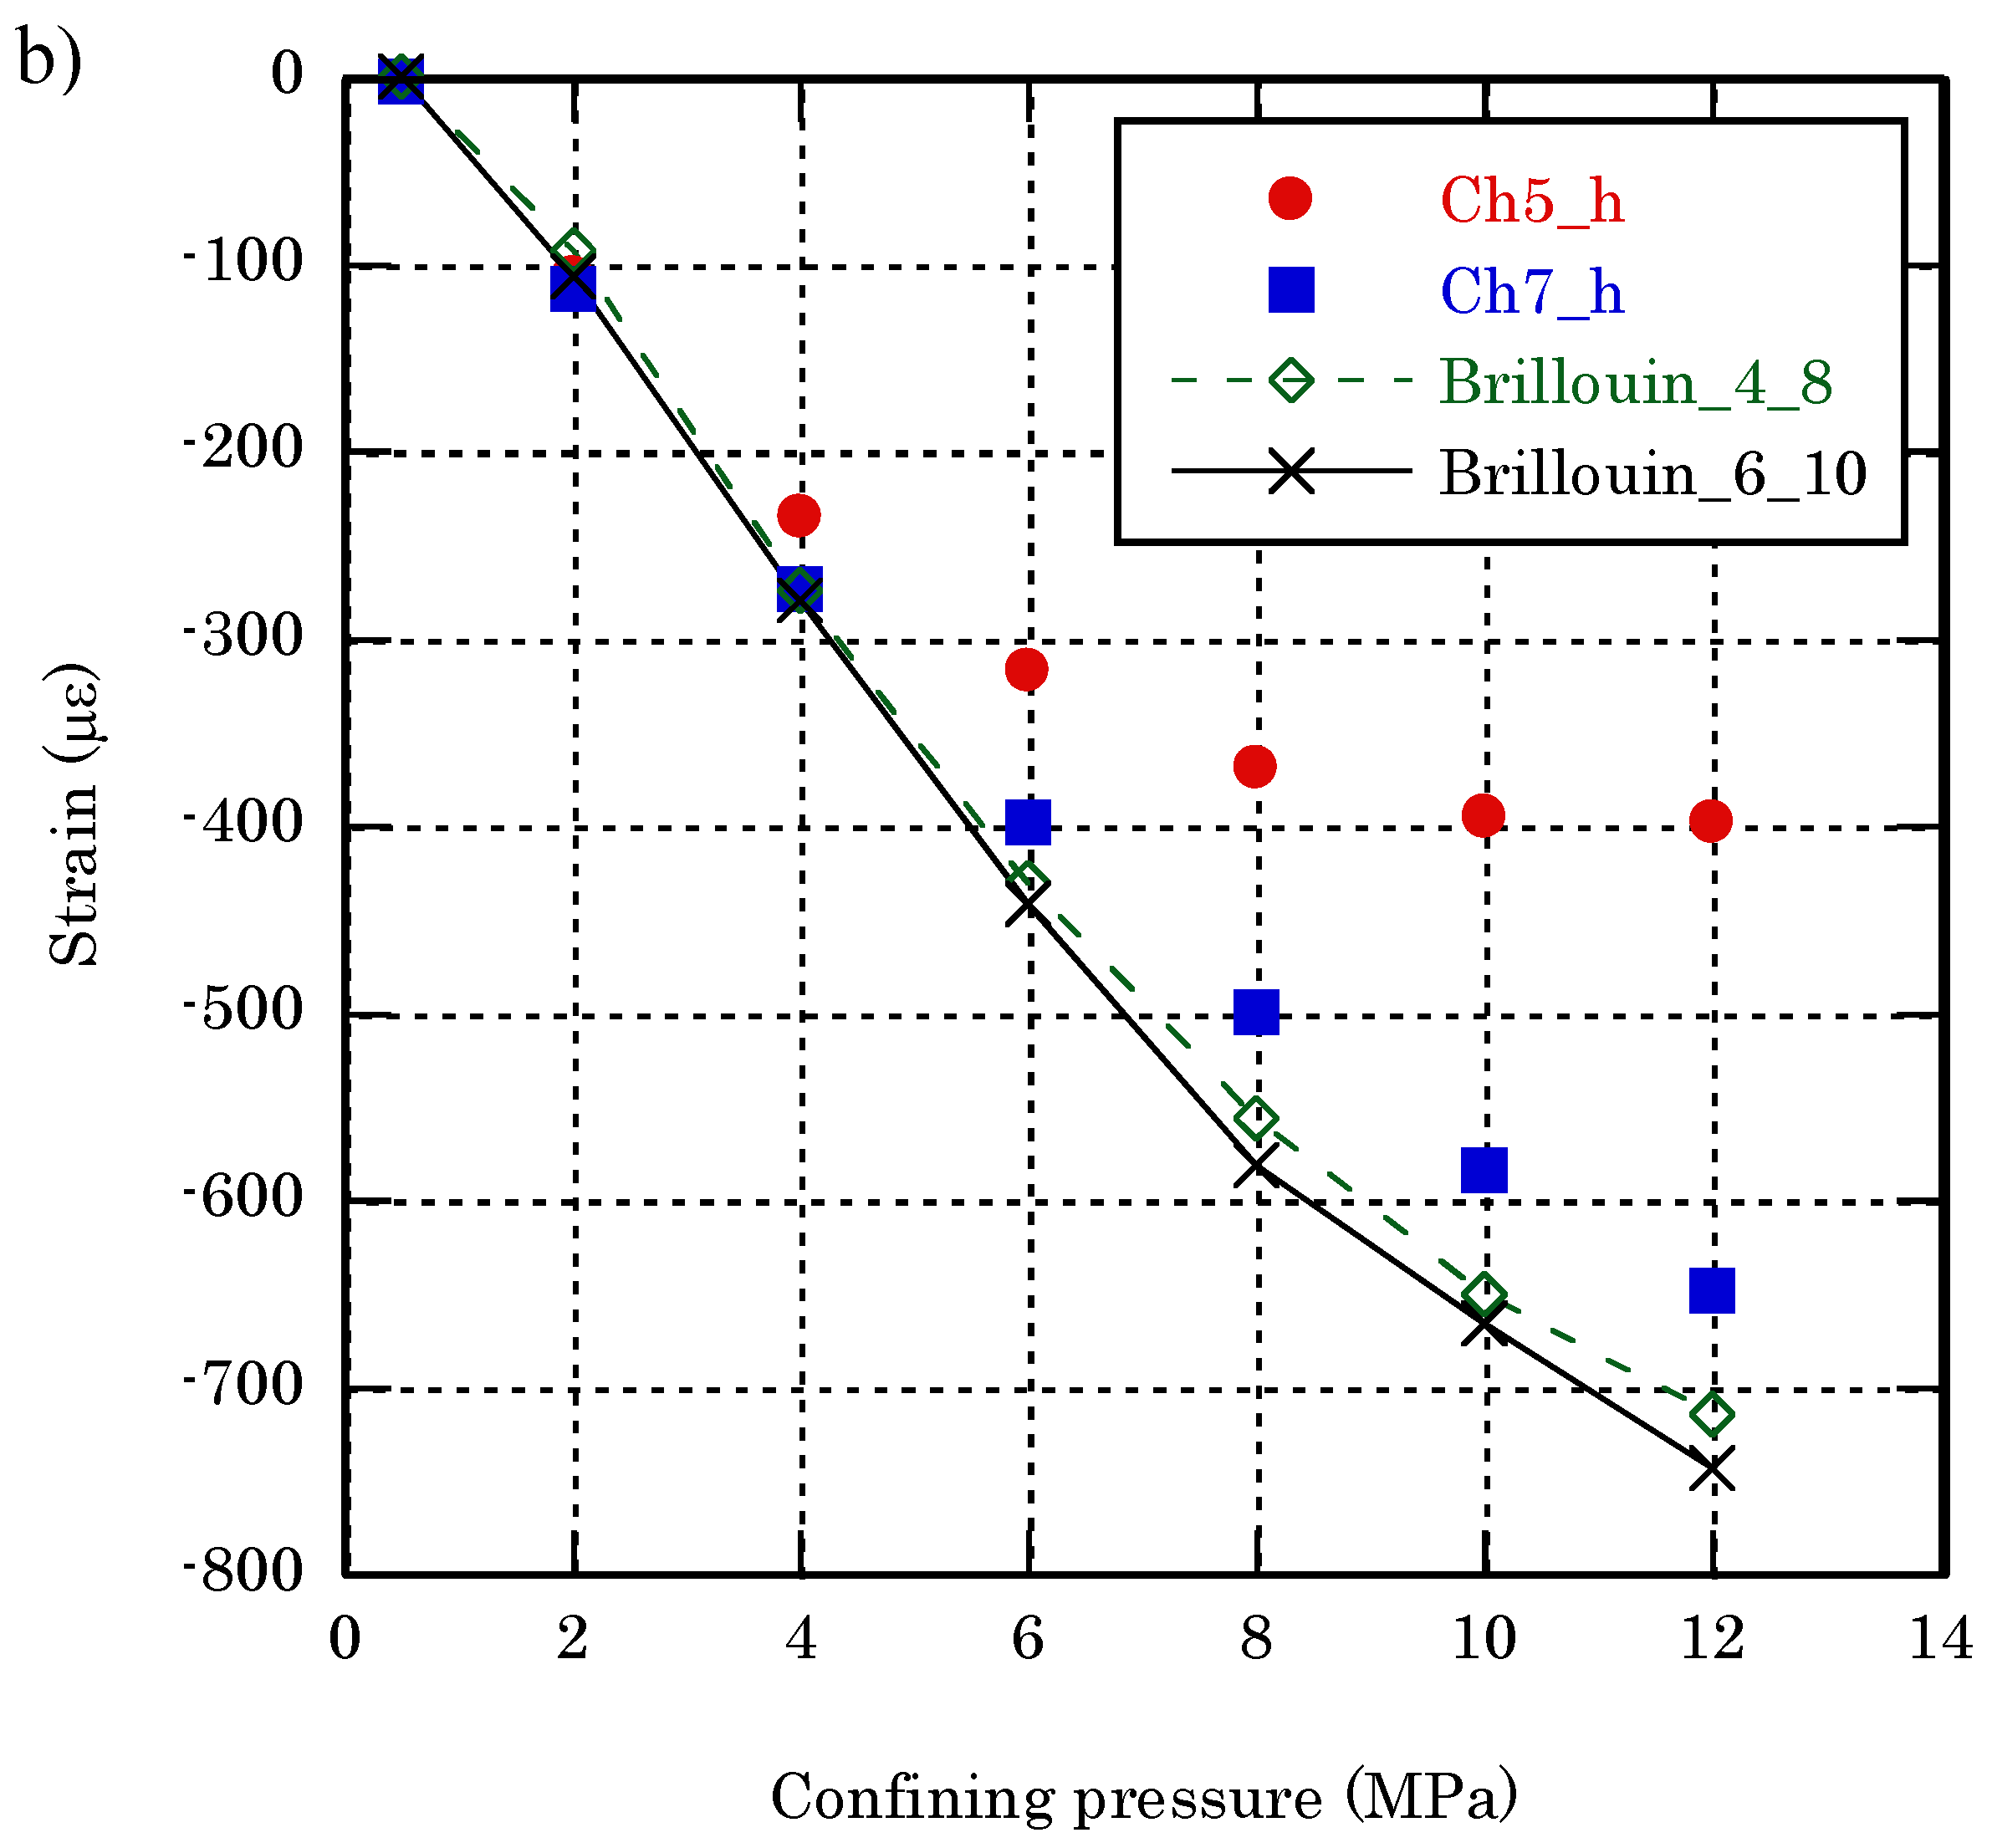
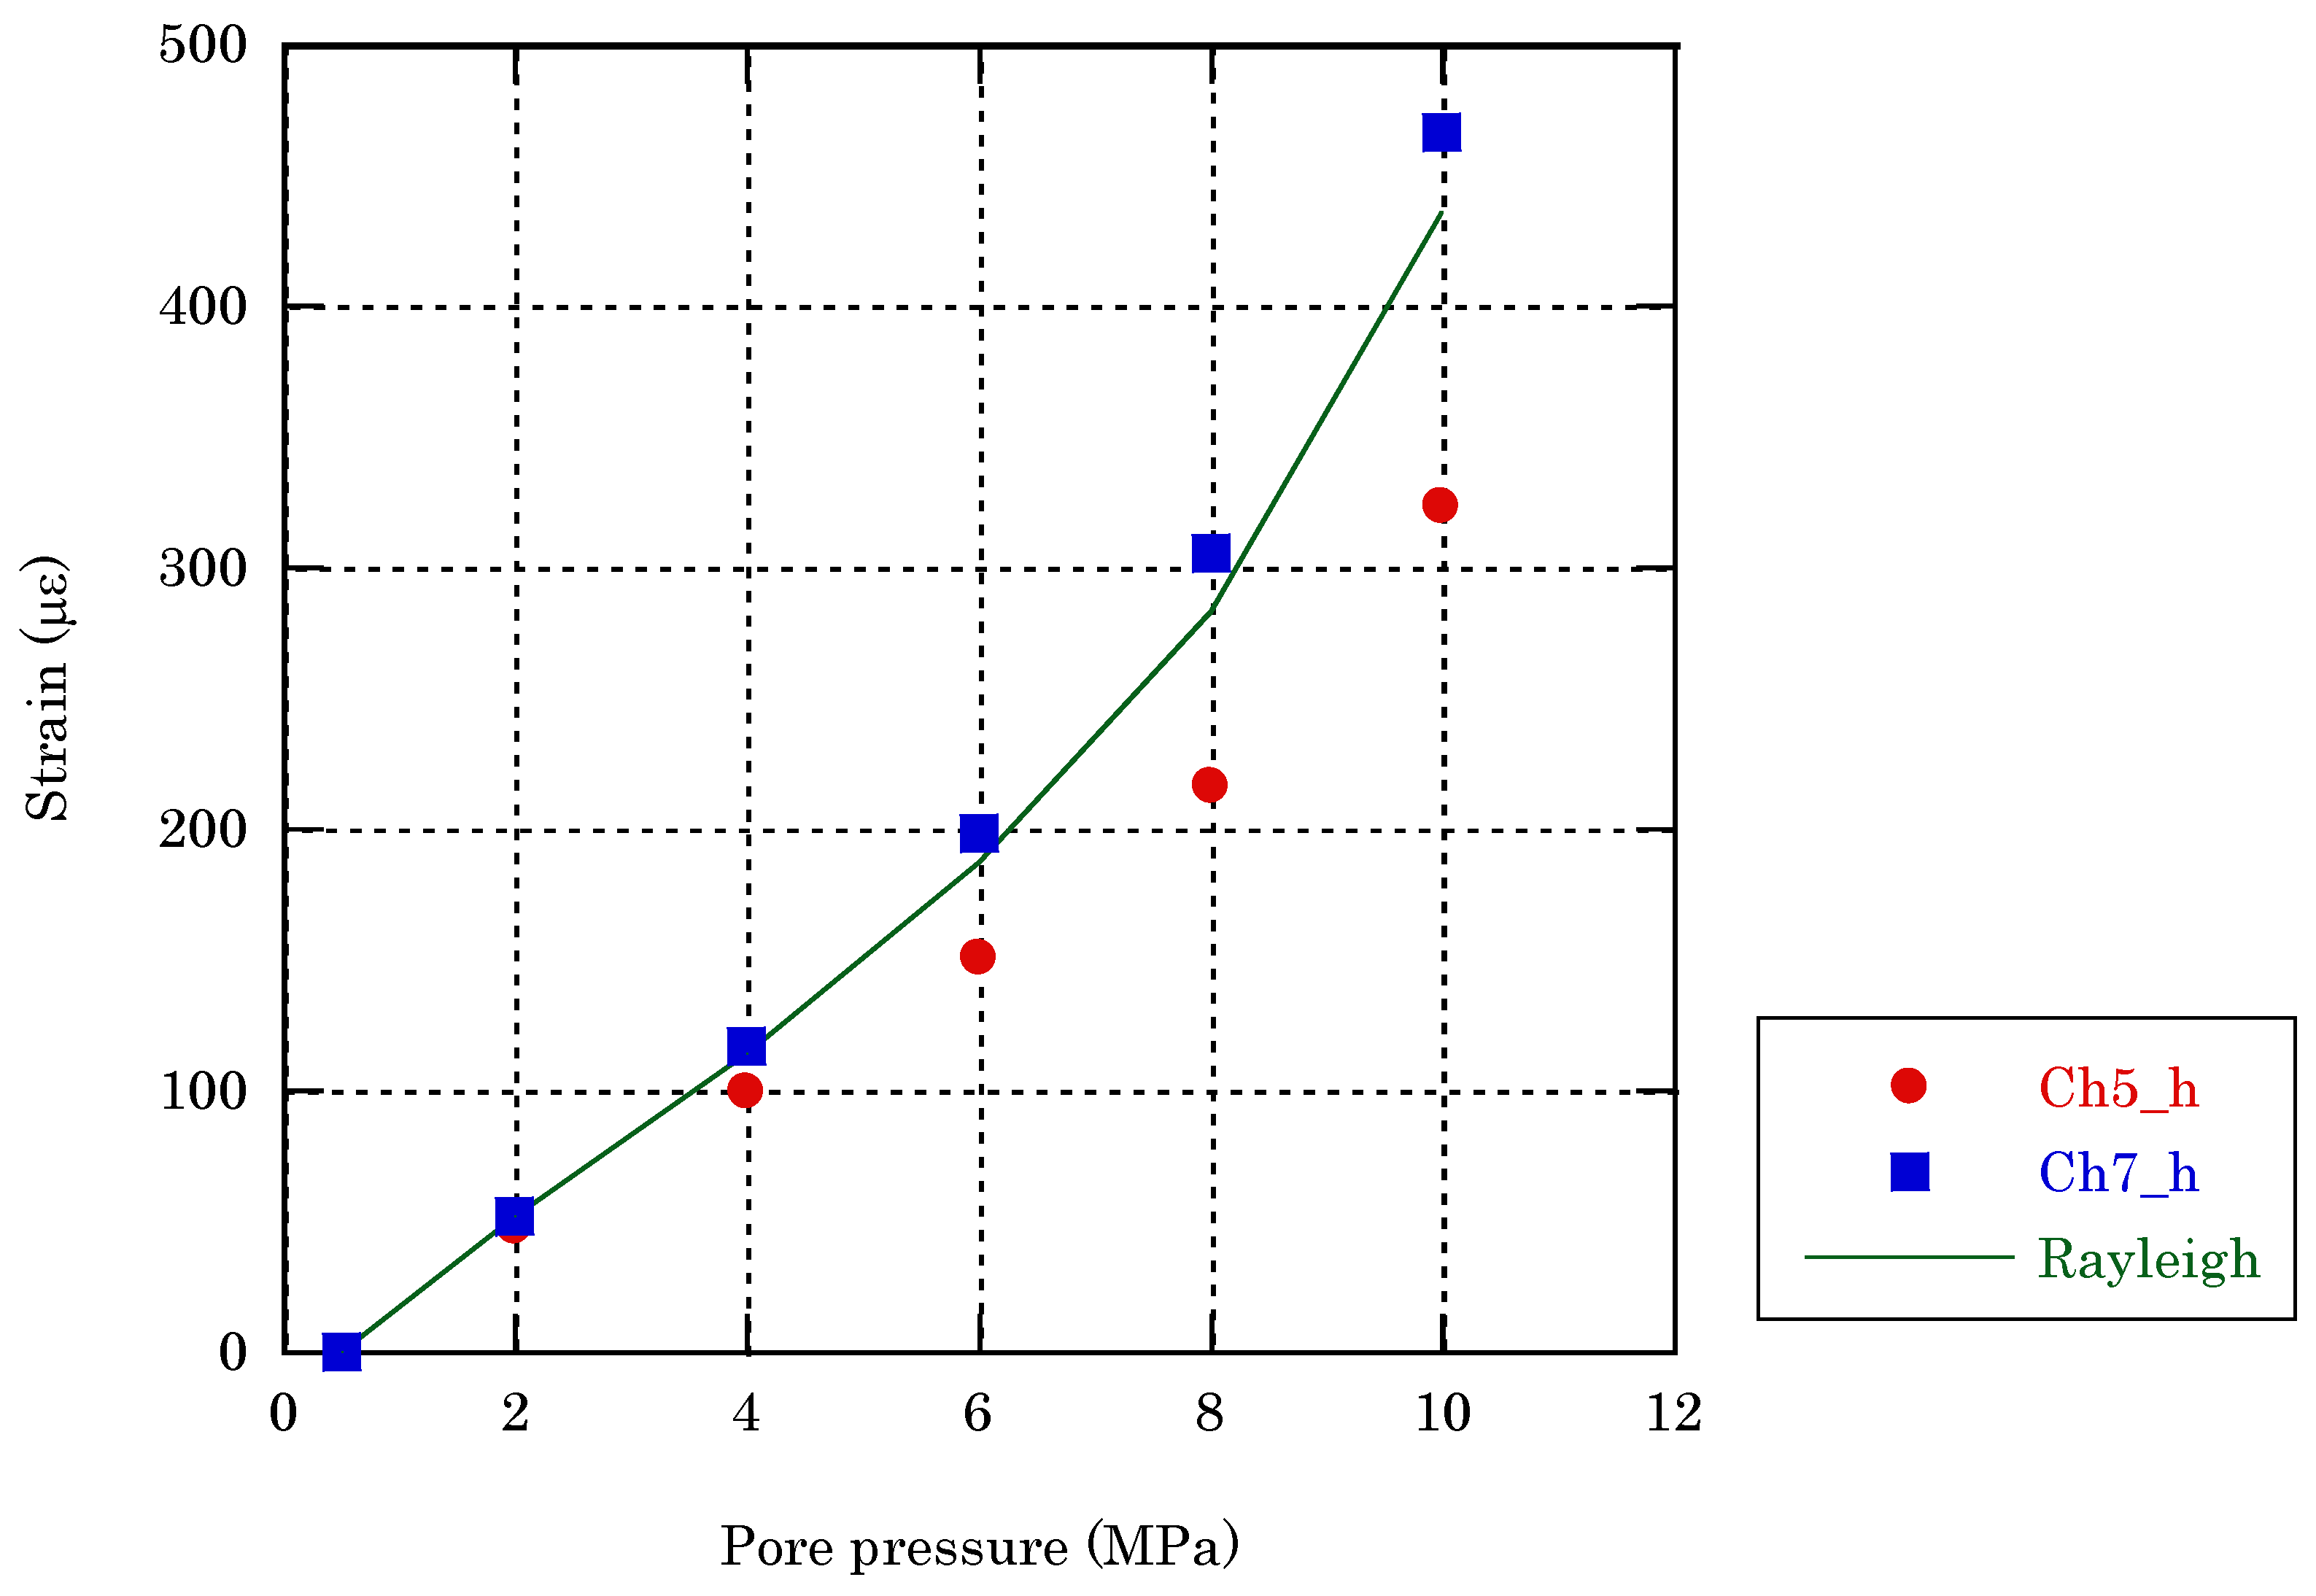
3.3.1. Strain Gauge Readings

For the Tako core the four strain gauges (eight strain channels) are located at two distinctive regions with different grain sizes (Figure 2b). Strain readings from six channels, i.e. Ch3, Ch5 and Ch7 along the optic fiber (hoop direction), and Ch4, Ch6 and Ch8 in vertical direction are obtained. Figure 11 and Figure 12 present the strain reading for the two stages respectively. As shown in Figure 11a, consistent readings are given by the three vertical strain channels at stage, regardless of their location (in coarse- or fine-grain region). Furthermore, the strains increase almost linearly with increasing confining pressure. Among the three hoop strain channels, Ch3 in the coarse-grain (I) region gives the largest strain, and Ch7 in the fine -grain (II) the lowest (Figure 11b). Unlike for the Berea core, the vertical strains are broadly comparable with the hoop strains (Ch3 and Ch5 in Figure 11b). On the other hand, the vertical strains at stage 2 are notably greater than the hoop strains in Figure 12.

3.3.2. Optic Fiber—Rayleigh Frequency Shift

Figure 13a presents the measured Rayleigh frequency shift at the Tako core with increasing confining pressure, displaying contrast trend along the optic fiber as it travels from the coarse (a–c) to fine-grain (c–d) region of the core, with greater variations in the coarse-grain than in the fine-grain region.
Figure 13b presents the Rayleigh frequency shift measurement with increasing pore pressure, showing the frequency shift reaching a peak at point b and a trough at point d. As with the Berea core, a comparatively more uniform response arising from increasing pore pressure than confining pressure is also observed here.

3.4. Distributed Fibre Optic Sensor vs. Strain Gauge
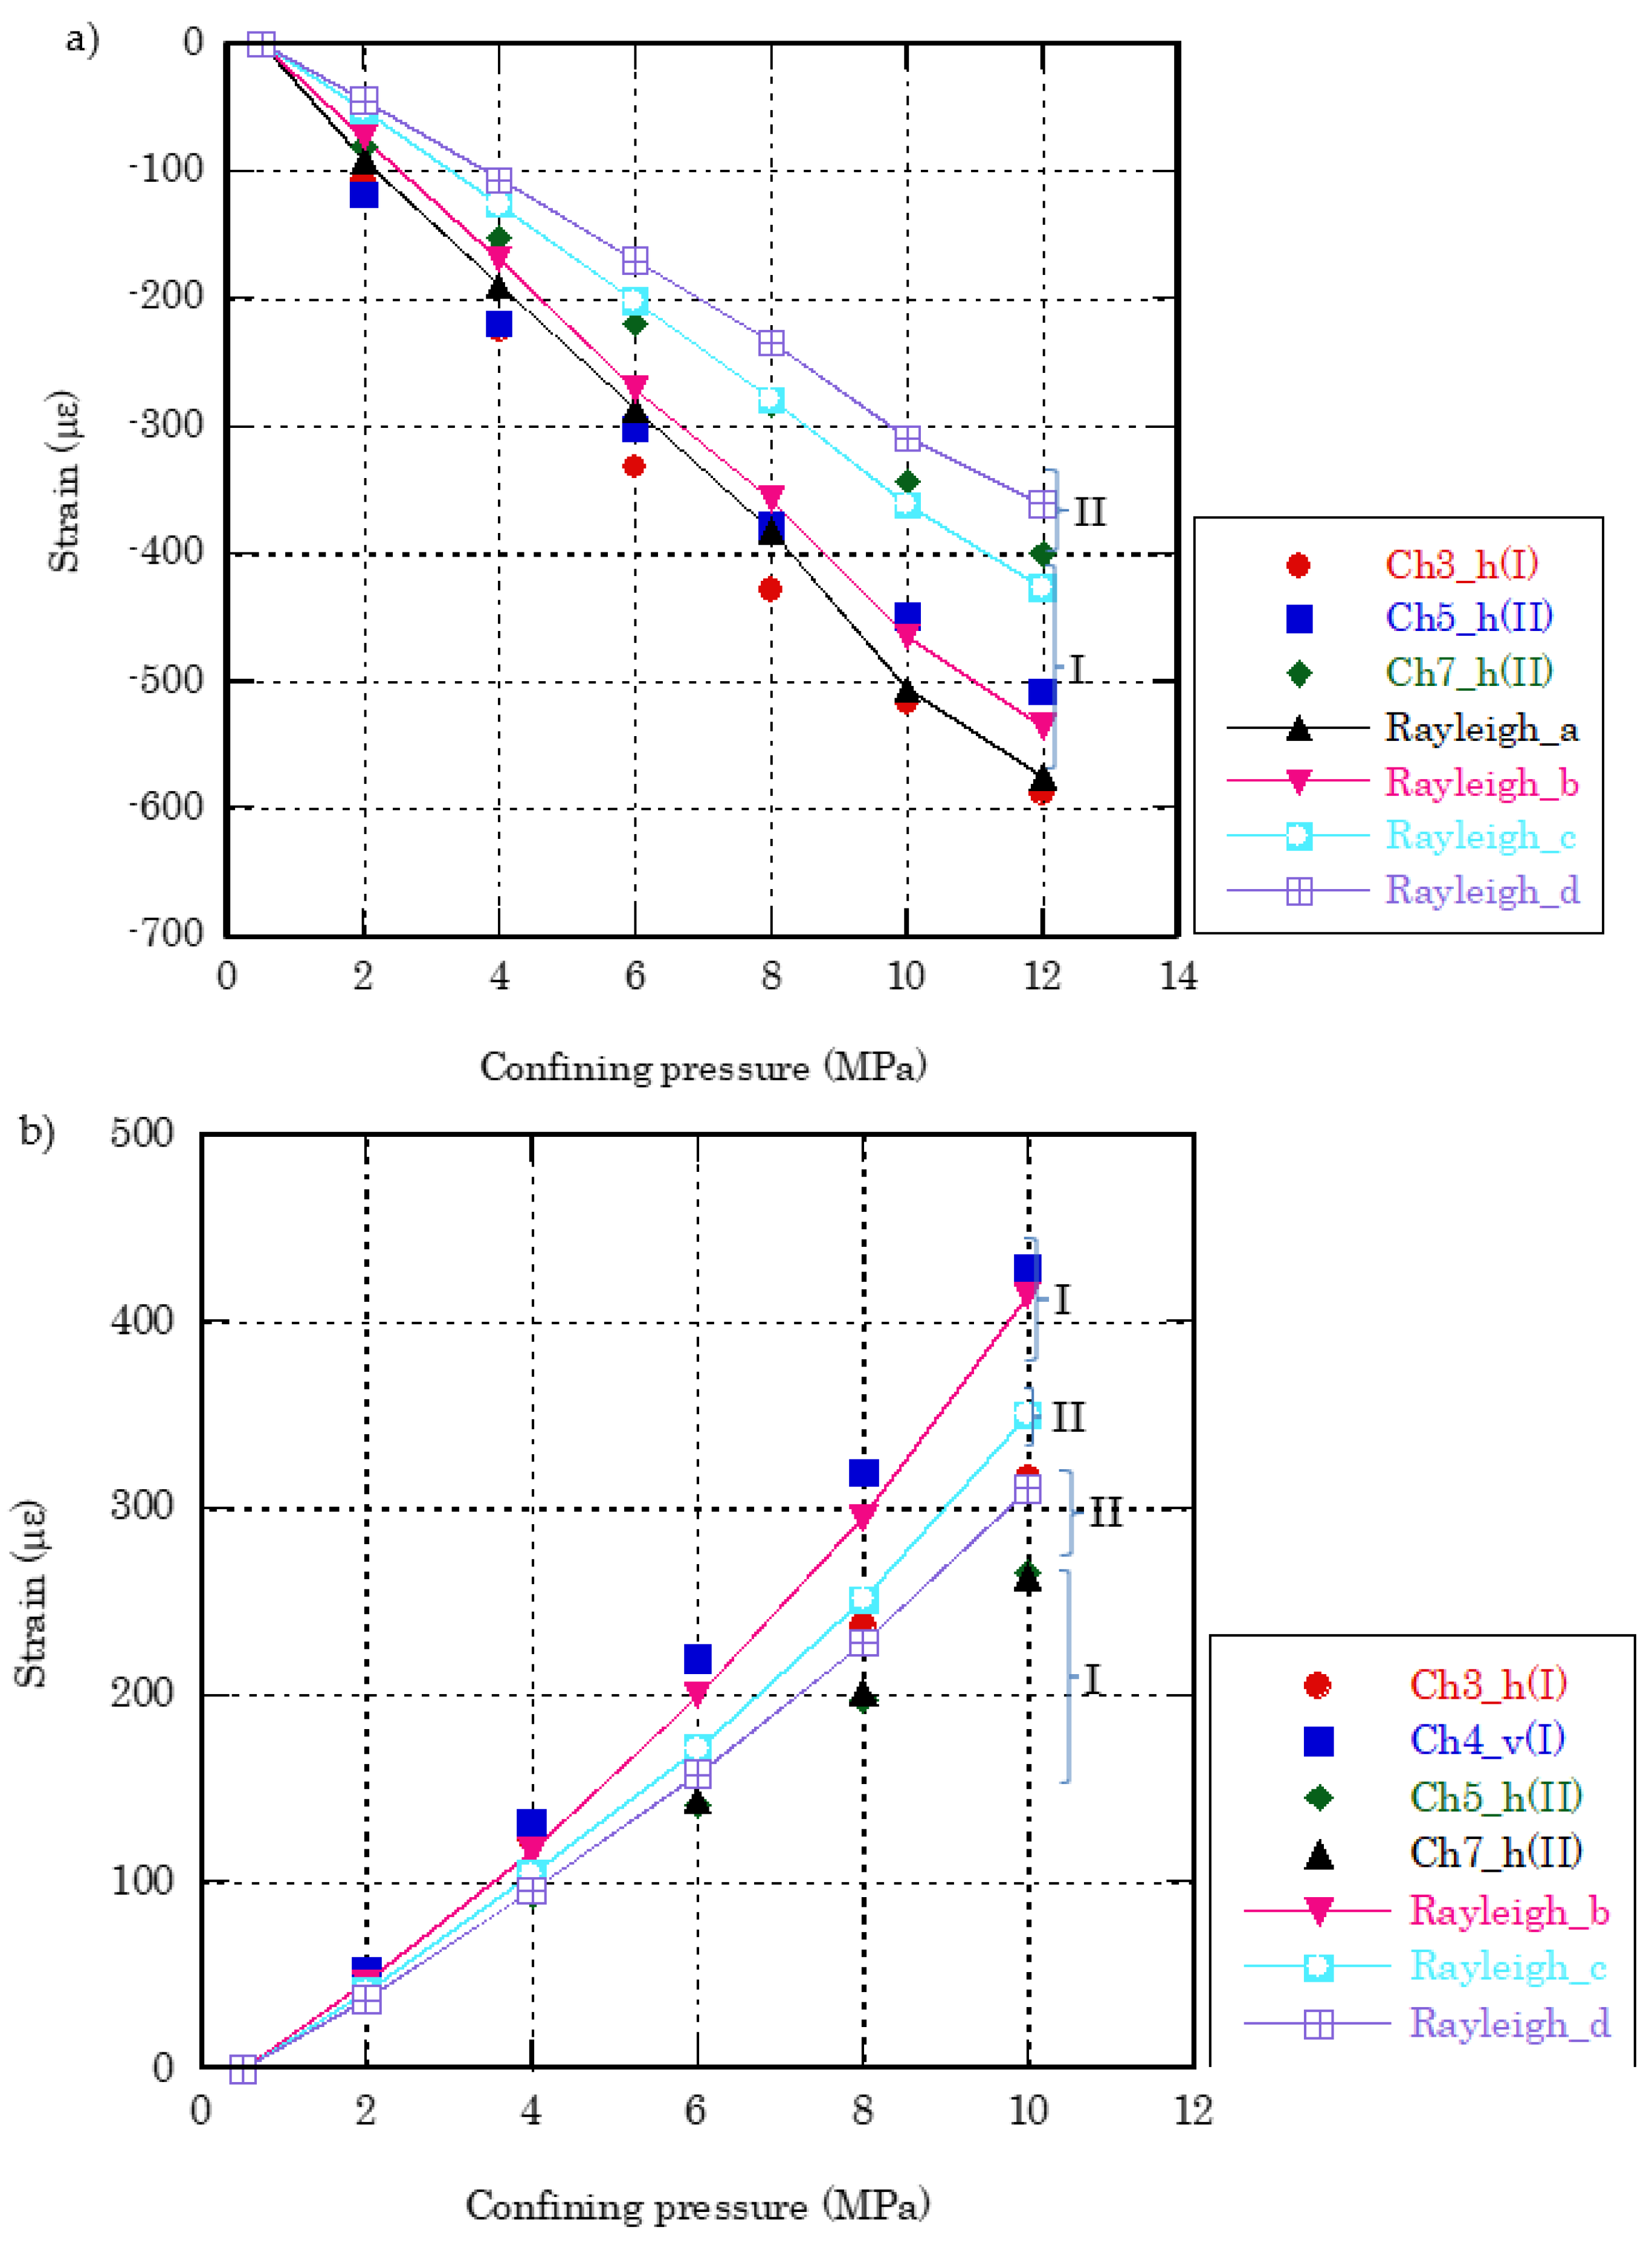
Conversion from Rayleigh and Brillouin frequency shift measurements to strain along the optic fiber have been studied [15,16]. The conversion coefficient has been found to be −6.452 με/GHz (−0.155 GHz/με) and 19.72 με/MHz (0.0507 με/MHz) for Rayleigh and Brillouin frequency respectively. Kogure et al. [14] argued that the induced radial strain needs also be considered in the conversion when hydrostatic pressure is applied during the measurement. Based upon the strain measurements carried out on several metals (with higher stiffness than the optic fiber, which is mainly Quartz), they proposed a formula which contains both the radial and longitude strains. In this study, it is noted that the baseline frequency shift values (sensor B) are much smaller than the corresponding rock-based measurements, especially for Rayleigh frequency shift, reflecting that the Berea/Tako sandstone is significantly less stiff than Quartz. It is, therefore, decided to use the simple coefficients for conversion calculation.

3.4.1. Berea Core

The converted strains from the Rayleigh/Brillouin frequency shift measurement are compared with the strain gauge readings from the two channels (Ch5 and Ch7) that are aligned with the optic fiber in Figure 14. In the figure, Rayleigh/Brillouin_4_8 refers to the mean value for monitoring points 4 and 8, which are closest to the strain Ch5 (Figure 2a). Similarly, Rayleigh/Brillouin_6_10 refers to the mean value for monitoring points 6 and 10, which are closest to the strain Ch7 (Figure 2b). It can be seen in Figure 14a that Rayleigh_6_10 agrees well with the strain reading by Ch7, whereas Rayleigh_4_8 starts to deviate from the strain reading by Ch5 as the confining pressure is increased above 4 MPa. The premature levelling-off of the strain by Ch5, as compared with Ch7, suggests that it has most likely suffered malfunction at higher confining pressures. In Figure 14b, the converted strains from Brillouin frequency shift are also much closer to the strain reading by Ch7, though the agreement is not as good compared with that for Rayleigh frequency shift.
Similarly, in Figure 15, the converted strains from Rayleigh frequency shift are in good agreement with the Ch7 strain reading with increasing pore pressure.

3.4.2. Tako Core

Recall in Figure 13a, the strains at points a and c represent the upper and lower bounds for the coarse-grain region (I), while those at points c and d approximately for the fine-grain region (II) at stage 1. Figure 16a presents the converted strains at the four points, compared with the hoop strain gauge readings. It can be seen that the three hoop strains generally fall within the overall converted strain range (between points a and d). Moreover, with the exception of Ch5, Ch3 (coarse-grain region) and Ch7 (fine-grain region) generally lie within their respective regions defined by the optic fiber measurement.
Similarly, in Figure 13b, the strains at points b and c represent the upper and lower bounds for the coarse-size region, while those at points c and d for the fine-size region at stage 2. Figure 16b presents the converted strains at the three points, compared with the hoop strain gauge readings. It can be seen that the three hoop strains only partially fall into the overall converted strain range (between b and d). Specifically, only Ch3 (coarse-grain region) lies within the overall range, but in the fine-grain instead of the coarse-grain region, with Ch5 and Ch7 lying somewhat below the converted strain range. To give an indication of where does the optic fiber strain measurement lie relative to the strain gauge readings, the vertical strain measured by Ch4 (which is greater than the hoop strains as shown in Figure 12 in the coarse-region is also plotted in Figure 16b for comparison. It can be seen that the optic fiber measured strains lie between the hoop and vertical strains by the strain gauges.

4. Concluding Remarks

In this study distributed optic fiber has been used to measure both Rayleigh and Brillouin frequency shift of two different sandstone core samples under increasing confining/pore pressure. Rayleigh frequency has been found to have a superior performance over Brillouin frequency in terms of better consistency (less scattering) in the tests carried out.
The strain gauge readings reveal considerable anisotropy in the stiffness of the Berea core between perpendicular (vertical) and parallel to the bedding (hoop) directions. The strains converted from Rayleigh frequency shift measurements agree reasonably well with readings by one of the four hoop strain gauge channels (Ch7) (the other three are damaged/malfunctioned during the test) under increasing confining/pore pressure. This has provided confidence that Rayleigh frequency shift is capable of measuring relatively homogeneous Berea sandstone strain with conventional strain gauge accuracy. Brillouin frequency measurement at stage 1, although being somewhat less accurate than Rayleigh frequency (using simple conversion coefficient), has further confirmed accuracy of the strain measurement by fiber optic (Rayleigh frequency) and the strain gauge.
In contrast to the Berea core, the Tako sandstone core is visibly heterogeneous with a coarse-grain and a fine-grain region. This contrast in the grain-size, and thus rock elastic properties, is clearly reflected in the hoop strain measurement by both strain gauges and distributed optic fiber. Interestingly, there appears to be much less variations in the vertical strain between the two regions, especially at stage 1. The outcomes of the test have demonstrated successfully the use of a single optic fiber for measuring rock strain response at different regions of a heterogeneous core sample along a continuous trajectory.
We successfully demonstrated the usefulness of distributed fiber optic sensing from our laboratory measurements. Strains measured by optic fiber with the heterogeneous sandstone suggest that optic fiber responded well to different lithology under pressure conditions. By deploying optic fiber cables behind well casing we can observe that which depth and how much deformation of formation and well casing formed in subsurface. The contiguous deformation data in depth provide important insight on tracking the uplifting ground movements at the CO2 injection operations.

Supplementary Materials

The following are available online at https://www.mdpi.com/2076-3417/8/11/2103/s1.

Author Contributions

Z.X. and Y.Y. designed the experiments and collected the data; Z.X. and J.-Q.S. prepared the manuscript; S.D. participated in the discussion with other authors on interpretation the experimental results.

Acknowledgments

This paper is based on results obtained from a project commissioned by the New Energy and Industrial Technology Development Organization (NEDO) and the Ministry of Economy, Trade and Industry (METI) of Japan.

Conflicts of Interest

The authors declare no conflict of interest.

References

  1. Onuma, T.; Ohkawa, S. Detection of surface deformation related with CO2 injection by DInSAR at In Salah, Algeria. Energy Procedia 2009, 1, 2177–2184. [Google Scholar] [CrossRef]
  2. Worth, K.; White, D.; Chalaturnyk, R.; Sorensen, J.; Hawkes, C.; Rostron, B.; Johnson, J.; Young, A. Aquistore project measurement, monitoring, and verification: from concept to CO2 injection. Energy Procedia 2014, 63, 3202–3208. [Google Scholar] [CrossRef]
  3. Yang, Q.; Zhao, W.; Dixon, T.; Amelung, F.; Han, W.; Li, P. InSAR monitoring of ground deformation due to CO2 injection at an enhanced oil recovery site, West Texas. Int. J. Greenh. Gas Control 2015, 41, 20–28. [Google Scholar] [CrossRef]
  4. Johnston, W.D.; Kaminow, I.P. Temperature dependence of Raman and Rayleigh scattering in LiNbO3 and LiTaO3. Phys. Rev. 1968, 168, 1045–1054. [Google Scholar] [CrossRef]
  5. Parker, T.R.; Farhadiroushan, M.; Handerek, V.A.; Rogers, A.J. Temperature and strain dependence of the power level and frequency of spontaneous Brillouin scattering in optical fibers. Opt. Lett. 1997, 22, 787–789. [Google Scholar] [CrossRef] [PubMed]
  6. Froggatt, M.; Moore, J. High-spatial resolution distributed strain measurements in optical fiber with Rayleigh scatter. Appl. Opt. 1998, 37, 1735–1740. [Google Scholar] [CrossRef] [PubMed]
  7. Barrias, A.; Casas, J.R.; Villalba, S. A review of distributed optical fiber sensors for civil engineering applications. Sensors 2016, 16, 748. [Google Scholar] [CrossRef] [PubMed] [Green Version]
  8. Kim, J.M.; Kim, C.M.; Choi, S.Y.; Lee, B.Y. Enhanced strain measurement range of an FBG sensor embedded in seven-wire steel strands. Sensors 2017, 17, 1654. [Google Scholar] [CrossRef] [PubMed]
  9. Drake, D.A.; Sullivan, R.W.; Wilson, J.C. Distributed strain sensing from different optical fiber configurations. Inventions 2018, 3, 67. [Google Scholar] [CrossRef]
  10. Becker, T.; Ziemann, O.; Engelbrecht, R.; Schmauss, B. Optical strain measurement with step-index polymer optical fiber based on the phase measurement of an intensity-modulated signal. Sensors 2018, 18, 2319. [Google Scholar] [CrossRef] [PubMed]
  11. Kishida, K.; Li, C.H.; Nishiguchi, K. Pulsed pre-pump method to achieve cm-order spatial resolution in Brillouin distributed measuring technique, Tech. Rep. IEICE 2004, 104, 15–20. [Google Scholar]
  12. Nishiguchi, K.; Kishida, K.; Li, C.H. Synthetic Approach for Brillouin Optical Time-Domain Reflectometry. In Proceedings of the 42nd ISCIE International Symposium on Stochastic Systems Theory and Applications, Okayama, Japan, 26–27 November 2010. [Google Scholar]
  13. Koyamada, Y. New technique for distributed strain measurement in optical fibers with very high sensitivity by making use of Rayleigh backscattering. Tech. Rep. IEICE OFT98-23, 21–25.
  14. Kogure, T.; Horiuchi, Y.; Kiyama, T.; Nishizawa, O.; Xue, Z.; Matsuoka, T. Fiber optic strain measurements using distributed sensor system under static pressure conditions. BUTSURI-TANSA 2015, 68, 23–38. [Google Scholar] [CrossRef]
  15. Yamauchi, Y. A Measurement Method to Determine Strain and Temperature Coefficients in Fiber Optic Sensors. In Proceedings of the Asia Pacific Workshop on Structural Health Monitoring (APWSHM), Tokyo, Japan, 30 November–2 December 2010. [Google Scholar]
  16. Kishida, K.; Li, C.H.; Nishiguchi, K.; Yamauchi, Y.; Guzik, A.; Tsuda, T. Hybrid Brillouin-Rayleigh distributed sensing system. SPIE 2012, 8421, G1–G4. [Google Scholar]
Figure 1. Brillouin time domain analysis (BOTDA) sensing scheme.
Applsci 08 02103 g001
Figure 2. A schematic showing the position of the four strain gauges in relation to the optic fiber (blue line): (a) Berea sandstone core; (b) Tako sandstone core. Also shown is the position of the selected points where the frequency shifts are monitored.
Applsci 08 02103 g002
Figure 3. A schematic diagram of the experimental setup.
Applsci 08 02103 g003
Figure 4. Berea core strain gauge measurements showing considerable differences between the vertical and hoop strains and a bi-linear increase in the strains with increasing confining pressure.
Applsci 08 02103 g004
Figure 5. (a) Rayleigh frequency shift measurements at different confining pressures: across the all three sensor regions; (b) close-up in the sensor region A (Berea core). The locations of a few selected monitoring points are marked.
Applsci 08 02103 g005
Figure 6. The mean value of Rayleigh frequency shift measurements at the 11 censoring points with increasing confining pressure, in comparison with the baseline value (sensor region B), for Berea core.
Applsci 08 02103 g006
Figure 7. Berea core Brillouin frequency measurements with increasing confining pressures. The locations of a few selected monitoring points are marked.
Applsci 08 02103 g007
Figure 8. The mean value of Brillouin frequency shift measurements at the 11 censoring points with increasing confining pressure; in comparison with the baseline value (sensor region B) for Berea core.
Applsci 08 02103 g008
Figure 9. Berea core strain gauge measurements showing considerable variations between the vertical and hoop strains and a largely piecewise increase in the strains with increasing pore pressure.
Applsci 08 02103 g009
Figure 10. Berea core Rayleigh frequency shift measurements in comparison with the baseline values (sensor region B).
Applsci 08 02103 g010
Figure 11. Tako core strain gauge readings at stage 1: (a) vertical strains; (b) hoop strains (with the dashed line representing the vertical strains). I—coarse-grain region; II—fine-grain region.
Applsci 08 02103 g011aApplsci 08 02103 g011b
Figure 12. Tako core strain gauge readings at stage 2 showing the vertical strains being notably higher than the hoop strains. I—coarse-grain region; II—fine-grain region.
Applsci 08 02103 g012
Figure 13. Tako core Rayleigh frequency shift measurements (a) showing clear trends in the two regions; (b) showing a comparatively more uniform response with increasing pore pressure.
Applsci 08 02103 g013
Figure 14. Frequency shift to strain conversions for Berea core vs. strain gauge measurements with increasing confining pressure. On a whole, the converted strains from both Rayleigh frequency shift (a) and Brillouin frequency shift (b) agree reasonably well with the strain gauge readings from Ch7.
Applsci 08 02103 g014aApplsci 08 02103 g014b
Figure 15. Rayleigh frequency shift-to strain conversions for Berea core vs. strain gauge measurements with increasing pore pressure. The converted strains agree reasonably well with the strain gauge readings from Ch7.
Applsci 08 02103 g015
Figure 16. Rayleigh frequency shift-to -strain conversions for the heterogeneous Tako core vs. hoop strain gauge measurements: (a) increasing confining pressure; (b) increasing pore pressure (including vertical strains by Ch4 in the coarse-region). I—coarse-grain region; II—fine-grain region.
Applsci 08 02103 g016
Table 1. Comparison of Brillouin and Rayleigh.
Brillouin-Based SensingRayleigh-Based Sensing
BOTDA
PPP-BOTDA
BOTDR
S-BOTDR
TW-COTDR
Double endSingleSingle
Minimum spatial resolution2 cm10 cm2 cm
Resolution5 με/0.5 °C5 με/0.5 °C0.5 με/0.05 °C
Measurement time5 s@2000 με40 s@10,000 με60 s/2000 με
Maximum measurement distance20 km@1 m20 km@1 m20 km@20 cm

