A Feasibility Study of Photoacoustic Detection of Hidden Dental Caries Using a Fiber-Based Imaging System


1
Graduate School of Biomedical Engineering, Tohoku University, 6-6-05 Aoba, Sendai 980-8579, Japan
2
Department of Oral Health Sciences, Graduate School, Tokyo Medical and Dental University, 1-5-45 Yushima, Bunkyo, Tokyo 113-8510, Japan
*
Author to whom correspondence should be addressed.
Appl. Sci. 2018, 8(4), 621; https://doi.org/10.3390/app8040621
Submission received: 9 March 2018
/
Revised: 8 April 2018
/
Accepted: 13 April 2018
/
Published: 17 April 2018
(This article belongs to the Special Issue Biomedical Photoacoustic and Thermoacoustic Imaging)
Abstract
:In this paper, the feasibility of an optical fiber-based photoacoustic imaging system for detecting caries lesions inside a tooth is examined. Models of hidden caries were prepared using a pigment with an absorption spectrum similar to that of real caries lesions, and the occlusal surface of the model teeth containing the pigment was irradiated with laser pulses with a wavelength of 532 nm. An examination of the frequency spectra of the emitted photoacoustic waves revealed that the spectra from simulated caries lesions included frequency components in the range of 0.5–1.2 MHz that were not seen in the spectra from healthy parts of the teeth. This indicates that hidden caries can be detected via a photoacoustic imaging technique. Accordingly, an imaging system for clinical applications was fabricated. It consists of a bundle of hollow-optical fibers for laser radiation and an acoustic probe that is attached to the tooth surface. Results of ex vivo imaging experiments using model teeth and an extracted tooth with hidden caries lesions show that relatively large caries lesions inside teeth that are not seen in visual inspections can be detected by focusing on the above frequency components of the photoacoustic waves.
1. Introduction
Hidden caries are dentin lesions that cannot be easily detected via visual inspection because the occlusal enamel appears normal or only minimally demineralized [1]. Even though hidden caries may be radiographically detected, X-ray radiation in routine examinations may sometimes cause side effects [1,2,3]. Therefore, a method substituting for or assisting radiography and enabling lesions inside teeth to be diagnosed from the occlusal surface is needed.
Photoacoustic imaging is one imaging method used to noninvasively observe the subsurface morphology of living bodies [4]. It detects ultrasonic waves generated by optical absorbing substances when they thermally expand after absorbing irradiated optical pulses [4]. The penetration depth of photoacoustic imaging is greater than that of purely optical imaging techniques, which are usually affected by the strong optical scattering of tissue. Furthermore, photoacoustic imaging retains the high spatial resolution of optical methods, which cannot be achieved by conventional ultrasound imaging.
Photoacoustic imaging has been used in a variety of applications, including the imaging of blood vessels [5], brain functions [6], and other uses [7,8,9]. Several groups have reportedly applied the photoacoustic method to the diagnosis of dental caries. Wang et al. used an ultraviolet laser light that is strongly absorbed by enamel to generate surface acoustic waves and optically measured the elasticity of the enamel layer [10]. Blodgett used pulsed CO2 and Nd:YAG lasers for excitation and detected photoacoustic waves using an optical interferometer [11]. Sampathkumar et al. used 1064-nm and 532-nm Nd:YAG lasers for excitation and an interferometer based on a 532-nm laser light for detection and successfully obtained photoacoustic signals [12,13]. These photoacoustic systems have primarily been used for the detection of early caries formed on the enamel surface. Conversely, Cheng et al. applied photoacoustic tomography to detect caries lesions [14]. In their experiments, a 532-nm Nd:YAG laser irradiated the occlusal surface of an extracted tooth sample and an ultrasonic transducer rotated around the sample. Even though they successfully obtained tomographic images via reconstruction calculations, the scanning of the transducer may be difficult for in vivo applications. Li et al. performed simulations to estimate changes in the temperature and pressure when dental tissues were irradiated with laser light. The results showed that those changes were in a margin of safety when applying photoacoustic method to clinical applications [15]. El-Sharkawy et al. reported that they differentiated optically-induced surface acoustic waves from caries and normal parts by using a system based on Michelson interferometer [16,17]. Kim et al. found that the intensities of photoacoustic waves induced by visible and near-infrared lasers were different in the degree of progress of dental caries [18]. These reports have shown the feasibility of the photoacoustic detection of dental caries; however, these methods have not been applied to the detection of hidden caries. Optical coherence tomography is also emerging as an optical method for detection of early dental caries. However, the method has a limitation in the imaging depth for detection of hidden caries lesions [19,20,21].
The aim of the work reported in this article is to test the feasibility of a photoacoustic method for the detection of hidden caries. For this purpose, we propose a photoacoustic imaging system for in vivo applications.
2. Materials and Methods
2.1. Ethics Considerations
The extracted human teeth samples were donated by various individuals without identifiers. Our research protocol was approved by the ethical committee of Tohoku University on the Use of Humans as Experimental Subjects.
2.2. Sample Preparation
We first performed experiments using extracted human teeth with simulated hidden caries to investigate differences in the photoacoustic waves obtained from caries at different depths and with different sizes. We chose six extracted molar teeth samples without caries or colored spots on the occlusal surface so as not to generate photoacoustic waves at the surface. Each sample was cut at the border of the crown and the root, as shown in Figure 1, and in each we drilled a hole that reached the boundary between the dentin and the enamel. Then, we placed a brown pigment inside the hole to simulate a caries lesion formed inside a tooth and dried the pigment for approximately 15 min. It has been confirmed that the absorption spectrum of the pigment coincides well with that of caries lesions [22]. Although the structure of the simulated hidden caries lesion is different from that of real hidden caries lesions, from the viewpoint of photoacoustic wave generation, this model well simulates real caries lesions. This is because laser light is absorbed only at the boundary between the enamel layer and the cavity and this generates photoacoustic wave.
2.3. Photoacoustic Detection of Simulated Hidden Caries
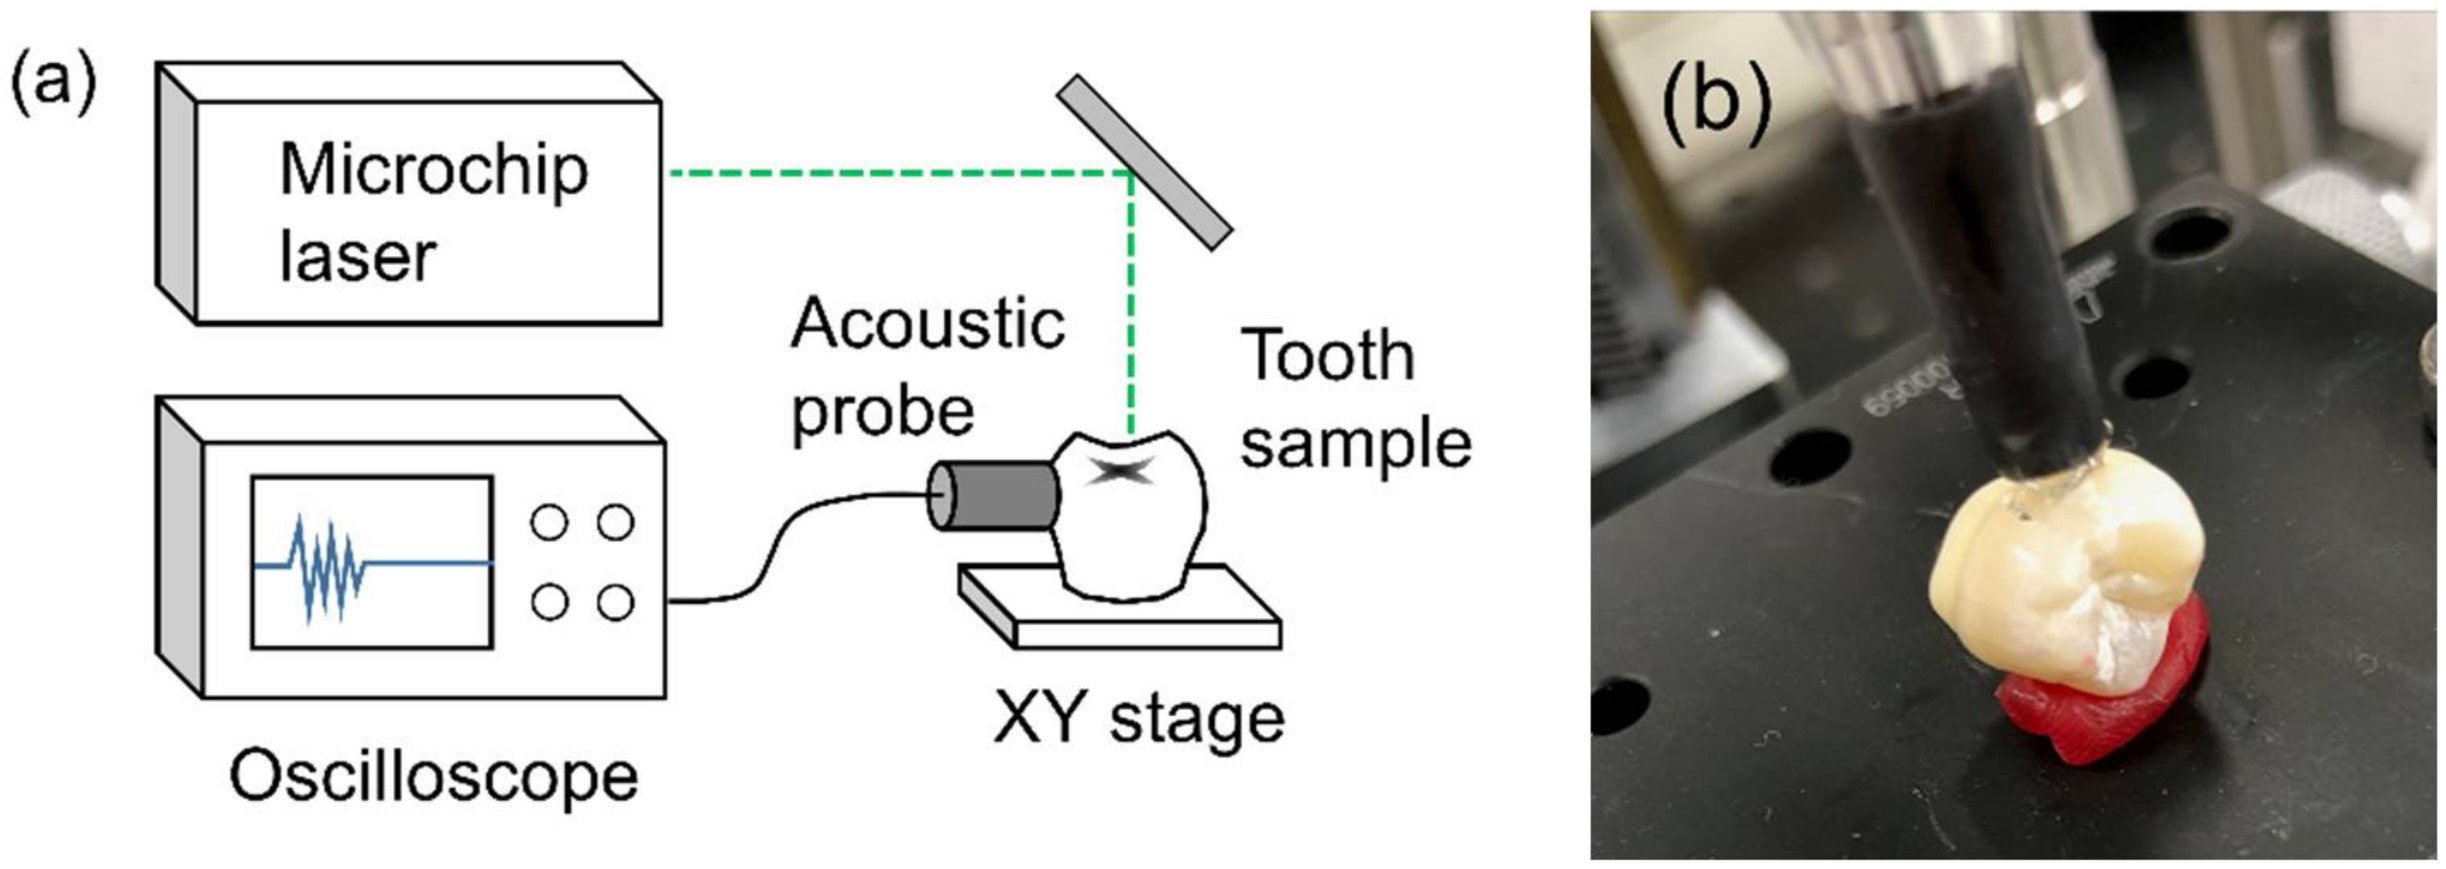
We performed experiments to show the possibility of detecting hidden caries photoacoustically using the setup shown in Figure 2a. We chose a laser wavelength of 532 nm, which provides strong photoacoustic signals due to its high absorption in caries lesions [22].
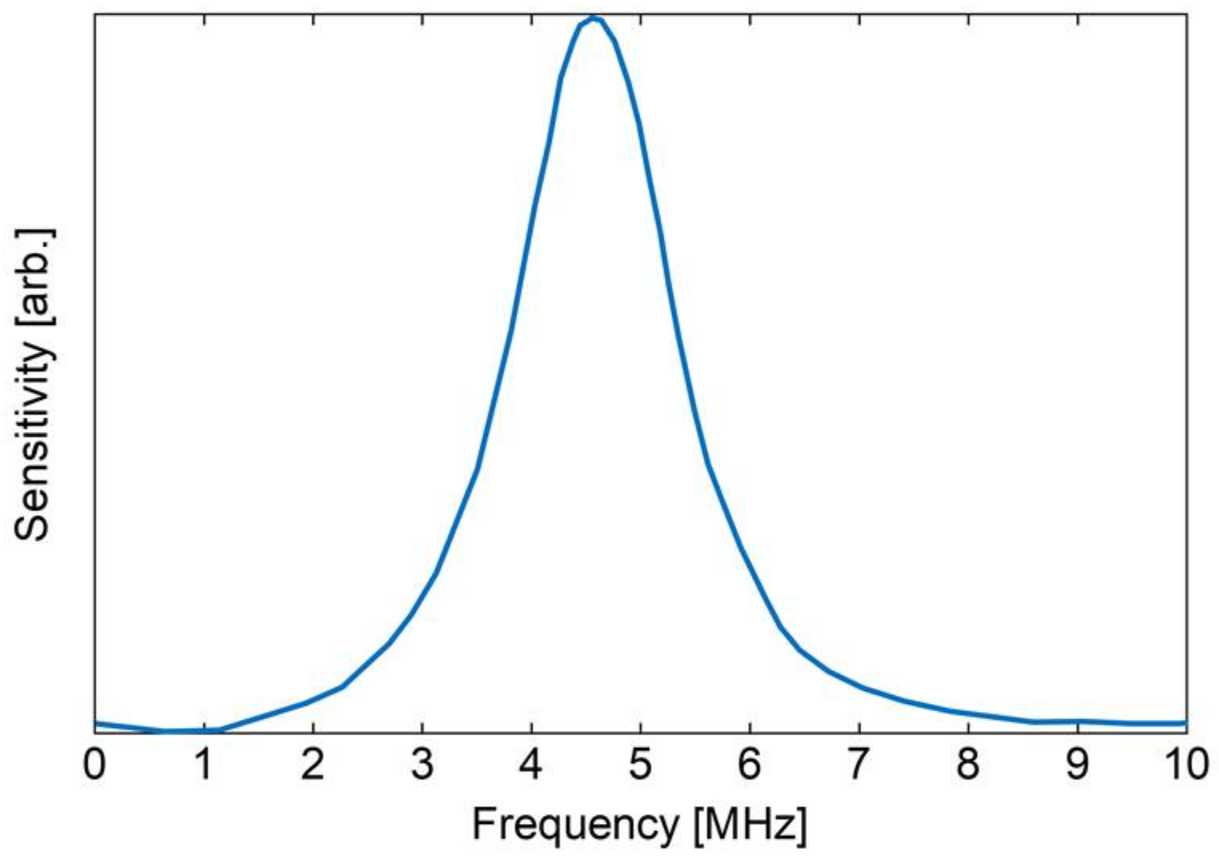
In our system, a composite ultrasonic probe with a soft polymer coating (Soft Probe, JAPAN PROBE, Yokohama, Japan) was used. We used the same system for the detection of blood inside dental root canals and have demonstrated the feasibility of the system for analyses of tissues inside teeth [9]. In our experiment, the soft probe was attached to the surface of the tooth crown, as shown in Figure 2b. Figure 3 shows the spectral sensitivity of the probe used in our experiments. It covered the frequency region of approximately 2.5–7 MHz with a central frequency of 4.6 MHz.
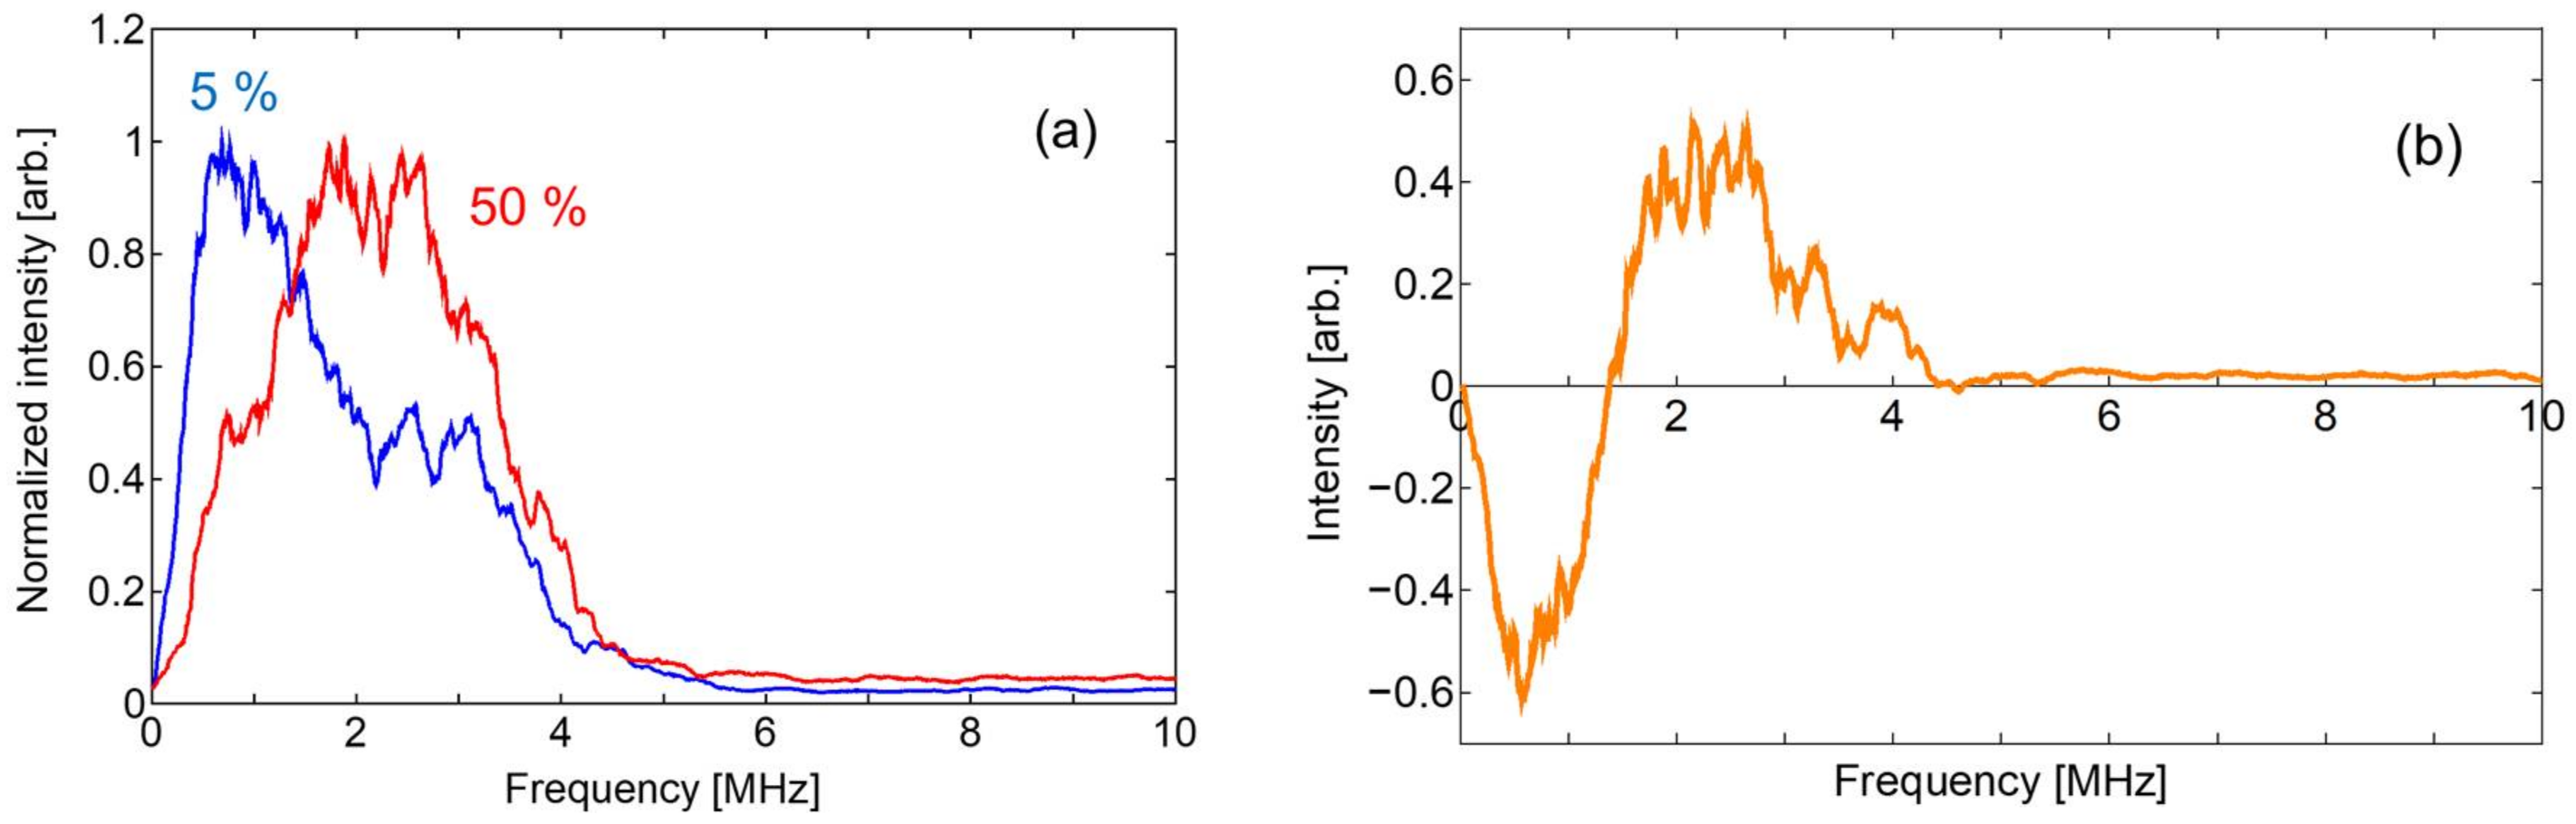
The composite structure of the polymer and piezoceramic materials that were used in the ultrasonic probe might cause nonlinearity in the frequency responses. To test the nonlinearity of the probe, we prepared liquid samples with different absorbances using a black ink that strongly absorbs the green laser light. Samples with concentrations of 5% and 50% in a glass cell were irradiated with 532-nm laser light to induce photoacoustic waves.
2.4. Imaging System
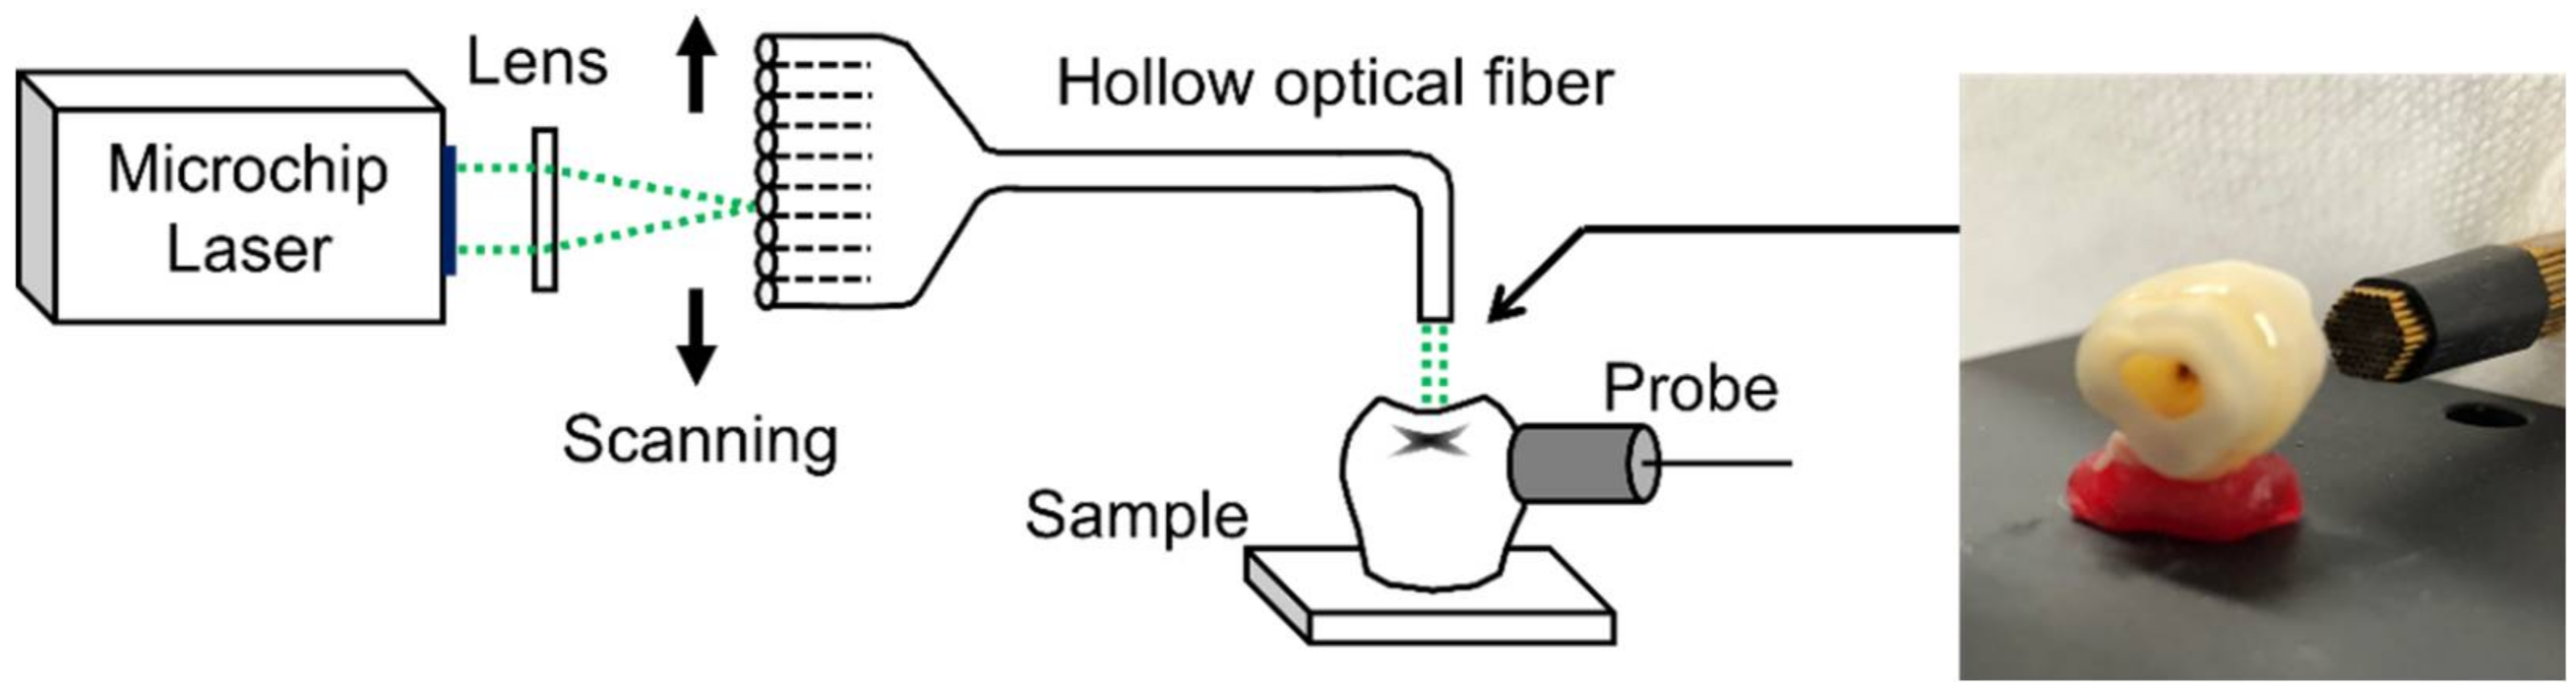
We developed a laser scanning system using a bundle of flexible hollow-optical fibers for photoacoustic imaging [23], and a schematic of the photoacoustic imaging system using the fiber probe is shown in Figure 4. The input ends of the hollow-optical fibers in the bundled probe are aligned, and therefore one can scan the laser beam using a simple linear stage at the input end. Another advantage of this probe is that a nearly parallel output beam is obtained from the hollow-optical fiber whose numerical aperture is usually very small (typically approximately 0.05). Therefore, no lens system is necessary at the output end of the probe, and this allows the probe to be thin and flexible. The probe was composed of 91 hollow-optical fibers, with an inner diameter of 320 μm and a length of 40 cm, which are bundled in a hexagonal close-packed structure. Due to the flexibility of the fiber bundle, it can be easily introduced into the oral cavity and applied to any tooth orientations. The pulse energy emitted from the fiber was 0.4 mJ with a repetition rate of 100 Hz, and the beam spot diameter was approximately 0.3 mm.
3. Results
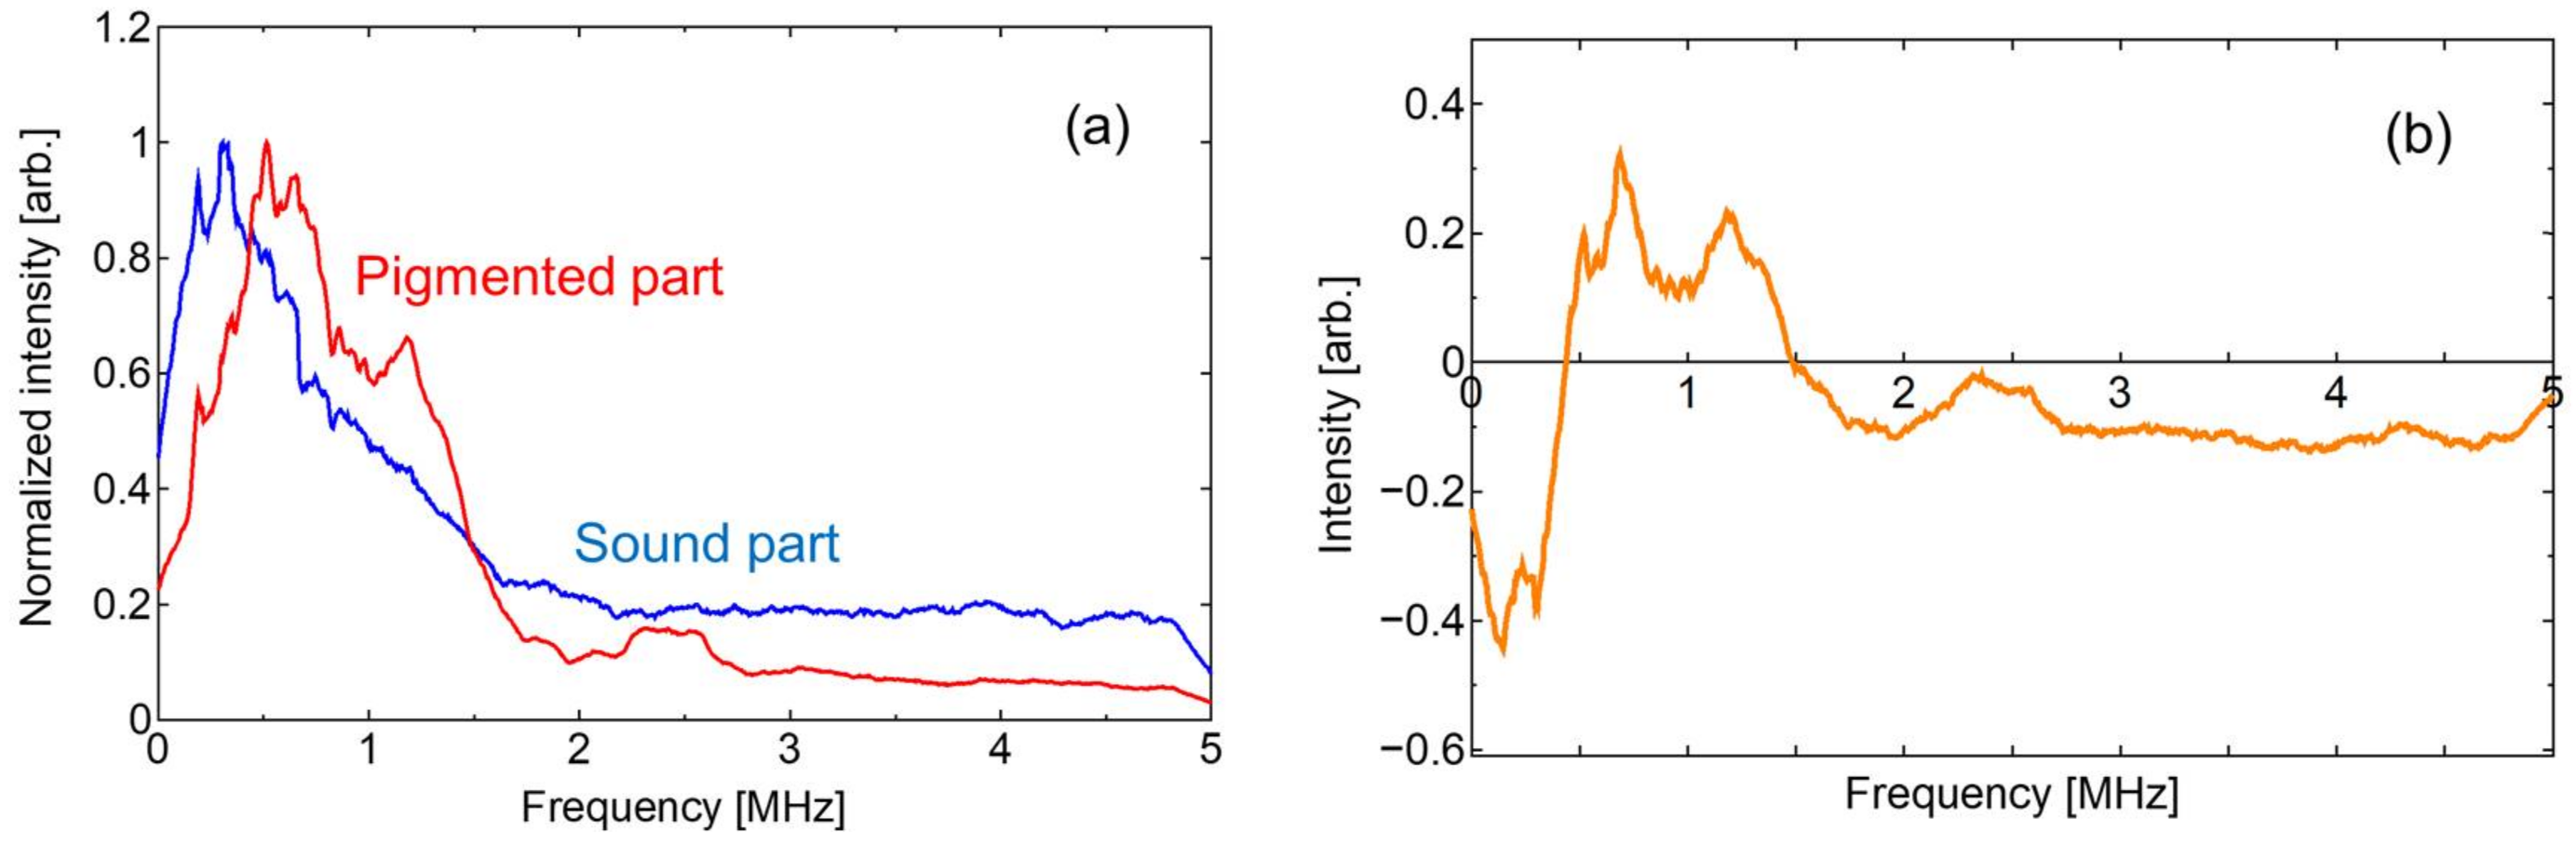
In our preliminary experiments, we found that the intensities of the photoacoustic signals varied with the surface conditions of the sample surface. Therefore, we tried to distinguish between caries and healthy (normal) parts of teeth using not the intensity but the shape of the frequency spectra of the photoacoustic signals. Figure 5a shows the frequency spectra of normal and pigmented parts of a tooth calculated from the waveforms obtained from the simulated caries inside the tooth and the normal part. To suppress the effect of noise, we calculated the centered moving average values and these curves were normalized to the peak intensity. The difference between the intensities of the normalized frequency spectra from caries and the normal part was calculated and the result is shown in Figure 5b, which shows that the difference spectrum has positive values from 0.5 MHz to 1.5 MHz.
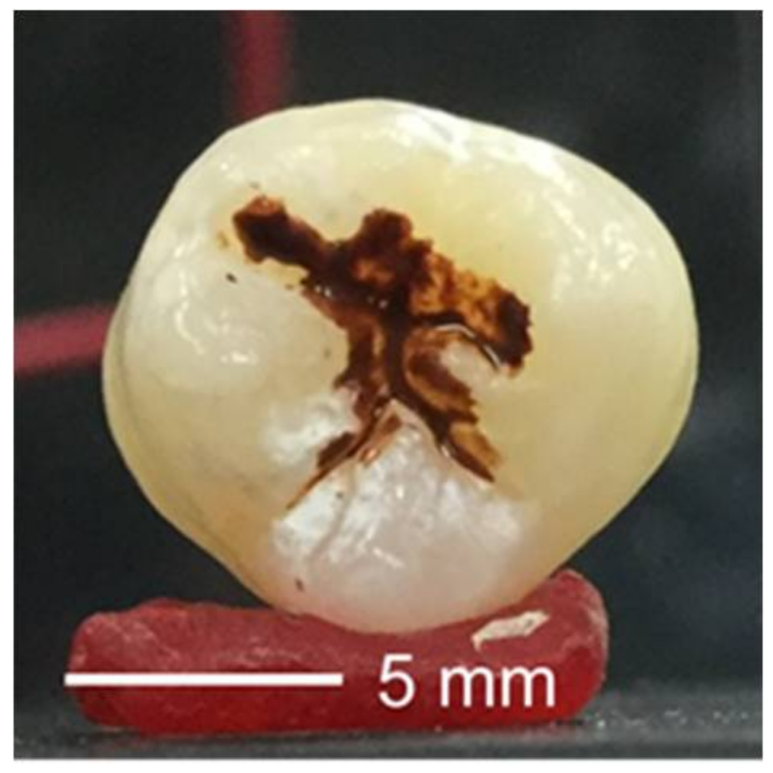
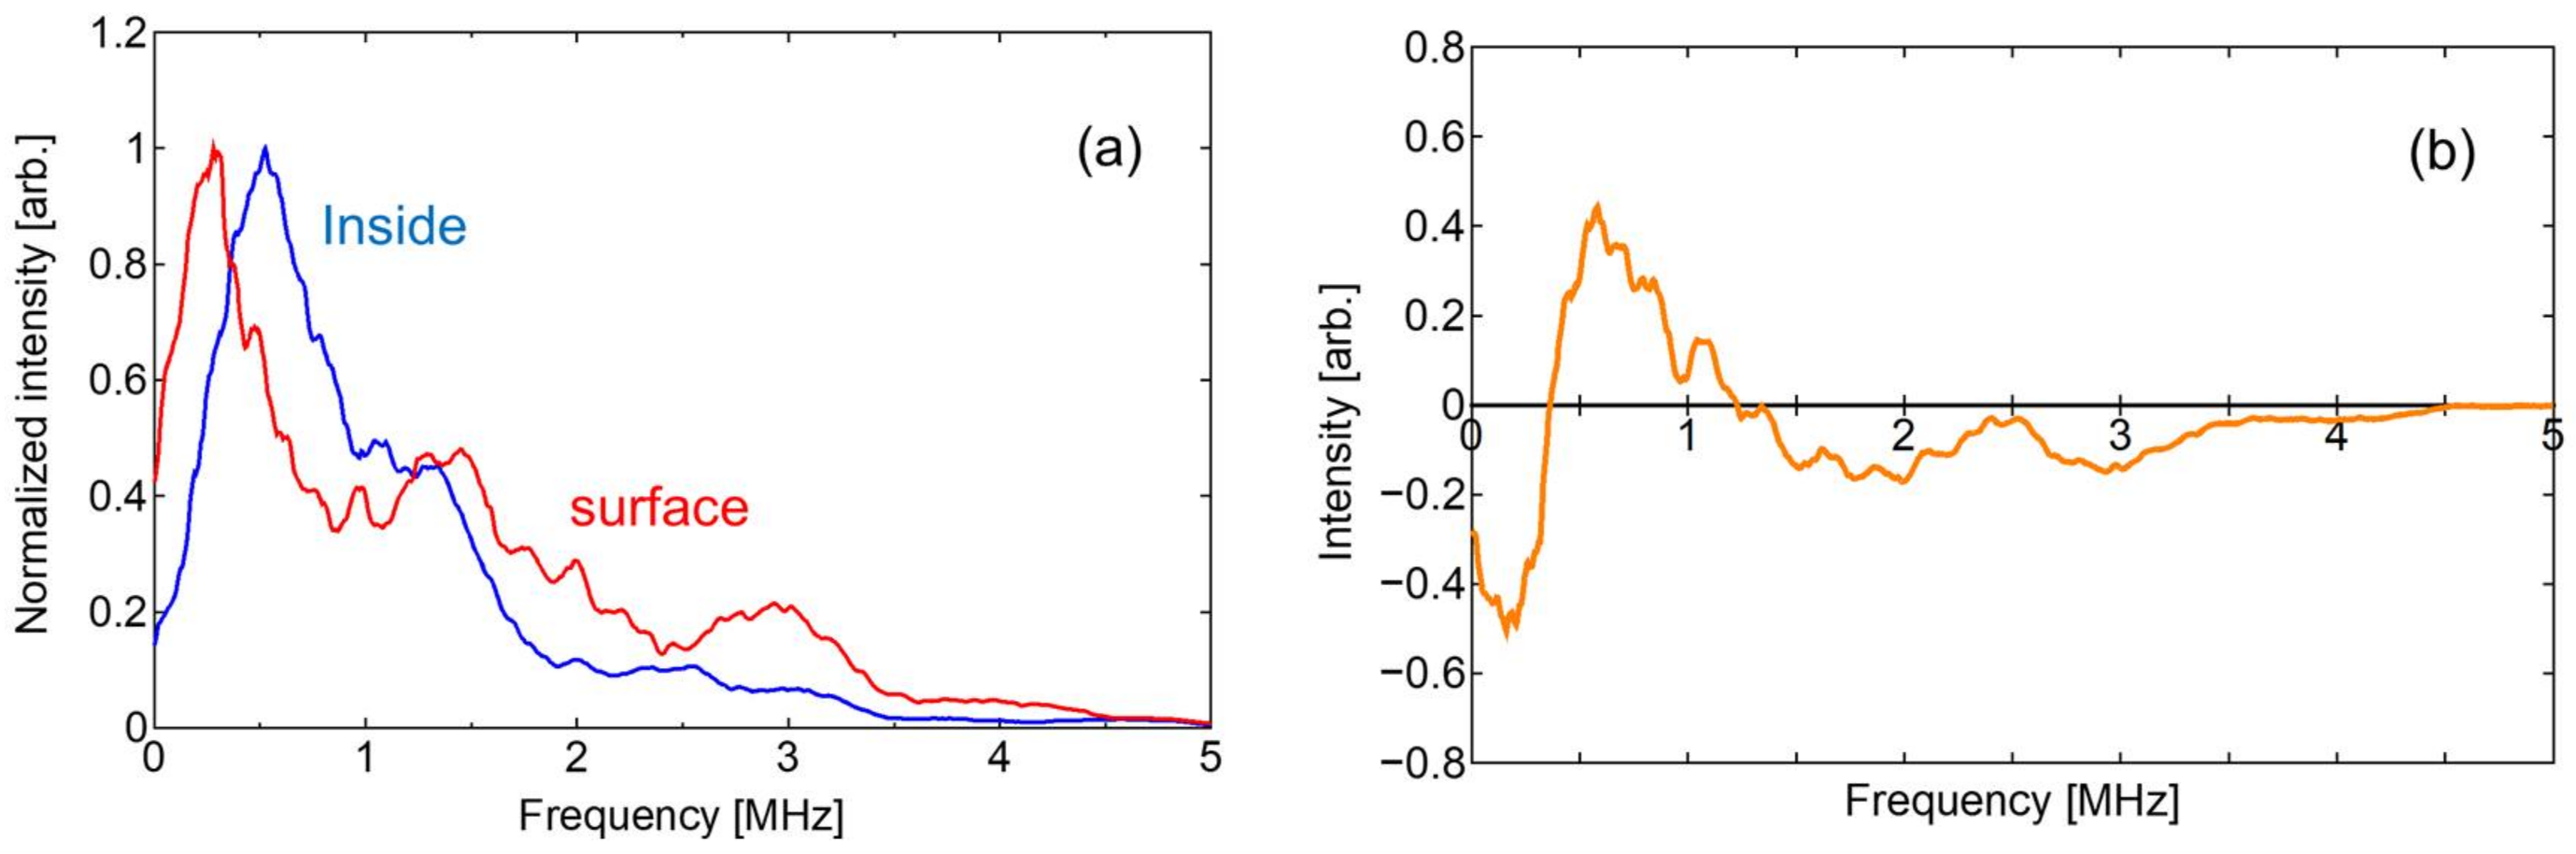
In addition, we investigated the effects of stains or caries on the occlusal surface by comparing the frequency spectra generated in simulated caries lesions inside the teeth with those generated at occlusal surfaces colored with the pigment. Figure 6 shows an appearance of occlusal surface stained with the pigment. Figure 7a shows the frequency spectra from the pigment inside the teeth and the stained occlusal surface. The difference between these spectra is shown in Figure 7b, which indicates that the frequency components between 0.4 MHz and 1.2 MHz are higher in the waves from the caries lesions inside the teeth.
Figure 8a shows the frequency spectra of the photoacoustic signals obtained from the 5% and 50% liquid samples with black inks. In the spectrum of the 5% concentration liquid, there is a peak at approximately 1 MHz with a spread to 4 MHz. The peak shifted to 2 MHz in the 50% liquid and the broad peak spanned 5 MHz. As shown in the differential spectrum in Figure 8b, the difference had negative values in the range of 0–1.5 MHz and became positive in the range of 1.5–4.5 MHz.
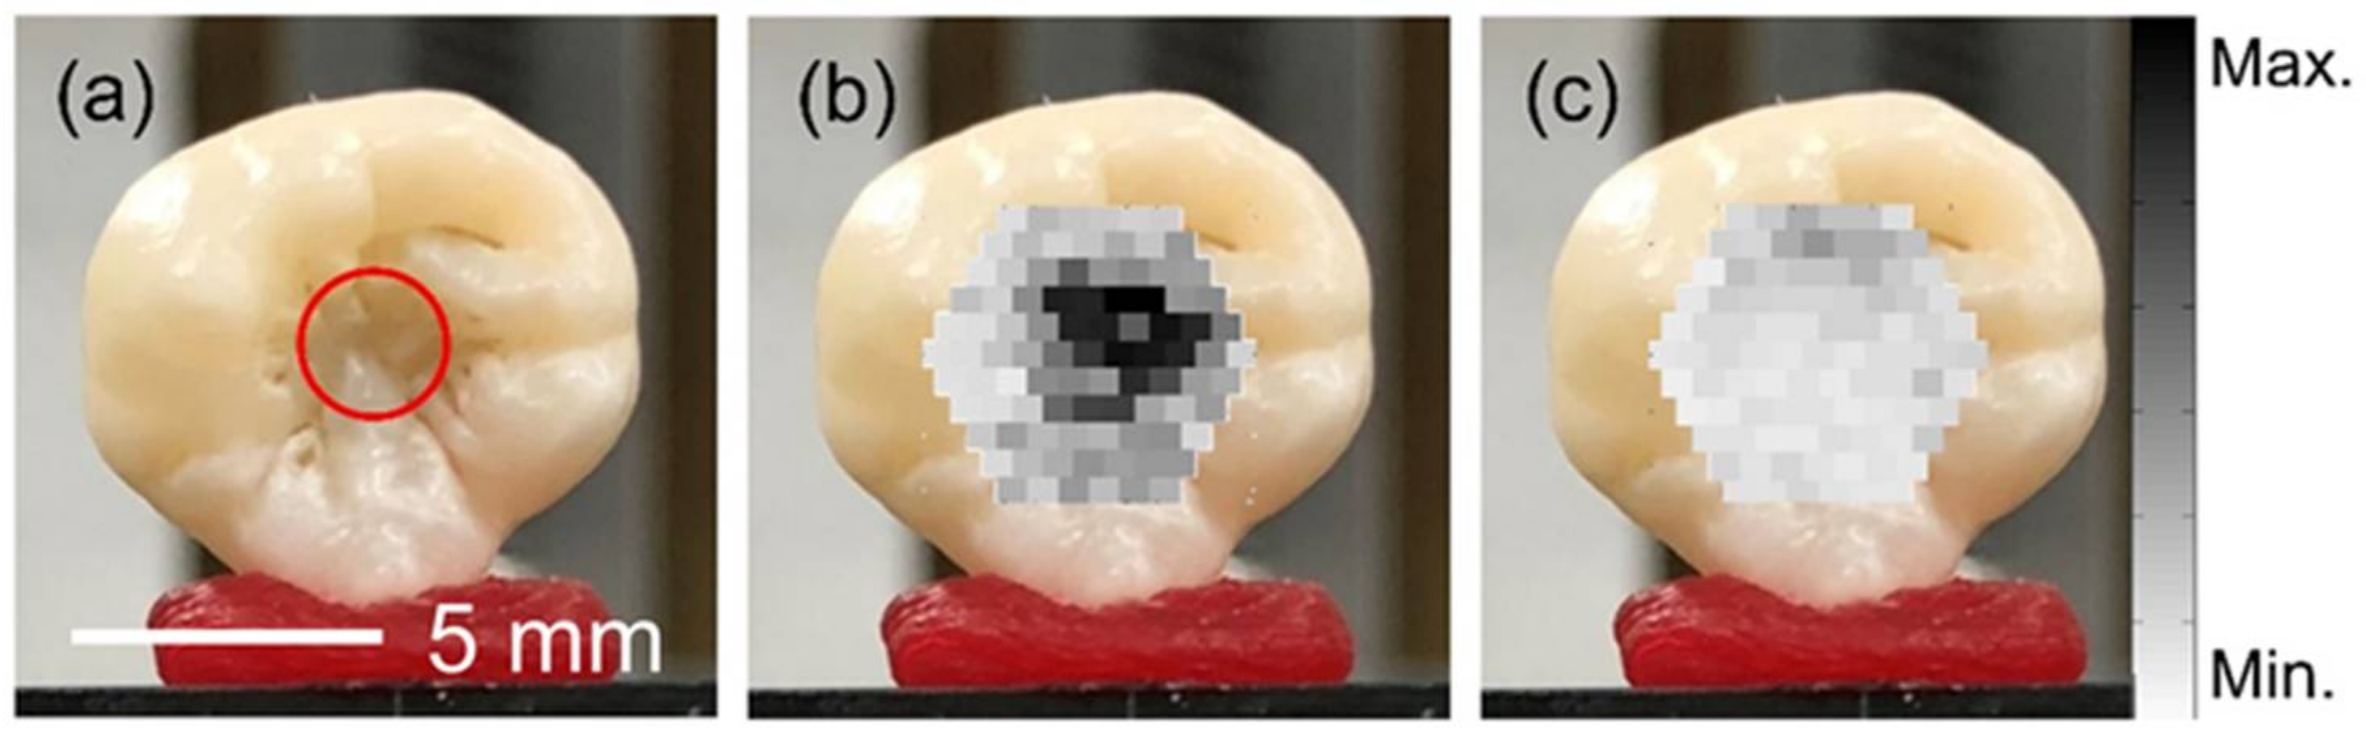
We applied this method to the imaging of simulated hidden caries, and the result is shown in Figure 9. In this experiment, the detected frequency spectra were integrated in the region from 0.5 MHz to 1.2 MHz and the integrated intensities were plotted so that darker spots showed stronger signals. In the experiments, laser light scattered from the dental tissue sometimes hits the acoustic probe directly and the photoacoustic waves from the probe itself are observed. We investigated waveforms with this type of noise and found that acoustic waves from the probe were not observed more than 1.5 μs after the laser radiation. Therefore, we analyzed the waveforms by only focusing on the signals after 1.5 μs.
Figure 9a shows the appearance of a sample with simulated caries formed 1.5 mm below the enamel surface. The diameter of the simulated caries was 2.5 mm. It was confirmed that no visible dark spot was observed on the enamel surface. Figure 9b shows a photoacoustic image of the same sample obtained using our proposed system. One can see that the simulated caries inside the tooth is clearly observed and that the size of the dark spot is the same as the size of the simulated caries. Figure 9c shows a photoacoustic image of the same tooth sample before applying the pigment.
In addition, we performed photoacoustic imaging experiments using model teeth with simulated caries of different sizes and depths. Figure 10a shows images of a model tooth with a simulated caries 1.2 mm in diameter at a depth of 0.9 mm. Figure 10b shows images of simulated caries 1.2 mm in diameter at a depth of 1.9 mm. Figure 10c shows images of simulated caries 0.5 mm in diameter at a depth of 0.9 mm.
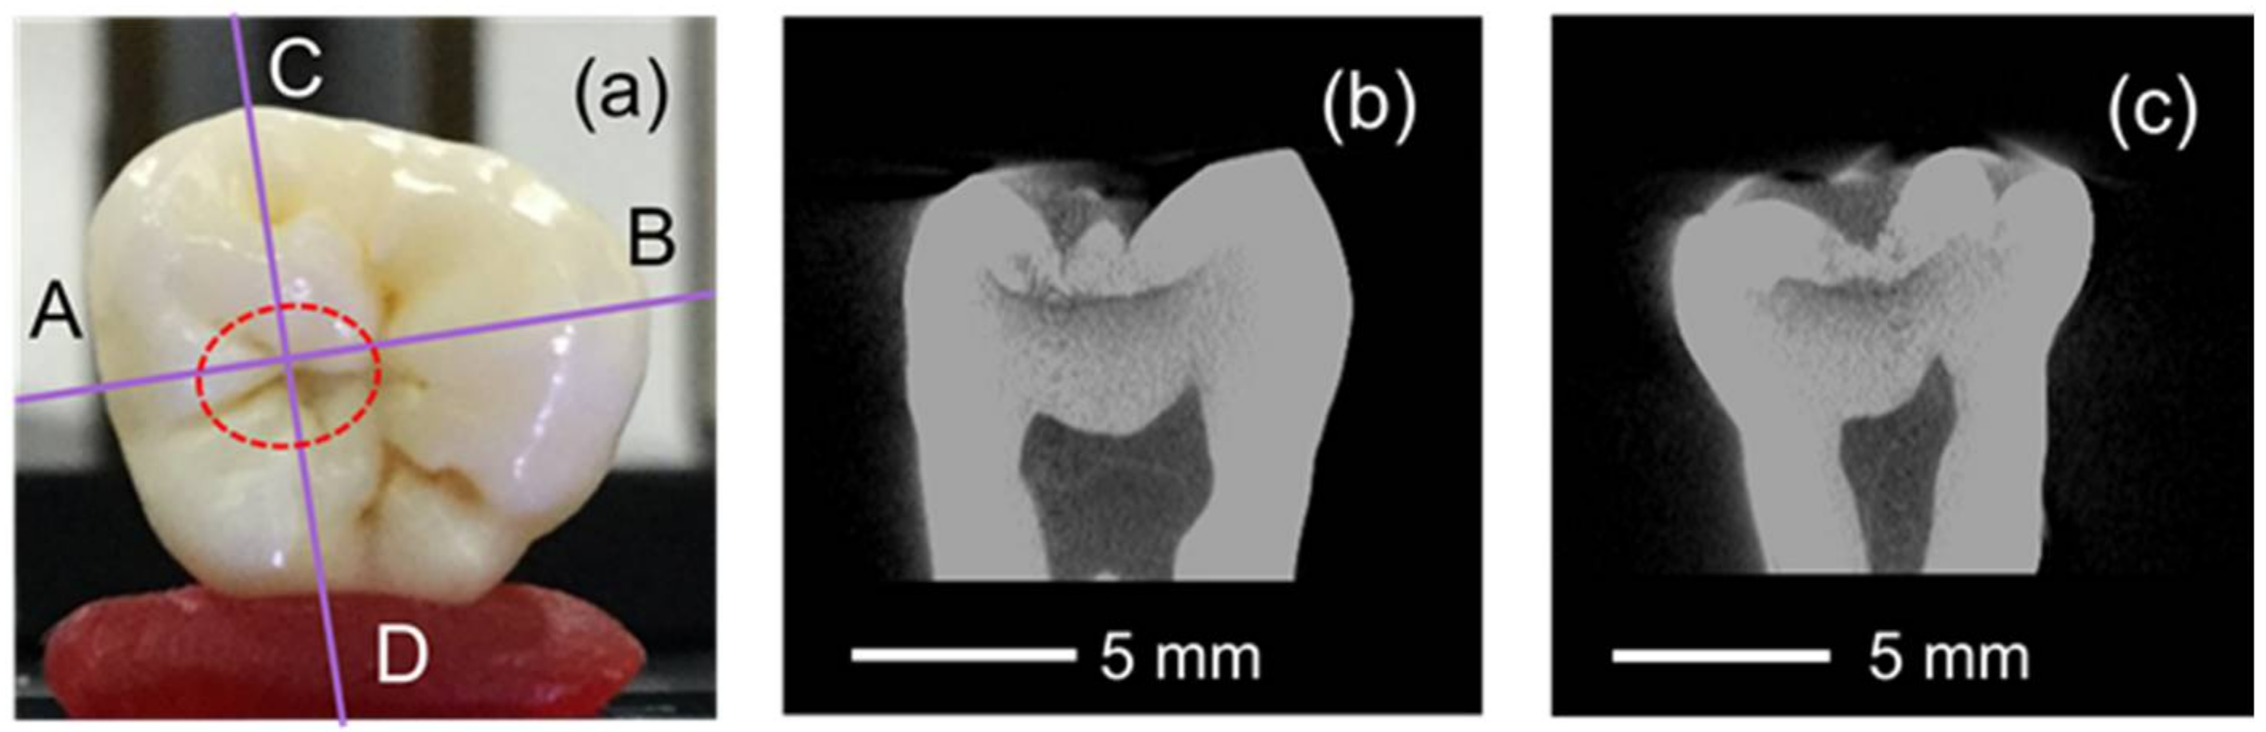
Finally, we performed photoacoustic imaging of an extracted human tooth with hidden caries. Before the photoacoustic experiment, we used a dental X-ray computed tomography (CT) device (SMX-100CT, Shimadzu, Kyoto, Japan) to obtain the exact shape and size of the hidden caries. Figure 11a shows a photograph of the occlusal surface. Figure 11b,c are CT cross sections along the A–B and C–D lines in Figure 11a, respectively. These CT images indicate that there was a hidden caries at the boundary between the enamel and the dentin at a depth of approximately 0.8 mm from the enamel surface. The size of the caries was approximately 3.5 mm in the A–B direction and 2.5 mm in the C–D direction, and it was 0.7-mm thick. When there is such a large caries lesion below the occulsal surface, usually one would see pits and fissures with stains or large open areas. However, for the extracted tooth used in our experiment, we confirmed that no visible caries lesion was formed on the surface as shown in Figure 11a and we used this sample to test the feasibility of photoacoustic method for detection of hidden caries lesions. Figure 12 shows a photoacoustic image, taken using the proposed method, of the sample tooth shown in Figure 11.
4. Discussion
From the above results of the experiments which we performed to show the feasibility of photoacoustic method for detection of hidden dental caries, we found that the photoacoustic method can be applied for detection of hidden dental caries in principle. However, in the current state of the imaging system and method which we proposed, only relatively large caries lesions with sizes larger than around 1 mm could be detected. In clinical practice, it is sometimes necessary to find lesions before they have reached this size so that one can use a preventive technique. To apply the proposed method for clinical applications, therefore, the sensitivity and resolution of the detected images should be drastically improved. This may be possible by using an image reconstruction technique such as circular back-propagation method [24] because the current system uses only a simple B-mode imaging method.
In the photoacoustic methods for detecting dental caries reported so far, an optical interferometer or a piezoelectric transducer has been used to detect the ultrasonic waves. However, optical interferometers are usually too sensitive to fluctuations in the distance from the sample surface to be used in clinical applications. In addition, when piezoelectric transducers are used, usually the sample needs to be dipped in water to match the acoustic impedance, and this is difficult for in vivo applications. In our proposed method, in contrast, a composite ultrasonic probe with a soft polymer coating was used. The soft probe can be attached to the surface of the tooth crown, as shown in Figure 2b, without water or gel and this makes the imaging system more feasible for clinical applications. However, we also found that this kind of composite probes have nonlinearity in the frequency response as shown in Figure 8. Therefore, one should take this nonlinearity into account when performing photoacoustic imaging.
Even though beam scanning of the laser light is necessary to obtain photoacoustic images, typical systems based on a scanning mirror cannot be easily applied to clinical applications for dental caries detection because such systems are usually bulky and do not fit into oral cavities. To solve this problem, we developed a laser scanning system using a bundle of flexible hollow-optical fibers shown in Figure 4. By using this probe, one can scan the laser beam using a simple linear stage at the input end and this makes the system simple and low in the cost.
The analysis of frequency spectra of photoacoustic waves from the extracted tooth samples with simulated caries inside showed that hidden caries lesions with a brown color may be detected by focusing the spectral differences. The difference between the spectral intensities from pigmented part and the normal part shown in Figure 5b indicates that the intensities of the photoacoustic waves generated in the pigmented part are higher in the frequency range of 0.5 MHz to 1.5 MHz than those of waves generated in normal parts of a tooth. This may be caused by a resonance vibration in the cavity generated by the absorption of the laser pulse at the simulated caries lesion. We performed the same experiments with different caries model teeth and the majority of the model teeth showed similar results. Considering this and the spectral difference between the pigmented part and the stained occlusal surface shown in Figure 7b, we found that we could detect simulated hidden caries lesions by focusing on the frequency range of 0.5–1.2 MHz. Then we could differentiate between photoacoustic waves generated from pigmented regions inside teeth from those generated from normal parts or stained occlusal surfaces. The result of the nonlinear response of the composite probe used in our system, which is shown in Figure 8, indicates that the frequency response changed with the intensity of the photoacoustic wave due to the nonlinearity of the composite probe. This nonlinearity might enhance the change in the frequency responses shown in Figure 5b and Figure 7b, and therefore one can differentiate the strong photoacoustic signal of the pigmented parts from the normal parts by detecting the spectral changes.
The results of photoacoustic imaging of simulated caries showed that the image of brownish hidden caries could be obtained by the proposed photoacoustic imaging system when the size of lesions are relatively large. In the photoacoustic image of the tooth sample without pigment inside, which is shown in Figure 9, no dark spot is evident, which indicates that fissures and pits on the occlusal surface do not induce photoacoustic waves sufficiently strong to be mistaken for the signal from the pigment. In the photoacoustic images of tooth samples with simulated caries lesions of different sizes, which are shown in Figure 10a,b, the contrast of the observed image was worse than that of the simulated caries at shallower depths due to the optical scattering and absorption of the thicker dental tissues. However, we confirmed that the simulated caries was observed as a dark spot at the location of the caries. Note that in Figure 10a,b the shapes of the obtained photoacoustic images do not coincide with the shapes of the fissures on the occlusal surface. This indicates that furcations and fissures do not affect the photoacoustic images. Furthermore, the size of the observed dark spot nearly coincides with that of the simulated caries when the simulated caries lesions are larger than 1.2 mm. However, no clear image was not obtained for the lesion with the size of 0.5 mm as shown in Figure 10c.
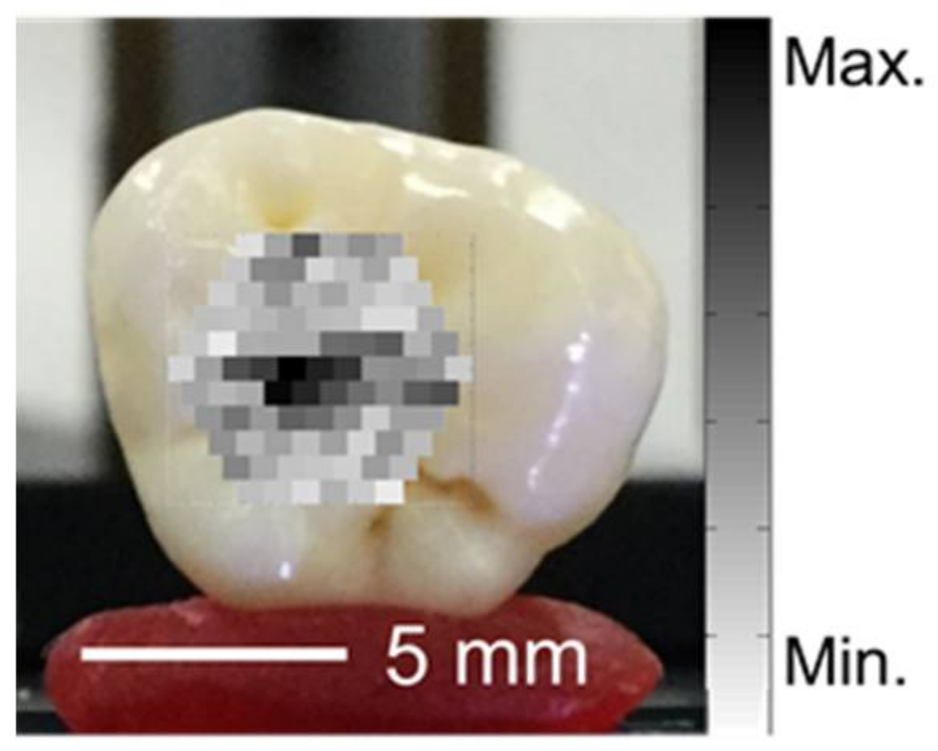
As a result of photoacoustic imaging of an extracted human tooth with a real hidden caries lesion, the hidden caries with an ellipse shape was detected near the hidden caries lesion located by the CT observation, demonstrating the feasibility of the proposed method for the detection of real hidden caries. However, the shape of the dark spot in the observed photoacoustic image did not exactly coincide with the CT image. This is due to the non-uniformities in the enamel thickness and the color of real dental caries. The proposed method can only detect comparatively strong photoacoustic signals from caries with a brown color. At the present stage, therefore, the method cannot detect a demineralized area without a color change. However, this may become possible with a photoacoustic method using different polarization directions.
5. Conclusions
We proposed a photoacoustic imaging system for detecting caries lesions inside teeth. First, we prepared hidden caries models using a pigment with an absorption spectrum similar to that of real caries lesions and irradiated the occlusal surface of the model teeth containing the pigment with 532-nm-wavelength laser pulses. We found that the frequency spectra of the photoacoustic waves from the simulated caries lesions included components in the range of 0.5–1.2 MHz that were not seen in the spectra of waves from healthy parts of the teeth. This indicated that hidden caries could be detected using a photoacoustic imaging technique. We then fabricated an imaging system composed of a bundle of hollow-optical fibers for laser radiation and an acoustic probe that is attached to the tooth surface for clinical applications. The results of ex vivo imaging experiments using model teeth and an extracted tooth with hidden caries lesions demonstrated that caries lesions inside teeth that cannot be seen in a visual inspection can be detected by focusing on the above frequency components of the photoacoustic waves. By using this method, one may obtain images of hidden caries lesions non-invasively without X-ray radiation. We believe that this is the first report on the feasibility of photoacoustic method for imaging hidden caries lesion.
At this stage, our proposed method only detects the optical absorption caused by the color difference in the dentin and the detectable size of the lesion is limited to the one larger than around 1 mm. We are working on a photoacoustic method using different polarization directions to detect lesions without a brownish color. In addition, we are working on an image reconstruction technique such as circular back-propagation method to improve the imaging resolution for detection of much smaller caries lesions.
Author Contributions
Takuya Koyama performed the experiments and analyzed the data; Satoko Kakino contributed the materials; and Yuji Matsuura conceived and designed the experiments.
Conflicts of Interest
The authors declare no conflict of interest.
References
- Ricketts, D.; Kidd, E. Hidden caries: What is it? Does it exist? Does it matter? Int. Dent. J. 1997, 47, 259–265. [Google Scholar] [CrossRef] [PubMed]
- Trevisan, T.C.; De Andrade, M.C.; Presoto, C.D.; De Oliveira, O.B., Jr.; Andrade, M.F.; Bortolatto, J.F. Hidden caries: A critical review. Sci. J. Dent. 2015, 2, 33–36. [Google Scholar] [CrossRef]
- Bertoli, F.M.D.P.; da Silva, B.M.; Dalledone, M.; Losso, E.M. Hidden caries’ challenge diagnosis: Case report. RSBO 2013, 10, 188–192. [Google Scholar]
- Beard, P. Biomedical photoacoustic imaging. Interface Focus 2011, 1, 602–631. [Google Scholar] [CrossRef] [PubMed]
- Zhang, H.F.; Maslov, K.; Stoica, G.; Wang, L.V. Functional photoacoustic microscopy for high-resolution and nonivasive in vivo imaging. Nat. Biotechnol. 2006, 24, 848–851. [Google Scholar] [CrossRef] [PubMed]
- Wang, X.; Pang, Y.; Ku, G.; Xie, X.; Stoica, G.; Wang, L.V. Noninvasive laser-induced photoacoustic tomography for structural and functional in vivo imaging of the brain. Nat. Biotechnol. 2003, 21, 803–806. [Google Scholar] [CrossRef] [PubMed]
- Manohar, S.; Kharine, A.; Van Hespen, J.C.G.; Steenbergen, W.; van Leeuwen, T.G. The Twente photoacoustic mammoscope: System overview and performance. Phys. Med. Biol. 2005, 50, 2543–2557. [Google Scholar] [CrossRef] [PubMed]
- Wang, L.V.; Hu, S. Photoacoustic tomography: In vivo imaging from organelles to organs. Science 2012, 335, 1458–1462. [Google Scholar] [CrossRef] [PubMed]
- Yamada, A.; Kakino, S.; Matsuura, Y. Detection of photoacoustic signals from blood in dental pulp. Opt. Photonics J. 2016, 6, 229–236. [Google Scholar] [CrossRef]
- Wang, H.C.; Fleming, S.; Lee, Y.C.; Law, S.; Swain, M.; Xue, J. Laser ultrasonic surface wave dispersion technique for non-destructive evaluation of human dental enamel. Opt. Express 2009, 17, 15592–15607. [Google Scholar] [CrossRef] [PubMed]
- Blodgett, D.W. Applications of laser-based ultrasonics to the characterization of the internal structure of teeth. J. Acoust. Soc. Am. 2003, 114, 542–549. [Google Scholar] [CrossRef] [PubMed]
- Sampathkumar, A.; Hughes, D.A.; Kirk, K.J.; Otten, W.; Longbottom, C. All-optical photoacoustic imaging and detection of early-stage dental caries. In Proceedings of the 2014 IEEE International Ultrasonics Symposium Proceedings, Chicago, IL, USA, 3–6 September 2014; pp. 1269–1272. [Google Scholar]
- Hughes, D.A.; Sampathkumar, A.; Longbottom, C.; Kirk, K.J. Imaging and detection of early stage dental caries with an all-optical photoacoustic microscope. J. Phys. Conf. Ser. 2015, 581, 012002. [Google Scholar] [CrossRef]
- Cheng, R.; Shao, J.; Gao, X.; Tao, C.; Ge, J.; Liu, X. Noninvasive assessment of early dental lesion using a dual-contrast photoacoustic tomography. Sci. Rep. 2016, 6, 217998. [Google Scholar] [CrossRef] [PubMed]
- Li, T.; Dewhurst, R.J. Photoacoustic non-destructive evaluation and imaging of caries in dental samples. In Proceedings of the AIP Conference Proceedings, Kingston, NY, USA, 26–31 July 2009; pp. 1574–1581. [Google Scholar]
- El-Sharkawy, Y.H.; Sherif, A.F.E. Photoacoustic diagnosis of human teeth using interferometric detection scheme. Opt. Laser Technol. 2012, 44, 1501–1506. [Google Scholar] [CrossRef]
- El-Sharkawy, Y.H.; Badr, Y.; Gadallah, M.; El-Sherif, A.F. Diagnostic of human teeth using photoacoustic response. In Proceedings of the SPIE Conference, San Jose, CA, USA, 21–26 January 2006. [Google Scholar]
- Kim, K.; Witte, R.S.; Koh, I.; Ashkenazi, S.; O’Donnell, M. Early detection of dental caries using photoacoustics. In Proceedings of the SPIE Conference, San Jose, CA, USA, 21–26 January 2006. [Google Scholar]
- Amaechi, B.T.; Higham, S.M.; Podoleanu, A.G.H.; Rogers, J.A. Use of optical coherence tomography for assessment of dental caries: Quantitative procedure. J. Oral Rehabil. 2001, 28, 1092–1093. [Google Scholar] [CrossRef] [PubMed]
- Ko, A.C.-T.; Choo-Smith, L.-P.; Hewko, M.; Leonardi, L.; Sowa, M.G.; Dong, C.C.S.; Williams, P.; Cleghorn, B. Ex vivo detection and characterization of early dental caries by optical coherence tomography and Raman spectroscopy. J. Biomed. Opt. 2005, 10, 03118. [Google Scholar] [CrossRef] [PubMed]
- Wijesinghe, R.E.; Cho, N.H.; Park, K.; Jeon, M.; Kim, J. Bio-photonic detection and quantitative evaluation method for the progression of dental caries using optical frequency-domain imaging method. Sensors 2016, 16, 2076. [Google Scholar] [CrossRef] [PubMed]
- Koyama, T.; Kakino, S.; Matsuura, Y. Photoacoustic imaging of hidden dental caries by using a bundle of hollow optical fibers. In Proceedings of the SPIE Conference, San Francisco, CA, USA, 27 January–1 February 2018. [Google Scholar]
- Seki, A.; Iwai, K.; Katagiri, T.; Matsuura, Y. Forward-viewing photoacoustic imaging probe with bundled ultra-thin hollow optical fibers. J. Opt. 2016, 18, 074015. [Google Scholar] [CrossRef]
- Sperl, J.I.; Zell, K.; Menzenbach, P.; Haisch, C.; Ketzer, S.; Marquart, M.; Koenig, H.; Vogel, M.W. Photoacoustic image reconstruction—A quantitative analysis. In Proceedings of the SPIE Conference, Munich, Germany, 17–21 June 2007. [Google Scholar]
Figure 1.
Extracted tooth sample: (a) a side view and (b) a cutting section.

Figure 2.
(a) Schematic of the experimental setup for the detection of photoacoustic waves from a tooth sample and (b) an acoustic probe attached to the surface of a tooth sample.
Figure 2.
(a) Schematic of the experimental setup for the detection of photoacoustic waves from a tooth sample and (b) an acoustic probe attached to the surface of a tooth sample.

Figure 3.
Spectral sensitivity of the composite ultrasonic probe.

Figure 4.
Schematic and photo of a photoacoustic imaging system using a bundle of hollow-optical fibers.
Figure 4.
Schematic and photo of a photoacoustic imaging system using a bundle of hollow-optical fibers.

Figure 5.
(a) Frequency spectra of photoacoustic waves from normal and pigmented parts of a tooth; and (b) the difference between the signals from the normal and pigmented parts.
Figure 5.
(a) Frequency spectra of photoacoustic waves from normal and pigmented parts of a tooth; and (b) the difference between the signals from the normal and pigmented parts.

Figure 6.
Appearance of occlusal surface stained with a brown pigment.

Figure 7.
(a) Frequency spectra of photoacoustic waves from pigment inside a tooth and from a pigmented tooth surface; and (b) the difference between the two spectra.
Figure 7.
(a) Frequency spectra of photoacoustic waves from pigment inside a tooth and from a pigmented tooth surface; and (b) the difference between the two spectra.

Figure 8.
(a) Frequency spectra of photoacoustic waves from liquid samples with 5% and 50% black ink and (b) the difference between the two spectra.
Figure 8.
(a) Frequency spectra of photoacoustic waves from liquid samples with 5% and 50% black ink and (b) the difference between the two spectra.

Figure 9.
(a) Appearance of the tooth sample surface, (b) photoacoustic image of the simulated hidden lesion 2.5 mm in diameter at a depth of 1.5 mm, and (c) photoacoustic image of the sample without pigment.
Figure 9.
(a) Appearance of the tooth sample surface, (b) photoacoustic image of the simulated hidden lesion 2.5 mm in diameter at a depth of 1.5 mm, and (c) photoacoustic image of the sample without pigment.

Figure 10.
Appearance of the tooth sample surfaces (left) and photoacoustic images obtained from simulated hidden lesions (right) with different sizes and depths: (a) a diameter of 1.2 mm at a depth of 0.9 mm, (b) a diameter of 1.2 mm at a depth of 1.9 mm, and (c) a diameter of 0.5 mm at a depth of 0.9 mm.

Figure 11.
(a) Appearance of the occlusal surface, (b) Computed tomography (CT) cross section along the line A–B, and (c) CT cross section along the line C–D.
Figure 11.
(a) Appearance of the occlusal surface, (b) Computed tomography (CT) cross section along the line A–B, and (c) CT cross section along the line C–D.

Figure 12.
Photoacoustic image of an extracted tooth containing a caries lesion.

© 2018 by the authors. Licensee MDPI, Basel, Switzerland. This article is an open access article distributed under the terms and conditions of the Creative Commons Attribution (CC BY) license (http://creativecommons.org/licenses/by/4.0/).
Share and Cite
MDPI and ACS Style
Koyama, T.; Kakino, S.; Matsuura, Y. A Feasibility Study of Photoacoustic Detection of Hidden Dental Caries Using a Fiber-Based Imaging System. Appl. Sci. 2018, 8, 621. https://doi.org/10.3390/app8040621
AMA Style
Koyama T, Kakino S, Matsuura Y. A Feasibility Study of Photoacoustic Detection of Hidden Dental Caries Using a Fiber-Based Imaging System. Applied Sciences. 2018; 8(4):621. https://doi.org/10.3390/app8040621
Chicago/Turabian StyleKoyama, Takuya, Satoko Kakino, and Yuji Matsuura. 2018. "A Feasibility Study of Photoacoustic Detection of Hidden Dental Caries Using a Fiber-Based Imaging System" Applied Sciences 8, no. 4: 621. https://doi.org/10.3390/app8040621
Note that from the first issue of 2016, this journal uses article numbers instead of page numbers. See further details here.