Textile-Based Flexible Coils for Wireless Inductive Power Transmission


Electronics and Computer Science, University of Southampton, Southampton SO17 1BJ, UK
*
Author to whom correspondence should be addressed.
Appl. Sci. 2018, 8(6), 912; https://doi.org/10.3390/app8060912
Submission received: 5 February 2018
/
Revised: 25 May 2018
/
Accepted: 25 May 2018
/
Published: 1 June 2018
(This article belongs to the Section Energy Science and Technology)
Abstract
:Wireless inductive power transmission systems can potentially supply wearable devices. Power cables or batteries can be eliminated by implementing a wireless power transfer system, making the wearable devices less obtrusive to users. However, rigid coils can cause discomfort to users in wearable applications. The novel screen-printed flexible coils on textiles reported here are intended to be a low-cost and comfortable solution when integrated into clothing. A constant-width circular-spiral flat coil has been designed to minimize the detrimental effect of the low conductivity of the screen-printed flexible conductors on the efficiency of the wireless power transfer system. The coils are printed on 65/35 polyester/cotton textile with a screen-printed Fabink-UV-IF1 interface layer coating. The interface layer provides a relatively flat and smooth surface to prevent the permeation of the conductive paste into the textile and allows the printing of finer-profile coils. A 5 V 1.2 W DC output has been achieved by a wireless power transfer system using the printed flexible coils with Qi standard circuitry; a DC-DC efficiency of 37% has been measured.
1. Introduction
Wireless power transmission (WPT) using inductive coupling has been employed in numerous applications [1], in particular where cable-free devices are desired. E-textile technology covers the integration of electronics into clothes to achieve a wearable flexible implementation that is easy to use. Furthermore, the watt-level power supplied by WPT makes it possible to improve the functionality of wearable devices and reduce their size and weight by eliminating power cables or batteries [2] and make the wearable devices less intrusive for users. Most current research involves the use of coils fabricated either by winding copper wire or by using a track fabricated onto a PCB [3,4]. These rigid inflexible coils are uncomfortable and so less suited to e-textile applications due to their impact on the user. In this paper, screen-printed flexible coils have been designed and fabricated for a WPT system. These flexible coils provide a convenient and comfortable option to integrate a WPT system into clothing which is less invasive and more comfortable for users, by having improved flexibility and breathability over the conventional wire-wound or PCB-based coil fabrication approaches. Screen printing is a well-established, low-cost, and textile-compatible technology for fabrication which can be readily applied to volume production [5,6]. In this paper, the textile used is 65/35 polyester/cotton which has widespread use in everyday clothing. Conventionally flexible printed electronics for e-textiles are fabricated by printing the conductive paste to form the electronic circuitry onto a substrate material, such as a polyimide film, which is then attached to the host textile by a mechanical fixing method such as sewing, as such the printed electronics are not directly integrated with the actual textile. Printing the conductive paste directly on the textile causes several problems in manufacture and application. Firstly, a textured or porous substrate causes a higher effective resistance as conductive paste sinks into the gaps between the textile fibers [7]. Secondly, conductive paste printed directly on textile without a supporting structural material is brittle, and when the textile is deformed the conductor can be fractured, increasing the resistance of conductive tracks, or even causing an open circuit [8]. Finally, the profile of a printed conductive paste is poorly defined when printed onto a rough substrate. These factors lead to unpredictability and variation of the electrical properties which can cause the coils of the WPT system to diverge from their tuned operational frequency or cause the driver circuit to fail. An interface layer is therefore required on the textile to create a smooth surface for the printing of subsequent conductive layers with uniform thickness. The flexible coils used in this work are printed onto interface-coated textile achieved by screen printing to produce novel printed coils that are directly integrated with the textile substrate.
This paper is organized as follows: in Section 2, the theory of inductive power transmission is discussed to introduce the essential parameters used in determining the behavior of the flexible coils. Section 3 describes the specific design for the flexible coils in this work, based on the essential parameters identified in Section 2. The practical fabrication of the coils is described in detail in Section 4. Section 5 describes the experimental performance evaluation of flexible coils and the WPT system. The essential parameters of coils are detailed in Section 6 and the performance of the WPT system using the printed flexible coils is given in Section 7. Considerations for the safe operation of the WPT system are identified in Section 8. Final conclusions are given in Section 9.
2. Theory of Inductive Power Transmission
Typical inductively coupled wireless power transfer systems are based on coupled-mode theory, the resonant components being the Transmitter (TX) and Receiver (RX) coils, which are coupled in an oscillating electromagnetic field. A system diagram showing a typical arrangement is shown in Figure 1.
The inductances of the TX and RX coils allow the transfer of power wirelessly via inductive coupling. The TX and RX coils are represented by inductors LTX and LRX with their equivalent series resistances (ESRs) represented by ReTX and ReRX, and their parasitical capacitances by CpTX and CpRX respectively [9]. Resonant tank capacitors CrTX and CrRX are connected in parallel with the TX and RX coils to tune them causing both driving and receiving circuits to resonate at same operating frequency. The load, represented by a resistance RLoad, is powered by the rectified DC voltage from the receiver circuit. The ESRs introduced by the coupled coils waste power when the alternating currents pass through the coil, and thereby reduce the efficiency of system. These losses due to the ESRs are especially prominent in a printed coil due to the high sheet resistance of printable conductive pastes compared to bulk conductive materials. Consequently, the ESRs of printed coils are should be as low as possible. The inductance of the coils is a key parameter required to tune the system correctly, the inductance of a flat spiral coil with an air core is determined by its shape. The circular coil used in this paper is shown in Figure 2. The engineering calculations for circular and square coils as derived in [10] are given in Equations (1) and (2) respectively:
where μ0 is absolute magnetic permeability, N is the number of turns the spiral coil has, is the average diameter of the flat spiral coil, and the fill ratio which are defined in [10] to simplify the effect of dimensions for a coil with external diameter dext and inner diameter dinner as shown in Figure 2. The ESRs of the coils are composed of their DC resistance, the skin effect, and the proximity effect [11]. The DC resistance of the coils can be calculated for a conductive track as:
where Rsheet is the sheet resistance for a given thickness, which is provided by the manufacturer; for other thicknesses the sheet resistance may be calculated as discussed in Section 4, and W is the width of the track. The ESR Re has been defined in [12] as a combination of RDC, the skin effect, and the proximity effect, given by:
where is the reduced effective area due to skin effects for a track with thickness tc, and skin depth [13] (where ρ is resistivity and μr is relative permeability), this reduced effective area is derived in [14] from the effective area, which is the cross section of the track , ω is the operating frequency, and is the critical frequency [15] of a coil with track spacing S where the resistance begins to increase significantly relative to the operating frequency due to the skin and proximity effect [16]. The skin effect depth for the conductors in the printed flat coils is of the order of 1 mm and is therefore negligible in this case but is included in the calculations for completeness.
The parallel combination of parasitic capacitance and inductance of the coil causes self-resonance of a coil at a particular frequency. The self-resonant frequency (SRF) is an essential parameter of an inductively coupled coil because the effective inductance is zero at the SRF which prevents an alternating electromagnetic field from being induced. A connection cannot be made without an alternating electromagnetic field. The parasitic capacitance is affected by the surrounding materials which are air, the insulator, and the substrate textile. This can be calculated as described in [12] as:
where εrCo, εrSu are the relative permittivity of the coating insulator material and the substrate textile material, ε0 is the vacuum permittivity, and lgap is the overall length of the gap between the tracks. The unloaded Q factor of inductors expresses the ratio of stored against lost energy which is used to evaluate the quality of coils, and is found as [17]:
To employ the printed coils in a WPT system, the coils are attached with resonant tank capacitors which are calculated as [18]:
where ReTX, ReRX, QuTX, and QuRX are the ESRs and unloaded Q factors of the TX and RX coils, respectively, L is the inductance of the coil with the resonant tank capacitor attached. The coefficient is based on the unloaded Q factors of both coils and the coupling factor, k, which has an approximate formula for flat spiral coils of [19]:
where D is the center separation distance between the TX and RX coils, dextTX and dextRX are the external diameters of the TX and RX coils, respectively. For coils with a known size, the coupling factor k is affected by the distance between two coils. In this work, the coupling factor was also measured for each pair of printed coils to determine the resonant tank capacitor required for each individual coil at the desired operating frequency.
3. Design
The flat coil was designed as a circular spiral shape to provide the desired inductance as well as to retain flexibility for both TX and RX coils as shown in Figure 2. The external diameter of the coils was specified based on the target application. As the printed coils increase the thickness of a textile this reduces the flexibility and breathability of the textile. Therefore, the coil size is limited to ensure that the WPT system enabled textile is as comfortable as possible. An area less than 140 mm × 140 mm is an acceptable size for flexibility and fits the printable area of the semi-automatic screen printer used in this paper. The external diameter was 138 mm and the remaining space was for the connection pads and screen-printing alignment marks.
Zierhofer et al. [20] presented experimental work on a geometric approach for the enhancement of the unloaded Q factor and the coupling coefficient of flat coils. They concluded that when , the optimum unloaded Q factor is obtained for a given coupling coefficient. Therefore, the inner diameter of the coil was set as 53 mm to get an integral number of turns for the coil. Ng et al. [11] found that the optimal spacing depended on the size of coil and is essential to improve the unloaded Q factor. In this paper, the coils have a 2 mm spacing between conductive tracks, the spacing has been standardized at this value to reduce inter-turn proximity effects while leaving scope for the width of the conductive track to be varied within the overall coil-dimension limits.
When increasing the number of turns, N, of a coil, both the numerator and denominator of its unloaded Q factor in Equation (6) are increased. The relationship between N and unloaded Q factor is simulated and illustrated in Figure 3 with parameters as dext = 138 mm, dinner = 53 mm, S = 2 mm, for both circular and square forms, and using a sheet resistance Rsheet = 24 mΩ/□ given from the manufacturer (specified as Ω per square area for their recommended printed thickness, denoted as Ω/□). The width of the track was varied in simulation to fit a given number of turns within the specified area, varying the width for a given printed thickness affects the effective conductor size as the resulting cross-sectional area changes. For both circular and square coils the 6-turn coil has the highest unloaded Q factor and the width of the track W is 4.5 mm with a pitch of 6.5 mm. By comparing coils with different shapes, it was found that the circular coils have a larger Q, a shorter length of track and a lower resistance than the square coil for the same number of turns. The resistance of the printed coils is approximately 50 times higher than that of a wound copper coil because of the limitation in respect of conductivity of the screen-printable conductive paste caused by the non-conductive polymer binder and gaps between the metal particles in the printed paste. This material-based limitation makes resistance the limiting factor of the unloaded Q factor of the printed coil. As a result, the circular coil has a higher unloaded Q factor than the square one due to the longer track length in the square coil.
4. Fabrication
4.1. Process of Fabrication
The coils were fabricated by screen printing using a DEK 248 semi-automatic printer (ASM Assembly Systems, Munich, Germany), using a series of patterned screens to deposit the desired layers individually [7], prior to curing as appropriate. The 65/35 polyester/cotton textile substrate used is very flexible and it can withstand curing process at up to 130 °C for up to 60 min without significant damage or degradation. To keep it flat and to ease handling during the printing and curing processes it is glued on to an alumina tile with a demountable spray adhesive. Multiple wet prints prior to curing can be performed to give the desired printed thickness with the thickness of each print controlled by the screen emulsion thickness. In this work an emulsion thickness of 40 μm was used for both the interface and conductive layers. After the printing stages, ultraviolet (UV) curing for the interface paste was carried out using a UV light cabinet with a 400 W mercury bulb, and thermal curing for conductive paste was performed in a BTU belt furnace as appropriate for the material deposited. This print cure process was repeated until the desired value of thickness was obtained. Film thickness measurements were taken using a Nikon eclipse LV 100 microscope (Nikon Instruments Europe, Amsterdam, The Netherlands), with a Nikon LU Plan Fluor 100×/0.90 lens (Nikon Instruments Europe, Amsterdam, The Netherlands), to perform a non-contact measurement. This avoided damage to the surface of the printed layer, and possible contamination issues which may affect the adhesion of subsequent layers. Multiple print-cure cycles can be correctly aligned using the alignment marks included in the screen design. The use of multiple print-cure cycles allows thicker conductors to be realized than can be achieved in a single print-cure cycle of the printing process.
The overall structure of the screen-printed coil and associated interface material is shown in the exploded view shown in Figure 2, consisting of conductive and interface layers printed onto the flexible textile substrate.
4.2. Interface Layer
The selected standard 65/35 polyester/cotton textile has a rough surface with an arithmetic mean deviation of 140 μm [21] so it was necessary to print an interface layer on the textile to create a smooth surface for the printing of subsequent conductive layers with uniform thickness. An UV curing interface ink Fabink-IF-UV4 from Smart Fabric Inks Ltd. (Smart Fabric Inks Ltd., Southampton, UK) [22] was printed and cured to form the interface layer on the textile, to achieve a smoother surface.
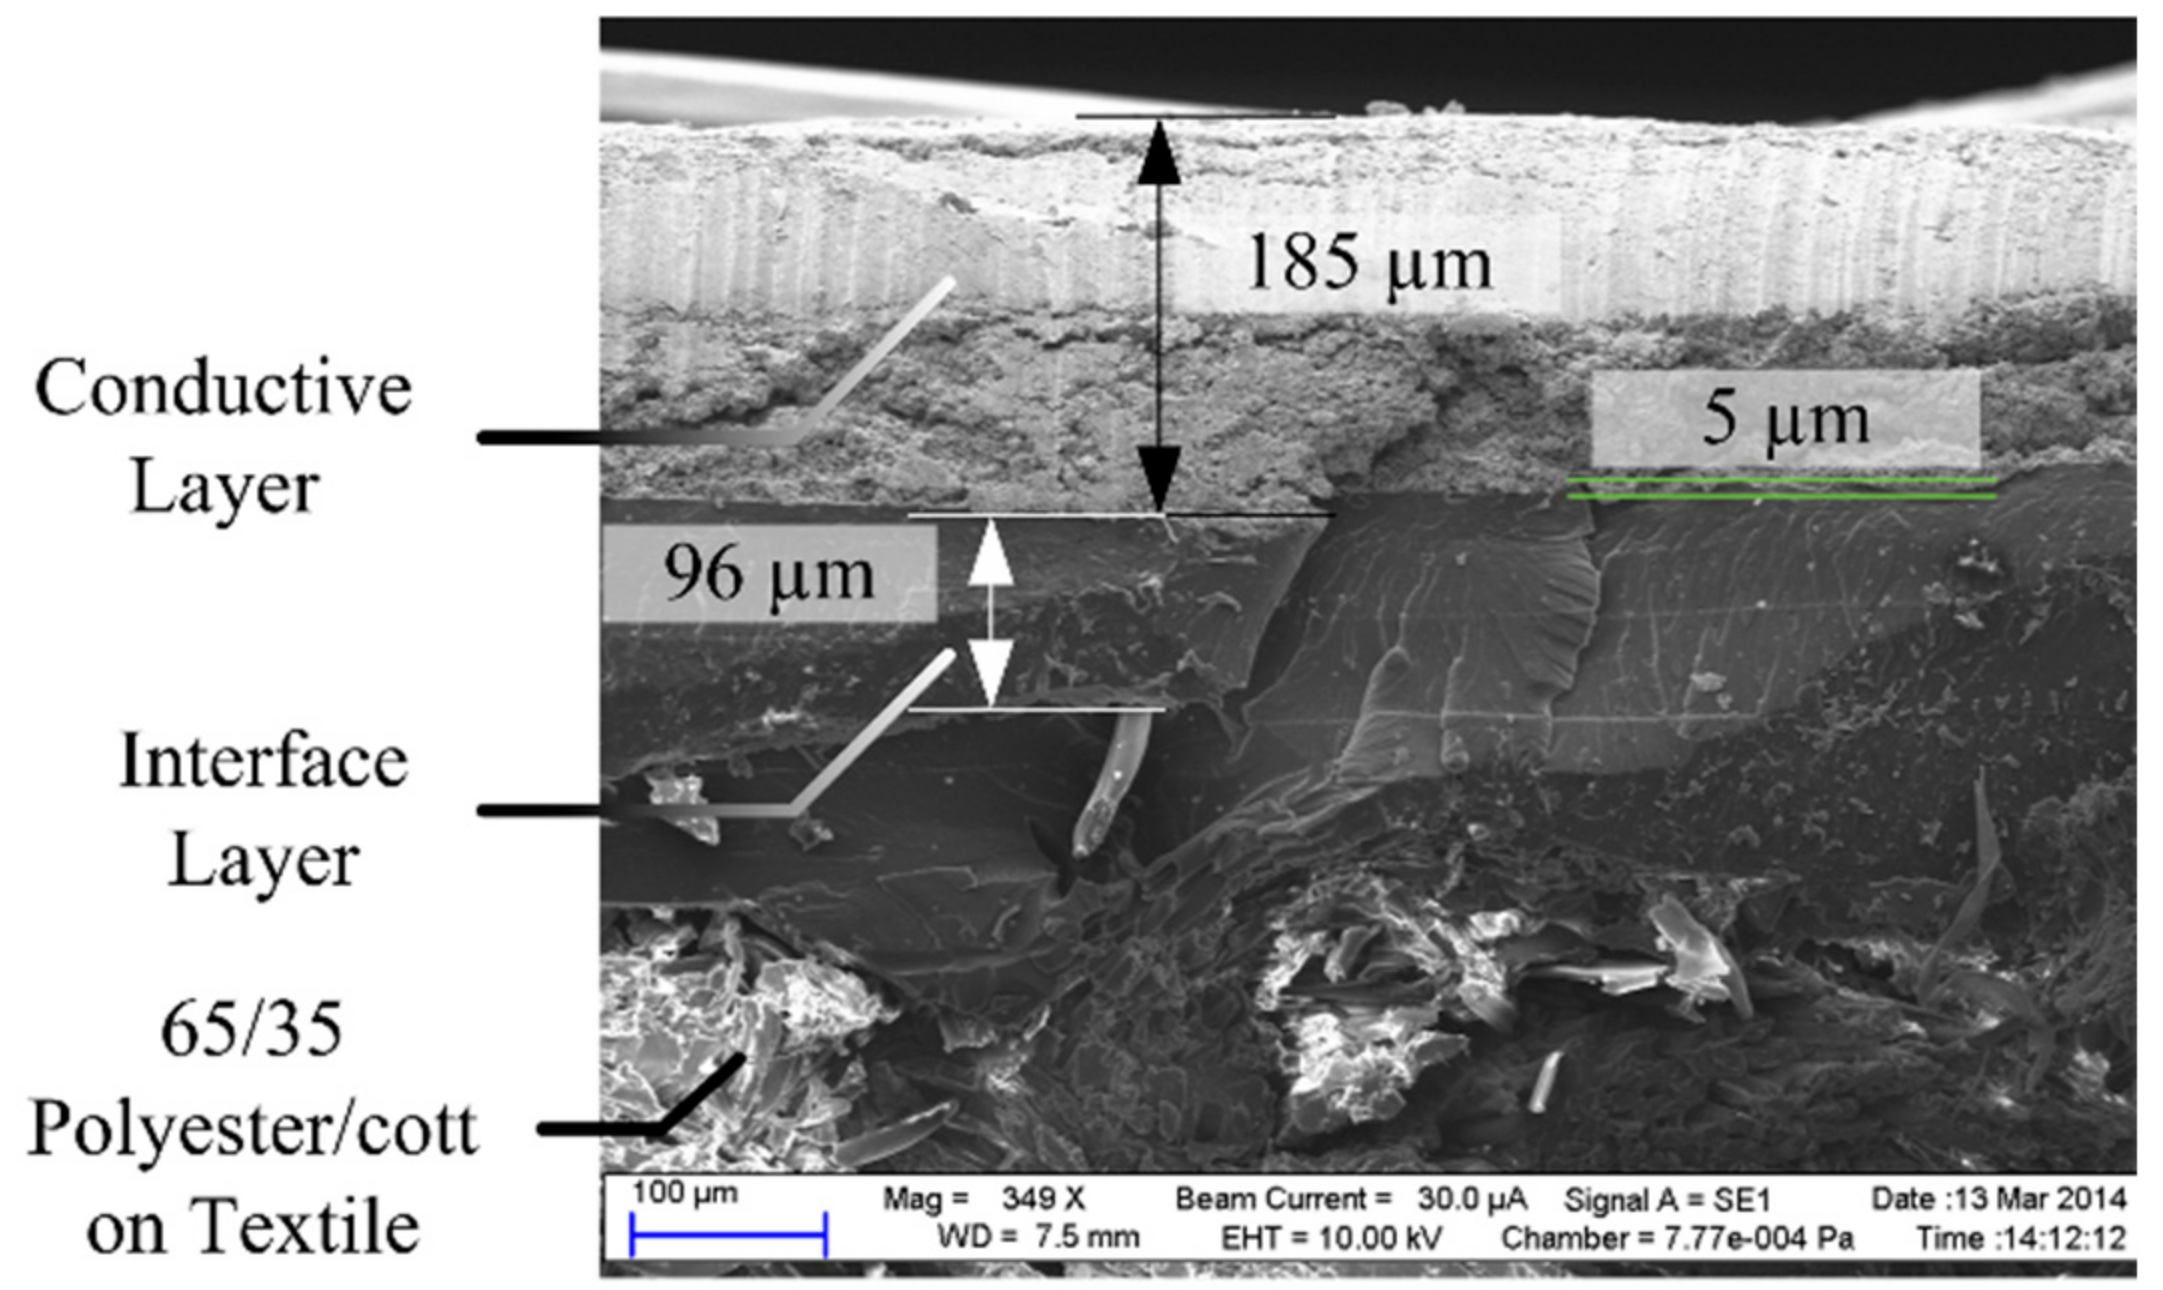
After each print, UV curing is performed for 60 s at an intensity of 50 mW/cm2. The thickness of each cured layer was then measured using the non-contact method. An acceptably smooth surface was achieved with six sub-layers of interface with a total thickness of 96 μm ± 10%. A comparison of surface roughness is shown in Figure 4 which shows example conductive tracks printed on a smooth interface layer with six sub-layers on the left side compared with a rough surface of the interface layer with two sub-layers on the right side. Based on SEM measurements it can be concluded that the maximum diameter of surface defects is less than 5 μm with a 6 sub-layer interface having a thickness of 96 μm as shown in the SEM micrograph in Figure 5.
4.3. Conductive Track Layer
The conductive paste was printed onto the interface layer and cured to form the planar spiral coil; a low sheet resistivity is required to minimize resistive losses with the coil. Thermally cured silver polymer paste Fabink-TC-AG4002 from Smart Fabric Inks Ltd. (Smart Fabric Inks Ltd., Southampton, UK) [23] was used to print the conductive layer; it has 20 mΩ/□ sheet resistance and high flexibility, the maximum permissible bend radius for the printed conductor is dependent on the number of layers printed and resulting geometry, the ink has been found to be stable once cured and to perform well with repeated bending cycles though is not machine washable at present due to the increased bending during the process. From the datasheet, the recommended curing temperature of Fabink-TC-AG4002 is 110 to 130 °C, and the recommended curing time is 2 to 10 min, this curing parameters are for the recommended deposit thickness of 25 μm and a printed area of up to 100 mm2. After fully curing, the 25 μm printed thickness of the silver layer shrinks to 16–18 μm. These recommended curing parameters from the manufacturer are intended for printed conductive layer in applications such as printed resistors. Since the textiles maximum curing temperature is 130 °C, curing at a higher temperature is not an option. It is investigated in following section that the designed coil, which has a printed area over 100 cm2, required an increased curing duration to provide a homogeneous cured layer. In the uncured liquid state, the conductive paste contains a solvent which has higher resistivity than the conductive silver particles so consequently the DC resistance of a conductive track decreases as the solvent evaporates throughout the curing process. Therefore, the DC resistance of a track is an indicator of the state of the curing process. The appropriate curing time was identified by identifying the relationship between curing state and DC resistance. The DC resistance of a conductor is used as a standard test to establish when the curing process has been completed and volatile components of the conductive paste have been removed, at which point the conductor’s properties should have reached their optimum. For this test a conductive sub-layer was printed with two deposits onto the interface layer or the previously cured conductive layers and then cured at 130 °C for 5 min. This was then followed by measurement of the DC resistance. The sample was then cured for a further 5 min and the DC resistance measured again. This curing and measuring cycle was repeated until the DC resistance of the coil stabilized indicating that it is fully cured. This process was completed for samples of conductive tracks composed of one, two, four and eight conductive sub-layers on an interface-coated textile for curing durations from 15 to 60 min. All the numbers of sub-layers tested show consistent decreases in the normalized DC resistance for curing times from 10 to 40 min. For curing durations over 40 min they show varying levels of increase in DC resistance. This occurs with all numbers of sub-layers, but the effect is reduced as the total thickness increases and the number of sub-layers increases. The cause of this effect is due to interactions between the interface layer and the conductive layer which occur once the conductive paste is over-cured. Comparative tests for the same conductive layer printed directly onto Kapton without an interface layer show no increase in DC resistance for curing durations over 40 min. The final selected curing process for a 140 mm × 140 mm printed coil conductive layer is 40 min at 130 °C, which minimizes the DC resistance and avoids increases due to over curing.
The sheet resistance (Ω/□) of the realized conductive layer can be calculated from Equation (3) using the RDC measured and the length of the conductive track, ltrack, from the CAD software used to produce the printing screens is 2417 mm. The manufacturer of the conductive paste recommends a cured layer thickness, tcRX, of 18 μm to achieve optimal sheet resistance. The thickness of a printed conductive layer is greater than the recommended value in this paper because the minimum DC resistance was desired. Consequently, a mathematical theoretical sheet resistance is calculated as , where tc is the average thickness of the conductive layer measured using the non-contact method. These theoretical sheet resistances, RsheetCal, can be compared with the practical sheet resistance Rsheet to verify that the sheet resistance on the samples was as expected. The thicknesses, theoretical sheet resistance, practical sheet resistance, and DC resistance of the conductive layer are listed in Table 1, each cured sub-layer has two printed deposits. The results are based on the measurements of five different samples.
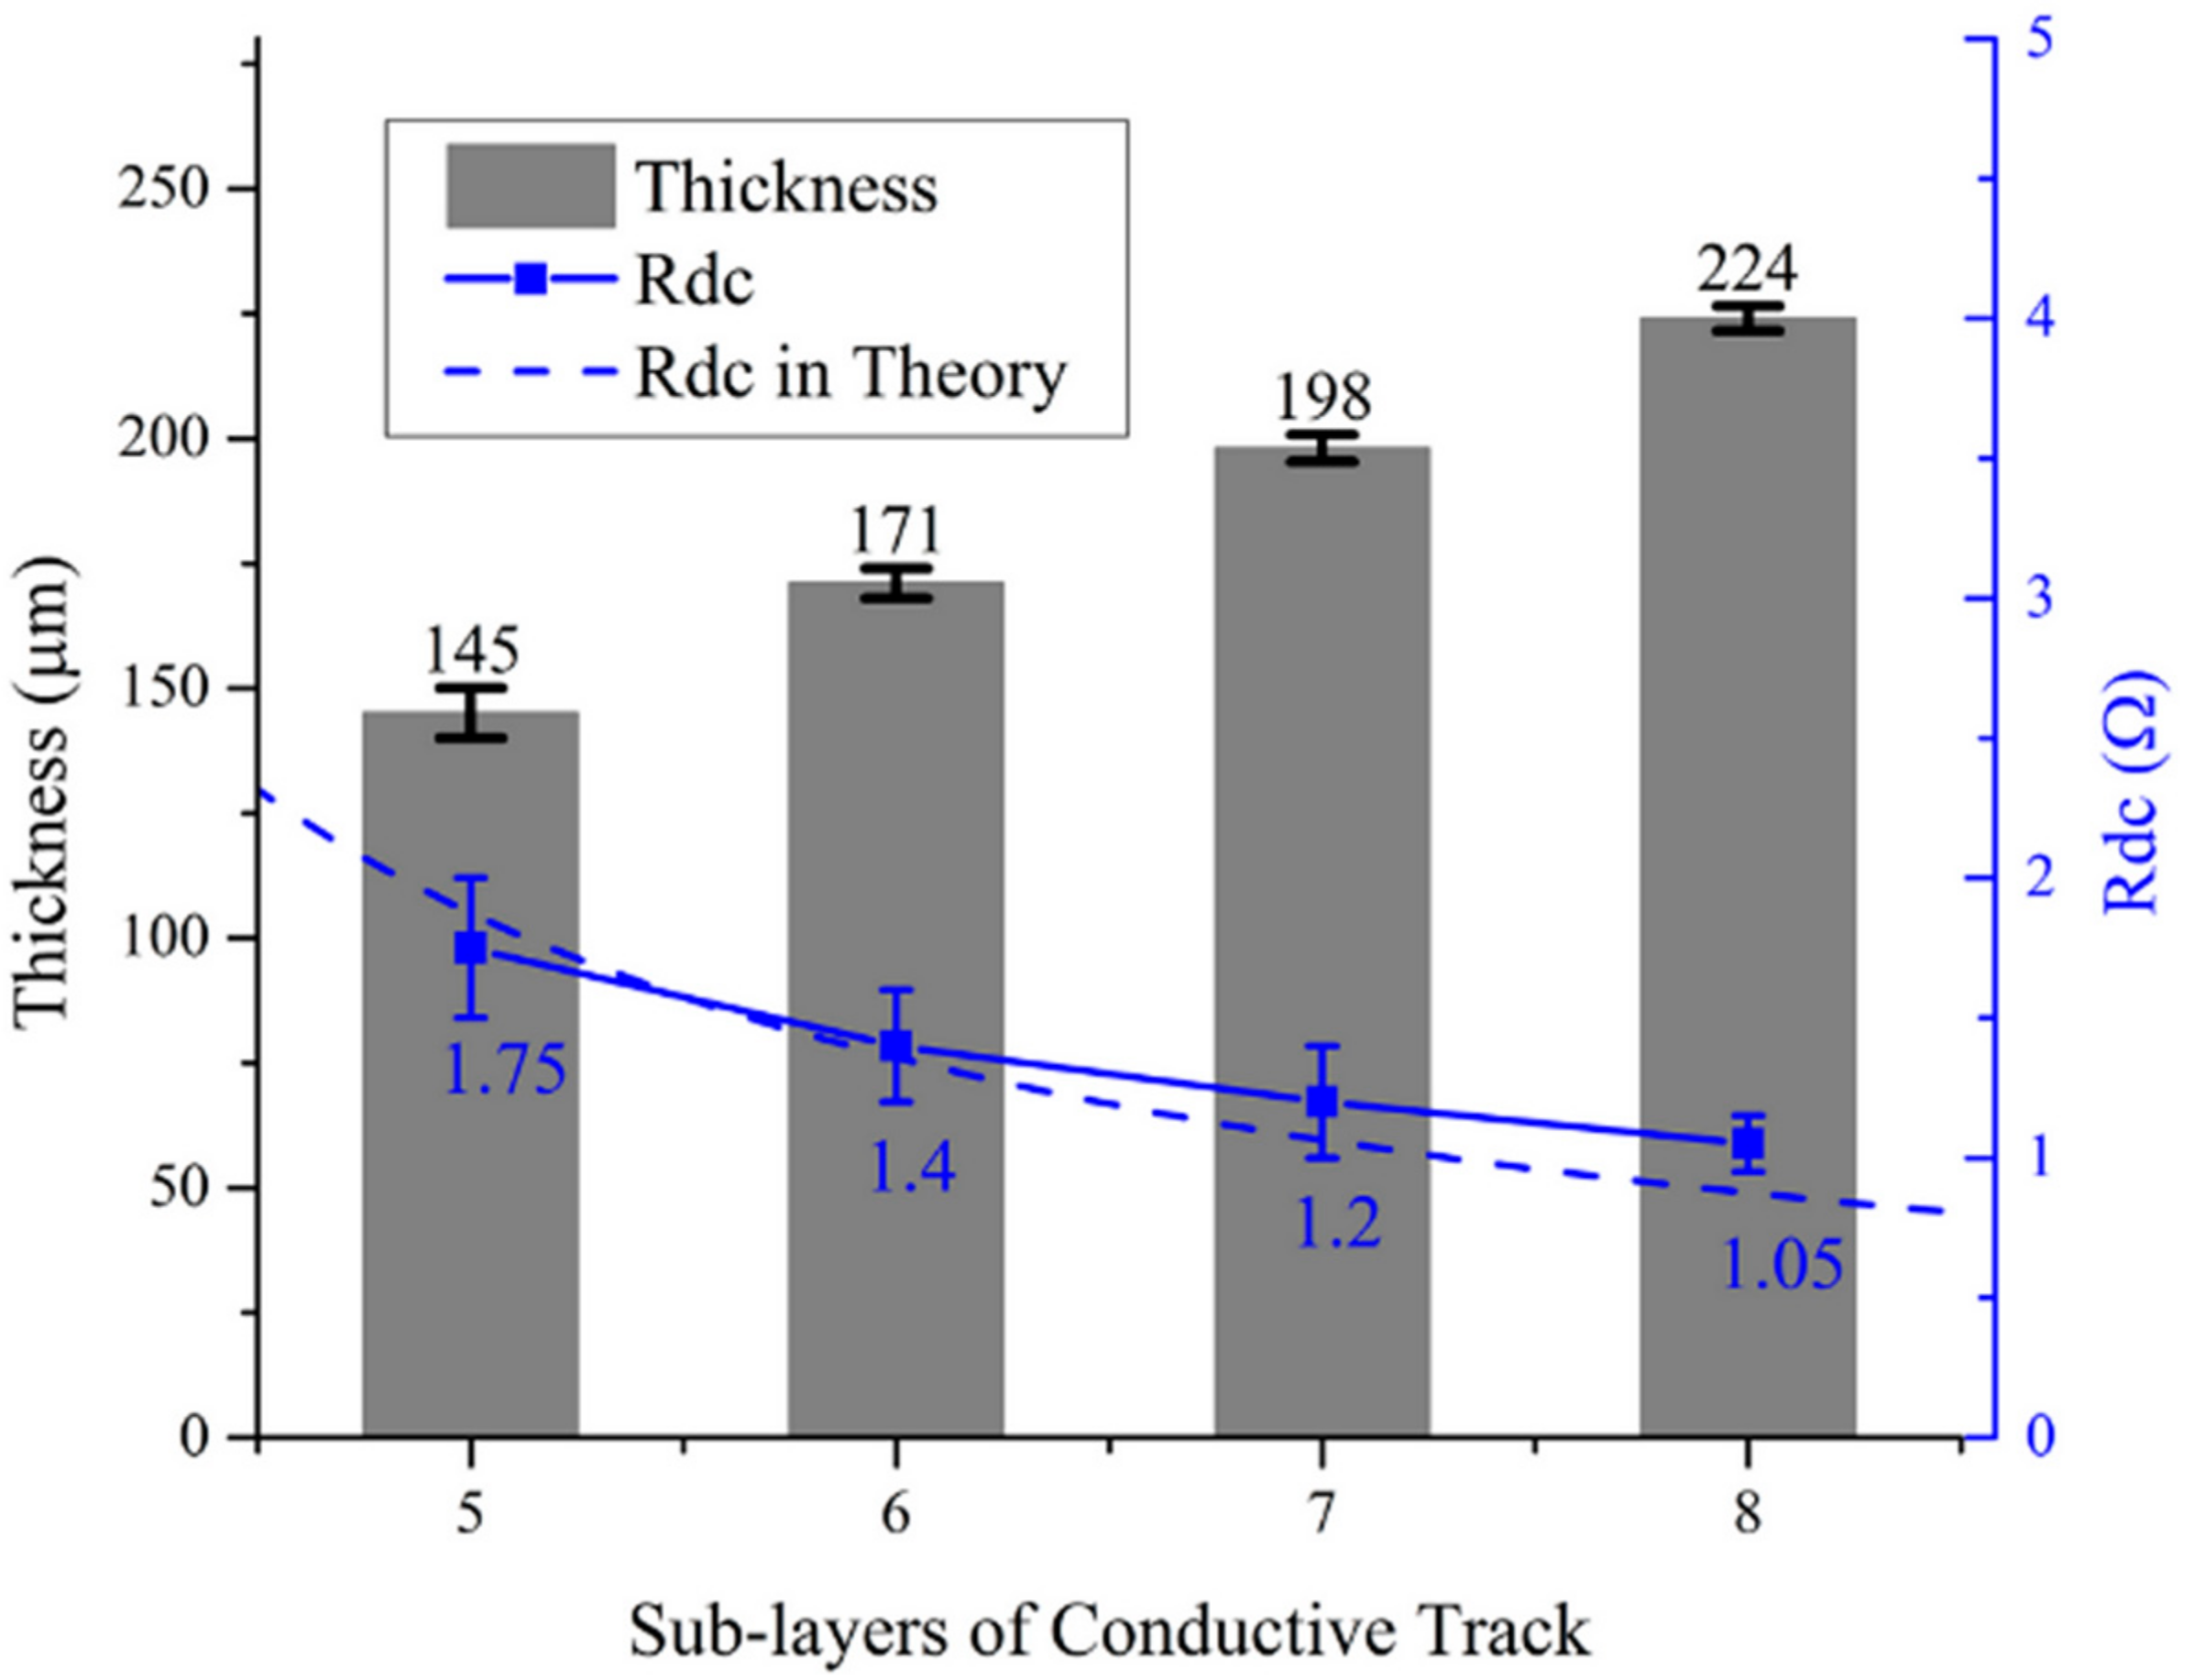
In Table 1, the thicknesses of the overall layer, which are comprised of eight sub-layers, are approximately 5% less than twice the thickness of layers with four sub-layers. This means that the thickness of upper sub-layers is less than the lower sub-layers due to the reduced separation between substrate and screen mesh when the upper sub-layers are printed. As more sub-layers of conductive track are printed the thickness of the entire conductive layer is increases and the standard deviation is reduced, and consequently the surface roughness and deviation of the DC resistance are also reduced. By comparing the theoretical sheet resistance, it can be observed that the practical value was higher than expected on all samples, due to the mix of different resistivities between the conductive binder and silver particles. Measured values of DC resistances of printed coils with four different numbers of conductive sub-layers are shown in Figure 6. They are compared with the theoretical calculation of DC resistance the conductors with given thickness have, the values of thickness and resistances are calculated based on 10 measurements of three different samples of each number of sub-layers. By adding up to eight conductive sub-layers, a conductive layer of approximately 224 μm thickness was printed to achieve a nominally 1 Ω DC resistance. The relationship between DC resistance and the thickness of the conductive layer is a continuous function from the minimal thickness to the maximal. The practical DC resistance is within −15% to +10% of the theoretical calculation because of the variation of the thickness of printed layer in different areas due to the process used.
4.4. Flexibility of Coils
A nominal DC resistance of 1 Ω has been achieved by increasing the thickness of the conductive layer. The DC resistances of the printed coils are measured after bending round a mandrel with a radius of 150 mm to demonstrate the functionality of the coils after deformation. The DC resistance is increased to 1.15 Ω ± 7% in 6 samples which is an increase of 15% over an un-deformed coil. This demonstrates an acceptable degree of flexibility.
5. Experimental Procedure
5.1. Measurement of Electrical Characteristics of Printed Coils
After printing and curing, the following five essential electrical characteristics were measured and calculated, then they were compared with the theoretical model and calculations to characterize the performance of a coil for WPT:
- Equivalent Series Resistance (ESR)
- Inductance
- Self-Resonant Frequency (SRF)
- Parasitic capacitance
- Unloaded Q factor
ESR was directly measured using a Wayne Kerr 6500B (Wayne Kerr Electronics, London, UK) impedance analyzer at 200 kHz drive frequency. To find the SRF a Rohde & Schwarz ZVB 4 (Rohde & Schwarz, Munich, Germany) vector network analyzer was used to analyze the impedance phase angle in a range of frequencies from 300 kHz to 3 GHz. Using these instruments, the inductance, parasitic capacitance and SRF are found as follows:
- Locate the SRF fSR where the phase angle of the input impedance is zero, using the vector network analyzer.
- Read the inductance Lcoil from the impedance analyzer at the frequency 1/10 of fSR where the parasitic capacitance has negligible effect.
- Calculate the parasitic capacitance as .
- Read the ESR Re from the impedance analyzer at the frequency 1/10 of SRF and calculate the unloaded Q factor Qu using Equation (6).
To quantify the performance of the printed coil in a WPT application two other type of coils were also measured. One was a flat spiral air-core coil wound using 1.2 mm diameter copper wire with the same equivalent diameter davg and Δ as the printed coil. The second one was formed using copper adhesive tape on paper to give the same geometry as the printed coil.
The resonant tank capacitors for each coil were calculated using Equation (7), based on the measured parameters. The tank capacitors were implemented using polypropylene film capacitors which have lowest dielectric absorption and are suitable for the compensation of inductive coils.
5.2. Measurement of Performance of Wireless Power Transfer System
The printed coils with their resonant tank capacitors were connected to Qi standard compliant bqTESLA commercial driver bq500211EVM and receiver bq51013AEVM evaluation modules from Texas Instruments [24,25] to evaluate the performance of the coils. The transmitter module operates between 110 kHz and 205 kHz, with the operating frequency automatically varying as a function of the load. The receiver module has an internal output voltage regulator that provides 5 V DC at up to 1 A, subject to sufficient incoming energy from the transmitter module.
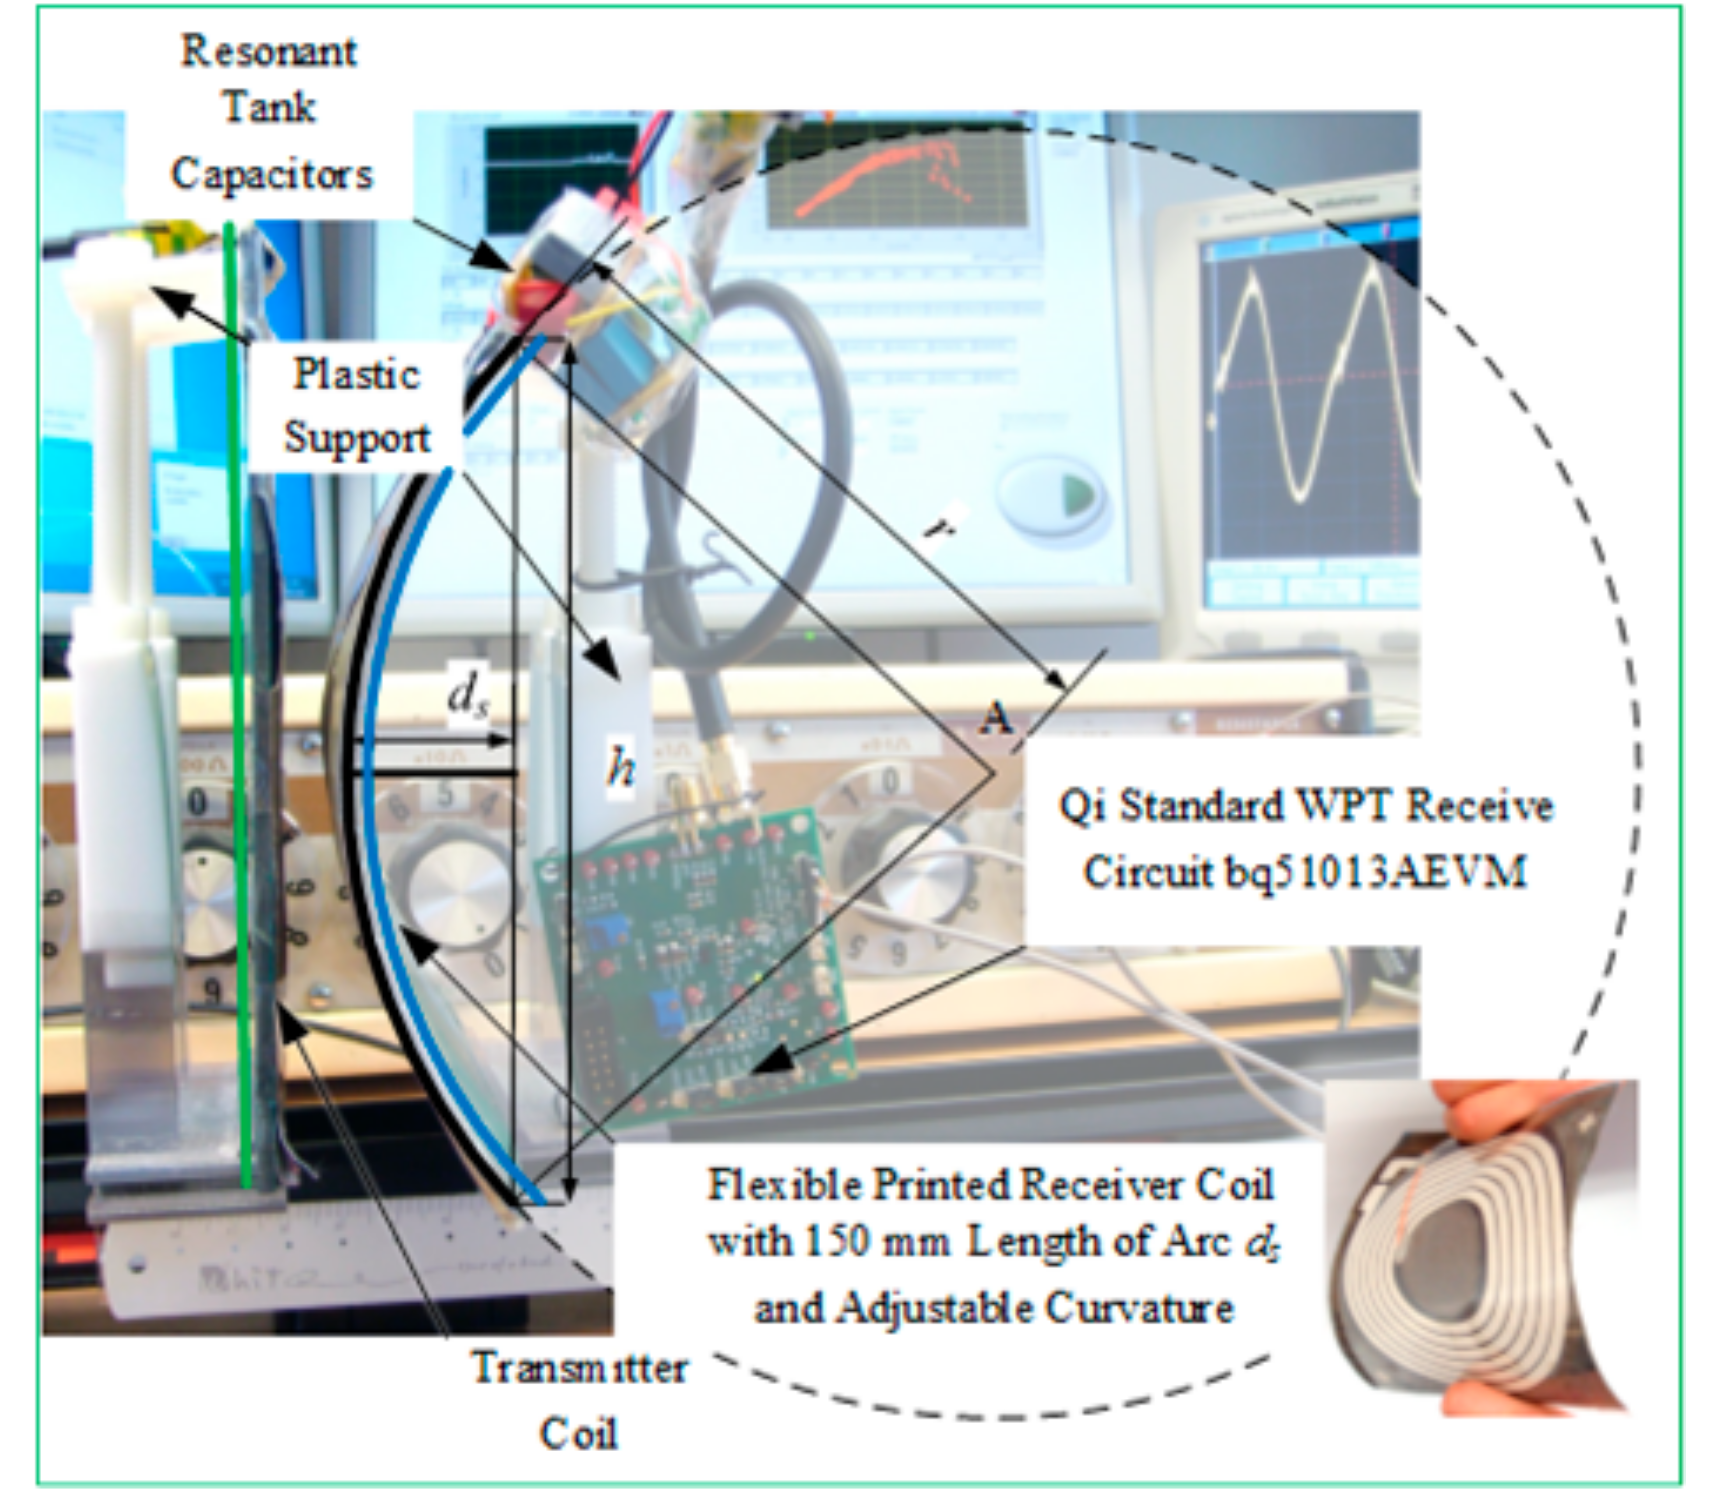
In the bqTESLA wireless power transfer system, a pair of rigid wound coils are provided. In this experiment, these original coils and their resonant tank capacitors were replaced by the tuned copper tape coils and printed coils. Measurements of wireless power transfer were performed on a plastic support to avoid influencing the magnetic field as shown in Figure 7. The center separation distance, misalignment, and rate of deformation of coils mounted on these supports can be adjusted. The DC output power and DC to DC efficiency were measured as follows:
- Mount the paired coils on the supports with the driver and receiver circuit and adjust their position to align the centers.
- With the driver powered vary the load on the output of the receiver circuit and record the input DC current to the driver circuit and the output voltage from the receiver circuit and the corresponding load resistance.
- Use the load resistance and output voltage values calculate the output current and power transferred.
- Plot the output power of the receiver circuit versus its output current and locate the maximum output power point.
- Record the input DC voltage and current to the transmitter circuit to calculate the input power for wireless power transfer and overall DC to DC efficiency.
- Plot the overall DC to DC efficiency of the system versus the output current and locate the maximum efficiency point.
- Adjust the separation distance between the TX and RX coils, and then repeat steps 2 to 6, plot the maximum DC to DC efficiency for each separation distance.
- Adjust the curvature of the RX coil to simulate deformation of the wearable device while keeping the TX coil flat, and then repeat steps 2 to 7, plot the maximum DC to DC efficiency versus the deformation of flexible coil.
To perform these measurements the receiver output was loaded using a resistance box to allow adjustment of the load current, load resistances between 1 kΩ and 10 Ω were used to give a nominal current load range of 5 mA to 500 mA at the nominal 5 V DC output level. The voltage across the load was measured using a 12-bit A/D convertor (NI USB-6008 in differential mode) to take into account any output voltage variations with load, and the output power under each different distance and rate of deformation was then calculated. The DC to DC efficiency can then be calculated as:
where PLoad is the power delivered to the load and PDC is the power supplied from the DC power supply.
Varying the load resistance changes the output current of the receiver circuit and the input power. The output voltage of the receiver circuit is fixed at 5 V DC by its internal regulation process, providing there is sufficient energy available at its input to provide the required amount of output power. A series of system-level input and output power values can therefore be measured. The DC to DC efficiency can be calculated and graphs can then be plotted to show the output power and the DC to DC efficiency against the output current of wireless power transfer. The maximum output power and DC to DC efficiency points of the WPT can be found by locating the maximum values on the P/I and curves. The center separation distance between the TX and RX coils can be measured between the TX and RX coil supports, DC-DC efficiency can be calculated and plotted against the separation distance. To achieve a controllable curvature of deformation of coils an assumption was made that the bent spring plate to which the flexible coil was attached has a constant curvature forming an arc of a circle. The curvature of the coil Kcoil can be changed by varying the vertical distance h as defined in Equation (10) and shown in Figure 7, in the figure the fixed TX coil is highlighted in green and the adjustable curvature RX coil is highlighted in blue.
6. Electrical Characteristics of Printed Coils
The self-resonant frequencies (SRFs) of coils are located as shown in Figure 8. The SRF of the wound copper coil was at 10.3 MHz, and the highest SRFs of both copper tape coil and the printed coil are 17.6 MHz for the un-deformed coils. A deformation of 16 m−1 gives a 1% increase in the observed SRFs. The inductance was then measured to calculate the parasitic capacitance at 1.03 MHz and 1.76 MHz for the wound copper and flexible coils, respectively. Equivalent series resistances (ESRs), and unloaded Q factors are measured and calculated as specified in Section 5. The coil parameters are listed in Table 2 and compared with the theoretical values obtained using Equations (1)—Lcircular, (4)—Re, (5)—Cp, and (6)—Qu. The values of practical inductance, ESR, and unloaded Q factor are calculated based on the measurements on five samples of each type of coil.
The practical inductances of all types of coils are within 14% of theoretical value for flat coils. The difference in inductance between the copper tape and the printed coil is 12%, which implies the inductance of a coil is mainly affected by the winding dimensions and geometry rather than the fabrication method used. The theoretical calculation of the parasitic capacitance of printed coils from the design has a discrepancy of 17% from the experimental value obtained from the printed coil based on the measured SRF and inductance. One reason for this difference is the varying relative permittivity of the surrounding materials (i.e., the interface material and textile). The difference between the measured and theoretical ESRs of all types of coil tested are within 6%, which is within an acceptable margin. The ESR of the printed coil has the largest deviation followed by the copper tape coil on paper, and then the wound copper coil. This is due to the variation in the conductor thickness which is greatest in the printed coils when compared with the other two types of coils. Compared with the wound copper and copper tape coils, the printed coils have a reduction of up to 55% in their unloaded Q factor, which is predominantly attributable to the higher ESR of the printed flexible conductive paste compared with copper.
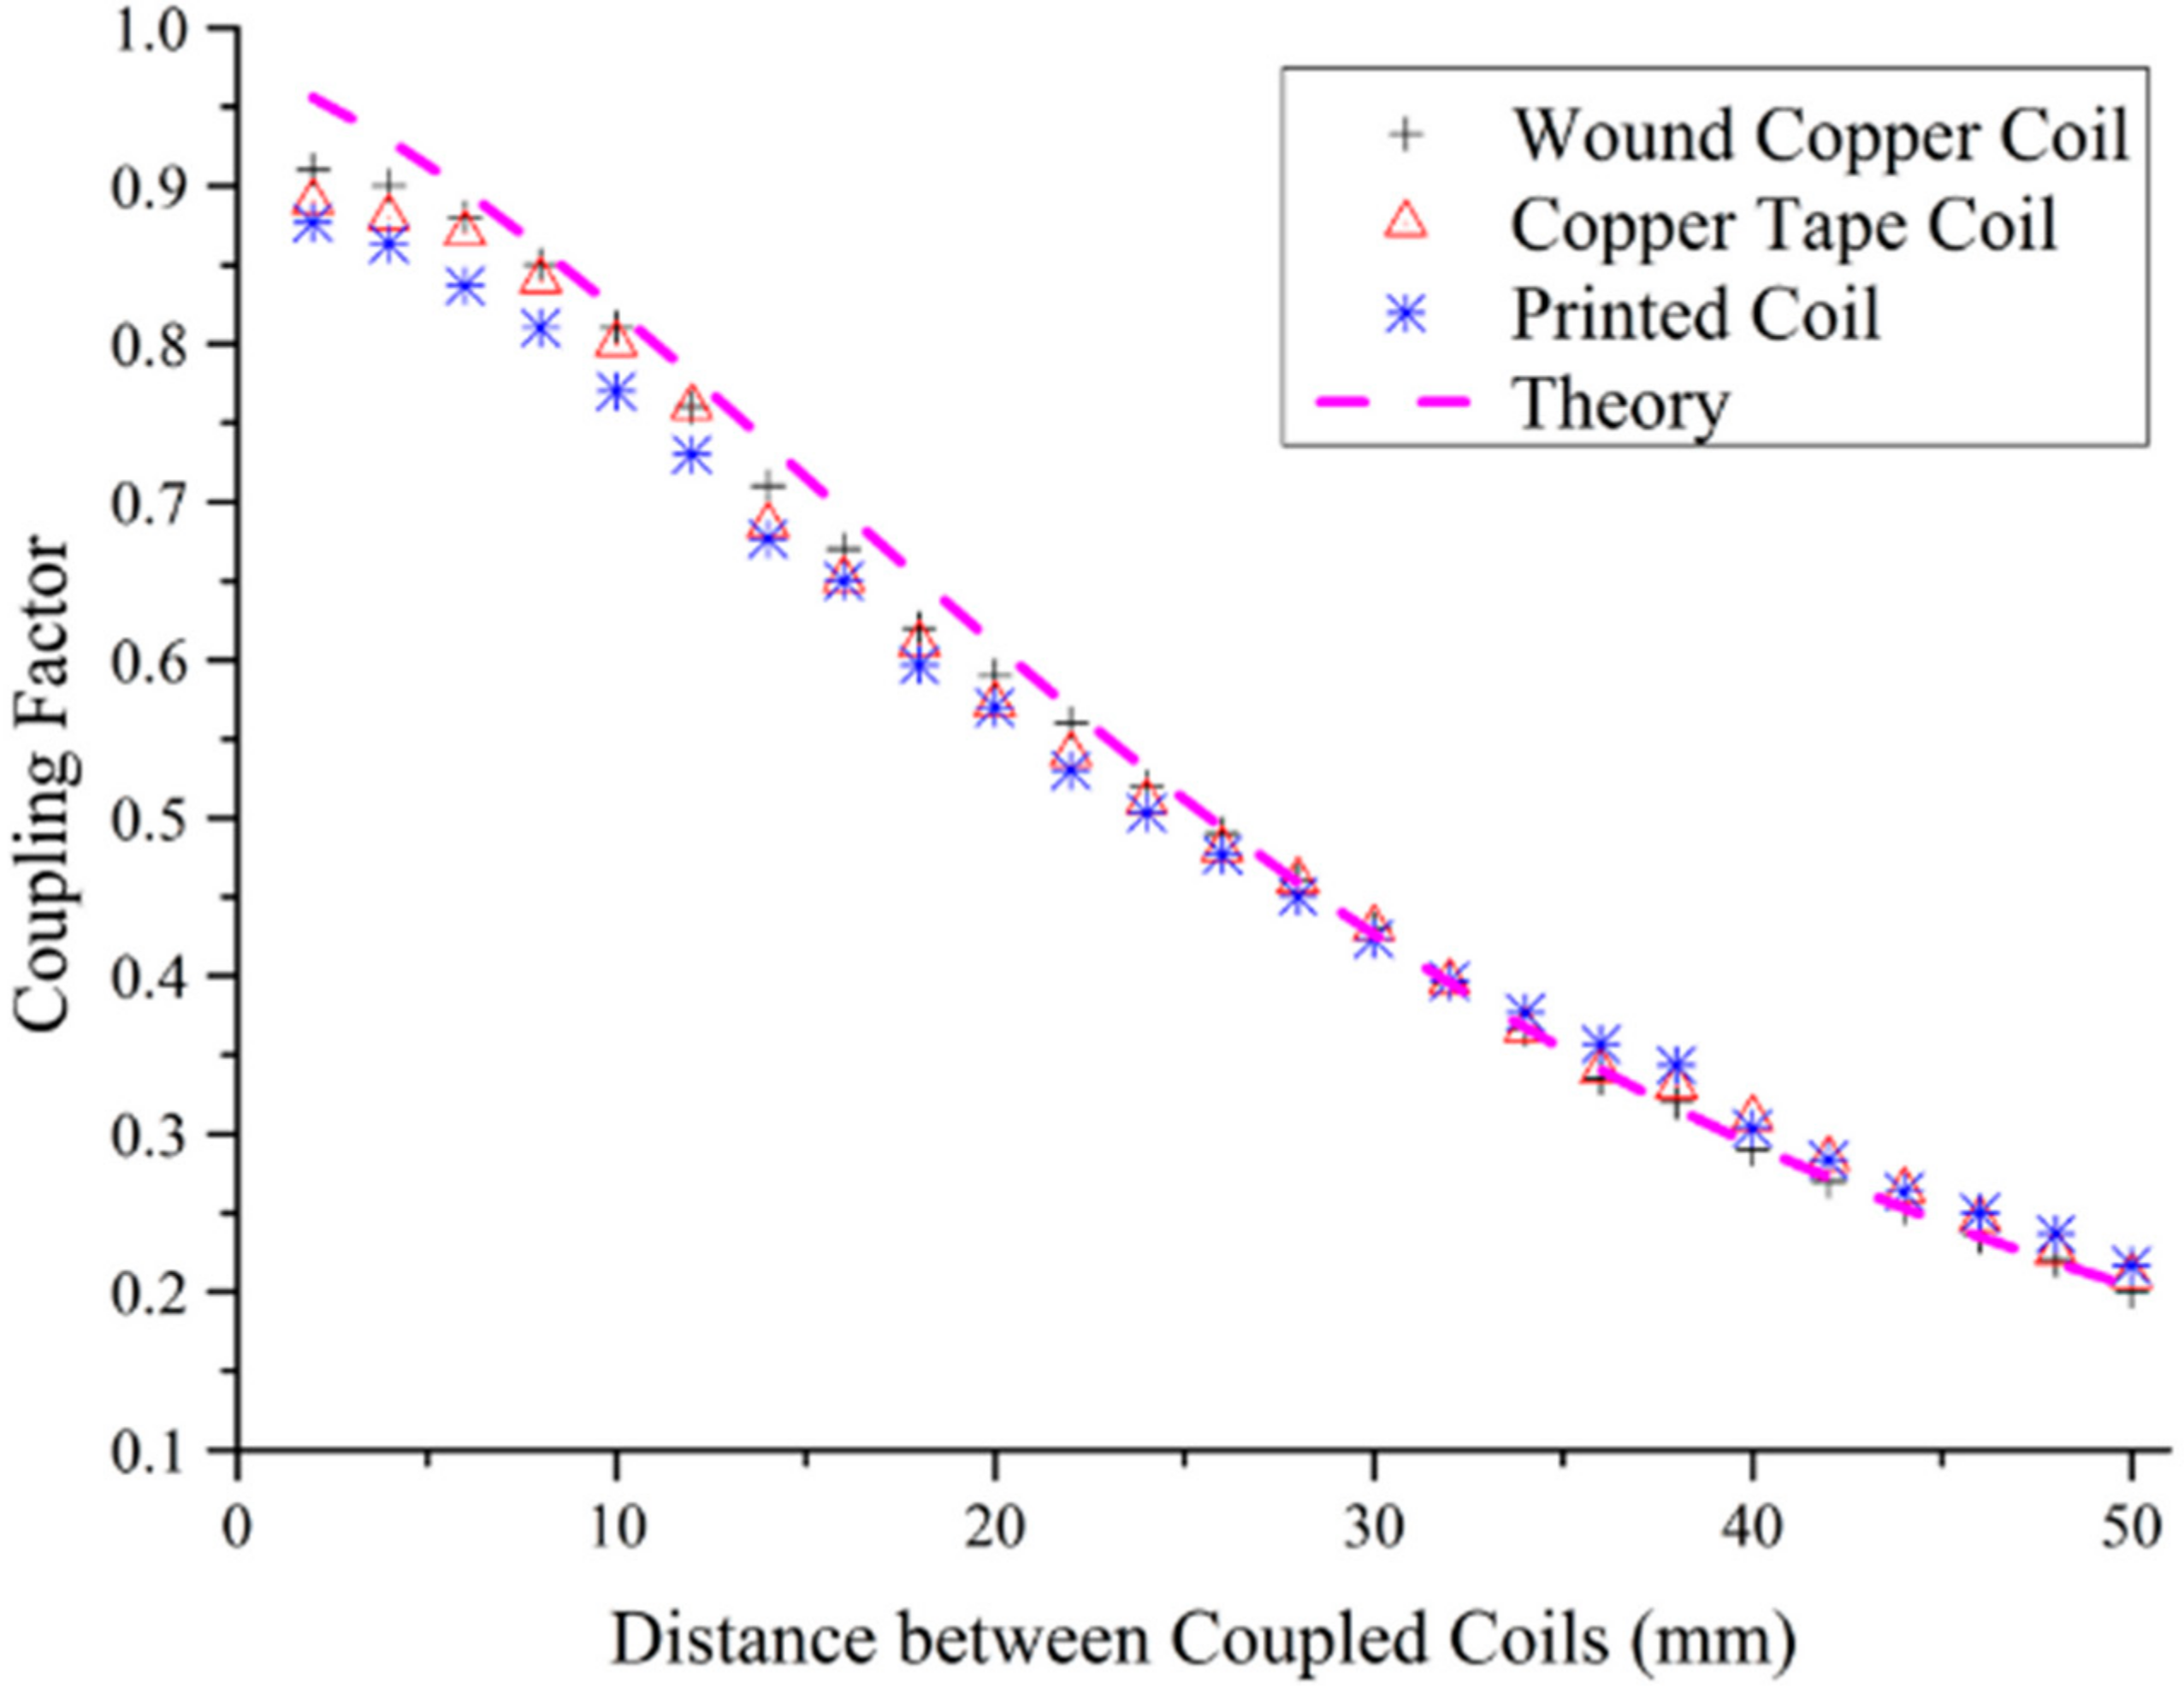
To measure the coupling factor the printed coils are tuned in pairs as TX and RX coils for use in the WPT system and then the coupling factor k is measured following the process used by Kazimierczuk and Czarkowski [26]. The variation in coupling factor as a function of spacing between two coils is illustrated in Figure 9 and compared with the theoretical calculation from Equation (8) for the different coil types. The experimental results of coupling factors versus separation distance for the tested coils follows the theoretical calculation, although the coupling factor limits to a value of approximately 0.9 where the separation distance was less than 6 mm. Values at separation distances of 5, 10, 15, and 20 mm between the two coils were used to calculate the resonant tank capacitors using Equation (7). The value of the capacitors used is given in Table 3. With the appropriate tank capacitors fitted, the maximum output currents and overall DC-DC efficiencies were found and are reported in Table 4.
7. System Performance
7.1. Output Power of WPT
The plots of output power versus output current obtained by employing paired coils of the different types are shown in Figure 10. The given standard deviation of maximum output power is calculated based on 10 measurements with each pair of coils.
The maximum output DC power of the WPT system using the printed coils can be observed to be 1.51 W at 0.37 A output current. For all the coils tested, the errors of maximum output power are 1%, 1.5%, 1.7%, and 1.8% at 5, 10, 15, and 20 mm separation, respectively.
7.2. DC to DC Efficiency
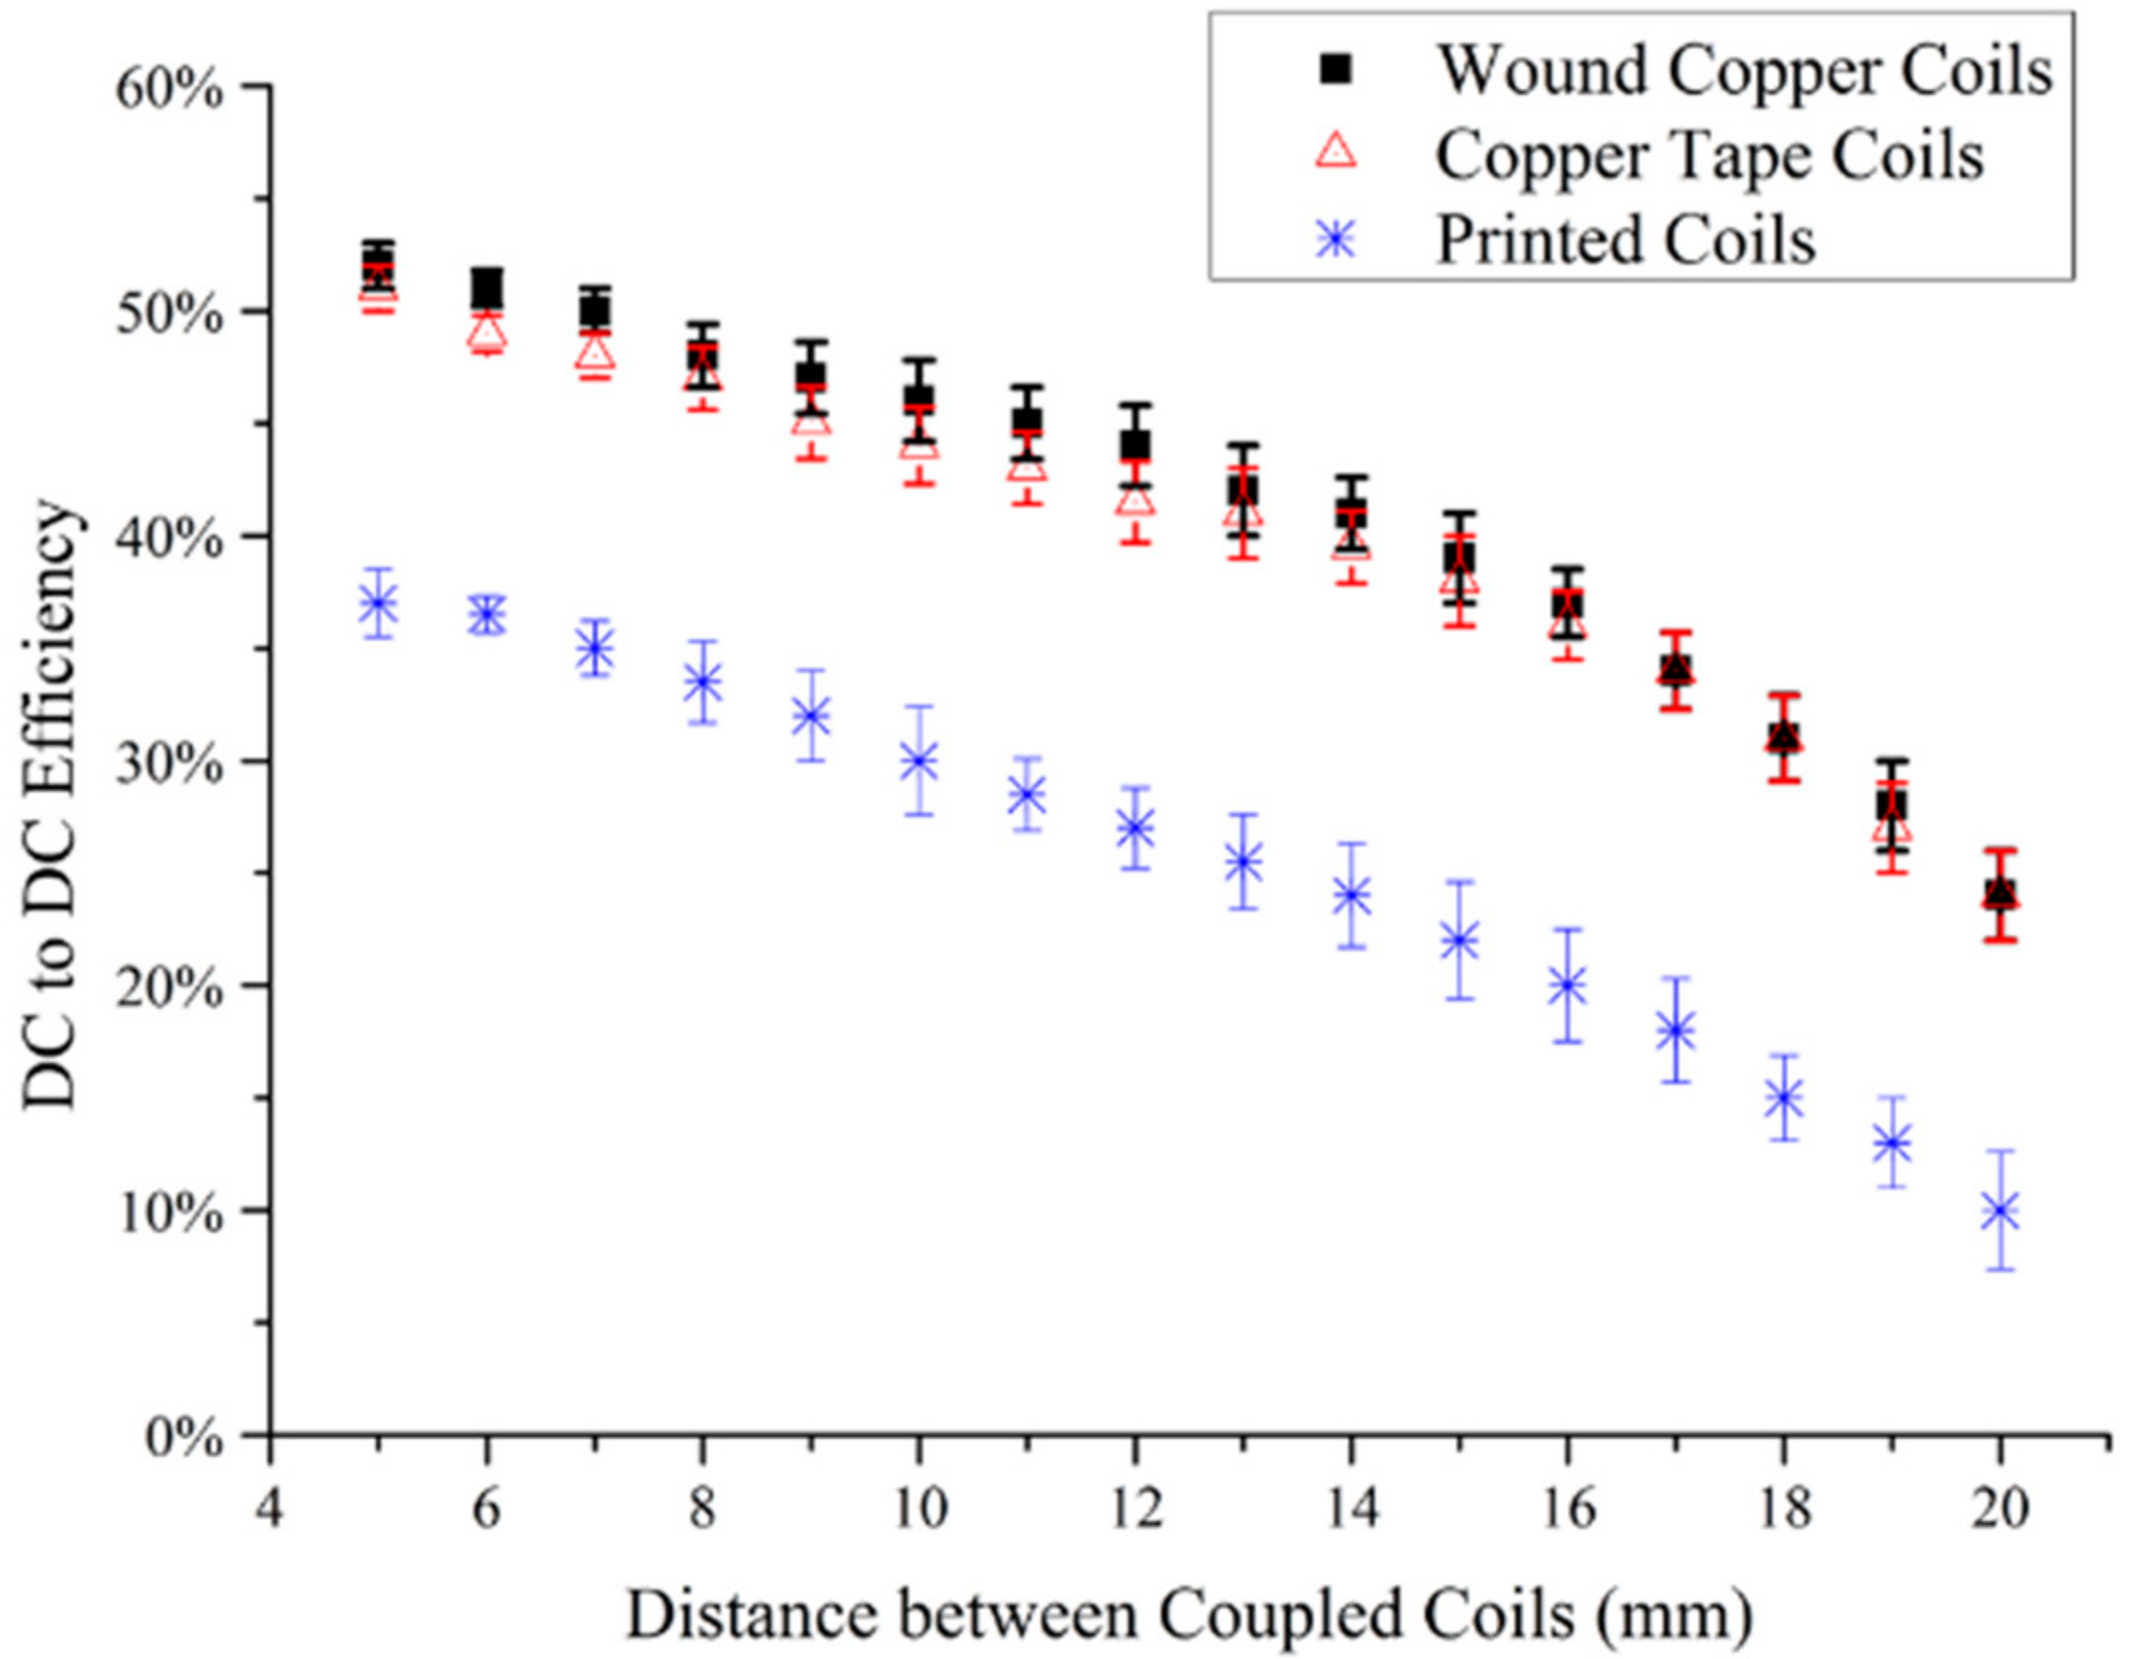
The DC to DC efficiency of a WPT system given in Table 4 indicates the overall performance of the WPT system as a whole. The system with wound copper coils had an optimal 52% DC to DC efficiency under full load at 5 mm separation distance [24,25]. The DC to DC efficiency of the system equipped with copper tape and printed coils were measured at 5, 10, 15, and 20 mm separation distances with varying load. The highest efficiencies given in Table 4 occur at the maximum output power point, which was as expected since the Qi WPT system is designed to achieve optimal efficiency under full load. The WPT system equipped with the printed coils has up to a 60% reduction in the DC to DC efficiency compared to that of the wound copper coils, this reduction in efficiency is attributed to the losses associated with the ESRs of the printed coils.
The DC to DC efficiency at optimal output current against varying separation distance for the different types of paired TX and RX coils is shown in Figure 11. It can be seen that the efficiency reduces as the separation distance increases for all the types of coils tested.
7.3. Effect of Deformation on Coils
A pair of axially aligned printed coils with varying curvature of RX coil was used to simulate the deformation of the coil in the wearable device. The maximum output power and DC to DC efficiency against the curvature of the deformed RX coil are shown in Figure 12 with a coil separation distance of 5 mm. The maximum output power is reduced by 33% and the efficiency reduces by 20% as the coil was deformed to vary its curvature from 8 m−1 to 16 m−1. This range of curvature matches the diameters of human legs for 90.1% people in UK [27].
When the separation distance between the TX and deformed RX coil was increased, the DC to DC efficiency reduces as shown in Figure 13. It shows that the separation distance of center aligned printed coil pairs is the major influencing factor for the DC to DC efficiency of WPT systems utilizing flexible coils. In an application of a device worn on the body the separation distance between the TX and RX coils will typically be in the range between 0 and 20 mm; however, the range of anticipated deformation of the coil is in the range 0 to 16 m−1. Using these range values and the data presented in Figure 11 and Figure 13 the separation distance can be seen to cause a DC to DC efficiency drop of 27.7% when the curvature is kept constant, whereas varying the curvature from 0 to 16 m−1 while keeping the separation distance constant only causes the DC to DC efficiency to fall by 8.8%.
8. Safety Considerations
A WPT system is by nature going to be radiating electromagnetic energy and while the primary intention is that as much of this energy as possible is absorbed by the receive coil, it is inevitable that some may be absorbed by other materials. In the case of an on-body system, it is likely that some of the radiated energy will be absorbed by the wearer’s body. The International Commission on Non-Ionizing Radiation Protection (ICNIRP) publish guidelines for acceptable field strengths at different frequencies [28]. These guidelines provide limits for electric field strength, magnetic field strength and magnetic flux density for both occupational (repeated) and general public (occasional) situations at a selected operating frequency. The field strengths and flux densities can be simulated using models of the human body as done by Jonah et al. [29], this approach uses ANSYS HFSS simulation software to calculate the magnetic field distribution within the body resulting from an external radiator. A theoretical calculation and experimental verification method has been presented by Clare et al. [30] to calculate the maximum permissible drive power for a WPT system operating at 100 kHz so as to comply with the ICNIRP guidelines. This approach is continued by Worgan et al. [31] to define a design space for the design of WPT devices to be used in on-body applications considering safety, power transfer and user comfort.
For the purpose of this work on-body testing was not performed since the intention is to concentrate upon the underlying fabrication techniques and the verification of these for use in a WPT system. For compliance with the ICNIRP guidelines, the maximum output of the transmitter drive circuitry should be set so that the measured field strengths and flux densities at the closest possible separation distance are within the limits defined for the frequency of operation.
As a further exposure limiting action, commercial examples such as the Qi standard used as the power driver and receiver in this work, operate a polling-type approach whereby the output is energized for a short while and the presence of an appropriate receiver system is queried using communication back from the energy sink. This communication can be achieved by pulsed disconnection of the load, causing the output of the transmitter to be modulated, which can in turn be detected by the driver system. In the case where a suitable energy sink is located power transmission continues, with periodic checks that the energy sink is still present. When an energy sink is no longer present the transmitter output is shut down and the transmitter waits a pre-determined time before repeating the polling process.
9. Conclusions
A constant-width single-layer circular-spiral coil has been designed and fabricated using screen printing on an interface-coated flexible textile. This provides a novel means of producing a flexible coil directly integrated with a host textile as opposed to methods such as the addition of a flexible PCB-based coil to a separate textile by a method such as sewing, the integration of the coil directly with the textile can befit the end-user’s comfort. The functionality of this flexible coil for use in a WPT system is examined in this paper. The experimental results from the tests of the flexibility and electrical characteristics of the screen-printed coil have been described and show that the flexible screen-printed coils on 65/35 polyester/cotton textile achieve an acceptable flexibility. This has been achieved by using an interface layer (Fabink-UV-IF1) to facilitate the successful printing of the conductive paste with the desired geometry and resolution and to prevent the spreading and permeation of the conductive paste into the textile. The electrical characteristics of screen-printed coils have been measured and the results have been compared with theoretical calculations of the SERs, capacitance and inductance of the coils and found to agree within a reasonable range of 17%. A 1.51 W DC output has been achieved by a WPT system using Qi wireless power standard compliant driver and receiver circuitry in conjunction with the screen-printed flexible coils.
The ESRs and parasitic capacitance of the printed coils lead to increased losses in the coils when compared to wound copper coils resulting in the loss of energy in the inductive coupling process and therefore reducing the overall efficiency of the WPT system. A comparison of the DC to DC transfer efficiency of the WPT system with different types of coils has shown the DC to DC efficiency of the printed coils to be limited to 37% compared to a 52% efficiency recorded for the wound copper coils. The separation distance of two coils was found to be the major influencing factor on the DC to DC efficiency compared with the effect of deformation of the flexible coils from a planar form.
Author Contributions
Y.L., N.G. and J.T. conceived and designed the experiments; Y.L. performed the experiments; Y.L., N.G. and J.T. analyzed the data; R.T. contributed materials and fabrication expertise; Y.L., N.G. and S.B. wrote the paper.
Acknowledgments
The authors wish to acknowledge the support of the UK Engineering and Physical Sciences Research Council (EPSRC). Part of this work was performed under the SPHERE IRC funded by the UK Engineering and Physical Sciences Research Council (EPSRC), Grant EP/K031910/1. The authors also acknowledge funding from the European Union Seventh Framework Programme (FP7/2007–2013) under grant agreement no. 260034 for the project titled: ‘TIBUCON: Self Powered Wireless Sensor Network for HVAC System Energy Improvement Towards Integral Building Connectivity’, which is part of the ICT for Sustainable Growth Research Program. Beeby also gratefully acknowledges EPSRC support through his Fellowship ‘Energy Harvesting Materials for Smart Fabrics and Interactive Textiles’ (EP/I005323/1). The data for this paper can be found at doi.org/10.5258/SOTON/D0401.
Conflicts of Interest
The authors declare no conflict of interest. The funding sponsors had no role in the design of the study; in the collection, analyses, or interpretation of data; in the writing of the manuscript, and in the decision to publish the results.
References
- Hui, S.Y.R.; Wenxing, Z.; Lee, C.K. A Critical Review of Recent Progress in Mid-Range Wireless Power Transfer. IEEE Trans. Power Electron. 2014, 29, 4500–4511. [Google Scholar] [CrossRef] [Green Version]
- Young-Sik, S.; Minh Quoc, N.; Hughes, Z.; Rao, S.; Chiao, J.C. Wireless power transfer by inductive coupling for implantable batteryless stimulators. In Proceedings of the IEEE MTT-S International Conference on Microwave Symposium Digest (MTT), Montreal, QC, Canada, 17–22 June 2012; pp. 1–3. [Google Scholar] [CrossRef]
- Sun, X.; Peng, X.; Zheng, Y.; Li, X.; Zhang, H. A 3-D Stacked High-Q PI-Based MEMS Inductor for Wireless Power Transmission System in Bio-Implanted Applications. J. Microelectromech. Syst. 2014, 23, 888–898. [Google Scholar] [CrossRef]
- Islam, A.B.; Islam, S.K.; Tulip, F.S. Design and optimization of printed circuit board inductors for wireless power transfer system. Circuits Syst. 2013, 4, 237–244. [Google Scholar] [CrossRef]
- Kipphan, H. Handbook of Print Media: Technologies and Production Methods; Springer: Berlin, Germany, 2001. [Google Scholar]
- Mondal, S. Phase change materials for smart textiles–An overview. Appl. Therm. Eng. 2008, 28, 1536–1550. [Google Scholar] [CrossRef]
- Paul, G.; Cao, F.; Torah, R.; Yang, K.; Beeby, S.; Tudor, J. A Smart Textile based Facial EMG and EOG Computer Interface. IEEE J. Sens. 2014, 14, 393–400. [Google Scholar] [CrossRef]
- Wagner, S.; Bonderover, E.; Jordan, W.B.; Sturm, J.C. Electrotextiles: Concepts and challenges. Int. J. High Speed Electron. Syst. 2002, 12, 391–399. [Google Scholar] [CrossRef]
- Younghwan, K.; Sungjoon, L. High efficient misaligned wireless power transfer using magnetic resonant coupling and additional capacitor. In Proceedings of the Microwave Conference Proceedings (APMC), Kaohsiung, Taiwan, 4–7 December 2012; pp. 1049–1051. [Google Scholar] [CrossRef]
- Zolog, M.; Pitica, D.; Pop, O. Characterization of Spiral Planar Inductors Built on Printed Circuit Boards. In Proceedings of the 30th International Spring Seminar on Electronics Technology, Cluj-Napoca, Romania, 9–13 May 2007; pp. 308–313. [Google Scholar] [CrossRef]
- Ng, D.C.; Boyd, C.; Shun, B.; Felic, G.; Halpern, M.; Skafidas, E. High-Q flexible spiral inductive coils. In Proceedings of the Electromagnetic Compatibility Symposium—Melbourne (EMC Melbourne), Melbourne, Australia, 8–10 September 2010; pp. 1–4. [Google Scholar] [CrossRef]
- Ashoori, E.; Asgarian, F.; Sodagar, A.M.; Euisik, Y. Design of double layer printed spiral coils for wirelessly-powered biomedical implants. In Proceedings of the IEEE Annual International Conference on Engineering in Medicine and Biology Society, Boston, MA, USA, 30 August–3 September 2011; pp. 2882–2885. [Google Scholar] [CrossRef]
- Song, Z.; Yahyaoui, W.; Duval, F.; Su, D.; Louis, A. Capturing skin effect with an effective nonuniform mesh and coupled R-L circuits. Electron. Lett. 2011, 47, 94–95. [Google Scholar] [CrossRef]
- Jakubiuk, K.; Zimny, P. Skin effect in rectangular conductors. J. Phys. A Math. Gen. 1976, 9, 669. [Google Scholar] [CrossRef]
- Lan, J.; Tang, H.; Gen, X. Frequency Splitting Analysis of Wireless Power Transfer System Based on T-type Transformer Model. Electron. Electr. Eng. 2013, 19, 109–113. [Google Scholar] [CrossRef]
- Greconici, M.; Madescu, G.; Mot, M. Skin effect analysis in a free space conductor. Facta Univ.-Ser. Electron. Energ. 2010, 23, 207–215. [Google Scholar] [CrossRef]
- Kiani, M.; Uei-Ming, J.; Ghovanloo, M. Design and Optimization of a 3-Coil Inductive Link for Efficient Wireless Power Transmission. IEEE Trans. Biomed. Circuits Syst. 2011, 5, 579–591. [Google Scholar] [CrossRef] [PubMed] [Green Version]
- Xue, R.F.; Cheng, K.W.; Je, M. High-Efficiency Wireless Power Transfer for Biomedical Implants by Optimal Resonant Load Transformation. IEEE Trans. Circuits Syst. I Regul. Pap. 2013, 60, 867–874. [Google Scholar] [CrossRef]
- Wei, W.; Qiang, F. Design and simulation of printed spiral coil used in wireless power transmission systems for implant medical devices. In Proceedings of the IEEE Annual International Conference on Engineering in Medicine and Biology Society, Boston, MA, USA, 30 August–3 September2011; pp. 4018–4021. [Google Scholar] [CrossRef]
- Zierhofer, C.M.; Hochmair, E.S. Geometric approach for coupling enhancement of magnetically coupled coils. IEEE Trans. Biomed. Circuits Syst. 1996, 43, 708–714. [Google Scholar] [CrossRef] [PubMed]
- Li, Y.; Torah, R.; Beeby, S.; Tudor, J. An all-inkjet printed flexible capacitor for wearable applications. In Proceedings of the IEEE Symposium on Design Test, Integration and Packaging of MEMS/MOEMS (DTIP), Taipei, Taiwan, 28–31 October 2012; pp. 192–195. [Google Scholar]
- Smart Fabric Inks Ltd. UV Curable Pastes for Use on Textiles: Fabink-UV-IF1 Datasheet. Available online: www.fabinks.com (accessed on 12 January 2018).
- Smart Fabric Inks Ltd. Smooth Interface Layer Paste for Printing on Fabrics. Available online: www.fabinks.com (accessed on 12 January 2018).
- Texas Instruments. bq500211 bqTESLA Wireless Power TX EVM. Available online: www.ti.com/lit/ug/slvu536a/slvu536a.pdf (accessed on 12 January 2018).
- Texas Instruments. bq51013AEVM-765 Evaluation Module. Available online: www.ti.com/lit/ug/sluu911a/sluu911a.pdf (accessed on 12 January 2018).
- Kazimierczuk, M.K.; Czarkowski, D. Resonant Power Converters; John Wiley & Sons: Hoboken, NJ, USA, 2012. [Google Scholar]
- Bogin, B.; Varela-Silva, M.I. Leg length, body proportion, and health: A review with a note on beauty. Int. J. Environ. Res. Public Health 2010, 7, 1047–1075. [Google Scholar] [CrossRef] [PubMed] [Green Version]
- ICNIRP. ICNIRP Guidelines for Limiting Exposure to Time-Varying Electric and Magnetic Fields (1 Hz–100 kHz). Health Phys. 2010, 99, 818–836. [Google Scholar] [CrossRef]
- Jonah, O.; Georgakopoulos, S.V.; Tentzeris, M.M. Wireless power transfer to mobile wearable device via resonance magnetic. In Proceedings of the IEEE 14th Annual IEEE Conference on Wireless and Microwave Technology Conference (WAMICON), Orlando, FL, USA, 7–9 April 2013; pp. 1–3. [Google Scholar] [CrossRef]
- Clare, L.; Worgan, P.; Stark, B.H.; Adami, S.-E.; Coyle, D. Influence of Exposure Guidelines on the Design of On-Body Inductive Power Transfer. In Proceedings of the IEEE Wireless Power Transfer Conference (WPTC), Boulder, CO, USA, 13–15 May 2015; pp. 1–4. [Google Scholar] [CrossRef]
- Worgan, P.; Clare, L.; Proynov, P.; Stark, B.H.; Coyle, D. Inductive power transfer for on-body sensors defining a design space for safe, wirelessly powered on-body health sensors. In Proceedings of the IEEE 9th International Conference on Pervasive Computing Technologies for Healthcare (PervasiveHealth), Istanbul, Turkey, 20–23 May 2015; pp. 177–184. [Google Scholar] [CrossRef]
Figure 1.
System diagram of wireless inductive power transmission system.

Figure 2.
Design of circular-spiral flat coil. The external diameter of the coil is designed based on the application, and other parameters are optimized for the maximized unloaded Q factor. The coils are printed on interface-coated 65/35 polyester/cotton textile.
Figure 2.
Design of circular-spiral flat coil. The external diameter of the coil is designed based on the application, and other parameters are optimized for the maximized unloaded Q factor. The coils are printed on interface-coated 65/35 polyester/cotton textile.

Figure 3.
Unloaded Q factor versus the turns of spiral coil for a coil design that has 138 mm external diameter, 53 mm inner diameter, and is printed with a conductive paste which has 24 mΩ/□ sheet resistance.
Figure 3.
Unloaded Q factor versus the turns of spiral coil for a coil design that has 138 mm external diameter, 53 mm inner diameter, and is printed with a conductive paste which has 24 mΩ/□ sheet resistance.

Figure 4.
Roughness of interface layer comparison. Demo tracks printed on a smooth surface of the interface with 6 sub-layers on the left side, and a rough surface of the interface with 2 sub-layers on the right side.
Figure 4.
Roughness of interface layer comparison. Demo tracks printed on a smooth surface of the interface with 6 sub-layers on the left side, and a rough surface of the interface with 2 sub-layers on the right side.
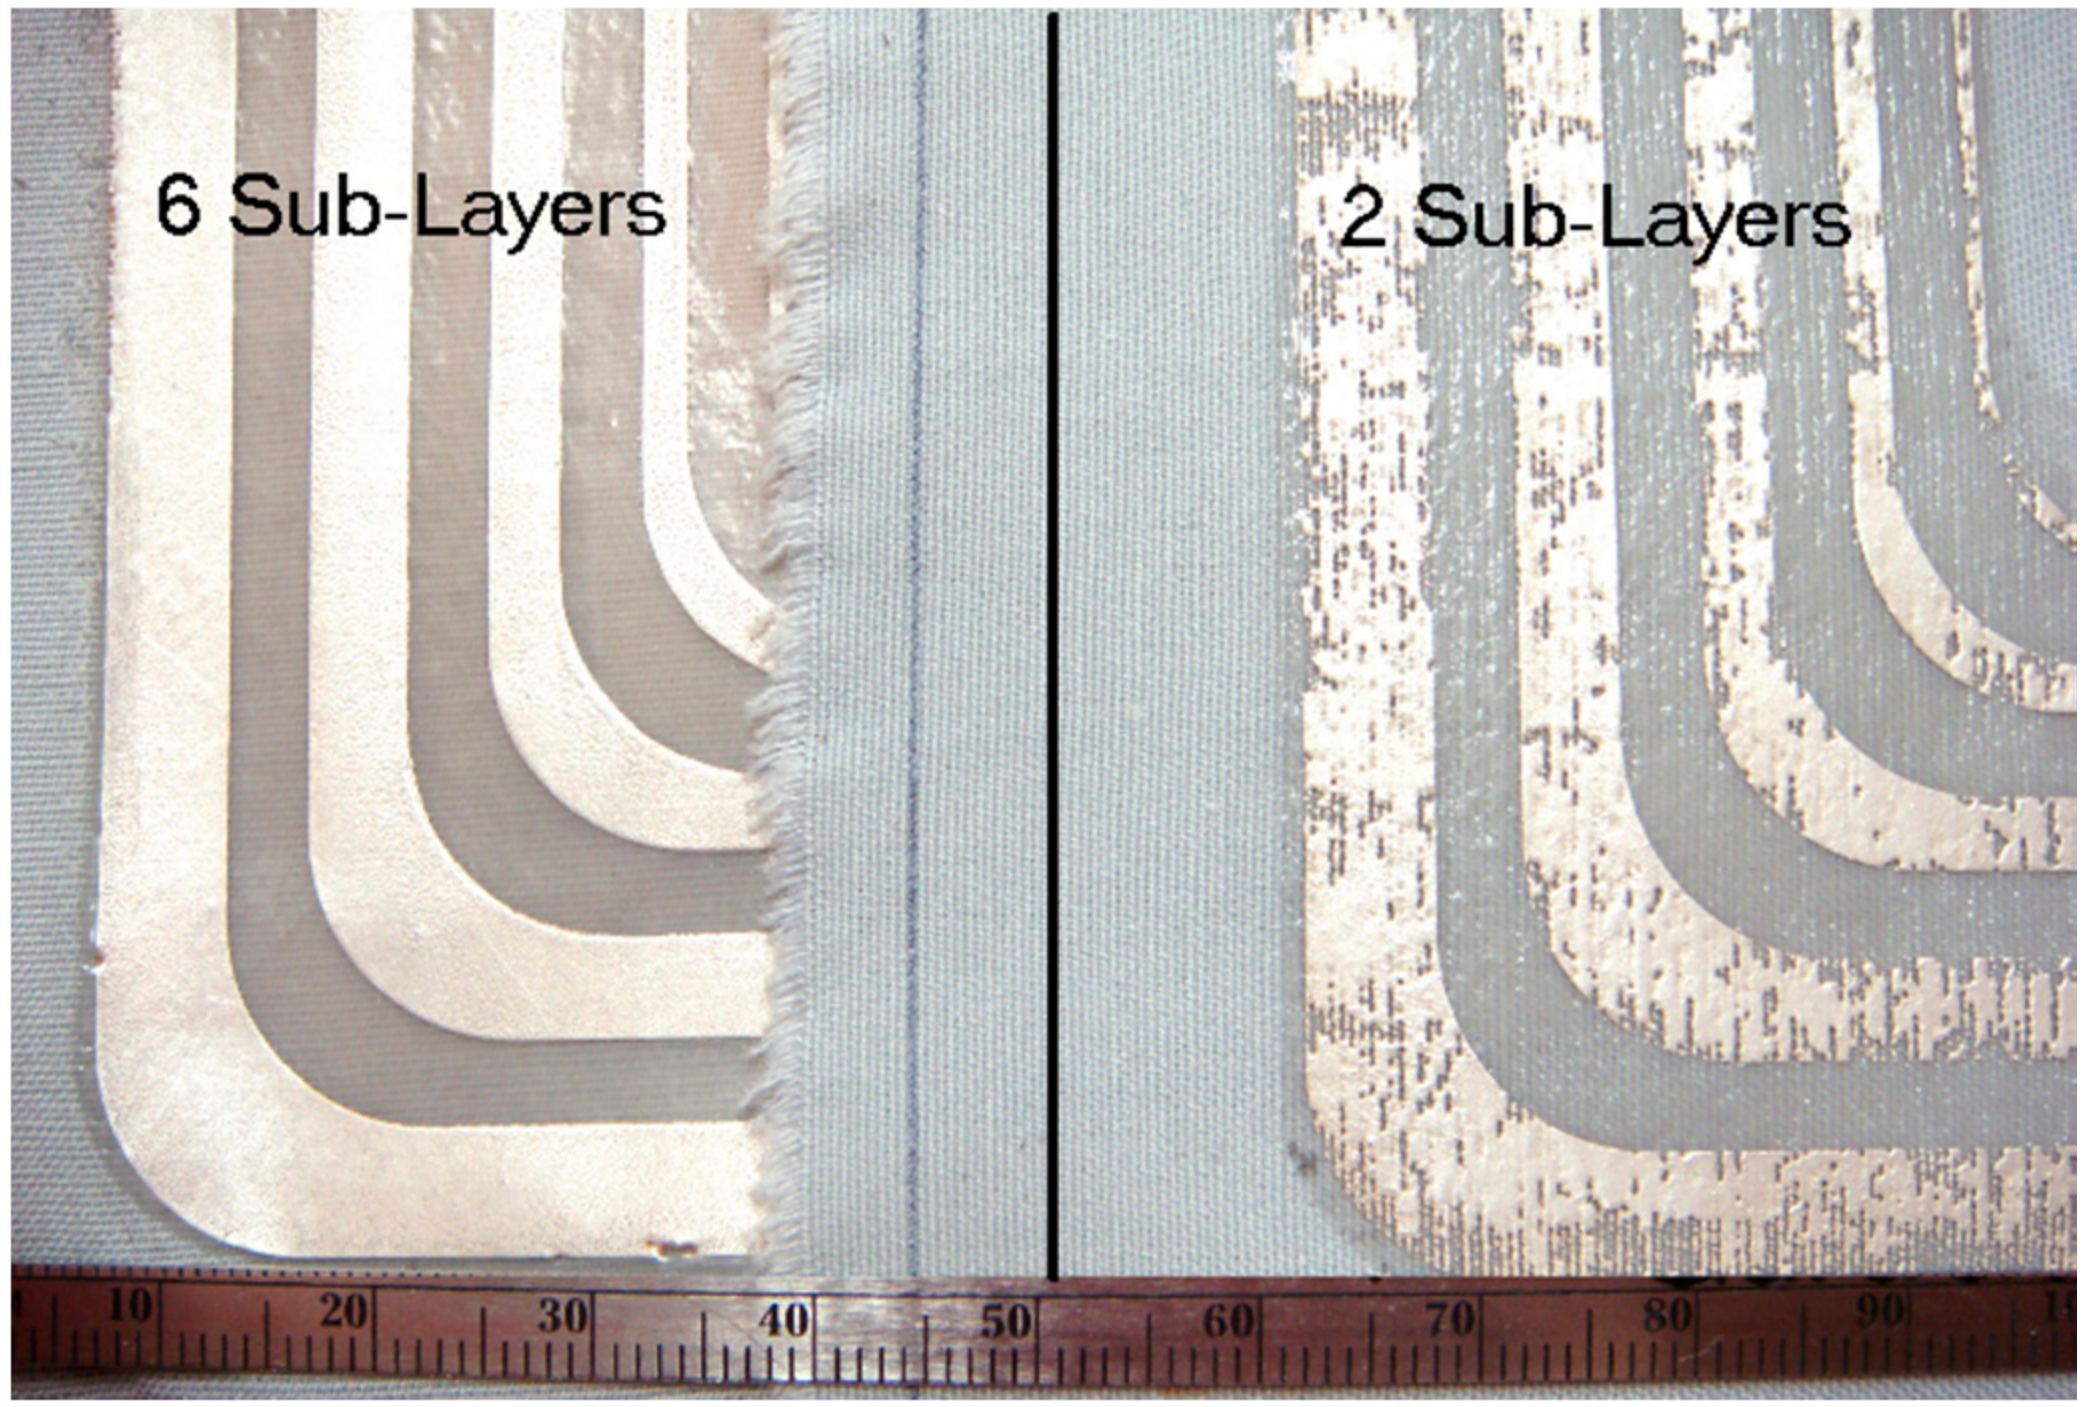
Figure 5.
SEM image of the interface and conductive layer on textile. The interface layer provides a smooth surface for conductive layer over the textile.
Figure 5.
SEM image of the interface and conductive layer on textile. The interface layer provides a smooth surface for conductive layer over the textile.

Figure 6.
Thickness and practical DC resistance of printed conductive layer as designed coil compared with theoretical DC resistance in different number of sub-layers and thickness.
Figure 6.
Thickness and practical DC resistance of printed conductive layer as designed coil compared with theoretical DC resistance in different number of sub-layers and thickness.

Figure 7.
Measuring DC output power of Qi-standard wireless power transfer circuit with adjustable radius support for RX coil (highlighted blue) and planar support for TX coil (highlighted green).
Figure 7.
Measuring DC output power of Qi-standard wireless power transfer circuit with adjustable radius support for RX coil (highlighted blue) and planar support for TX coil (highlighted green).

Figure 8.
Impedance phase angle of different type of coils on frequency range from 300 kHz to 50 MHz. The self-resonant frequency can be located from this measurement as 10.3 MHz and 17.6 MHz for wound copper coil and flexible coils, respectively.
Figure 8.
Impedance phase angle of different type of coils on frequency range from 300 kHz to 50 MHz. The self-resonant frequency can be located from this measurement as 10.3 MHz and 17.6 MHz for wound copper coil and flexible coils, respectively.

Figure 9.
Coupling factor k of different type of coupled coils against distance between them compared with the theoretical calculations.
Figure 9.
Coupling factor k of different type of coupled coils against distance between them compared with the theoretical calculations.

Figure 10.
Output powers of wireless power transfer system deployed with different type of coupled coils against output DC current at 5 mm and 10 mm separation between transmitter and receiver coils. An approximate 1.51 W output power can be achieved for all types of coils at 5 mm separation, and 9% less output power, 1.37 W, can be achieved at 10 mm separation.
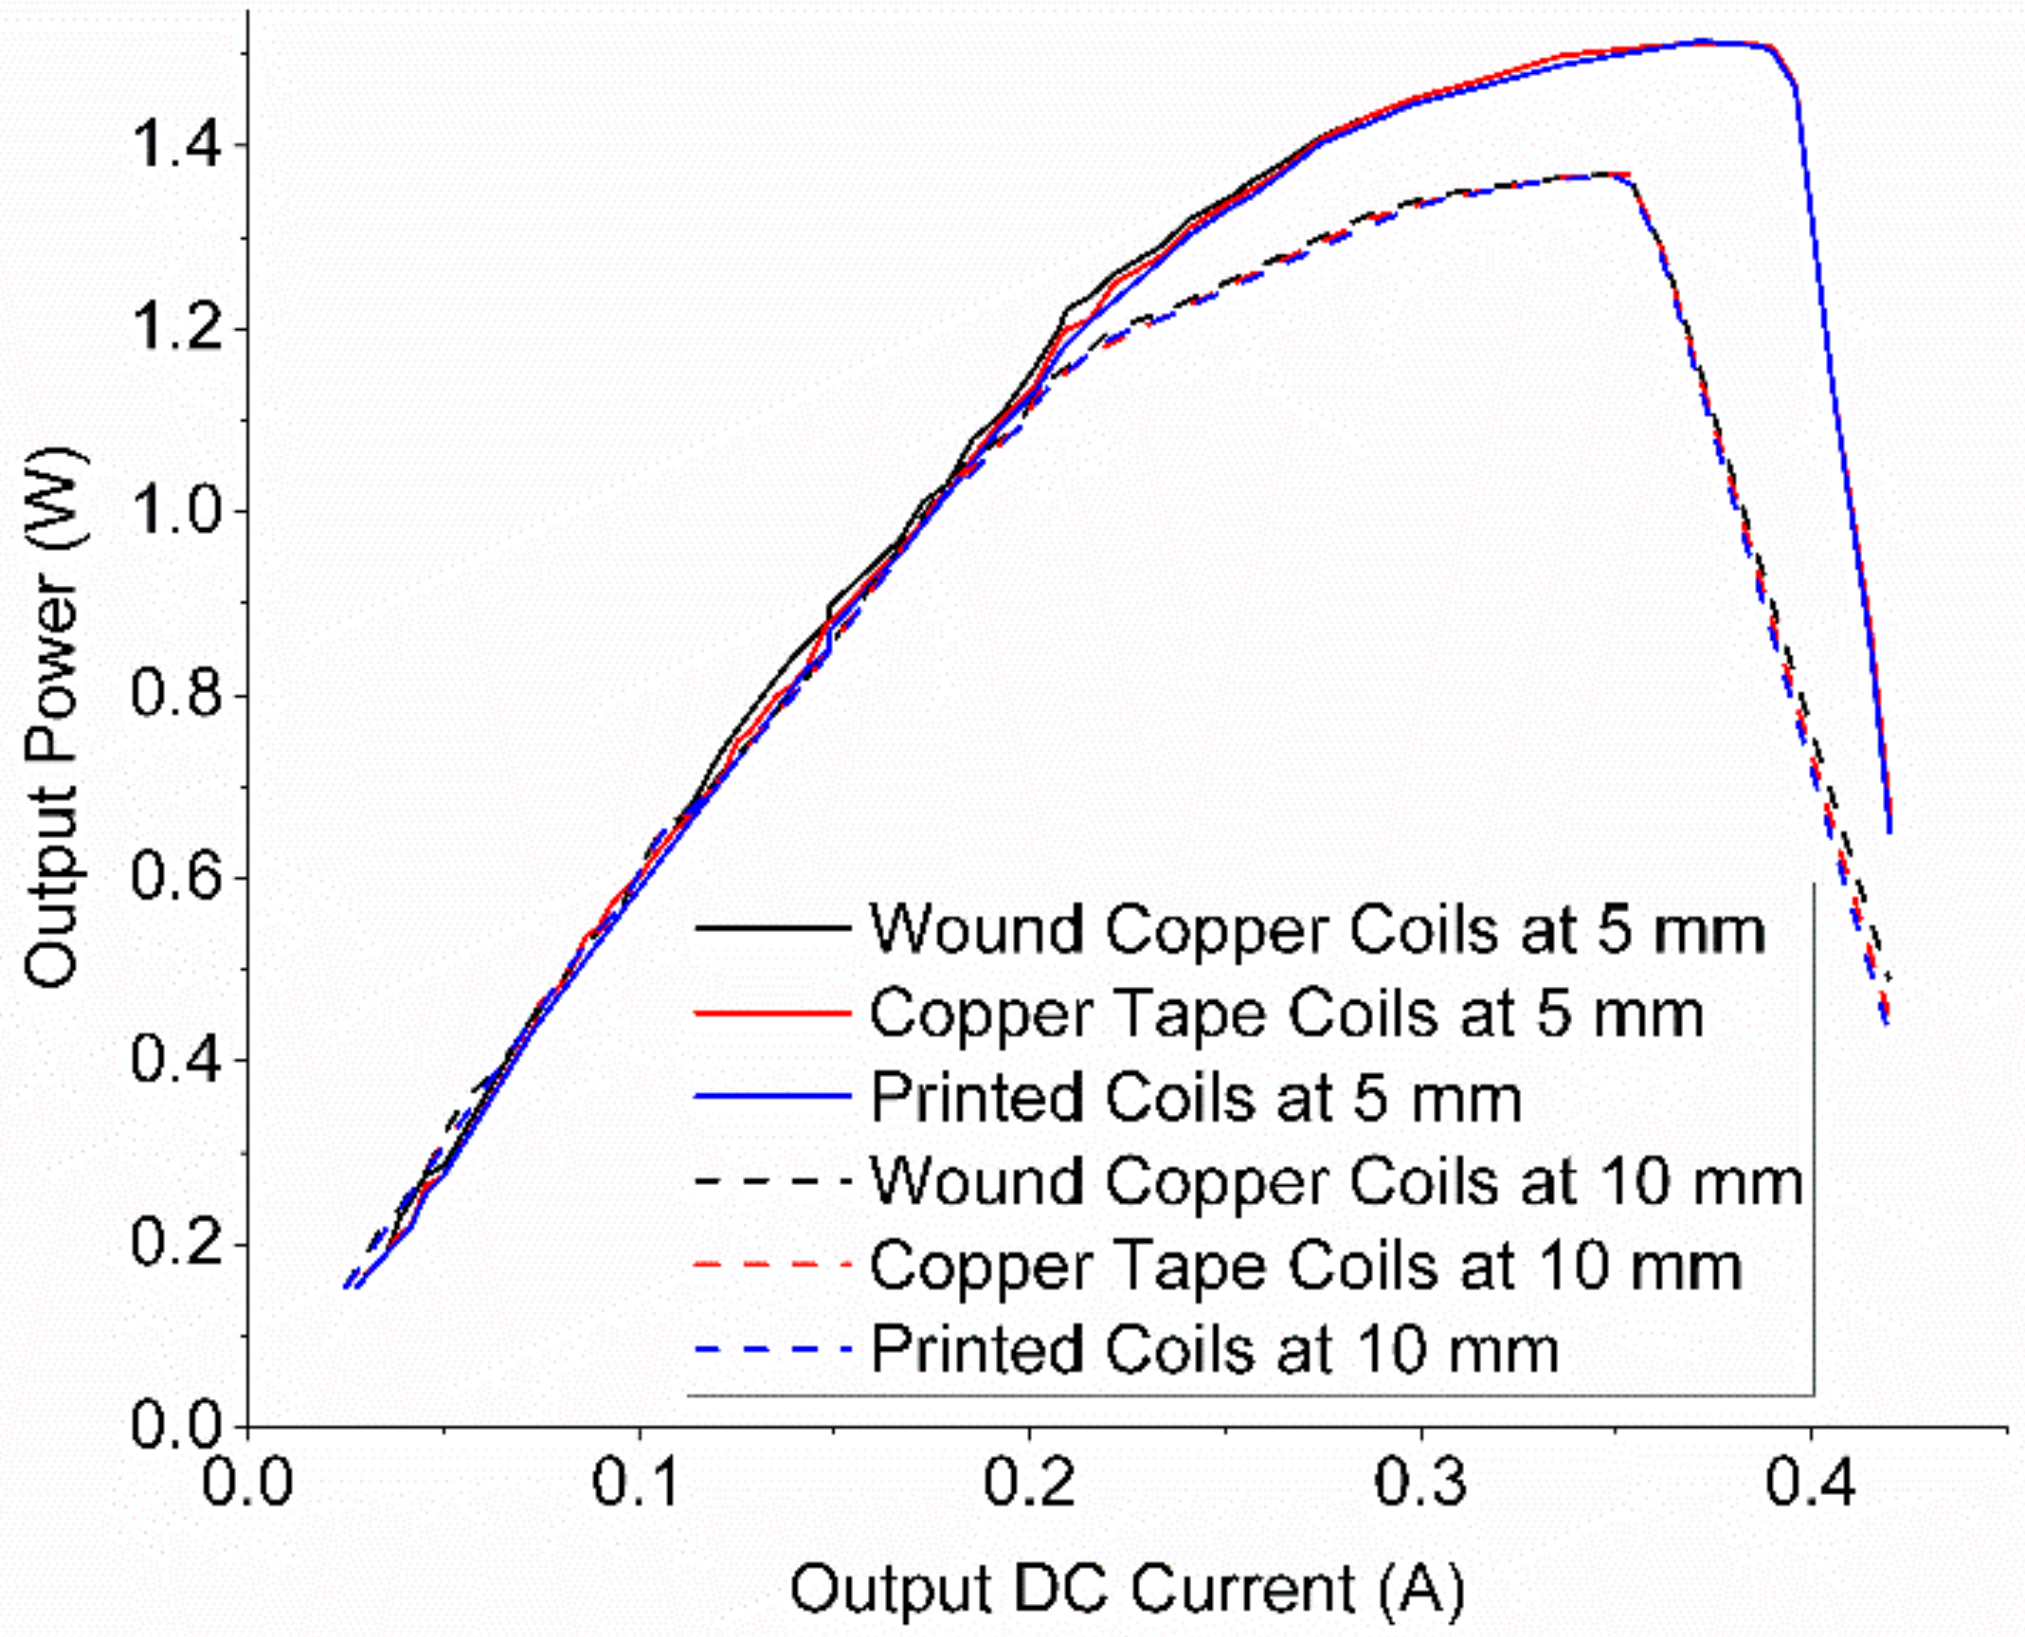
Figure 11.
DC to DC efficiency at optimal output current against separation distance between different types of paired coils. The same trends of the effect of separation on DC to DC efficiency are shown on all types of coils.
Figure 11.
DC to DC efficiency at optimal output current against separation distance between different types of paired coils. The same trends of the effect of separation on DC to DC efficiency are shown on all types of coils.

Figure 12.
Maximum output power and DC to DC efficiency of WPT employed flexible coils with varying curvature of receiver coil at 5 mm center separation distance from transmitter coil. The maximum output power drops 33% as a result of the deformation of the receiver coil.
Figure 12.
Maximum output power and DC to DC efficiency of WPT employed flexible coils with varying curvature of receiver coil at 5 mm center separation distance from transmitter coil. The maximum output power drops 33% as a result of the deformation of the receiver coil.

Figure 13.
DC to DC efficiency of the WPT system employing a deformed receiver coil under different curvature against the separation distance from the flat transmitter coil.
Figure 13.
DC to DC efficiency of the WPT system employing a deformed receiver coil under different curvature against the separation distance from the flat transmitter coil.


Table 1.
Thickness and resistance characteristics of printed coils.
| Symbol | Quantity | Value for 4 Sub-Layers | Value for 8 Sub-Layers |
|---|---|---|---|
| tc | Thickness of conductive layer | 116 μm ± 13% | 224 μm ± 11% |
| RDC | Measured DC resistance | 2.10 Ω ± 25% | 1.05 Ω ± 5% |
| RDCtheo | Theoretical DC resistance | 2 Ω | 1 Ω |
| Rsheet | Measured sheet resistance | 3.91 mΩ/□ | 1.97 mΩ/□ |
| RsheetCal | Calculated sheet resistance | 3.10 mΩ/□ | 1.61 mΩ/□ |
Table 2.
Electrical characteristics of coils.
| Symbol | Wound Copper Coil | Copper Tape Coil | Printed Coil |
|---|---|---|---|
| Lcoil | 5.24 μH ± 1% | 4.40 μH ± 2% | 3.88 μH ± 8% |
| Lcircular | 5 μH | 4.52 μH | 4.52 μH |
| Cp-coil | 8 pF ± 0.5% | 10 pF ± 1% | 24 pF ± 9% |
| Cp | 5 pF | 6 pF | 20 pF |
| Re-coil | 6.1 Ω ± 2% | 5.9 Ω ± 4% | 12.0 Ω ± 25% |
| Re | 6 Ω | 6 Ω | 11.3 Ω |
| Qu-coil | 10.7 ± 2% | 10.17 ± 5% | 3.05 ± 25% |
| Qu | 10.8 | 9.37 | 4.06 |
Table 3.
Tuning of printed coils.
| Separation | Symbol | Wound Copper Coil | Copper Tape Coil | Printed Coil |
|---|---|---|---|---|
| 5 mm | k | 0.88 | 0.87 | 0.85 |
| Cr_TX | 68 nF | 83 nF | 96 nF | |
| Cr_RX | 68 nF | 82 nF | 97 nF | |
| 10 mm | k | 0.80 | 0.80 | 0.77 |
| Cr_TX | 74 nF | 88 nF | 104 nF | |
| Cr_RX | 74 nF | 85 nF | 105 nF | |
| 15 mm | k | 0.68 | 0.66 | 0.66 |
| Cr_TX | 82 nF | 101 nF | 115 nF | |
| Cr_RX | 82 nF | 97 nF | 116 nF | |
| 20 mm | k | 0.59 | 0.58 | 0.57 |
| Cr_TX | 90 nF | 108 nF | 122 nF | |
| Cr_RX | 90 nF | 104 nF | 124 nF |
Table 4.
Maximum output current and DC to DC efficiency of wireless power transfer system deployed with different coils.
Table 4.
Maximum output current and DC to DC efficiency of wireless power transfer system deployed with different coils.
| Separation | Symbol | Wound Copper Coils | Copper Tape Coils | Printed Coils |
|---|---|---|---|---|
| 5 mm | ILoad | 0.39 A | 0.37 A | 0.37 A |
| ηDC-DC | 52% | 51% | 37% | |
| 10 mm | ILoad | 0.37 A | 0.36 A | 0.36 A |
| ηDC-DC | 46% | 44% | 30% | |
| 15 mm | ILoad | 0.28 A | 0.28 A | 0.27 A |
| ηDC-DC | 39% | 38% | 22% | |
| 20 mm | ILoad | 0.16 A | 0.16 A | 0.14 A |
| ηDC-DC | 24% | 24% | 10% |
© 2018 by the authors. Licensee MDPI, Basel, Switzerland. This article is an open access article distributed under the terms and conditions of the Creative Commons Attribution (CC BY) license (http://creativecommons.org/licenses/by/4.0/).
Share and Cite
MDPI and ACS Style
Li, Y.; Grabham, N.; Torah, R.; Tudor, J.; Beeby, S. Textile-Based Flexible Coils for Wireless Inductive Power Transmission. Appl. Sci. 2018, 8, 912. https://doi.org/10.3390/app8060912
AMA Style
Li Y, Grabham N, Torah R, Tudor J, Beeby S. Textile-Based Flexible Coils for Wireless Inductive Power Transmission. Applied Sciences. 2018; 8(6):912. https://doi.org/10.3390/app8060912
Chicago/Turabian StyleLi, Yi, Neil Grabham, Russel Torah, John Tudor, and Steve Beeby. 2018. "Textile-Based Flexible Coils for Wireless Inductive Power Transmission" Applied Sciences 8, no. 6: 912. https://doi.org/10.3390/app8060912
Note that from the first issue of 2016, this journal uses article numbers instead of page numbers. See further details here.