Comparison Among Different Rainfall Energy Harvesting Structures


Dipartimento di Energia, Ingegneria Dell’informazione e Modelli Matematici, DEIM, University of Palermo, 90128 Palermo, Italy
Appl. Sci. 2018, 8(6), 955; https://doi.org/10.3390/app8060955
Submission received: 23 May 2018
/
Revised: 4 June 2018
/
Accepted: 7 June 2018
/
Published: 9 June 2018
(This article belongs to the Special Issue Piezoelectric Energy Harvesting: Materials, Devices and Application)
Abstract
:Featured Application
With a view to reducing the employment of battery-powered systems to meet environmental requirements, sensors should be powered by energy harvesting systems. Sensors require little energy to perform measurements and also to transmit data; energy that can be recovered from rainwater by the harvesting structures.
Abstract
In this paper, an experimental comparison between different rainfall harvesting devices through the study of the electrical rectifying circuit is proposed. In more detail, three harvesting structures are considered: the cantilever, the bridge and the floating circle. Different waveforms were acquired and discussed. The processed data were compared in order to suggest the best choice for the rectifying circuit, from the simplest one to that most frequently endorsed in the technical literature.
1. Introduction
Research in the field of electrical engineering has been long engaged in the identification of new forms of energy production from common and everyday life sources. One of the latest techniques in this exploration phase is the conversion of mechanical energy, otherwise lost, into electricity by the employment of energy harvesters. This conversion creates micro-productions of electrical energy caused by vibrations of piezoelectric transducers, which is then used to feed sensors, or electronic devices with small energy consumption (e.g., wireless sensors used for monitoring applications, which still need chemical batteries with high costs of maintenance and disposal).
Piezoelectric materials have a lack of symmetry in the crystal lattice, leading to dipole moment generation, which is also a function of the stress acting on the structure [1]. The lattice structure allows the fabrication of devices in both the macro and in the micro scales, overcoming the common limitations due to the number of windings to be used in the electromagnetic transducers employed in the same field [2,3].
It can be stated that the kinetic energy of the ambient vibrations (which represents an energy normally wasted in the environment without a useful purpose) can be coupled to electromechanical transducers in order to feed electronic monitor apparatus. The vibration energy can be regarded as marginal energy due to its small entity, but it can be suitably adopted for utilities of reduced energy capacity, such as the transmission of information, as in the case of automotive tires [4]. Other studies have traced ways to recover energy from renewable sources [5,6].
Jager et al. faced the rainfall energy harvest as well [7,8], with the idea of converting the kinetic energy possessed by the drops of rainwater into electrical energy by means of piezoelectric plates. A pioneering comparison of different piezoelectric materials finalized to investigate the possibility of energy generation by water droplet energy sources for low-power electronic devices was studied by Vatansever et al. in [5].
Jager [7,8] has demonstrated that a single raindrop with diameters ranging between 1 and 5 mm can generate up to 12 mJ/s, whereas Italian studies have shown that the piezoelectric transducer-based conversion system produces 0.43 µJ of energy for each raindrop impact [9,10,11,12,13]. A recent work of Helseth [14] introduces different possibilities to harvest raindrop energy with piezoelectric and triboelectric transducers and evaluates the energy potential due to rain parameters. Lin et al. [15] with a pioneering work suggested a recover energy of 30 nJ of electrical energy due to a droplet of 30 mL. These results leave some uncertainty on the actual capability to generate an adequate amount of electrical energy from rain.
A complete overview of the possibility of harvesting energy in different scenarios is difficult to provide, since novel approaches and innovative ideas are continuously being developed.
During recent years, particular attention has been given to the possibility of harvest energy from the raindrops by researchers from the region of Malaysia [16,17,18,19,20] and Bangladesh [21].
As reported in [21], in Bangladesh in June, July, August and September, there is maximum downpour; a comparison with the case of France is reported. In France, the available rain power is almost 1 Wh per square meter per year. In Bangladesh in the monsoon period, the amount of raindrops in mm varies between 1852 to 3082. If 15 raindrops 5 mm in size fall per second on a square meter of flat surface in Bangladesh (i.e., 900 raindrops per minute), the impact energy is equal to 0.18 watts. By considering four months, the potential energy can reach some kWhs each year.
In [16] it is reported that for tropical countries such as Malaysia, Indonesia, Philippines, Myanmar, India, Panama, Brazil, and Nicaragua, the yearly rain rate is more than 2000 mm per year. For the Malaysian case, an average daily precipitation of 7.88 mm/m2, with a kinetic energy of about 3.27 mJ for a single droplet with diameter 5 mm, should have a potential energy density about one twelfth of the average solar power radiation of other countries.
In such a way, it is fundamental to establish the efficiency of the harvested energy in terms of the obtained kinetic energy. Jager [8] recommended 0.1–0.146%, Ilyas [22,23] suggested 0.11%, Ahmad [24] proposed 0.138% and finally Wong [25] obtained an efficiency of about 0.3%.
In this context, the reviews in [16,17] have faced different issues to trace out the efficiency of the system, from the materials to be used (PVDF, PZT [5,9]), including an improved AC/DC rectifying circuits.
In [20], some interesting performances on the rectifying structures have been traced. Different rectifying circuits have been compared in simulation environments in which the piezoelectric harvester has been modeled by a sinusoidal source.
In this paper, we propose a deeper discussion on the performance of rectifying circuits. We focus on the difficulty in extracting energy from the transducer, and on the consequences this has on the rectifying circuit.
The paper is divided in the following sections: Section 2 describes the most frequently used harvester structures; in Section 3, there is an evaluation of the voltage waveform obtained at terminals of piezoelectric harvesters due to a falling raindrop; Section 4 describes the employable rectifying circuits; Section 5 evaluates the simulated performances of the rectifying circuits;, Section 6 experimentally confirms the performance described in Section 5; and finally in Section 7 conclusions arrive.
2. Harvesters
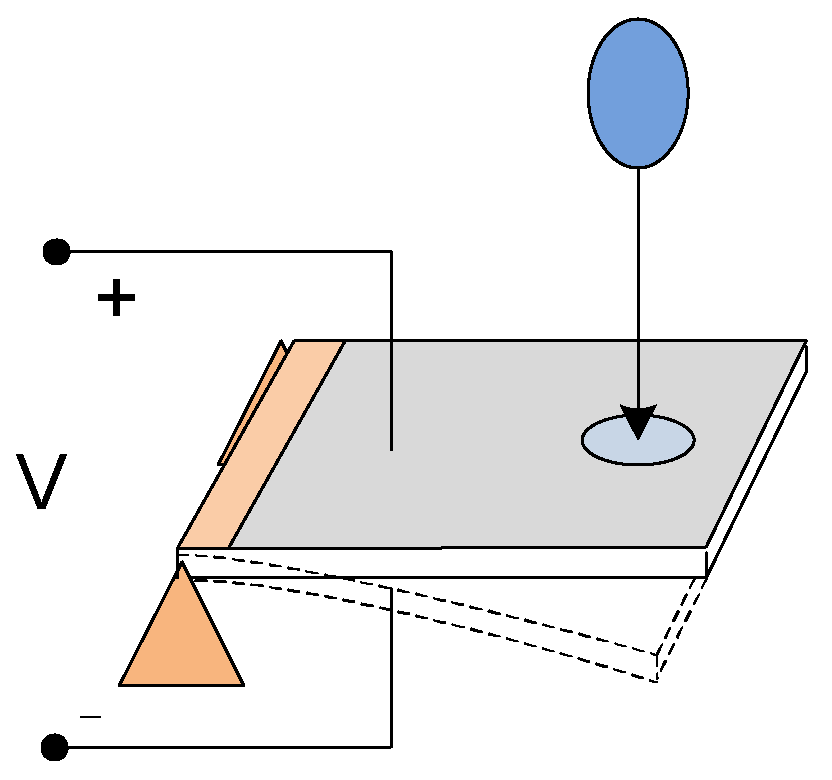
Figure 1, Figure 2 and Figure 3 show some harvesting structures. Structures are always obtained by the employment of a thin film of piezoelectric substrate encapsulated in an insulator shield. The first one is the cantilever structure, used in [9,10,11,12,13,14,15], in which the piezoelectric structure has one end bound while the other is free to move. Such structures allow a low damped movement as a result of the collision with the raindrops.
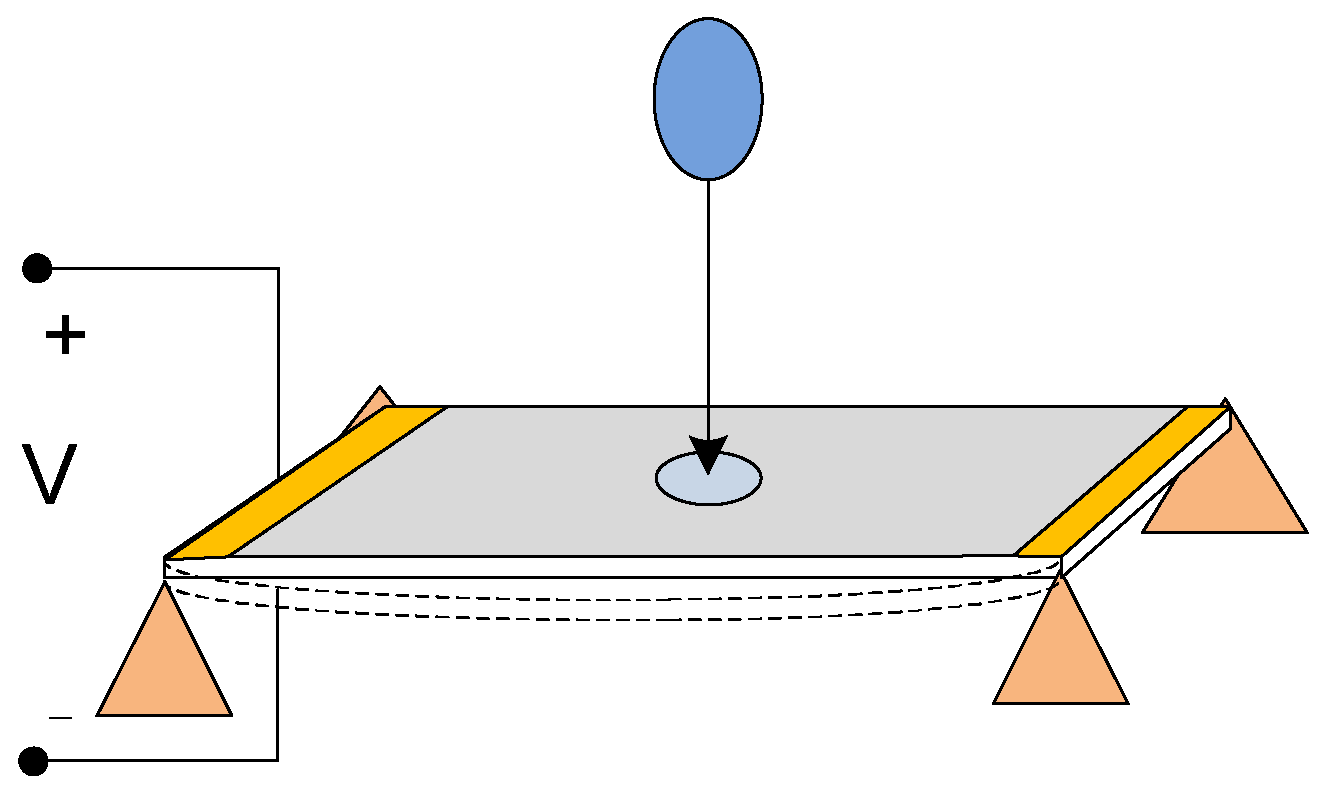
The second one is the bridge cantilever used in [7,8]; the piezoelectric structure is bound at both edges. Such structures limit the oscillations with a damped effect since there is no end free to move, and the effect is similar to the case of a guitar string (two ends bound) compared to the bar of a carillon.
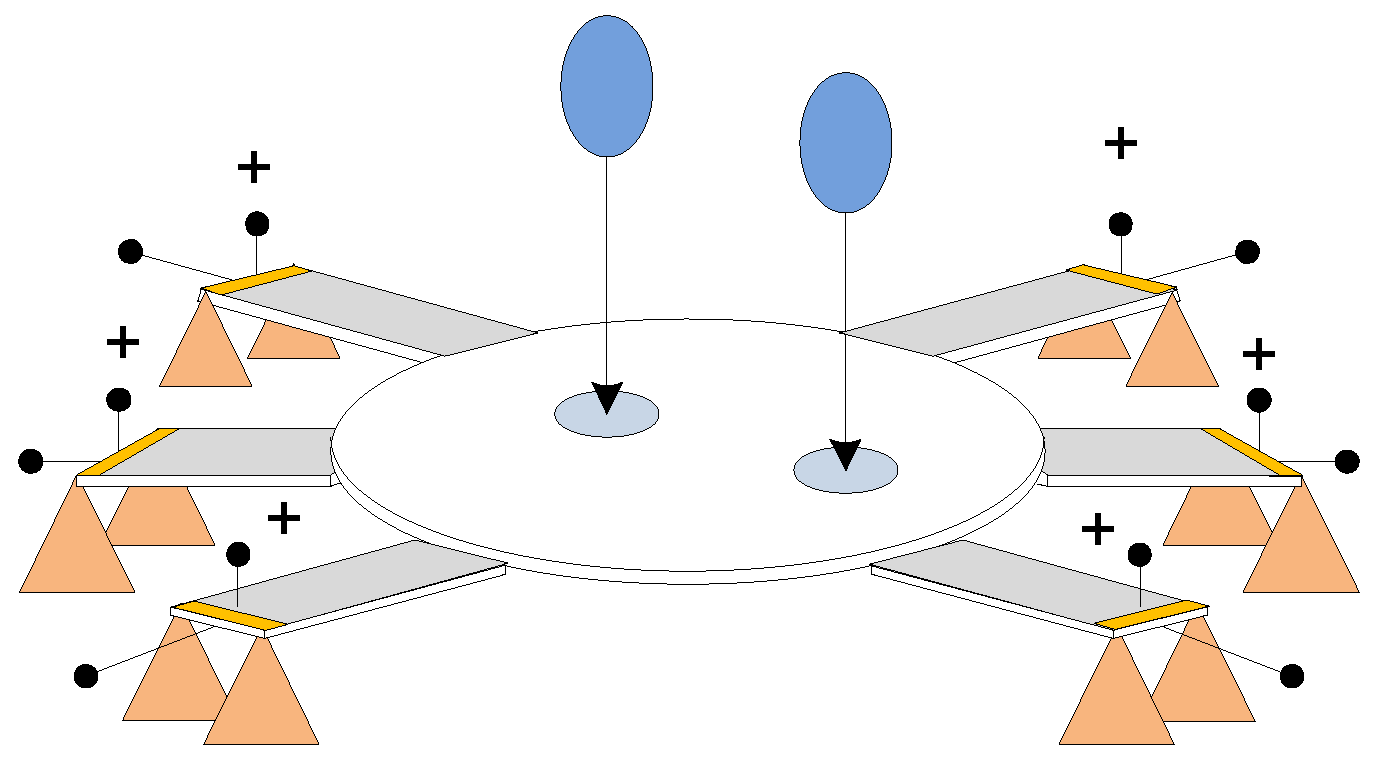
Finally, the following has been presented in the literature, but never experimentally employed [16]. All the edges of the piezoelectric harvester are bound, but the collecting surface is free to oscillate due to the impact of the raindrops.
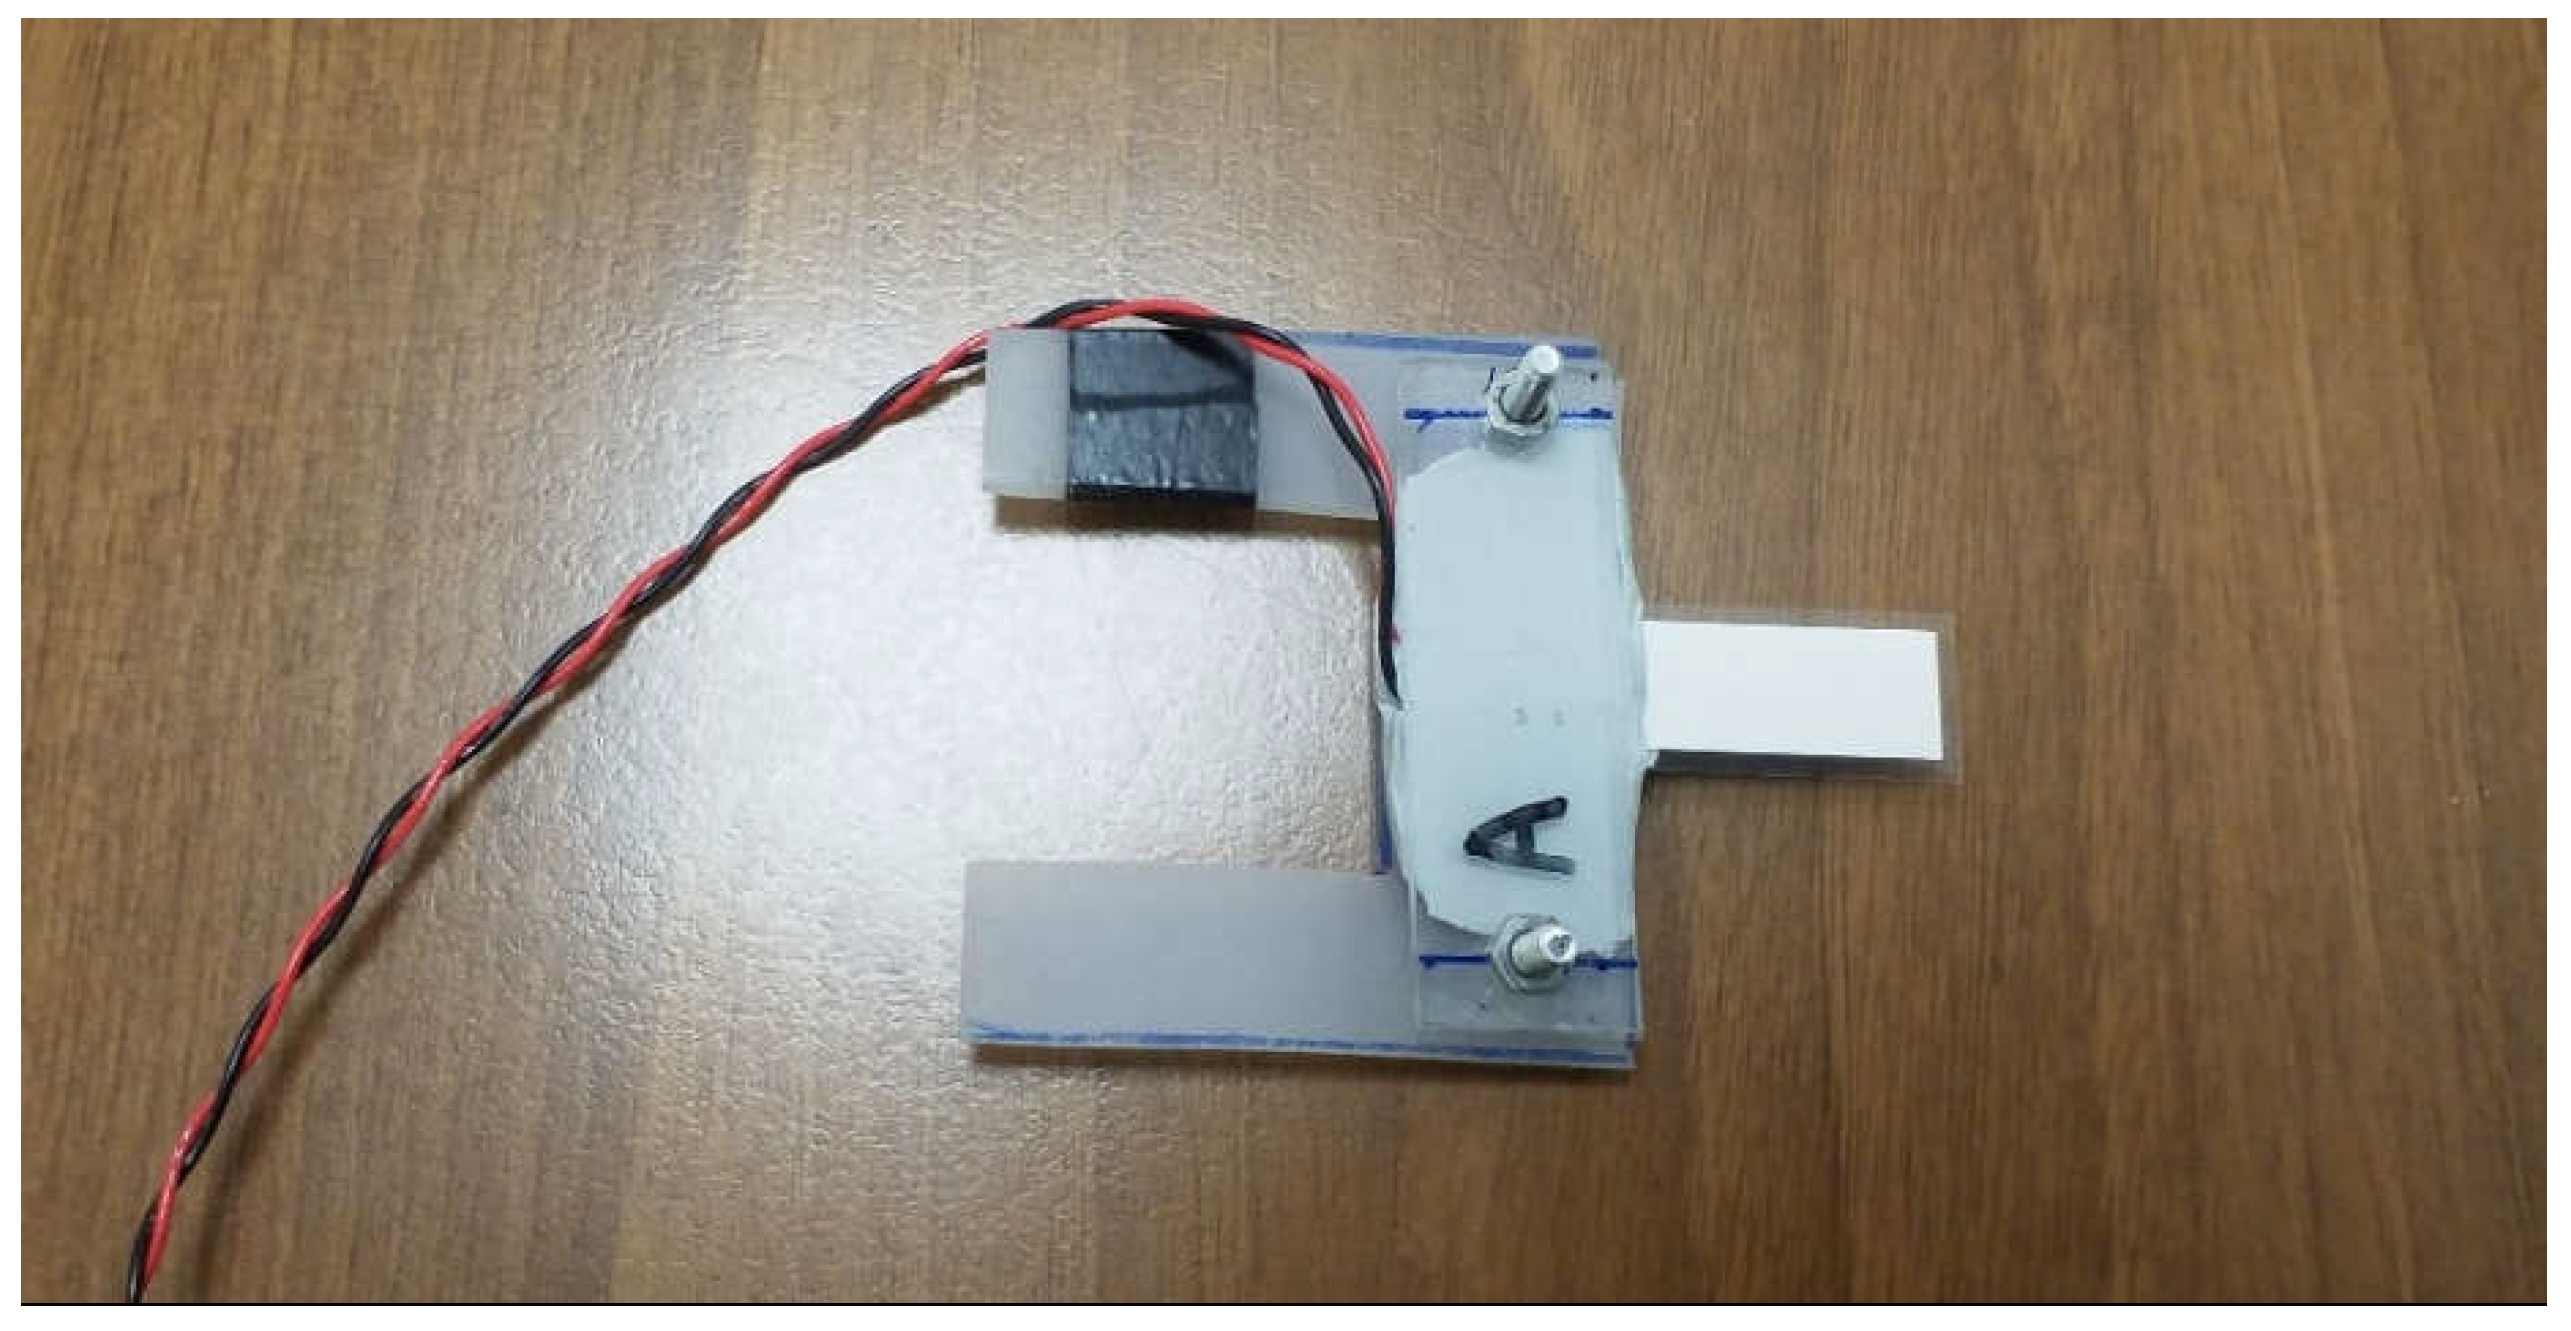
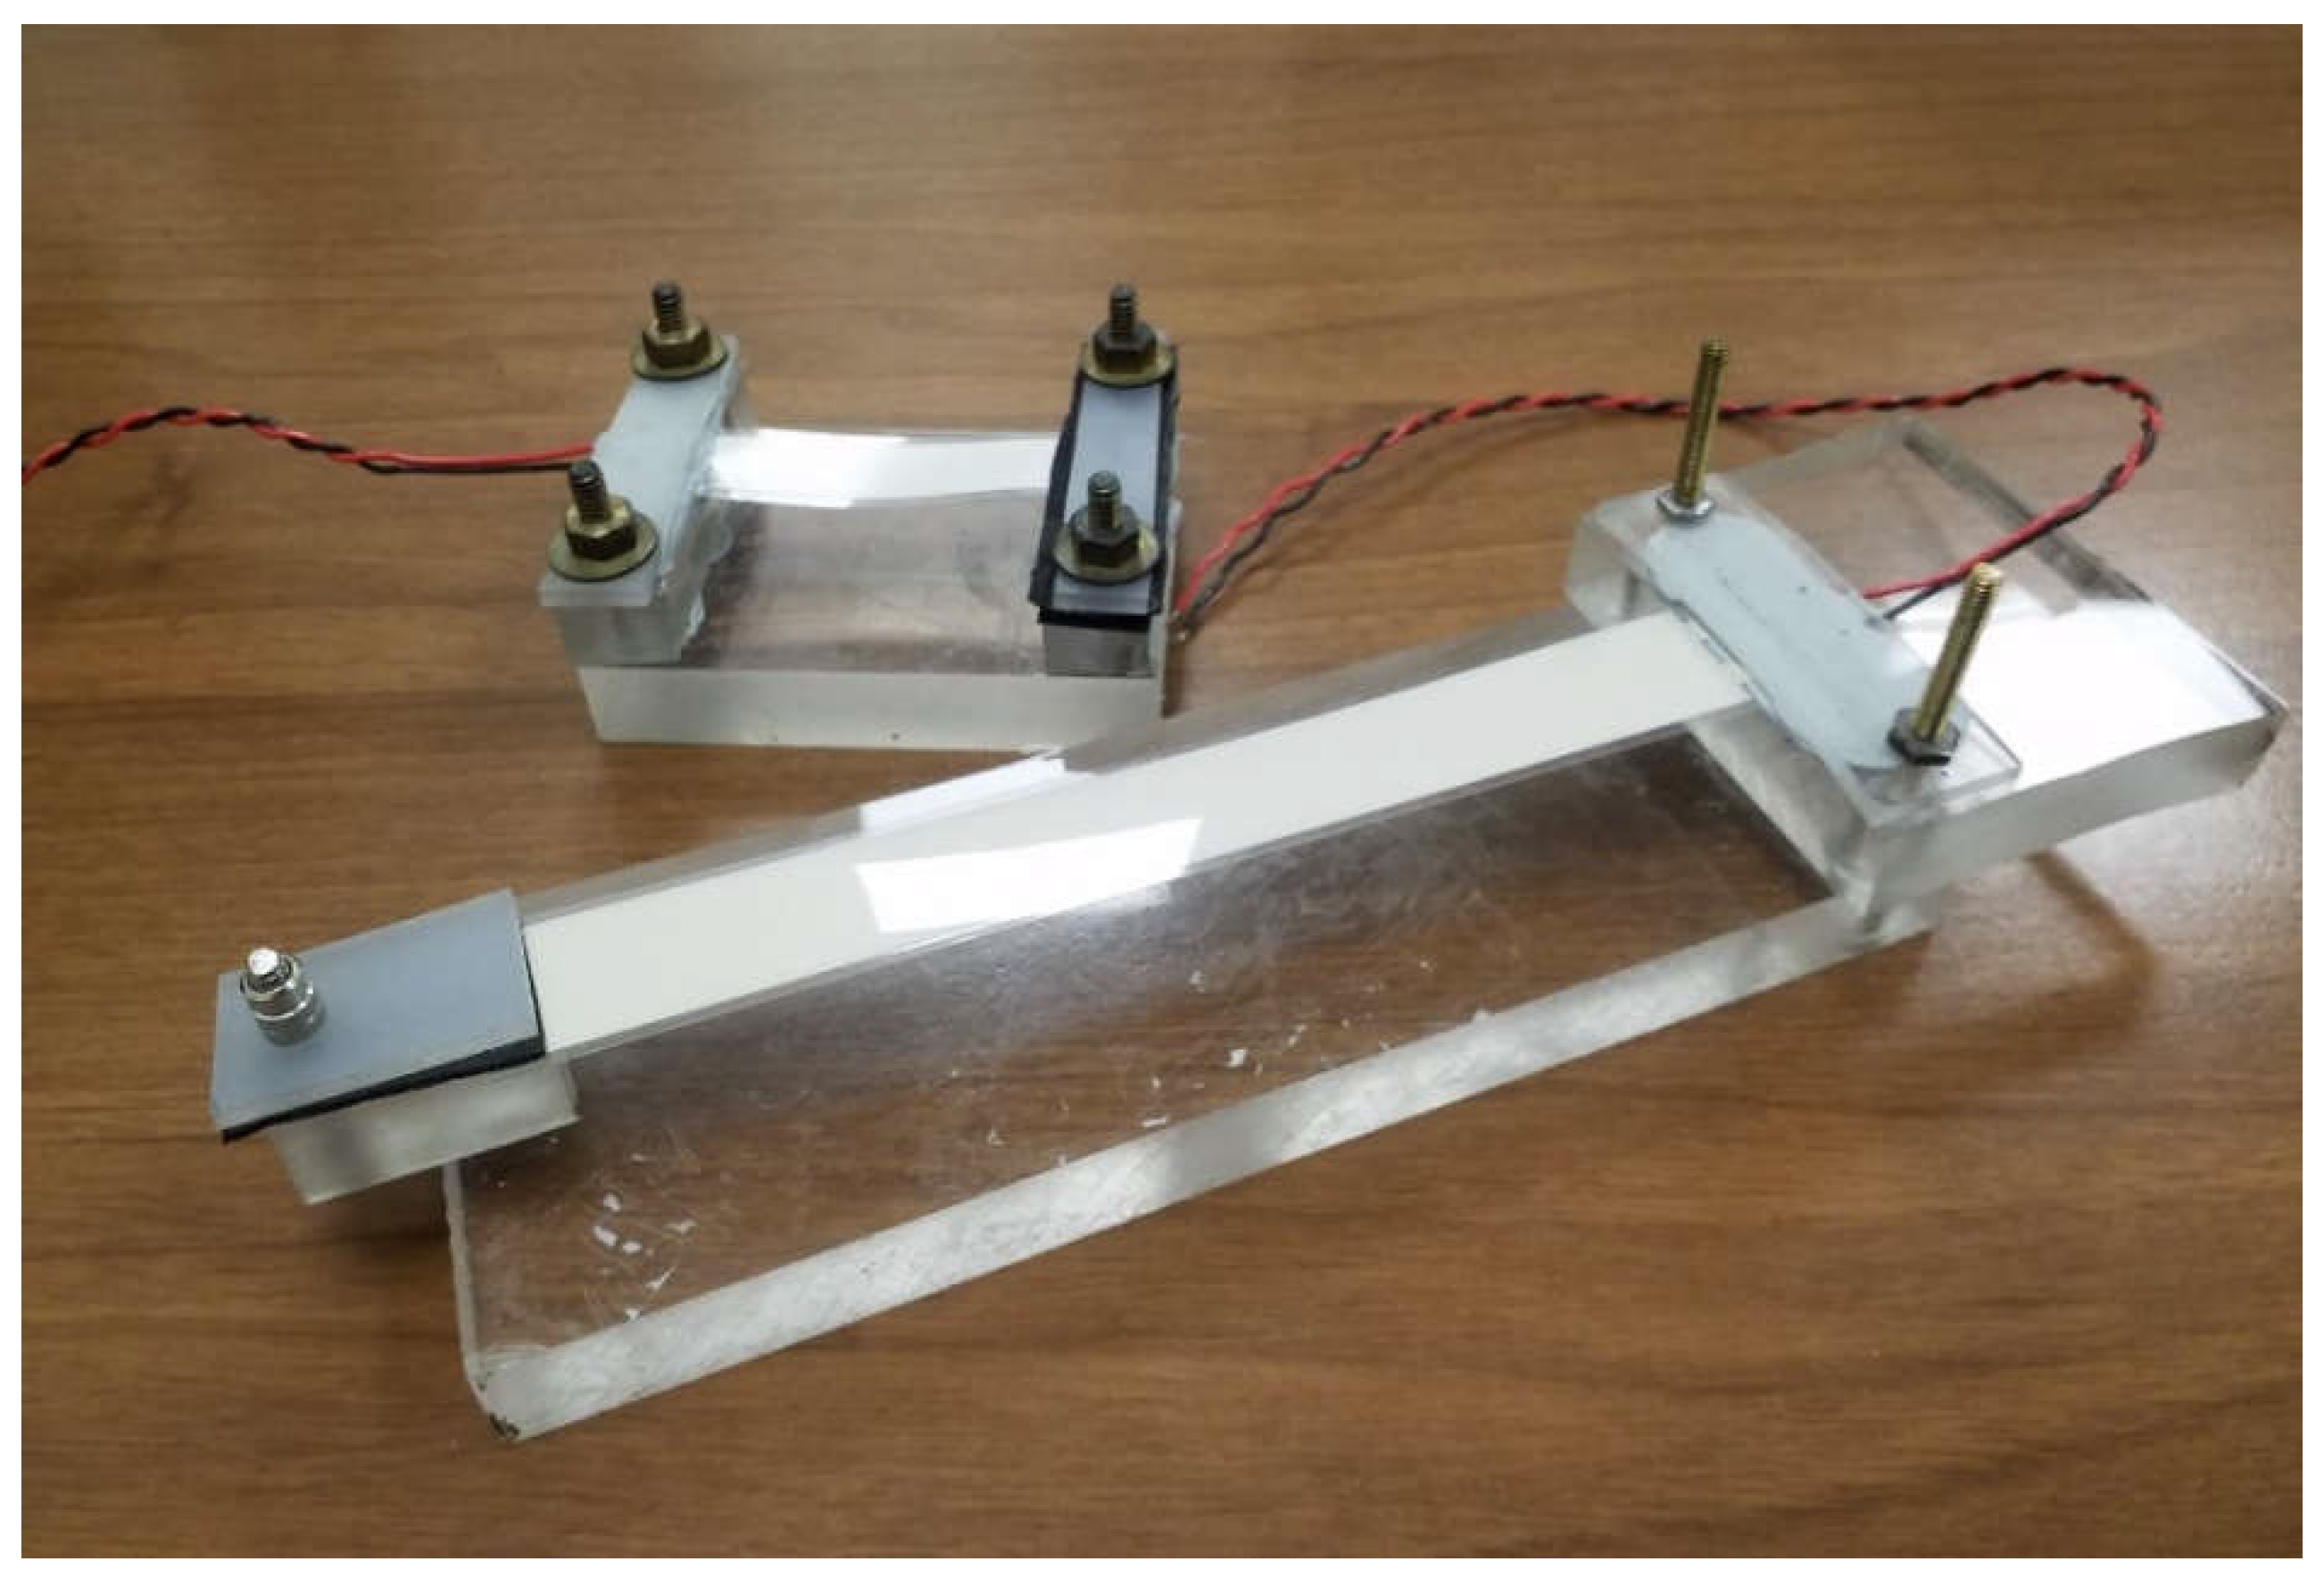
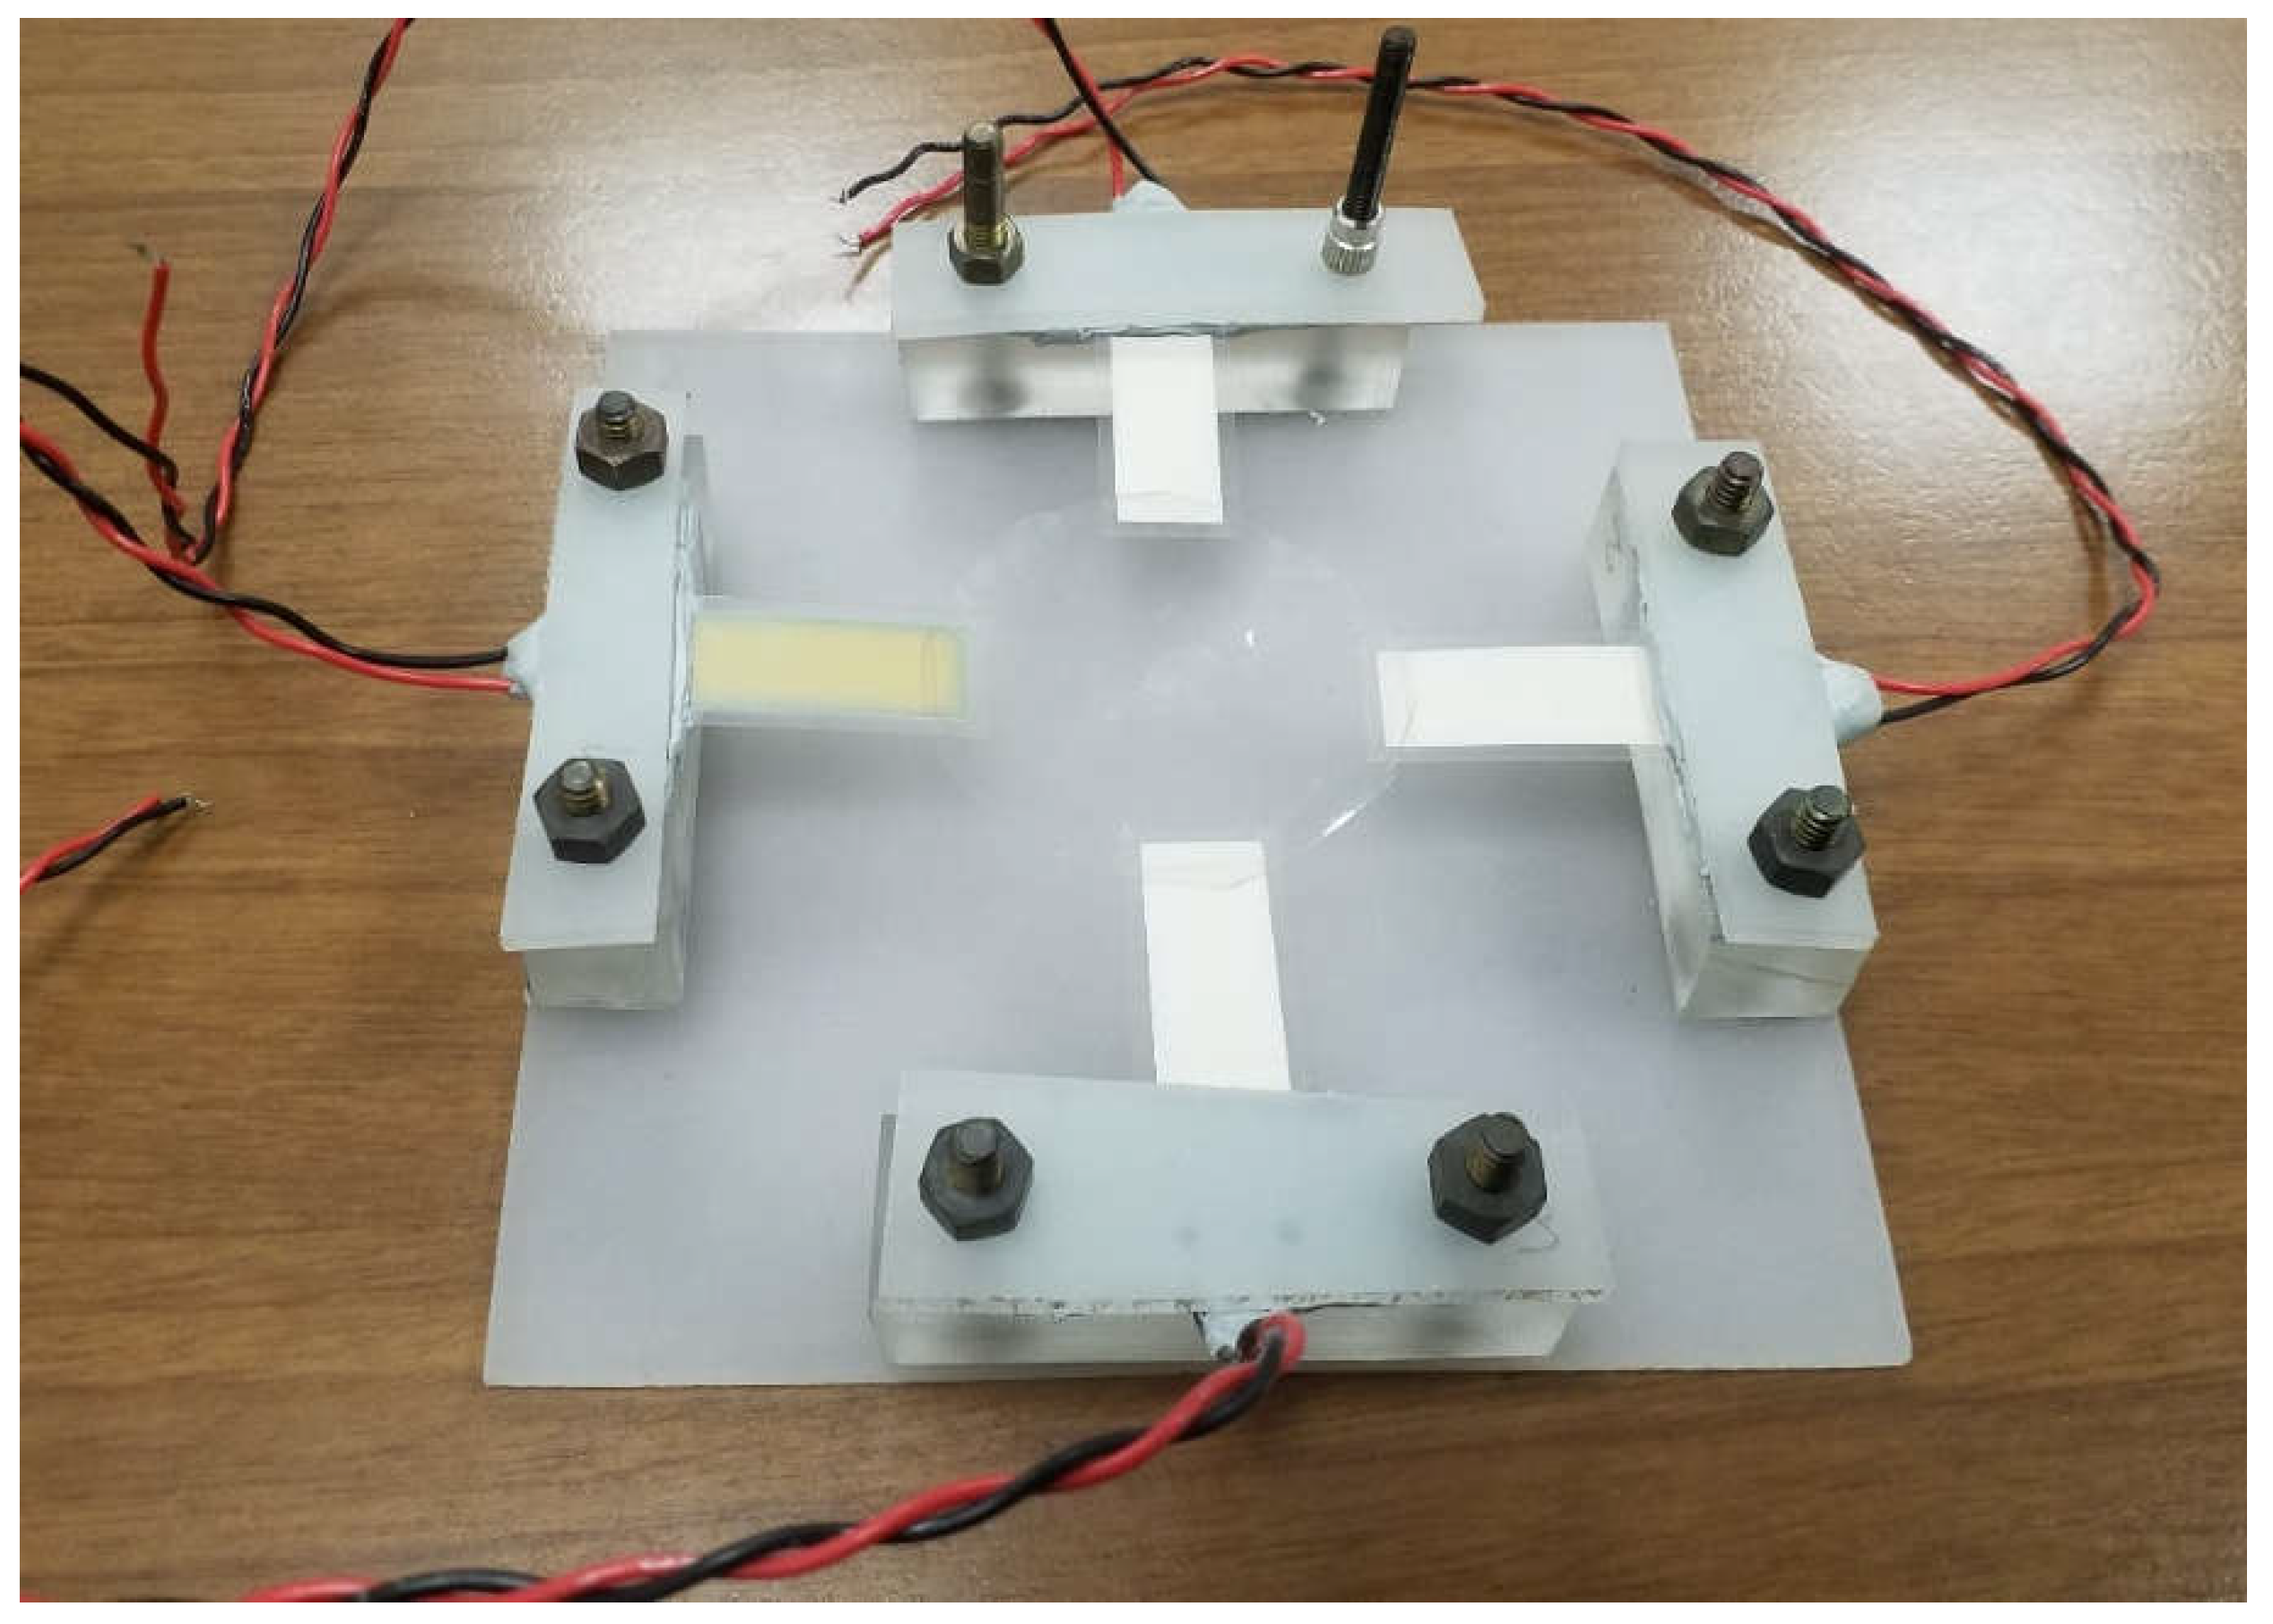
The transducers used in the experiments are taken from the catalogue of MEAS LDT models with rectangular layers of active piezoelectric (15.0 × 2.0 cm, 6 × 1.3 cm, 2.9 × 1.3 cm) [26], both mounted on a suitable support, as shown in Figure 4, Figure 5 and Figure 6.
The physical structure of the harvester affects the waveform of the output signal, as will be seen in the following paragraph.
3. Experimental Study
Piezoelectric transducers were exposed to artificial rain from different heights: 0.5, 1.0, 1.5 and 2.0 m.
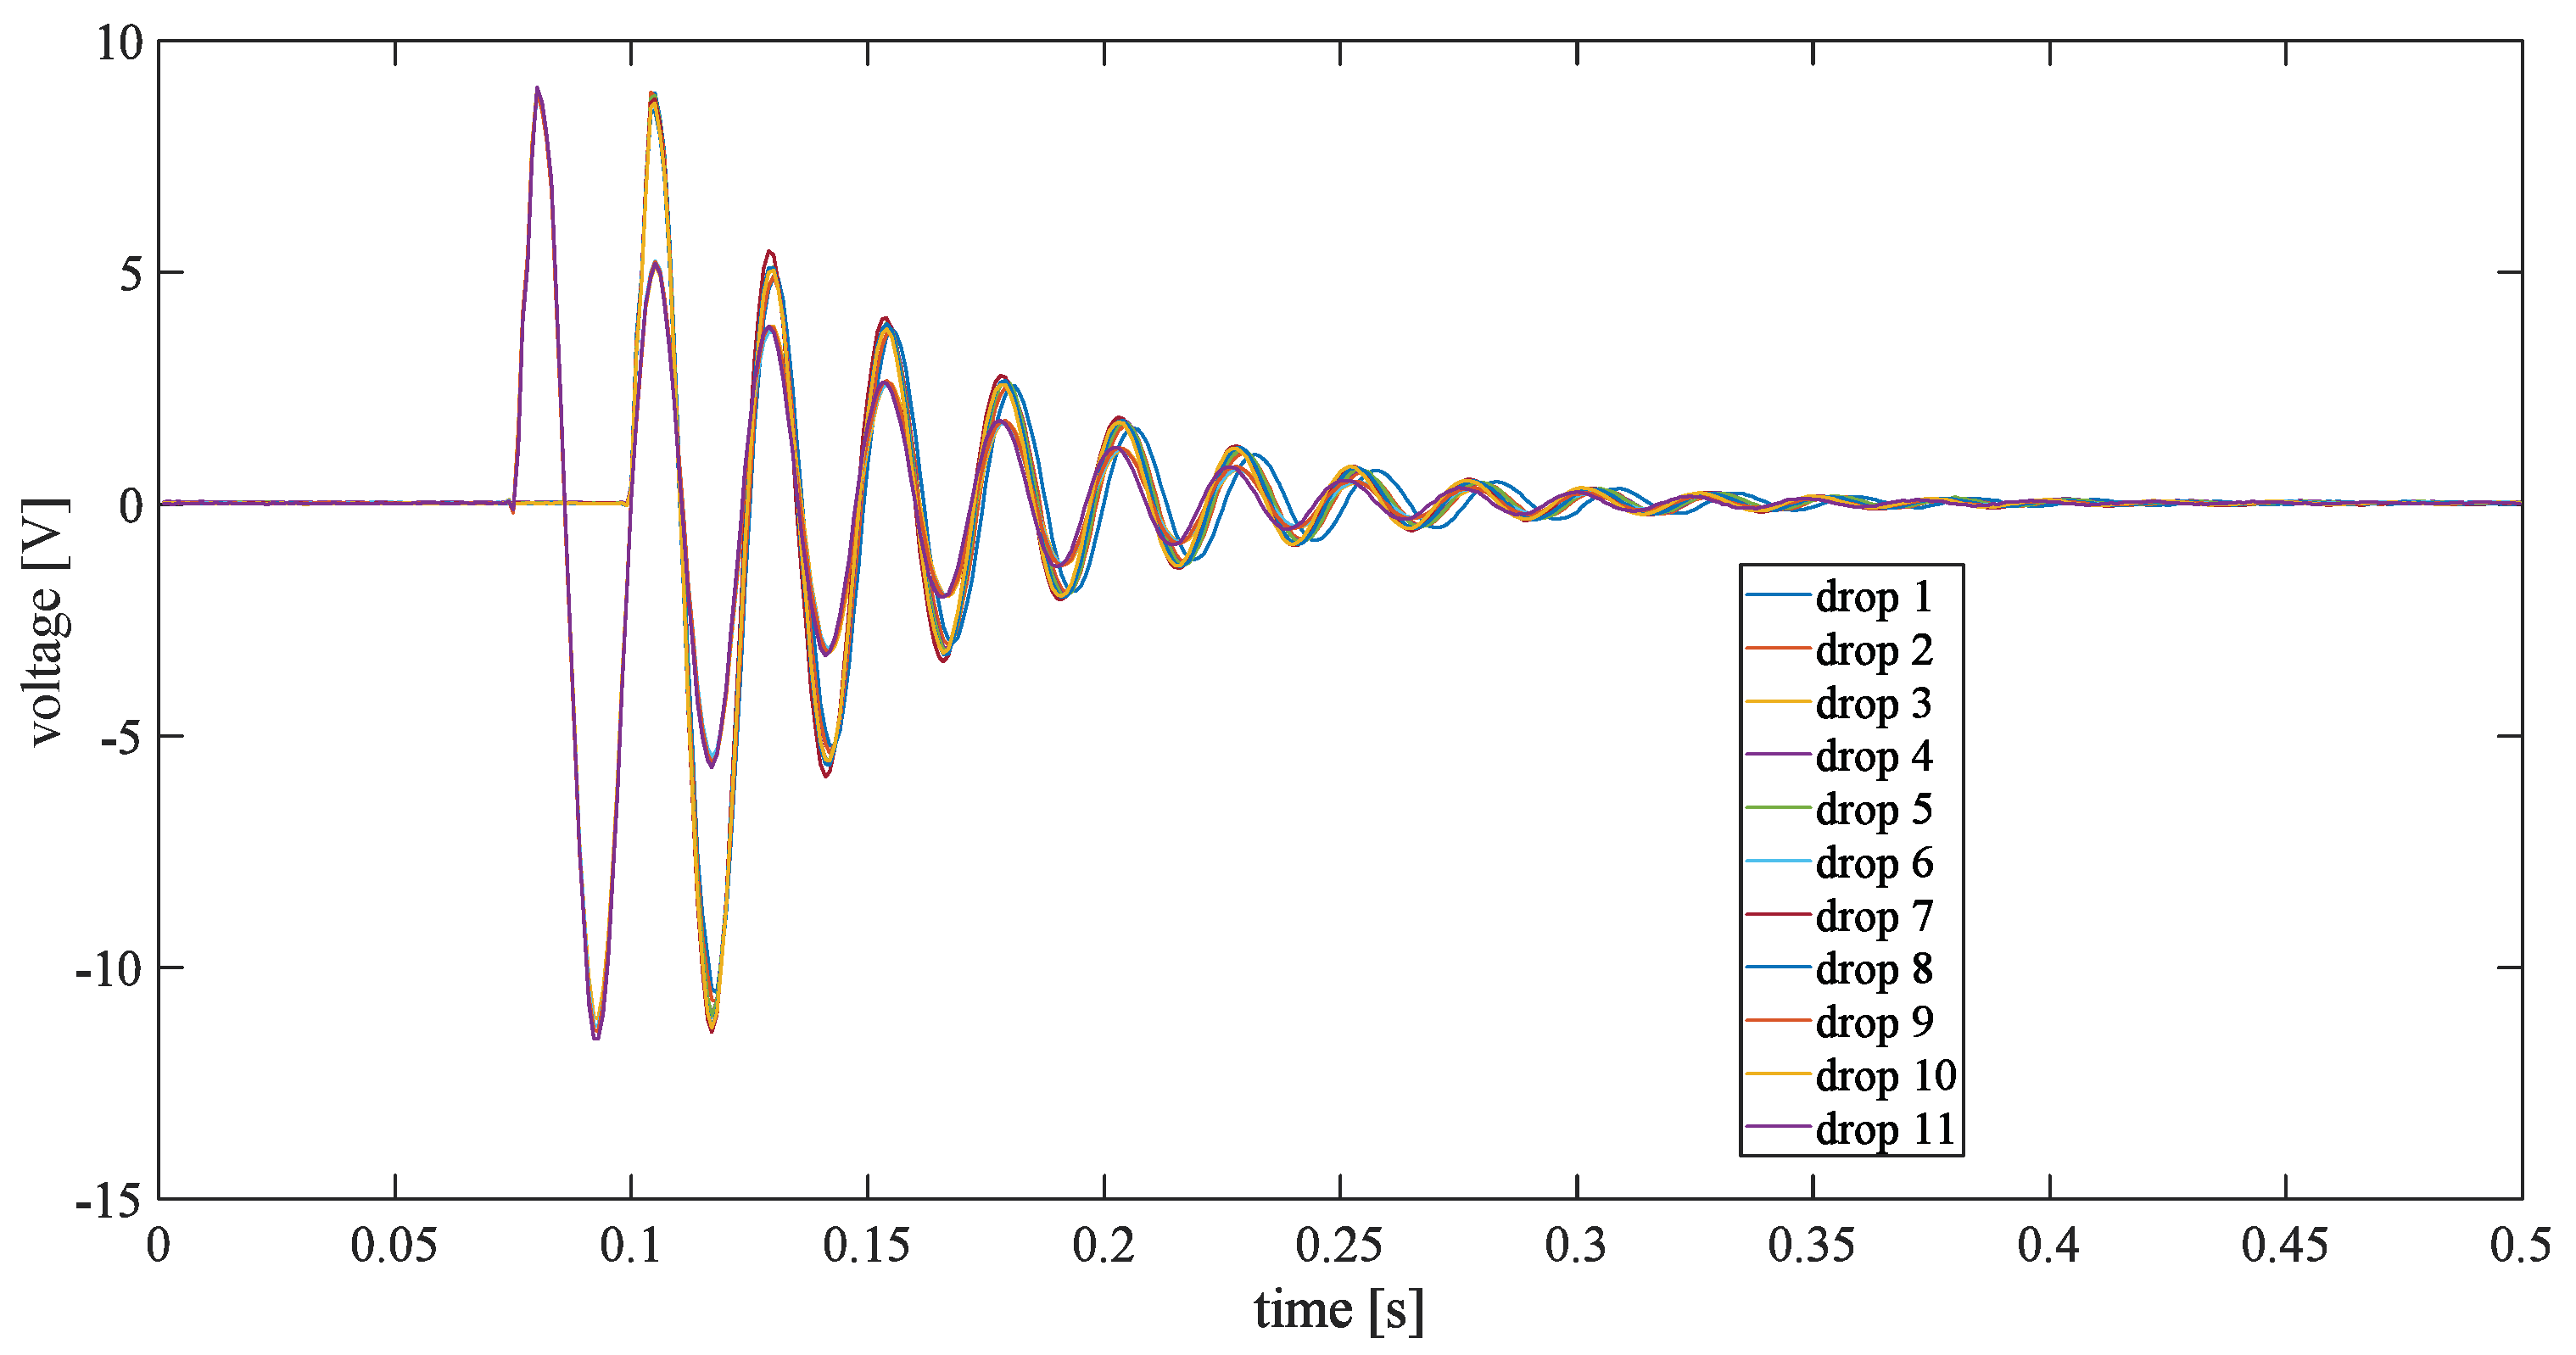
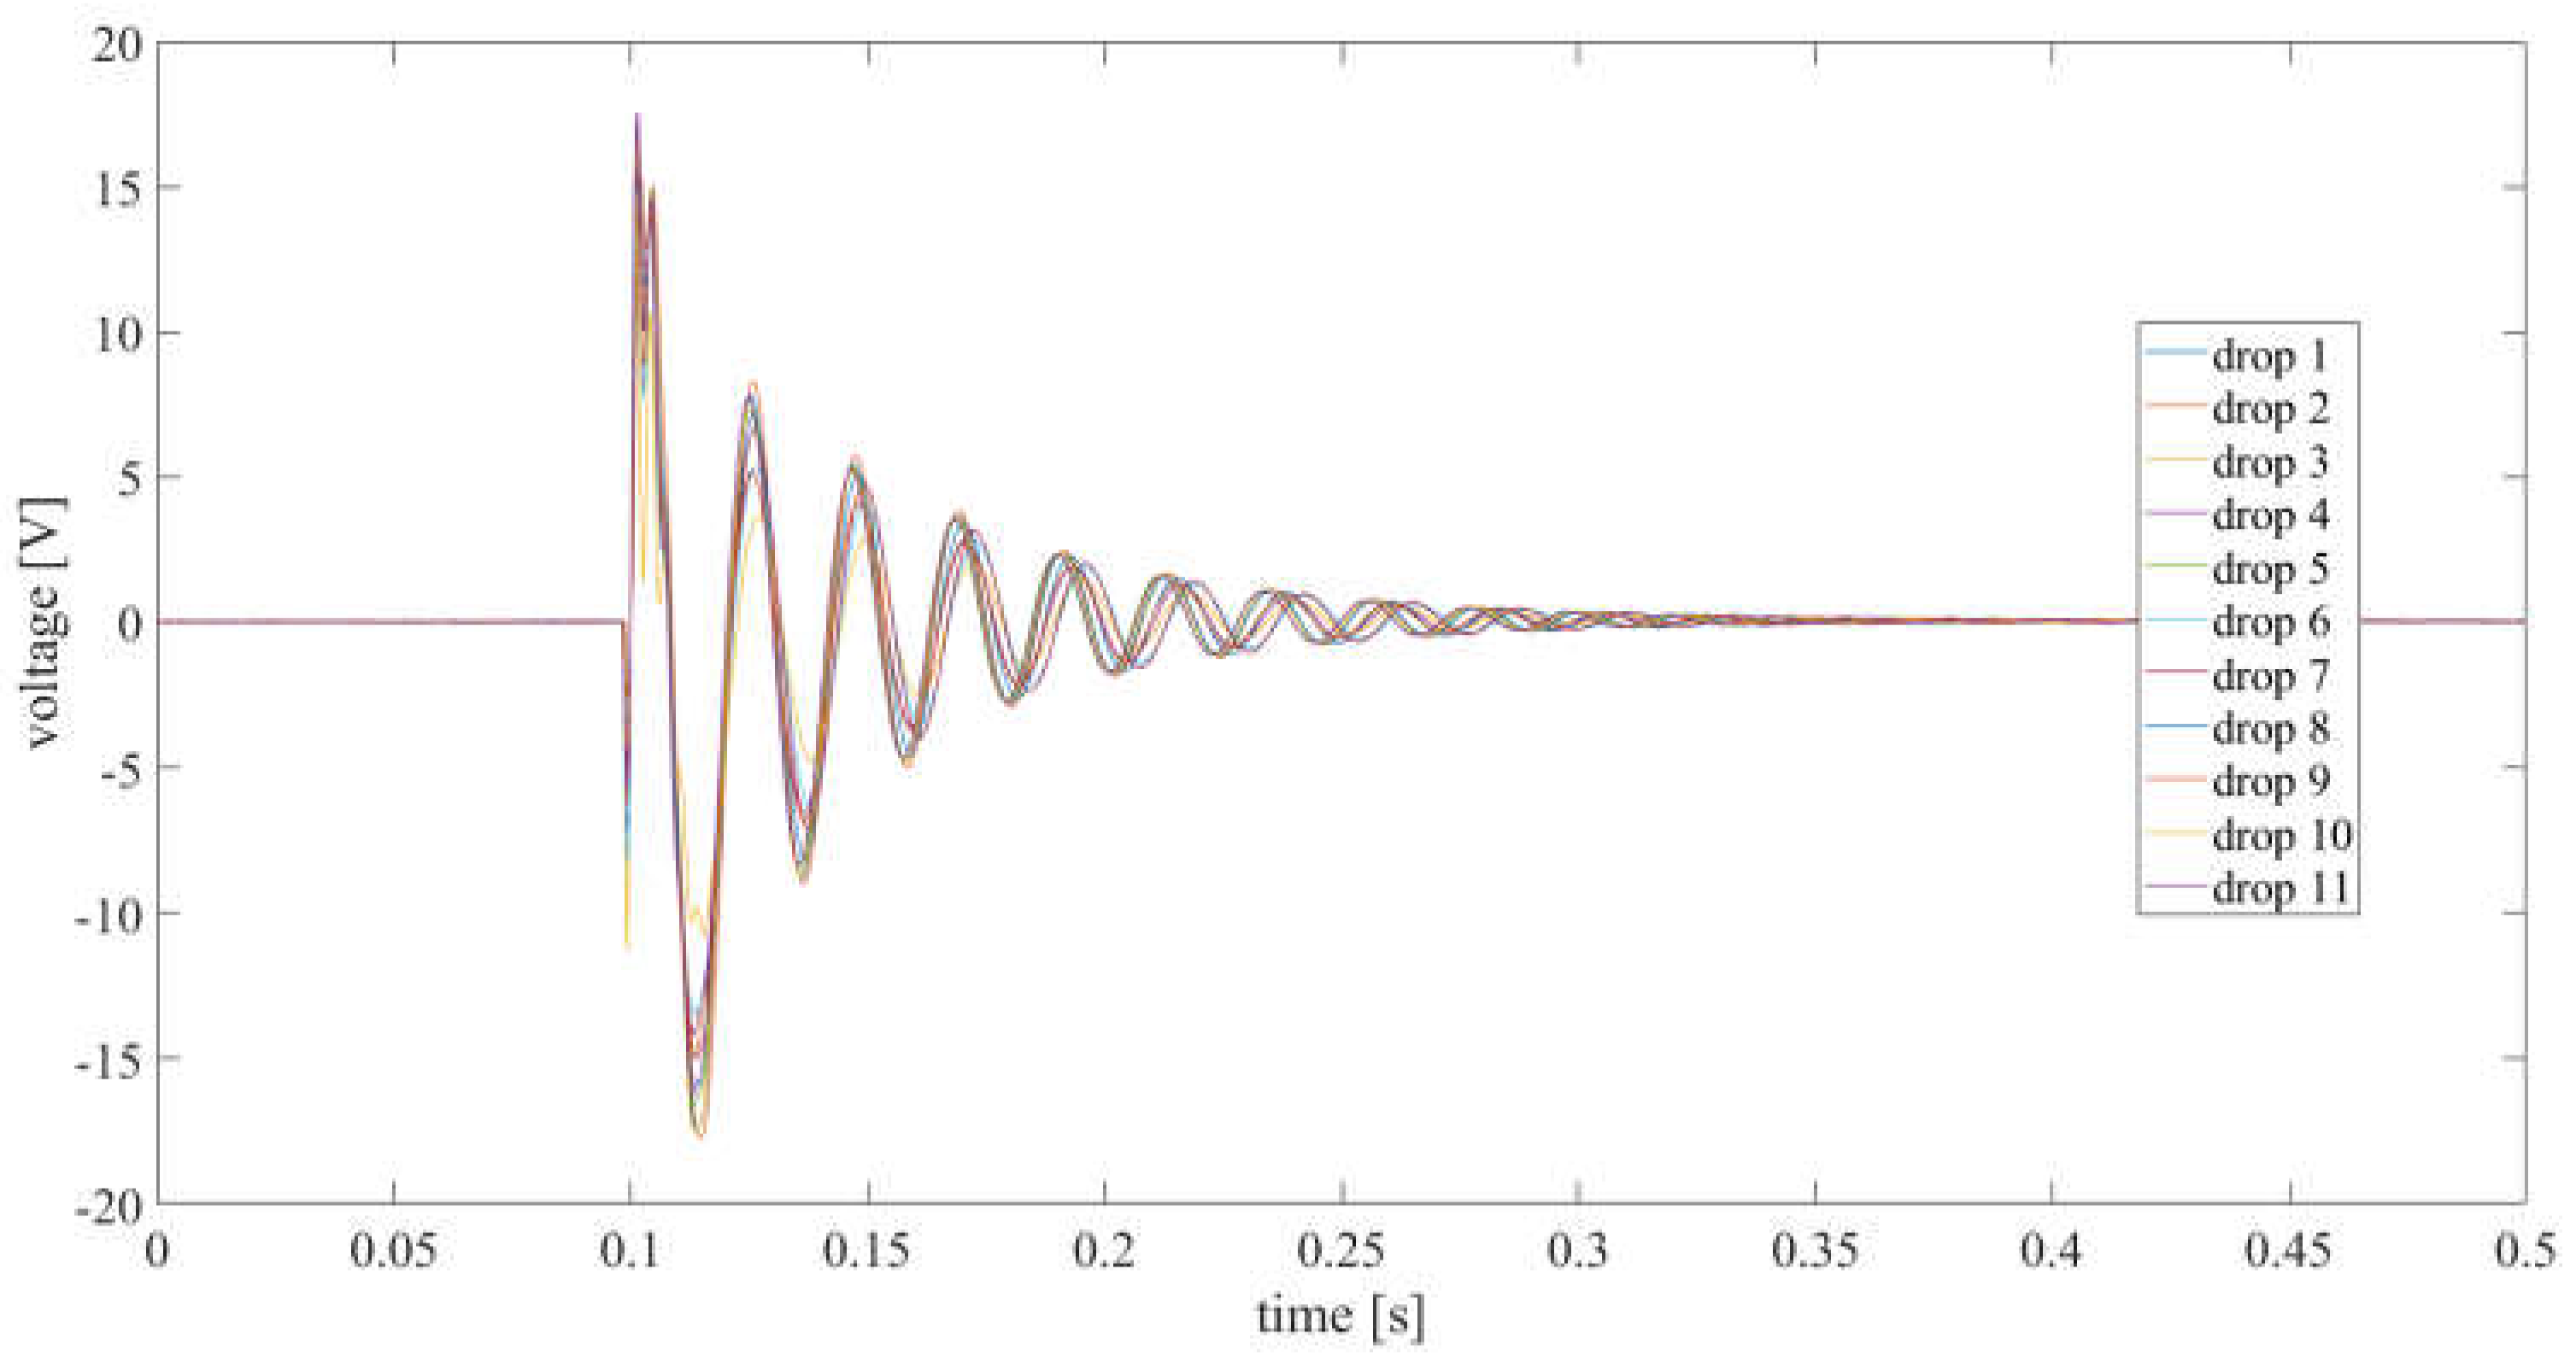
In order to test the harvesting structures, different raindrops were dropped, and an average waveform was identified. Figure 7 shows the minor differences in the behaviors of the cantilever structures with raindrops falling from a 0.5 m height.
The output was recorded using a Teledyne LeCroy WaveRunner 6Zi scope, used for the real-time monitoring and acquisition of the related waveforms. Internal impedance was set at 1 MΩ, in order to have an open circuit condition.
Moreover, Figure 8 shows the different behaviors of the cantilever structure raindrops falling from a 2.0 m height.
The comparison between Figure 7 and Figure 8 shows that the behavior of the waveform is quite the same, it is a form of damped oscillation, for which the time constant of the damping is equal to twice the period of oscillation. The structure of the cantilever given by the piezoelectric film, encapsulated into two mylar layers is defined in [26]. The LDT1-028K series is a flexible component comprising a 28 μm thick piezoelectric PVDF (polyvinylidene fluoride) polymer film with screenprinted silver ink electrodes, laminated onto a 0.125 mm polyester substrate, and fitted with two crimped contacts. The active part has the following dimensions: length 30 mm, width 12.19 mm, thickness 0.028 mm; it is encapsulated on a shield of length 41.40 mm, width 16.26 mm, with two mylar layers of 0.125 mm thickness.
Roundy and Wright [27] described an equivalent electro-mechanical model for a piezoelectric cantilever; the stress given by the source (in the present case the raindrop) is correlated with voltage output by taking into account the piezoelectric strain coefficient, the electric field, the displacement field, the permittivity, the mass of the cantilever and inertia moment. The scheme presented in [27] was made for bimorph models, so a three-layer system was developed in [11]. The characterization was performed for a one-edge fixed cantilever, the transfer function was developed, and the traced Bode diagram showed an amplitude maximum located at 260 rad/s, with a corresponding period of 25 milliseconds [11].
The average values for the peaks are about 12 V and 17 V, for 0.5 m and 2.0 m heights, respectively. The exact damping ratio can be evaluated by logarithmic decrement method [28], and is about 0.25–0.27.
As expected, the frequency of oscillation remains the same, as it is related to the length of the cantilever.
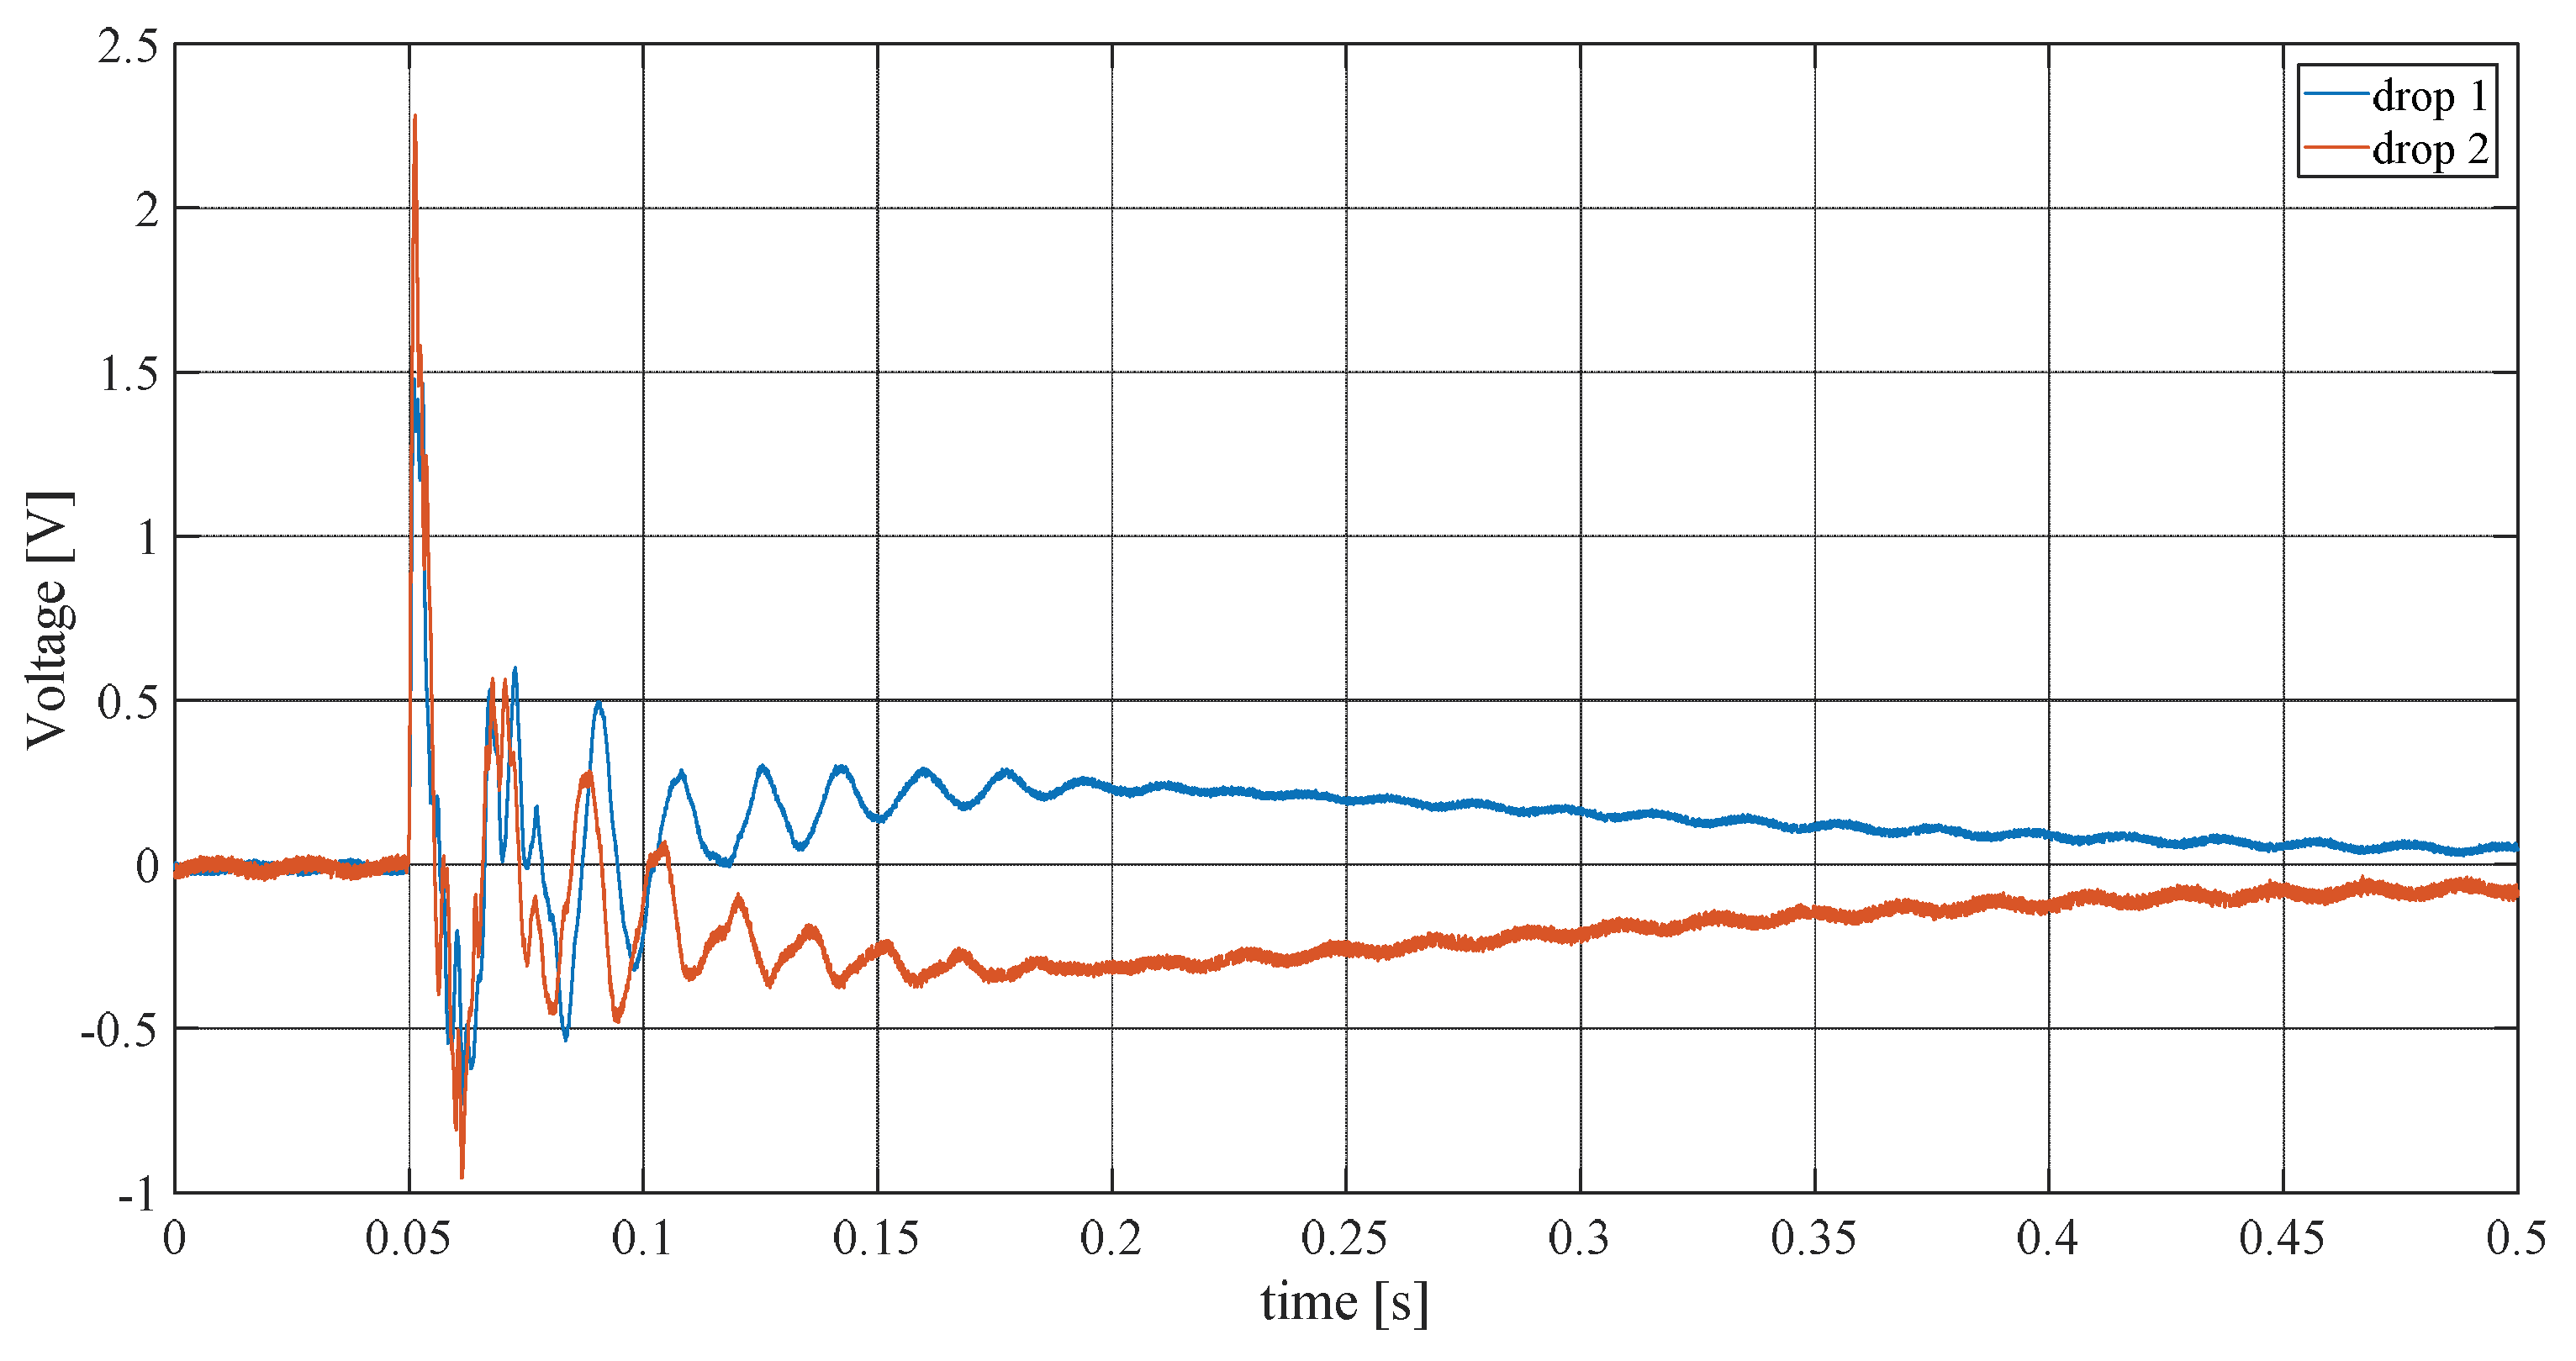
Figure 9 shows the performance of the bridge cantilever. In order to present a clean figure, only two drops were considered, but more were acquired to confirm the average behavior.
The first part of the waveform is similar to the previous case; the second part shows a very low-frequency oscillation above zero value for the blue curve and below zero for the orange one.
This behavior, in which there is a strong initial impulse, followed by lower oscillations, is not appreciable by a rectifying system, since the voltage drops in the diodes could cancel the waveform of voltage.
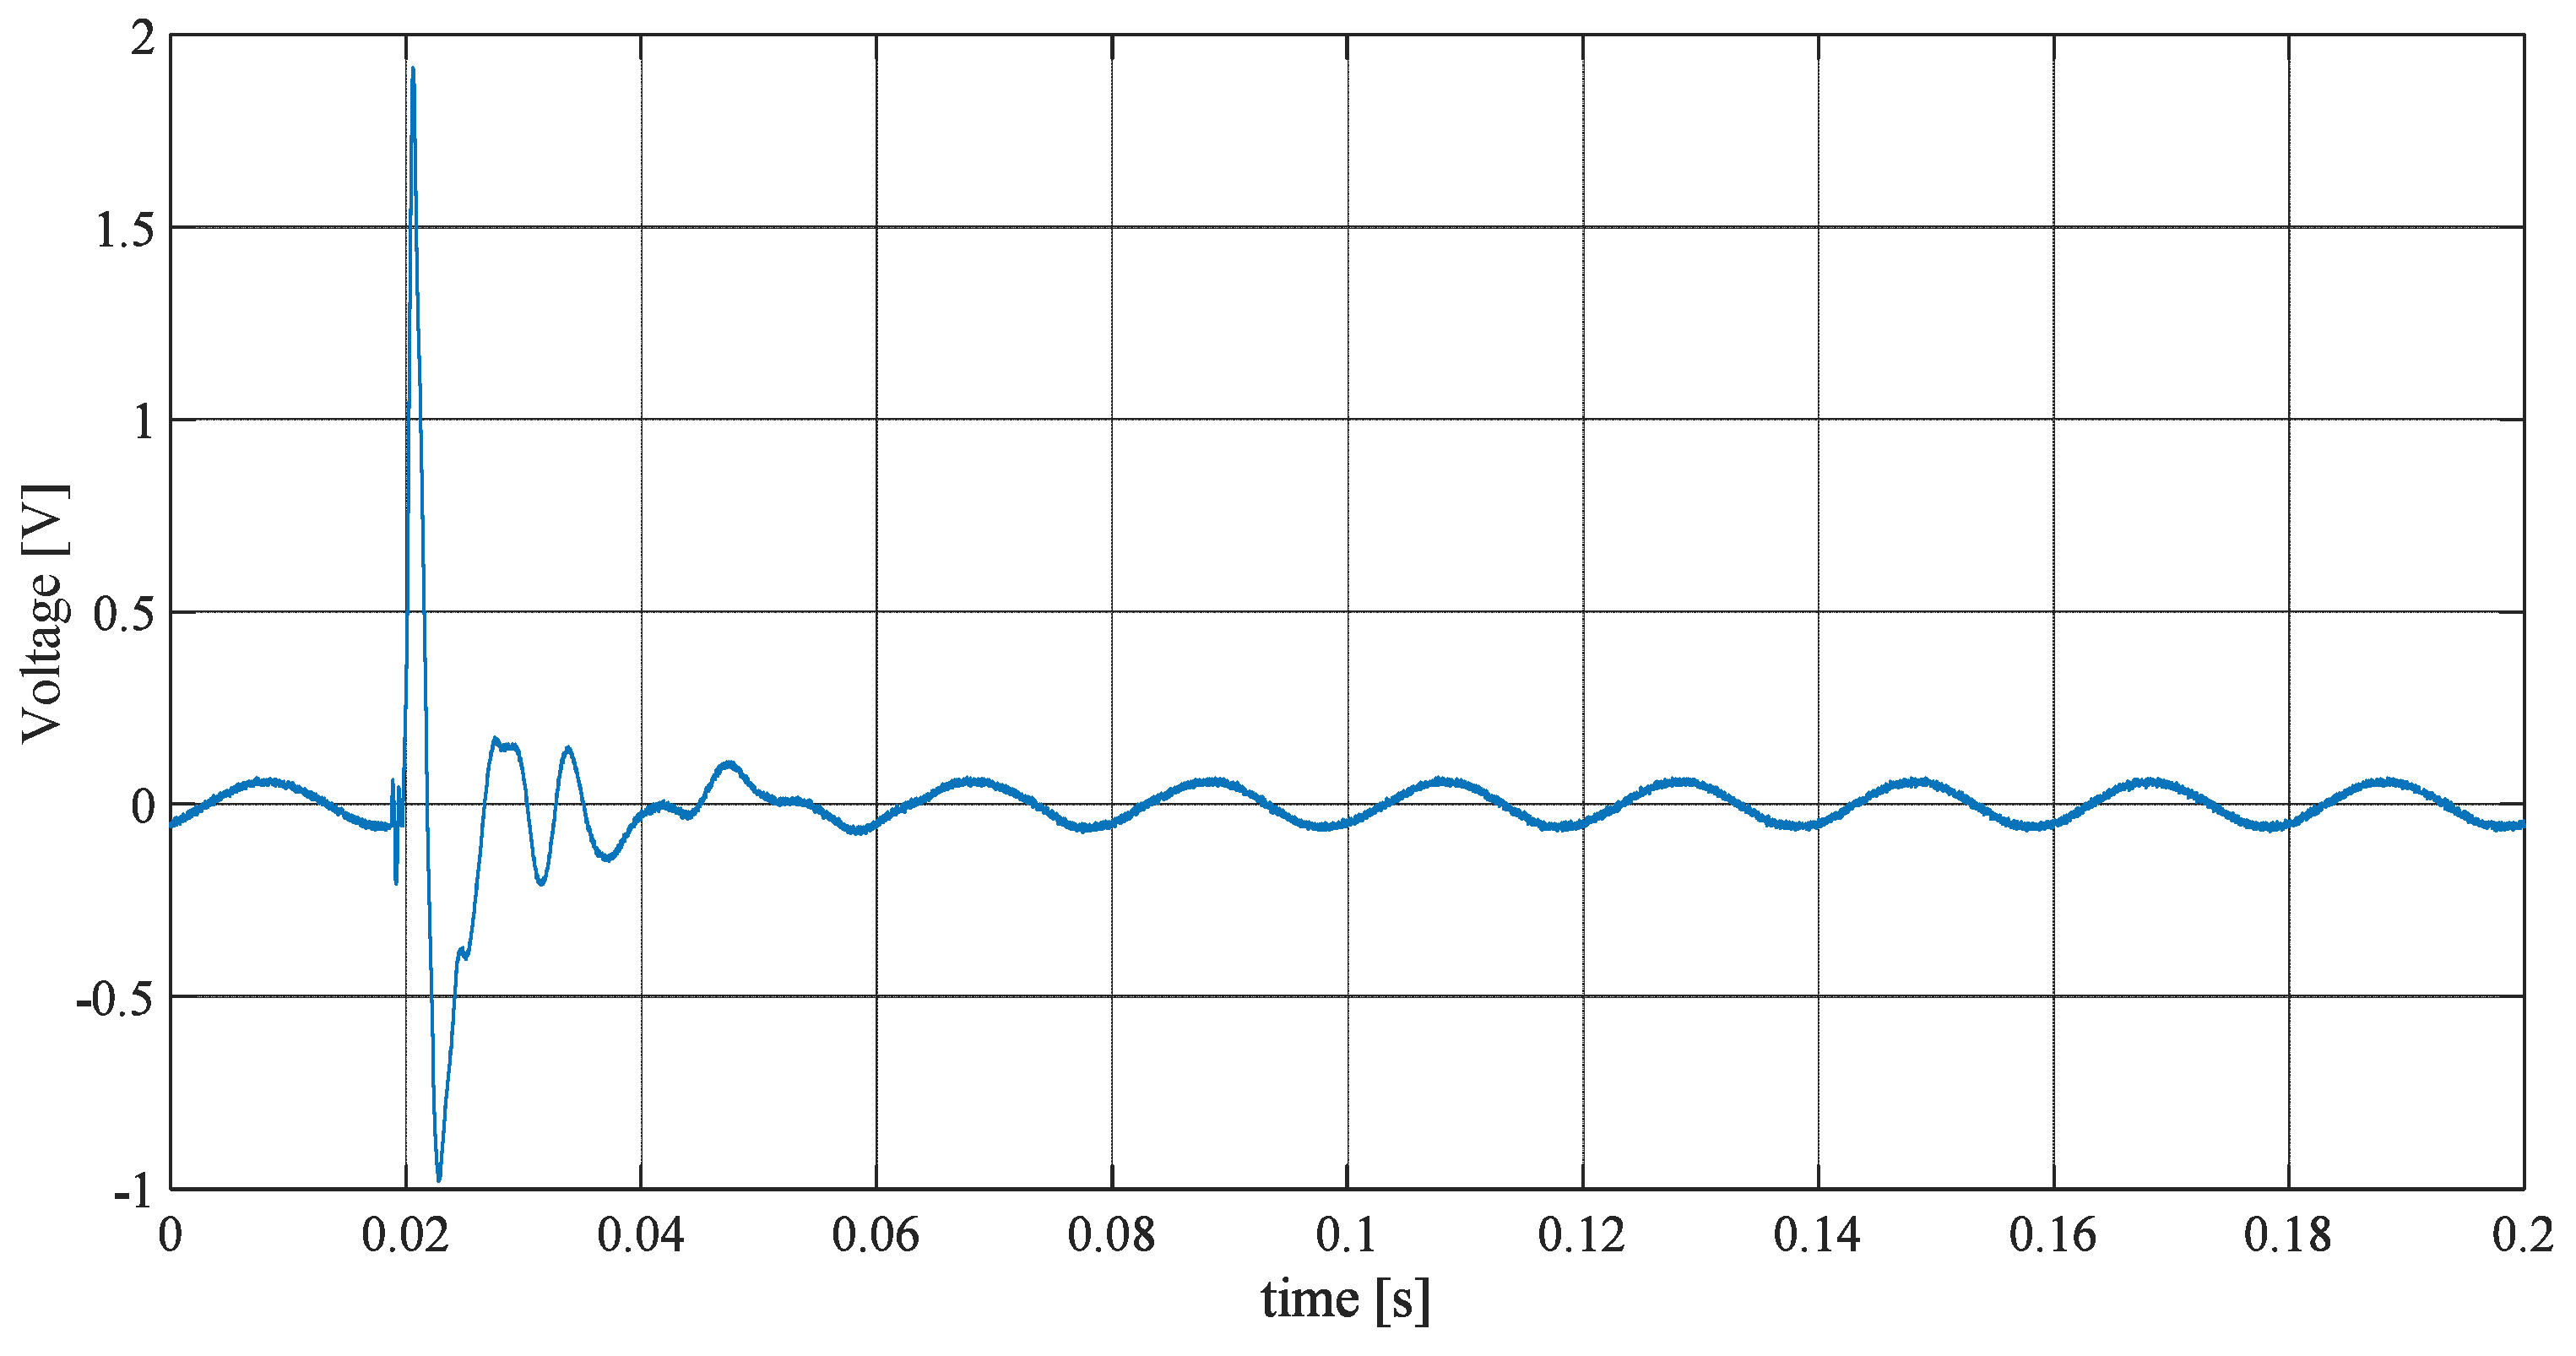
Figure 10 shows the voltage waveform for the floating circle of Figure 3 and Figure 6. This behavior is closer to the behavior of the bridge harvester than the cantilever one, since again there is a great initial pulse and sub-sequential periodic oscillations due the floating system.
Different tests were conducted, also considering the 2 m height, and in such cases the behavior shown in Figure 9 and Figure 10 was replicated with twice the voltage.
The harvester of Figure 2 and Figure 3, realized with the structures of Figure 5 and Figure 6, showed different natural frequencies. The bridge has similar oscillations to the cantilever (period of 15–20 milliseconds), but also oscillations with a period of a second. This is due to the fact that the drop of water cannot easily leave the bridge, creating a state of bending that the next drop, falling a second later, cancels.
The floating circle structure showed oscillations with a period of about ten milliseconds (first part of the waveform) and then with a period of about twenty milliseconds.
Although these waveforms are interesting, they have a low energetic content, low voltage values, and in the first instance it can be stated that the obtained voltage waveforms at the oscilloscope terminals show that the cantilever structure achieved the best response in extracting energy (maximum of voltage peaks and different peaks). The next step in this research requires the characterization of the rectifying circuit.
4. Rectifying Circuits
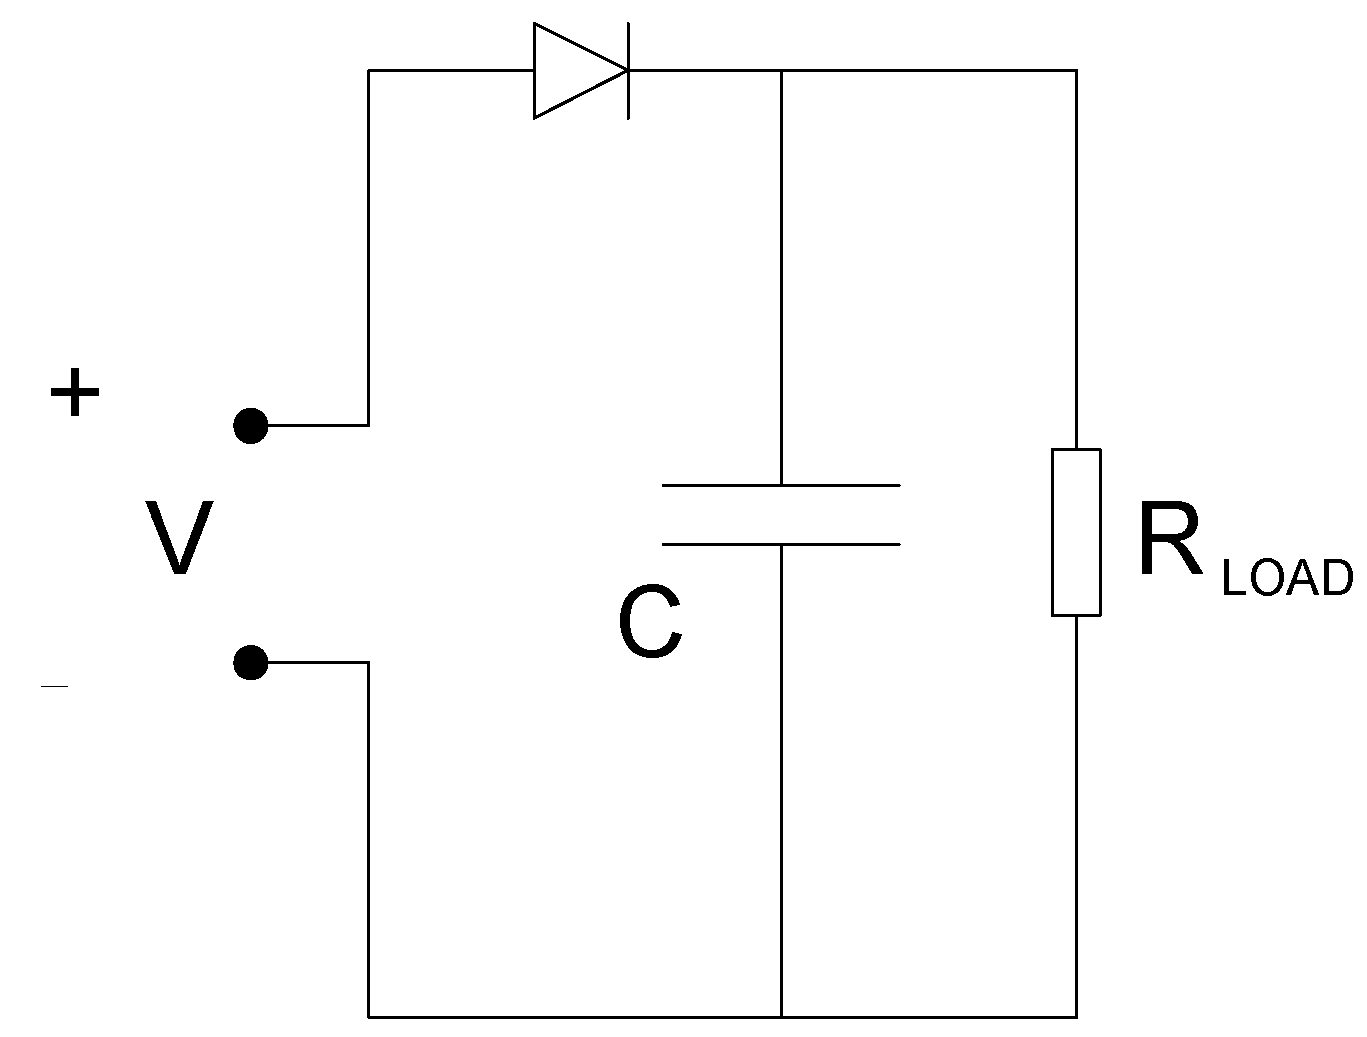
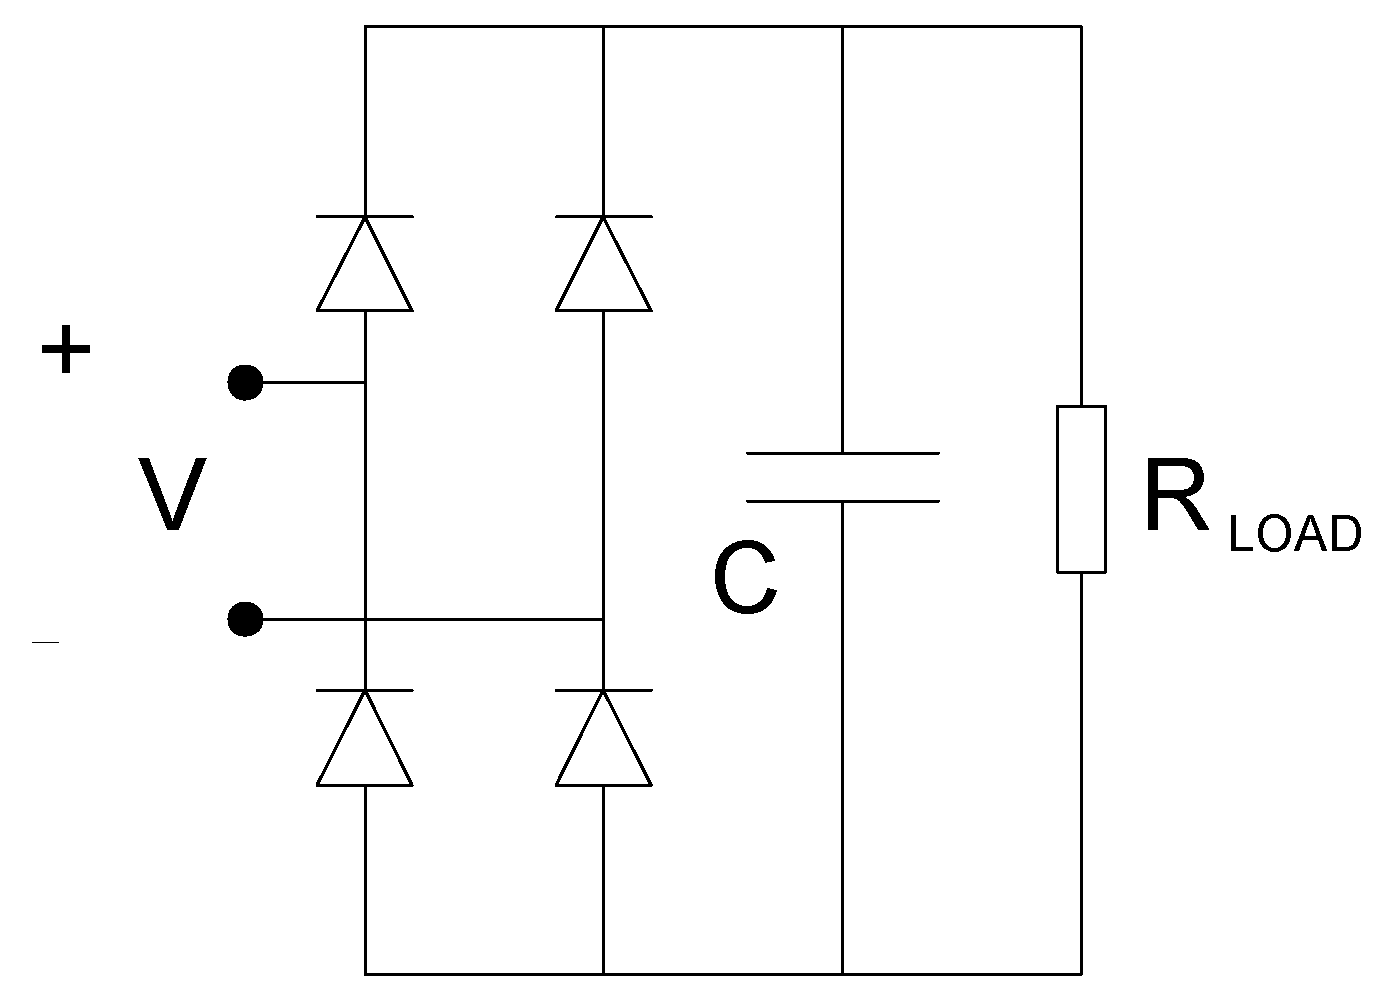
The harvested energy has to be stored in a capacitor until its value reaches that needed to feed the load, so a rectifying circuit has to be developed. The most commonly used rectifying circuit is the full bridge, but the half bridge can also be used, Figure 11 and Figure 12.
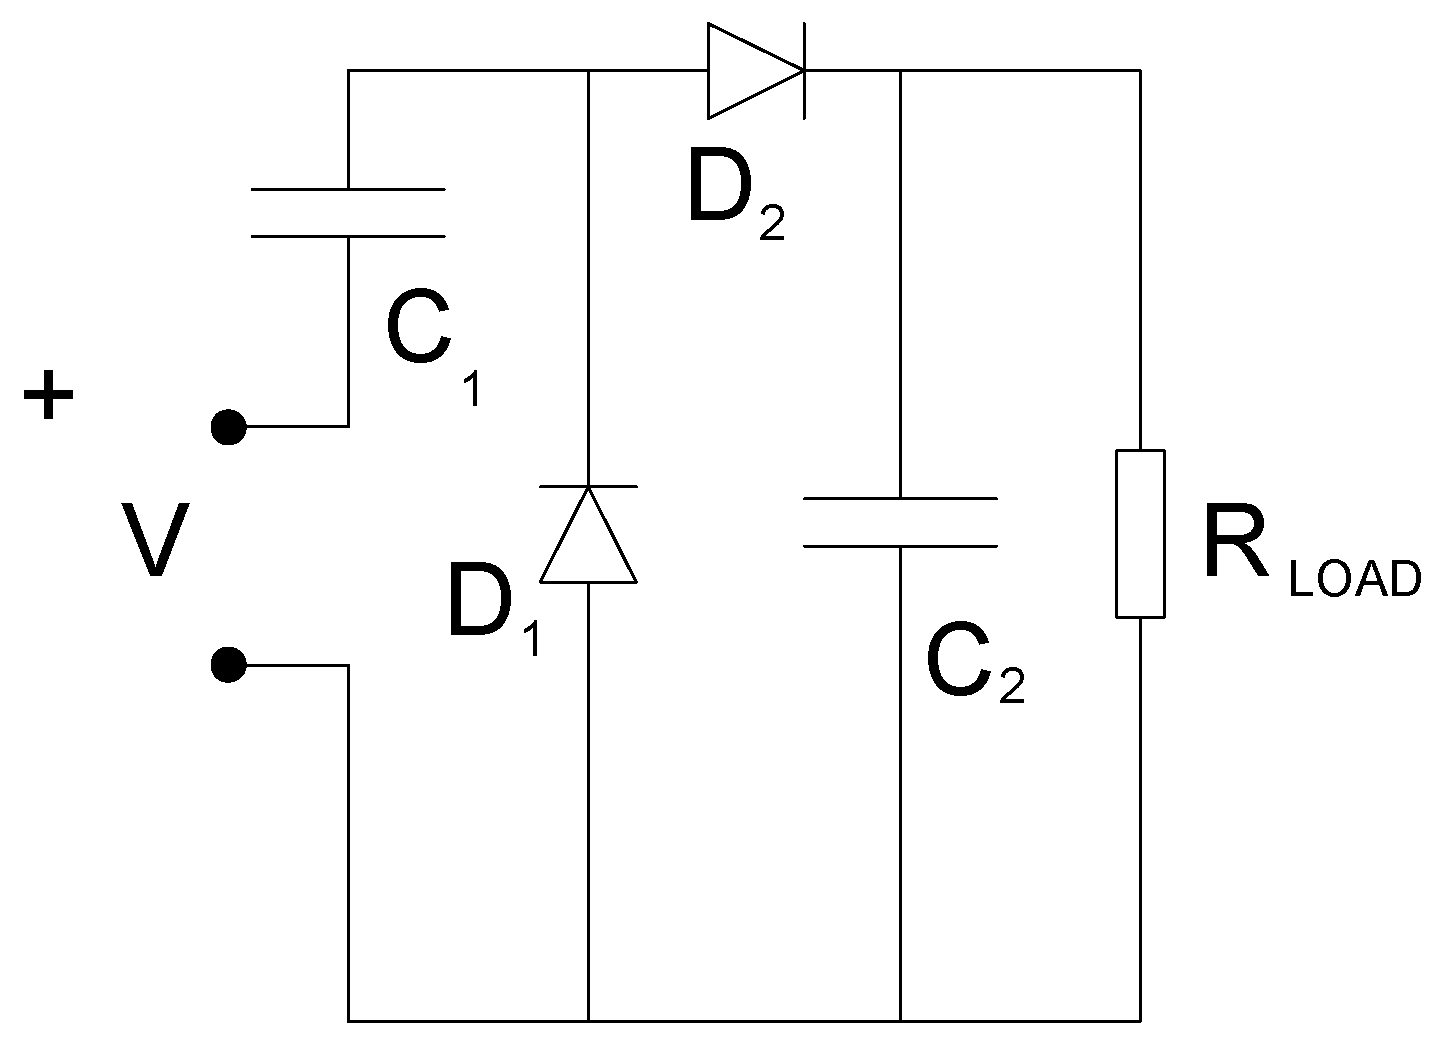
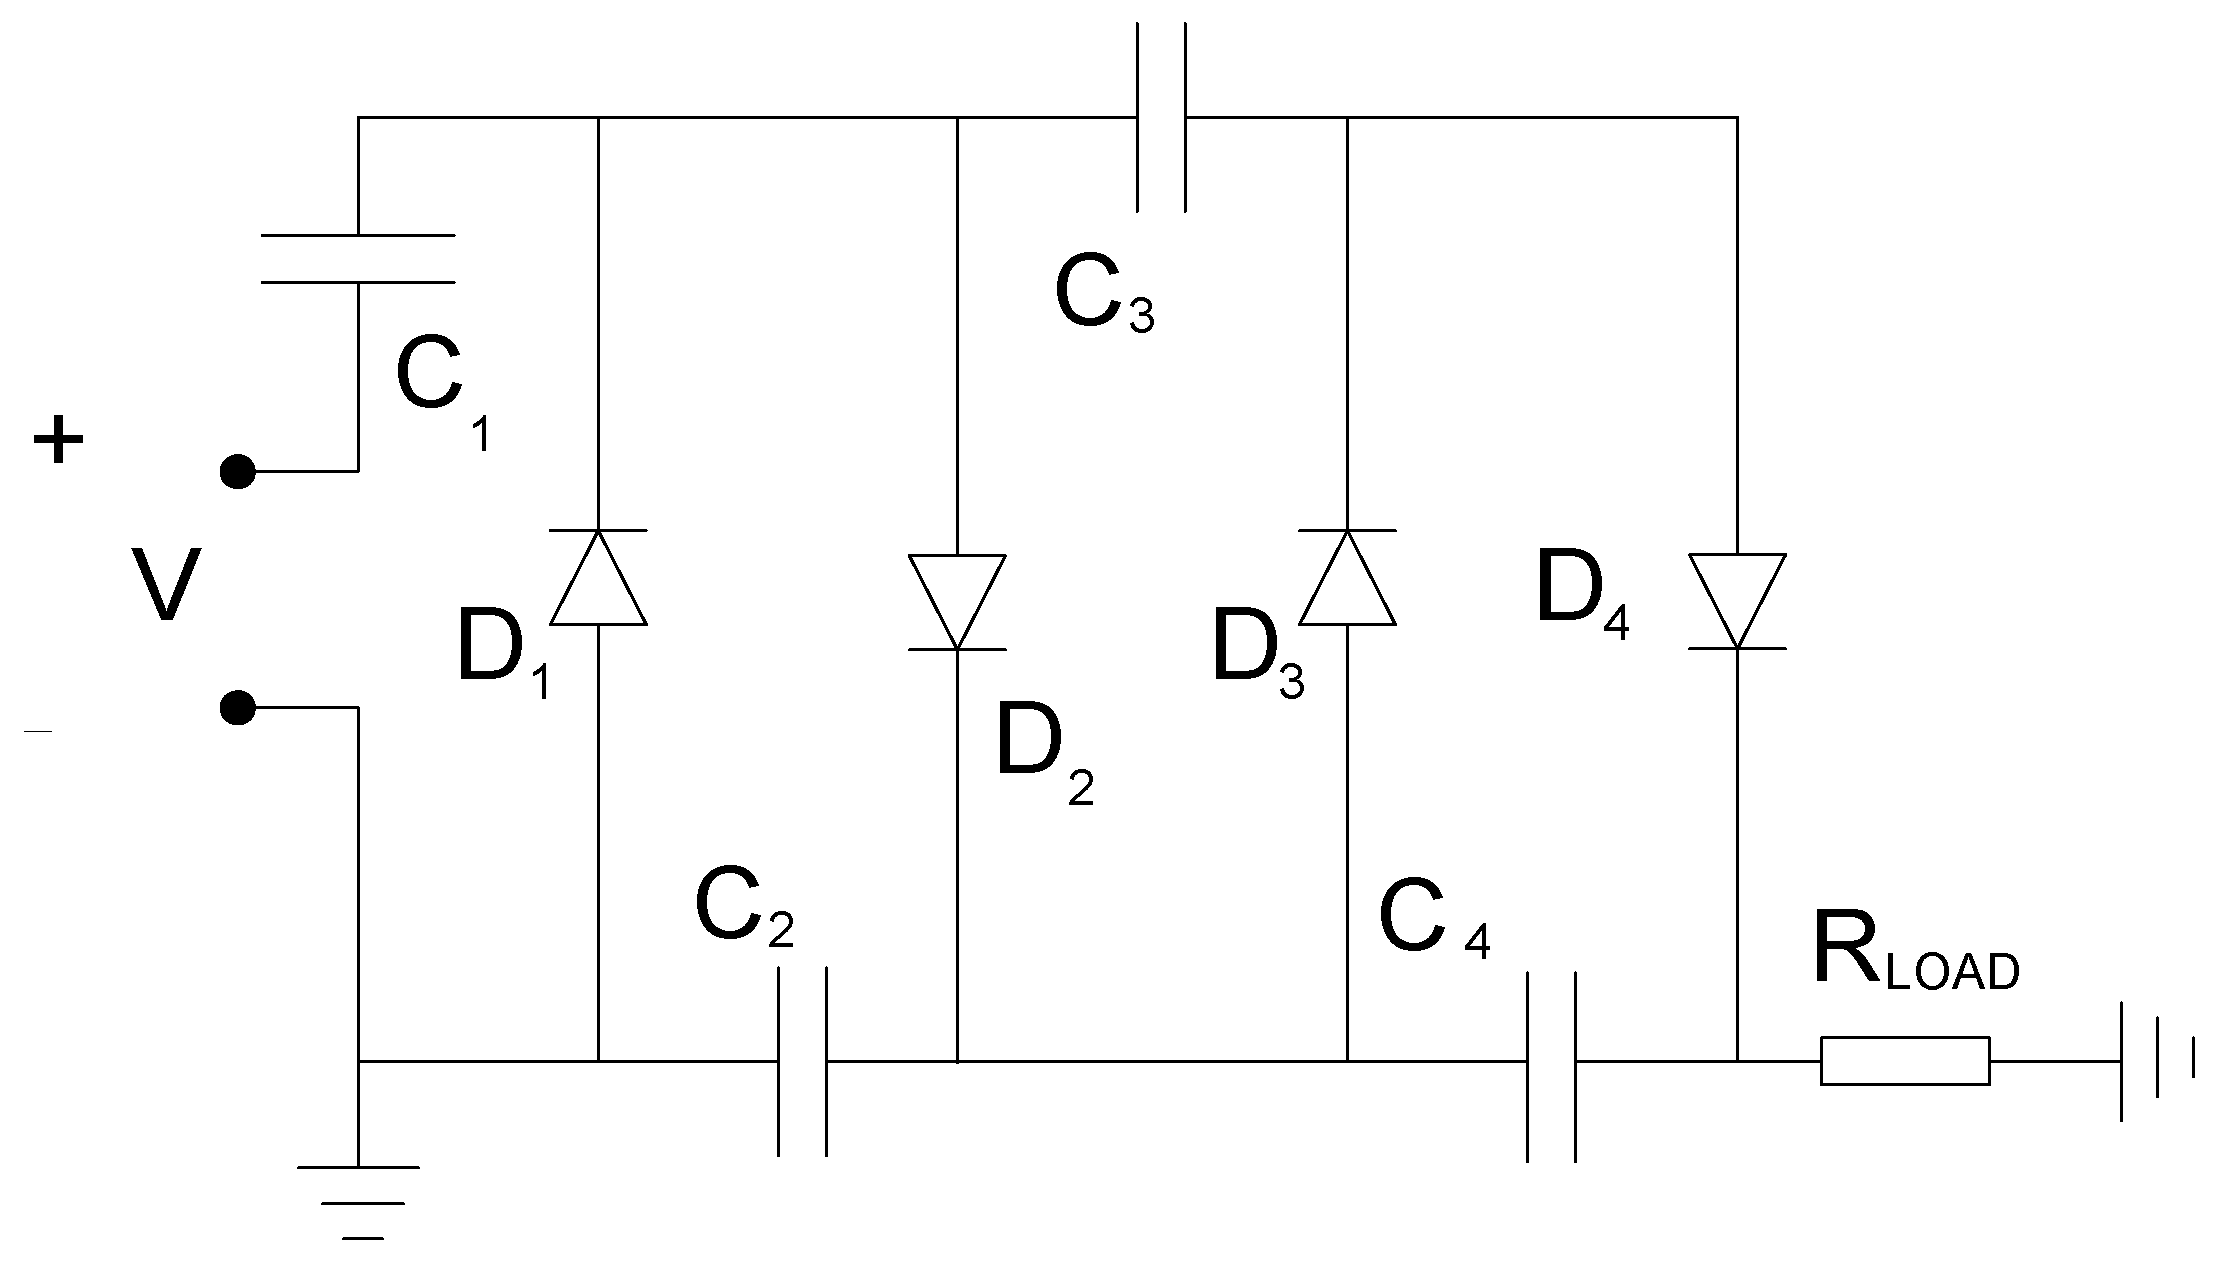
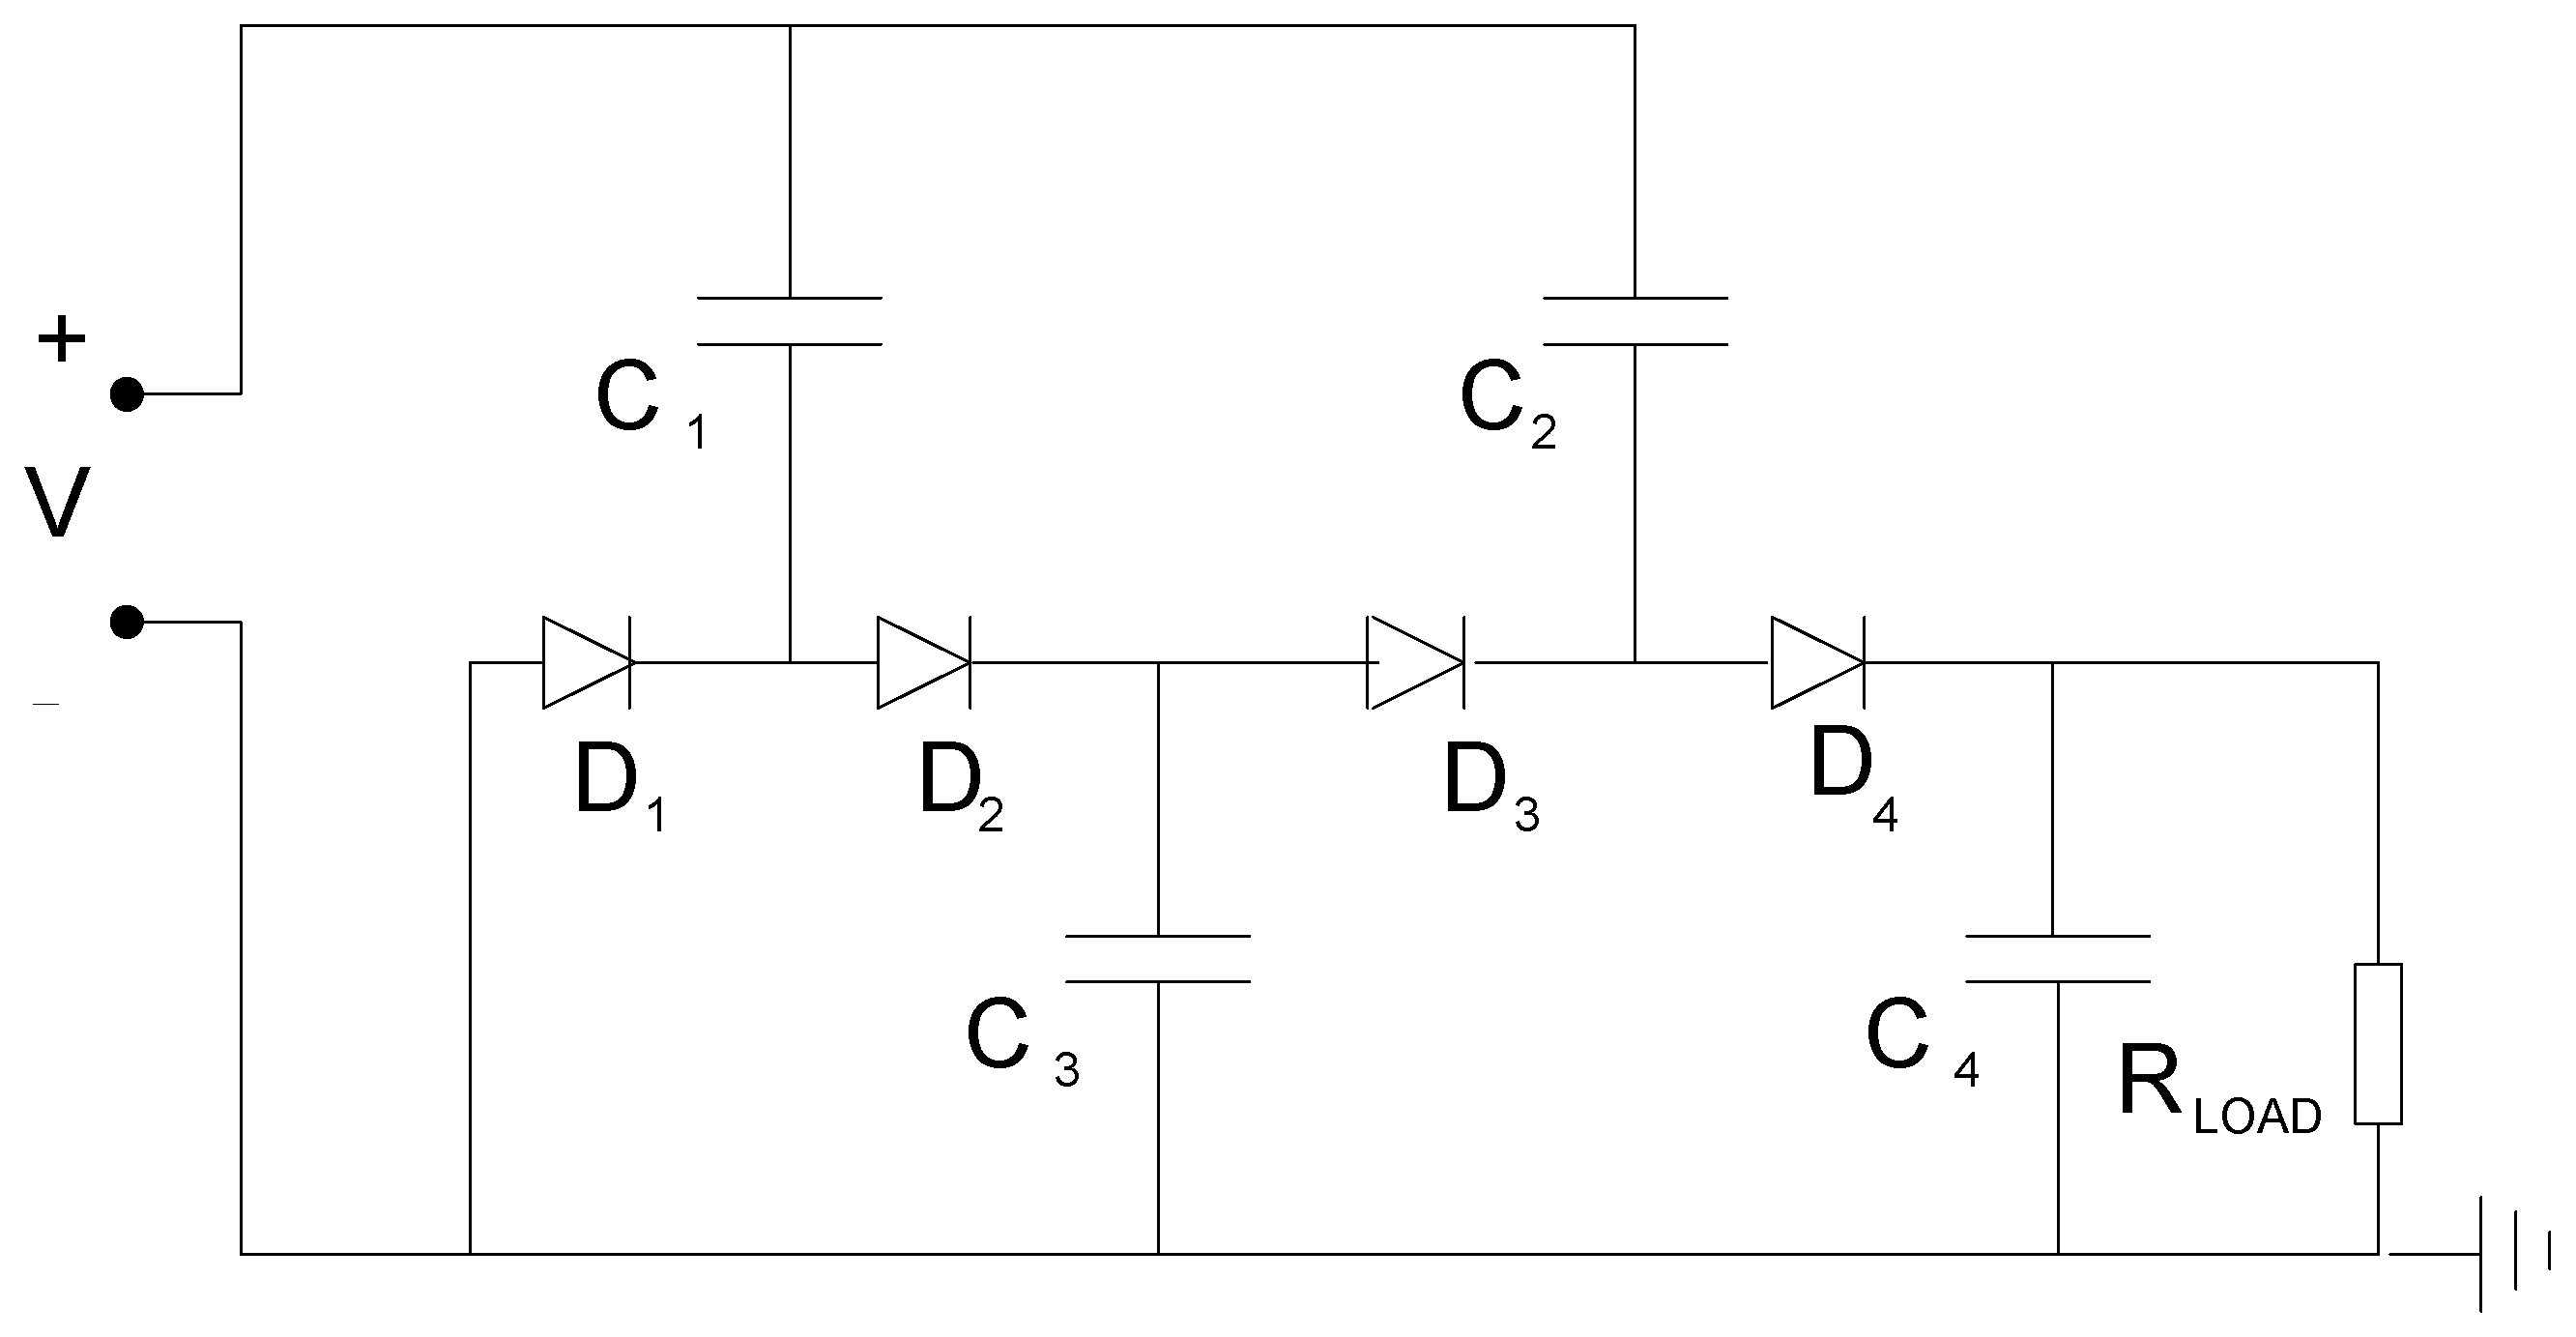
In [20], three advanced schemes were presented: the Greinacher voltage Doubler, Figure 13, the Cockcroft Walton Cascade Voltage Doubler (CWCVD), Figure 14, and the Karthaus Fisher Cascade Voltage Doubler (KFCVD), Figure 15.
The idea at the base of these circuits is to charge capacitors from the input voltage and connect them in series to obtain twice (or more) the voltage produced by singular input.
Simulations were performed in [20], showing that the Greinacher voltage doubler is the most effective, but KFCVD is the most promising for reducing the voltage ripple.
In [20], the voltage source was modeled by an AC sinusoidal ideal pulse, while the waveforms obtained in the third paragraph show that this hypothesis is far from truth.
5. Performance of Rectifying Circuits
Different simulations have been developed in order to compare the results of [20] with a more realistic system.
The voltage presented in Figure 7 has been considered as the first and most interesting, since it is the one with the most alternative waveform. This is an important issue, since in order to also consider the real voltage drops of the diodes, the higher voltage form has to be taken. Another important issue is the role of the capacitors; these elements are fully loaded with a spike current and infinite power, without considering the impedance of the source. Such a situation is far from the real behavior of the piezoelectric source, so an impedance of 10 kΩ is added to the voltage source. This value was chosen in order to have the same value as the load resistance used in the simulation in [20]. All employed capacitors have the value used in [20], 47 µF.
Although the piezoelectric harvesters are usually represented by a Norton scheme with a current generator and a parallel impedance, in this study, starting from the measured voltage in open circuit conditions, an equivalent Thevenin scheme was used and an internal series impedance was inserted.
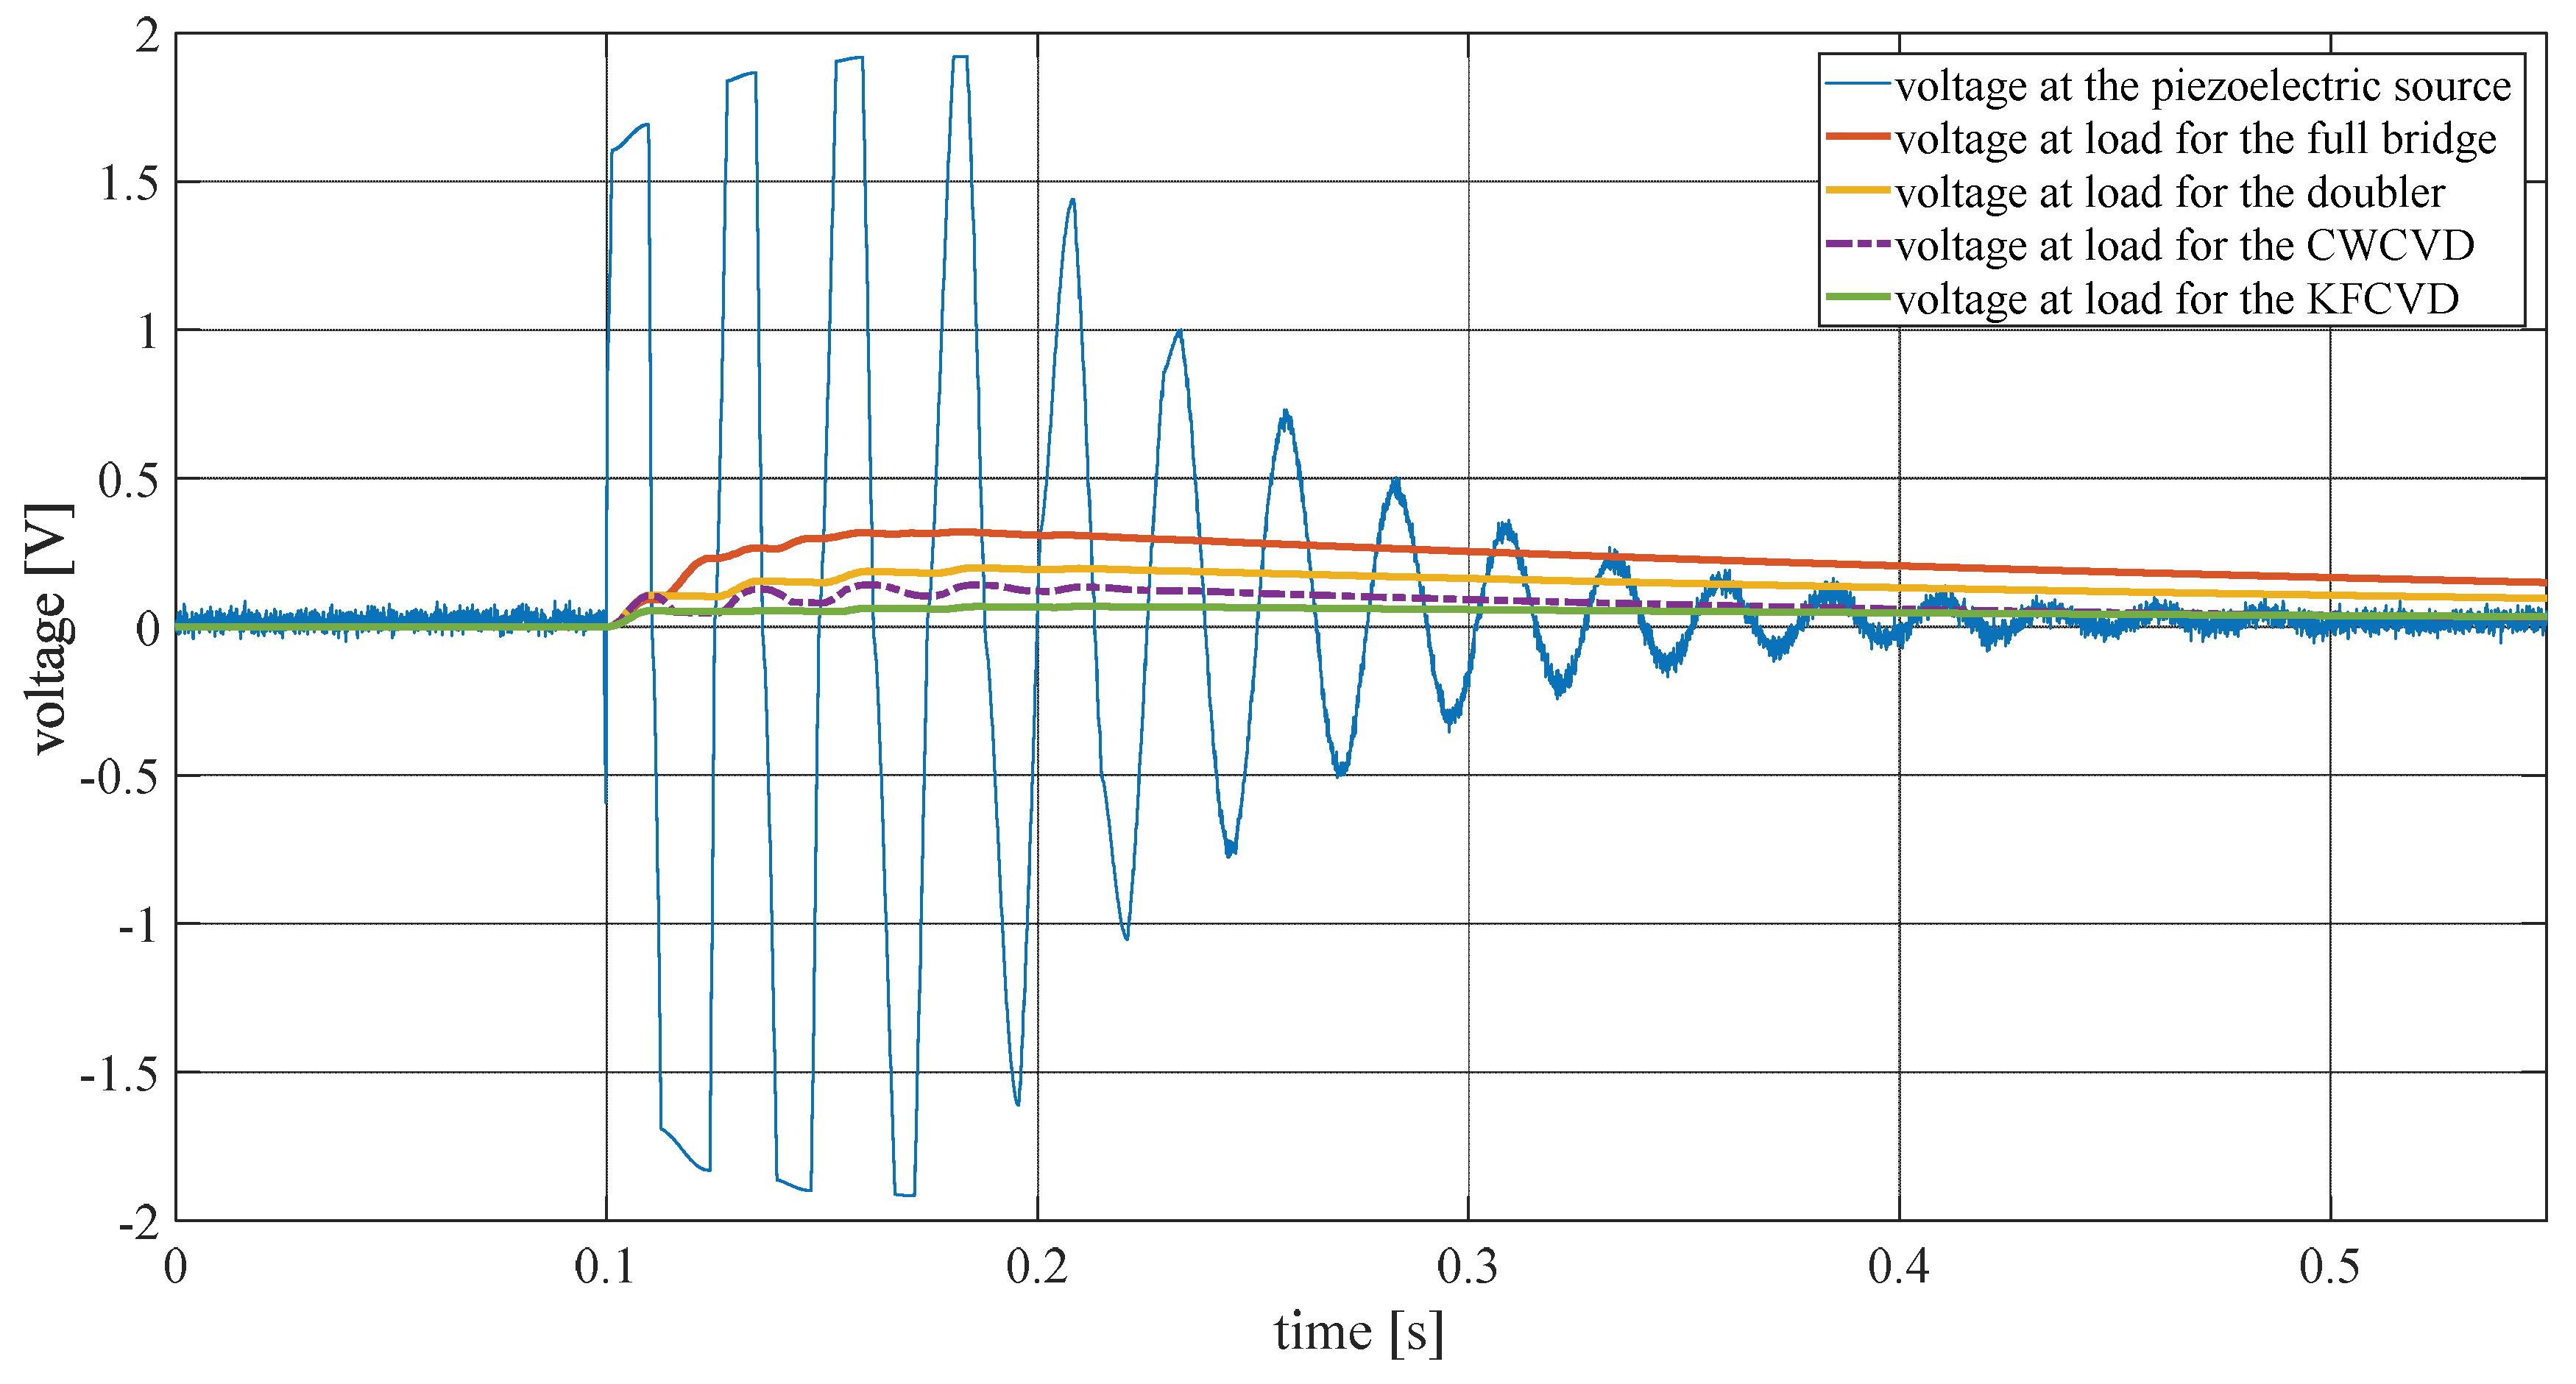
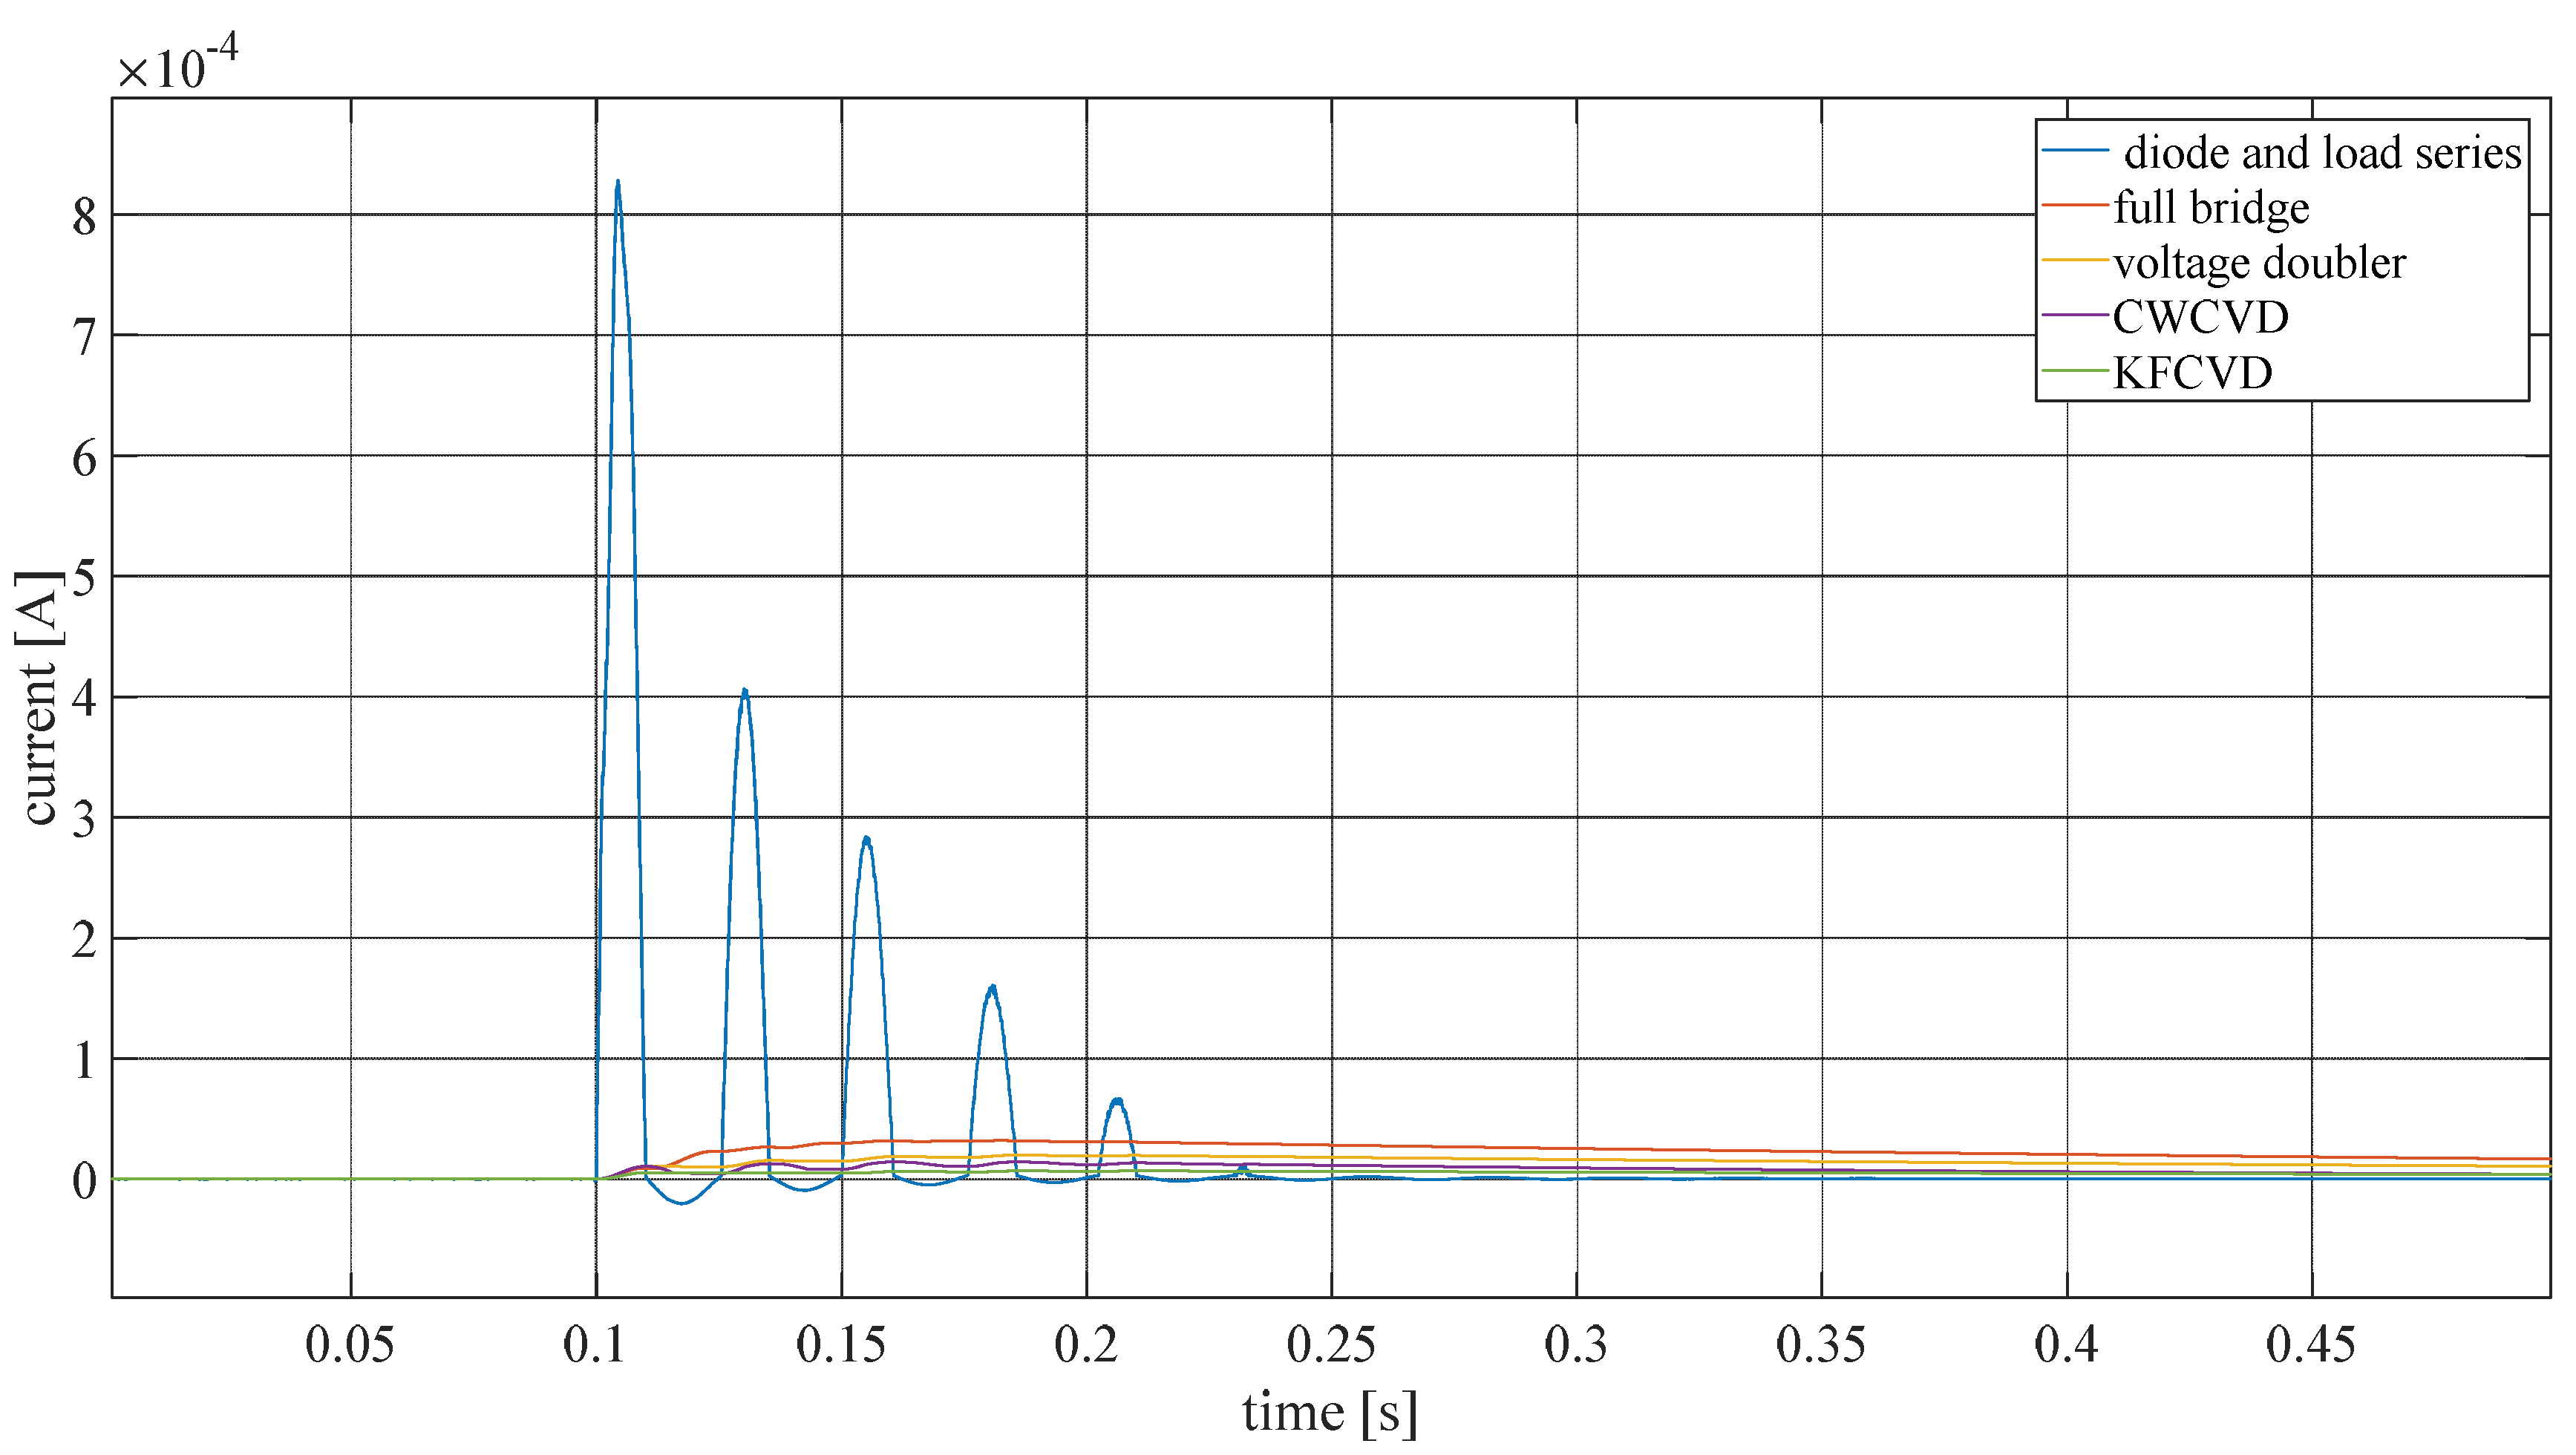
In each simulation, the voltage and current waveform were plotted. In the following figures, the blue waveforms represent the limit ideal case; for the voltage, this is the maximum voltage that can feed the load due to the partition effect, and for the current, this is the behavior of the series of a diode and load. The full bridge performances have been traced with orange color, the Greinacher doubler with yellow, the CWCVD with purple, and the KFCVD with green.
Figure 16 shows the voltage profiles for the first rain drop, from the initial impact of which the capacitor is charged. The best performance is given by the full bridge.
Figure 17 shows the current profiles for the first raindrop hitting the piezoelectric; again, the best continuous form performance is given by the full bridge rectifier.
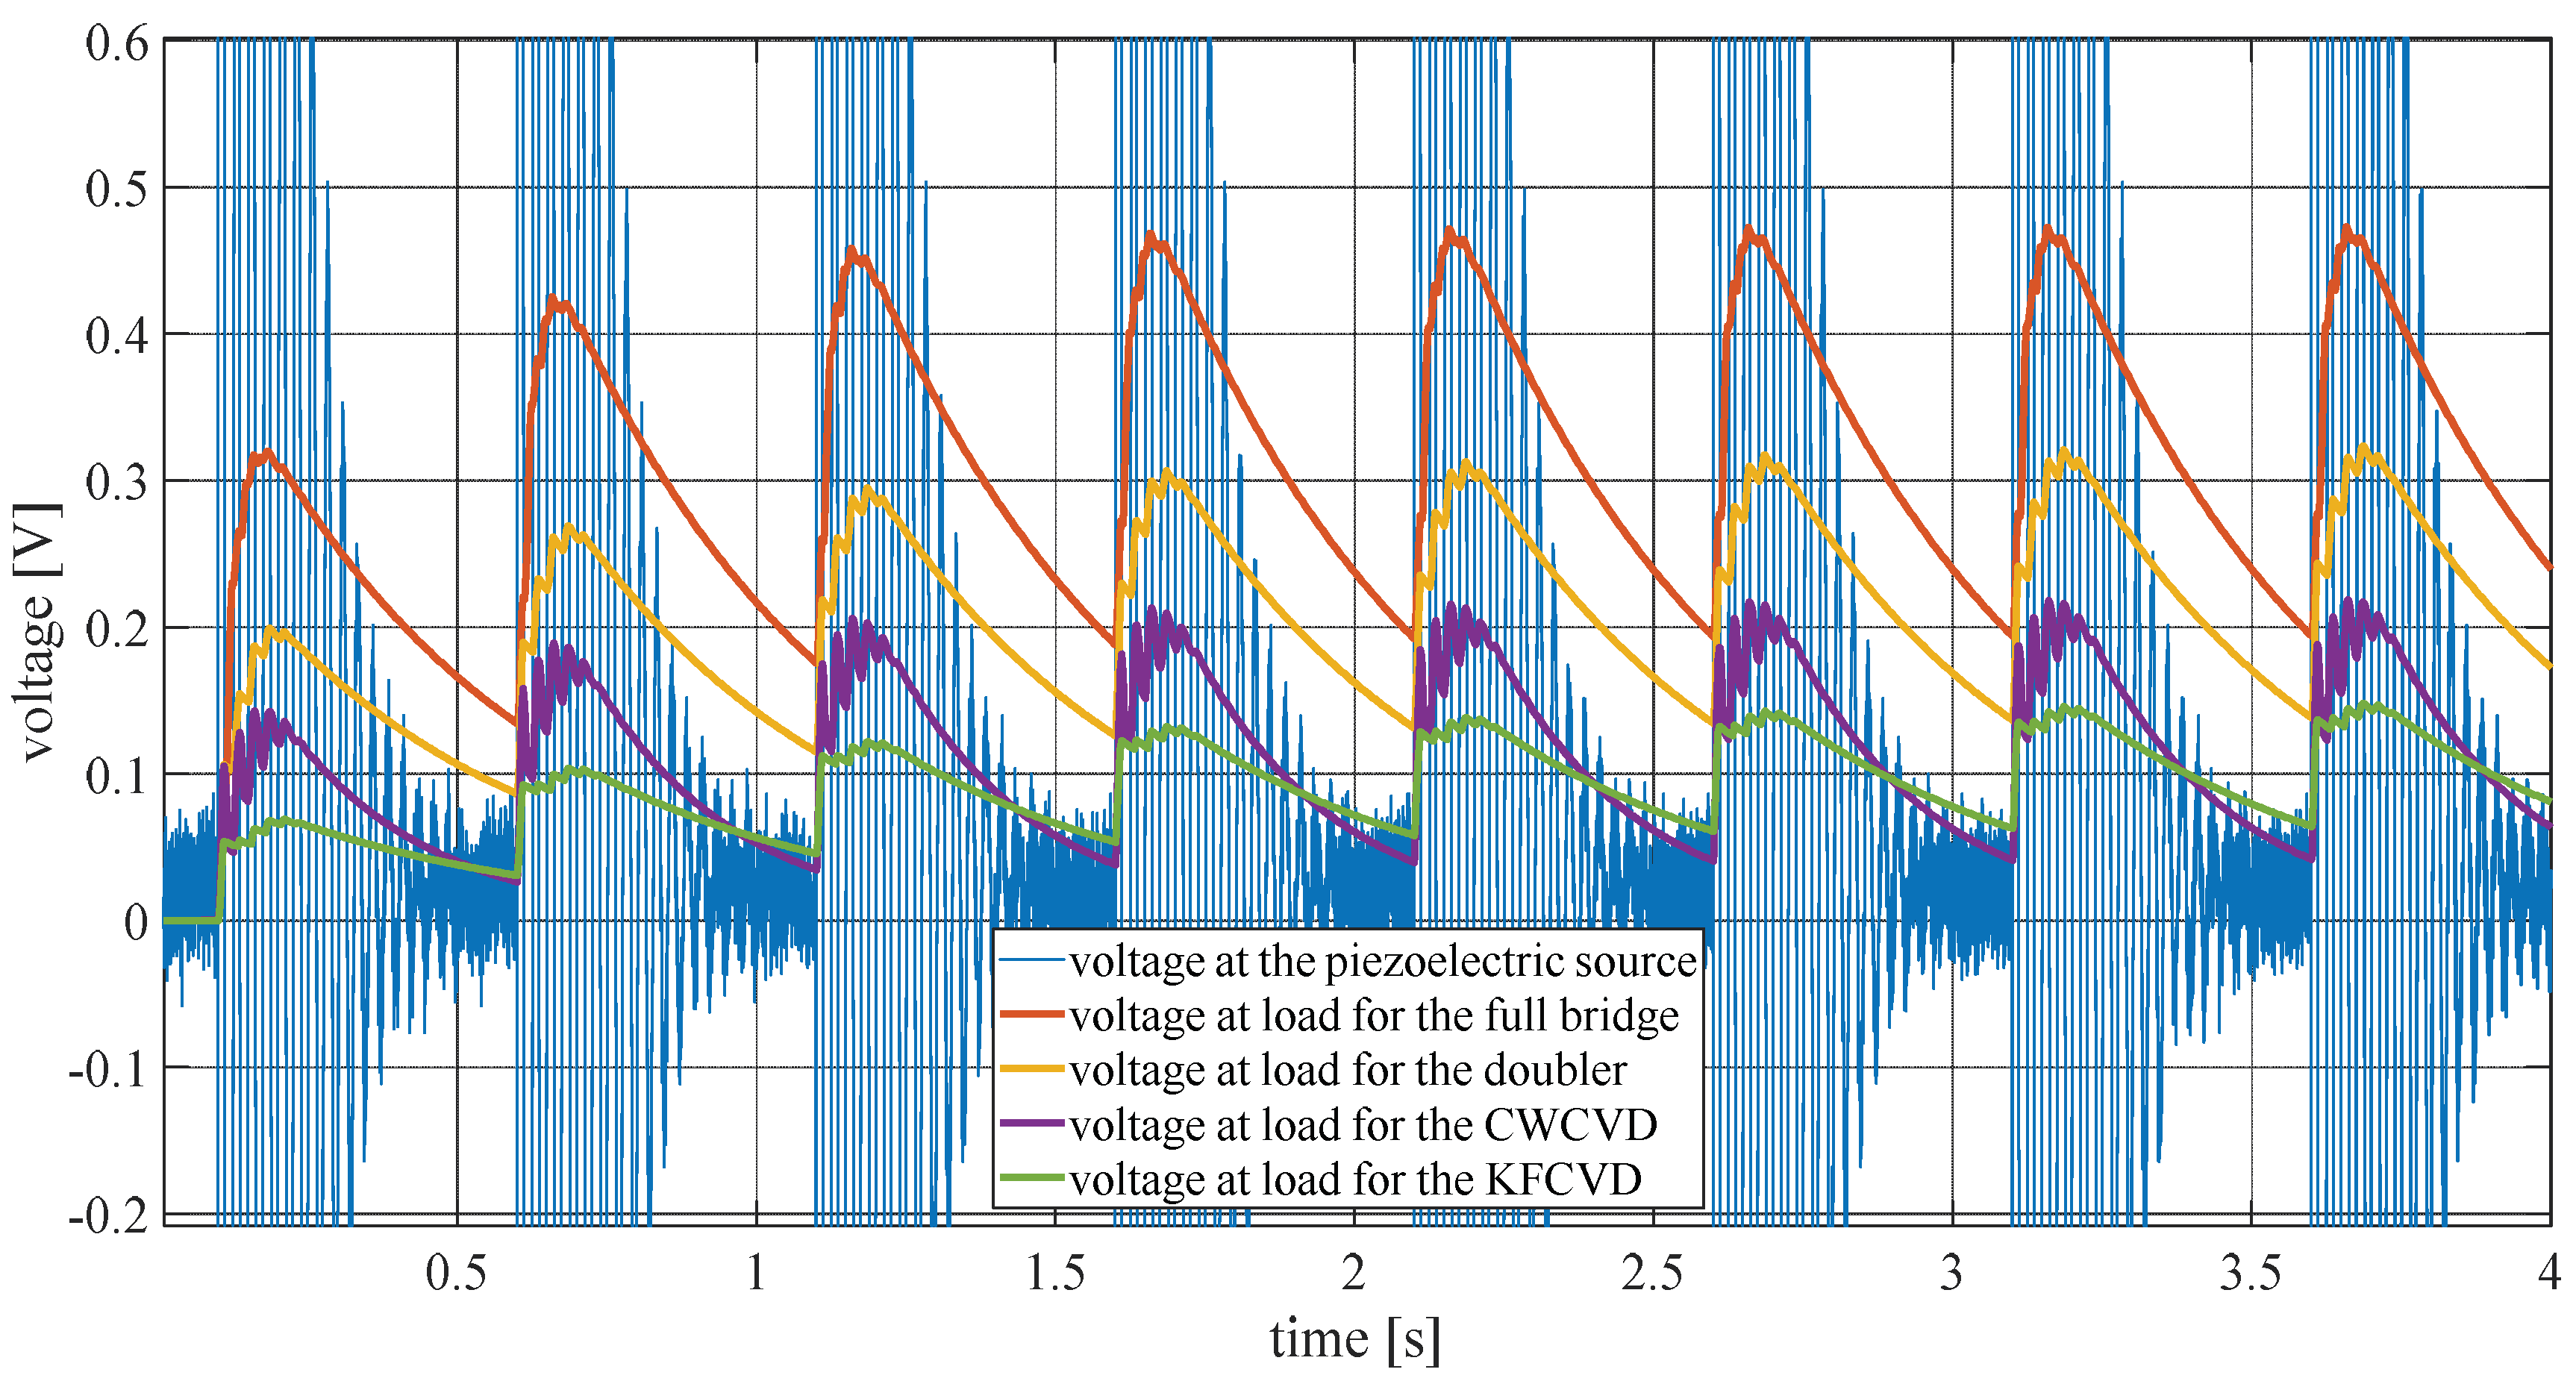
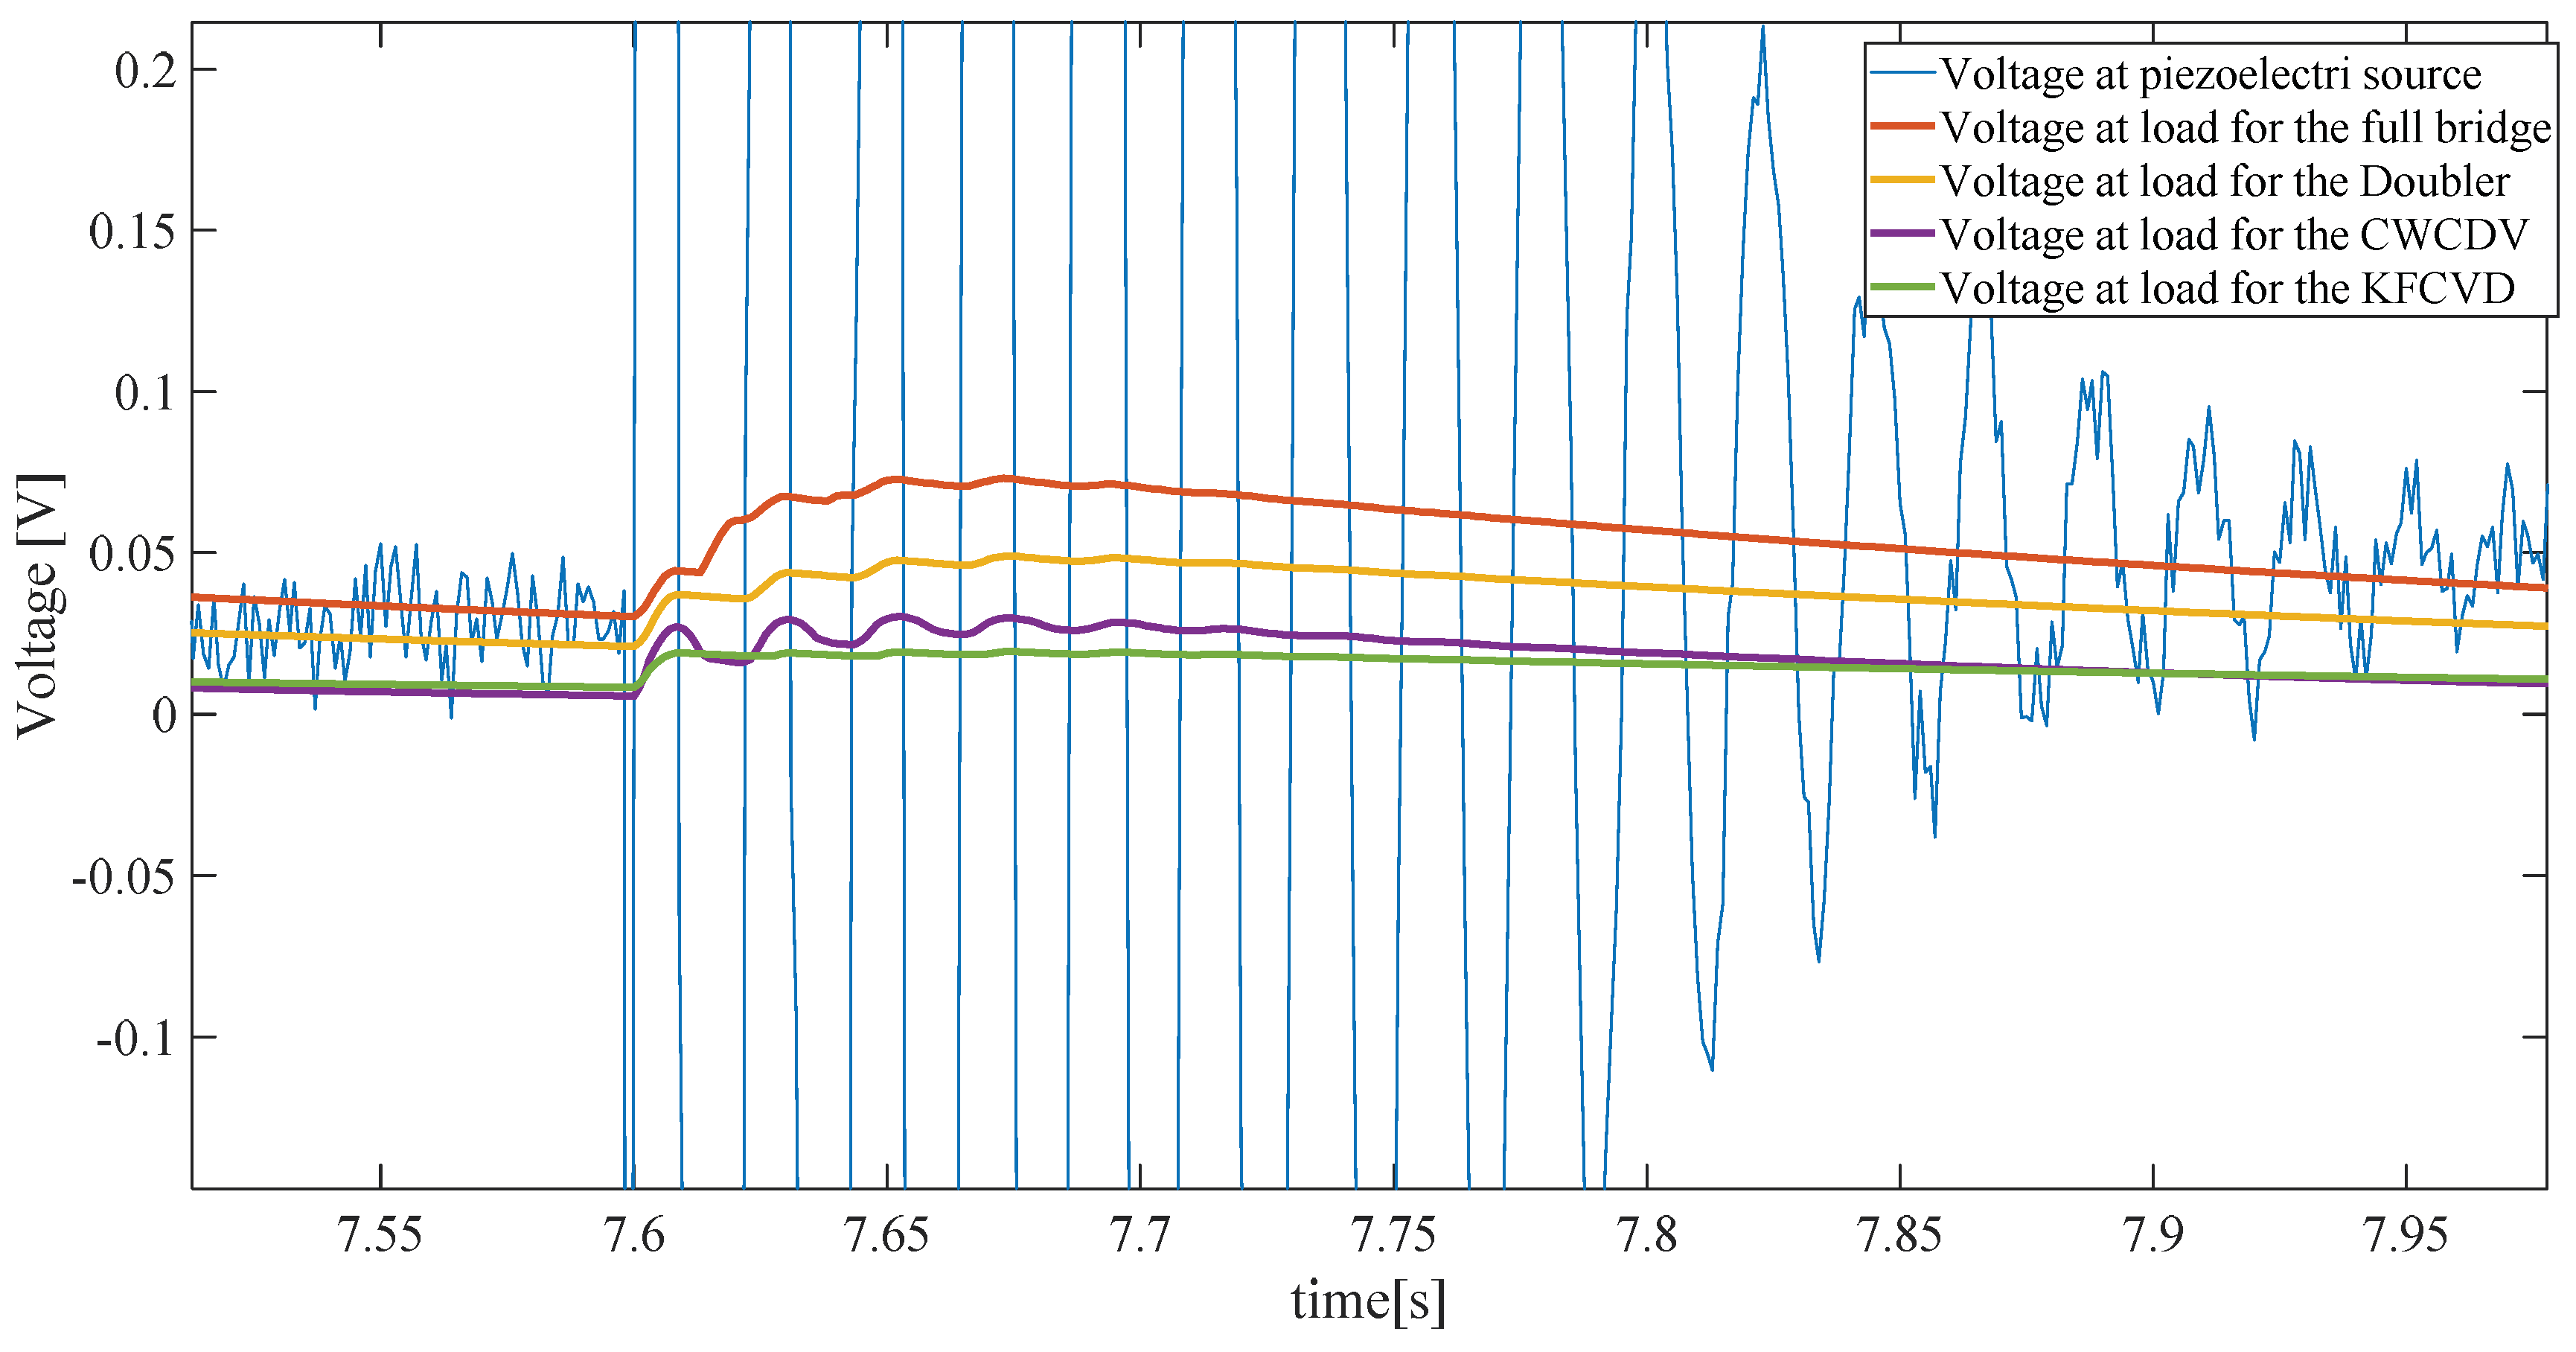
By considering different raindrops, all the capacitors can be charged, and the voltage on the capacitor will increase drop by drop, as shown in Figure 18. Again, the full bridge shows a better performance.
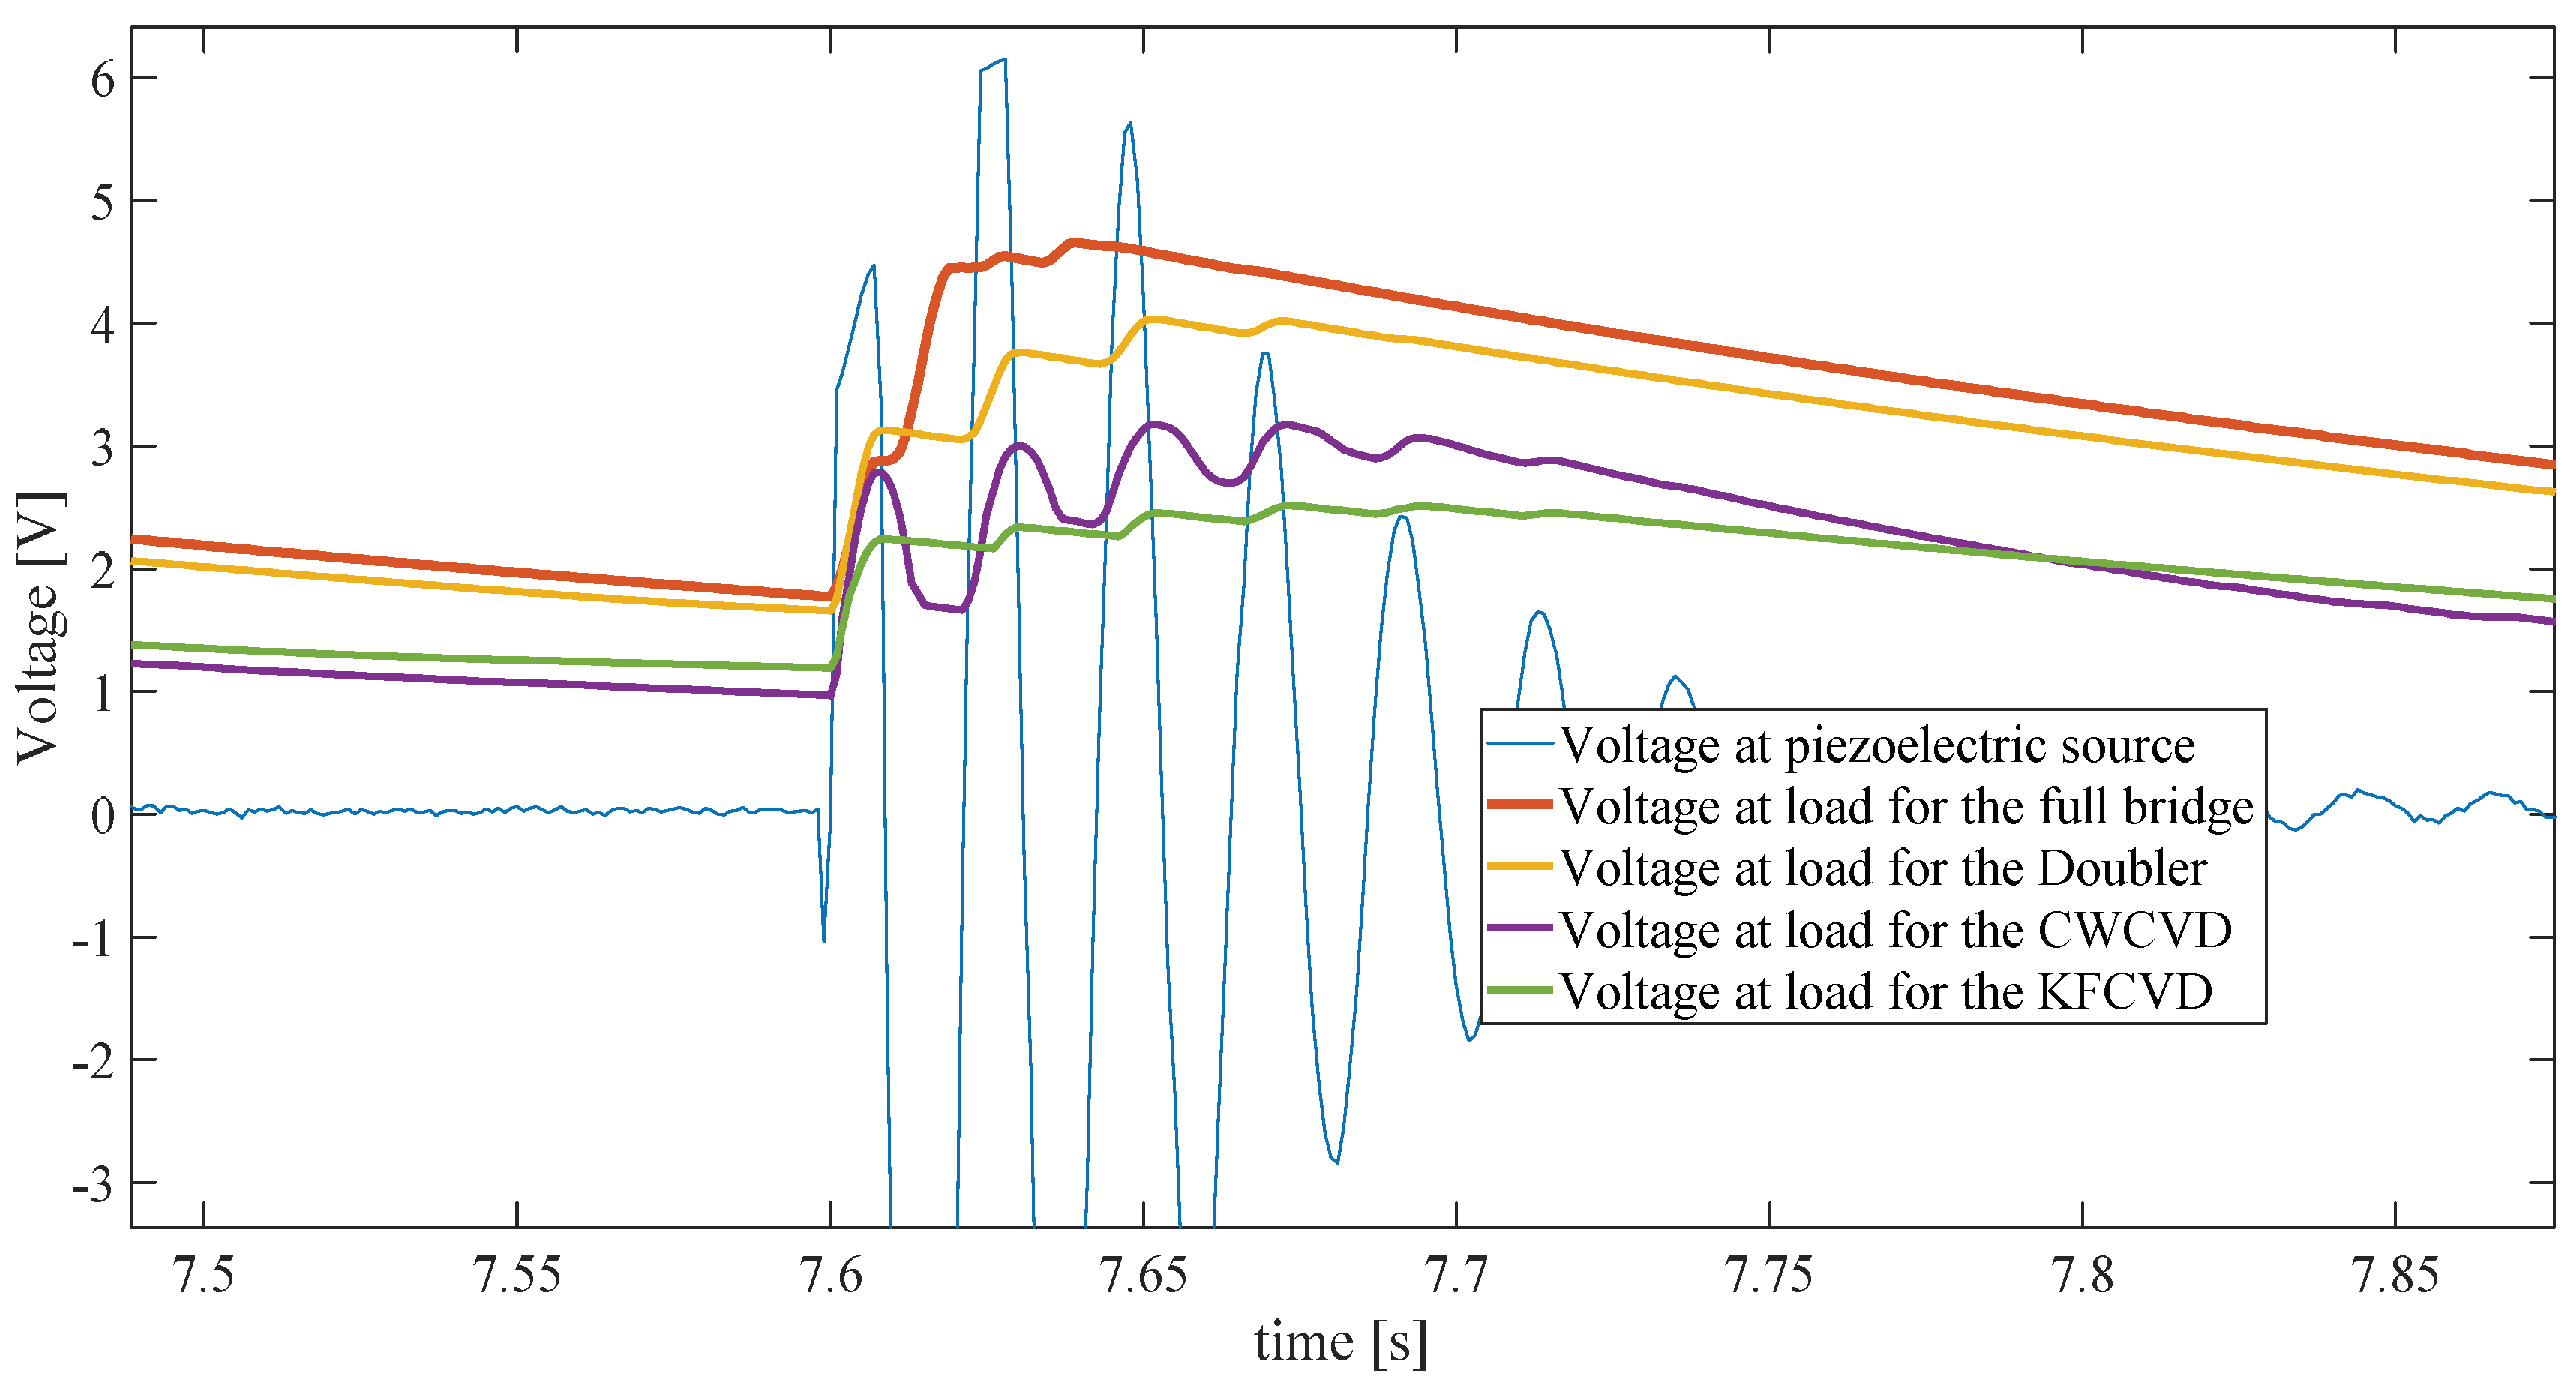
Different simulations were performed by varying the ratio between resistance of load and internal resistance of the piezoelectric harvester. This way was followed in order to consider different harvesters, in which the internal impedance is due to the dimensions of the piezoelectric film used. Figure 19 shows that for a reduction of the internal resistance, there is a better performance of the system, the voltage at load is near to the value of the source, and there is very little difference between the voltages of the full bridge and the Greinacher doubler.
Figure 20 shows the performance for an increase of internal resistance at 100 kΩ. Performances get worse, and the full bridge is again the best choice.
The simulations leave a degree of uncertainty in this comparison, essentially due to the internal impedance of the piezoelectric. Surely, this internal impedance, which is not negligible, is responsible for a bottleneck, which does not allow advanced circuits to easily load their capacitors, thus denying the doubling circuits the possibility of raising the tension according to the implemented stages.
The next section is dedicated to the experimental comparison between the two circuits that have distinguished themselves in these performances.
6. Experimental Comparison between Full Bridge and Greinacher Voltage Doubler
The objective of this experiment was to compare the trends of the two rectifier circuits without making preliminary assumptions on internal or loaded impedances.
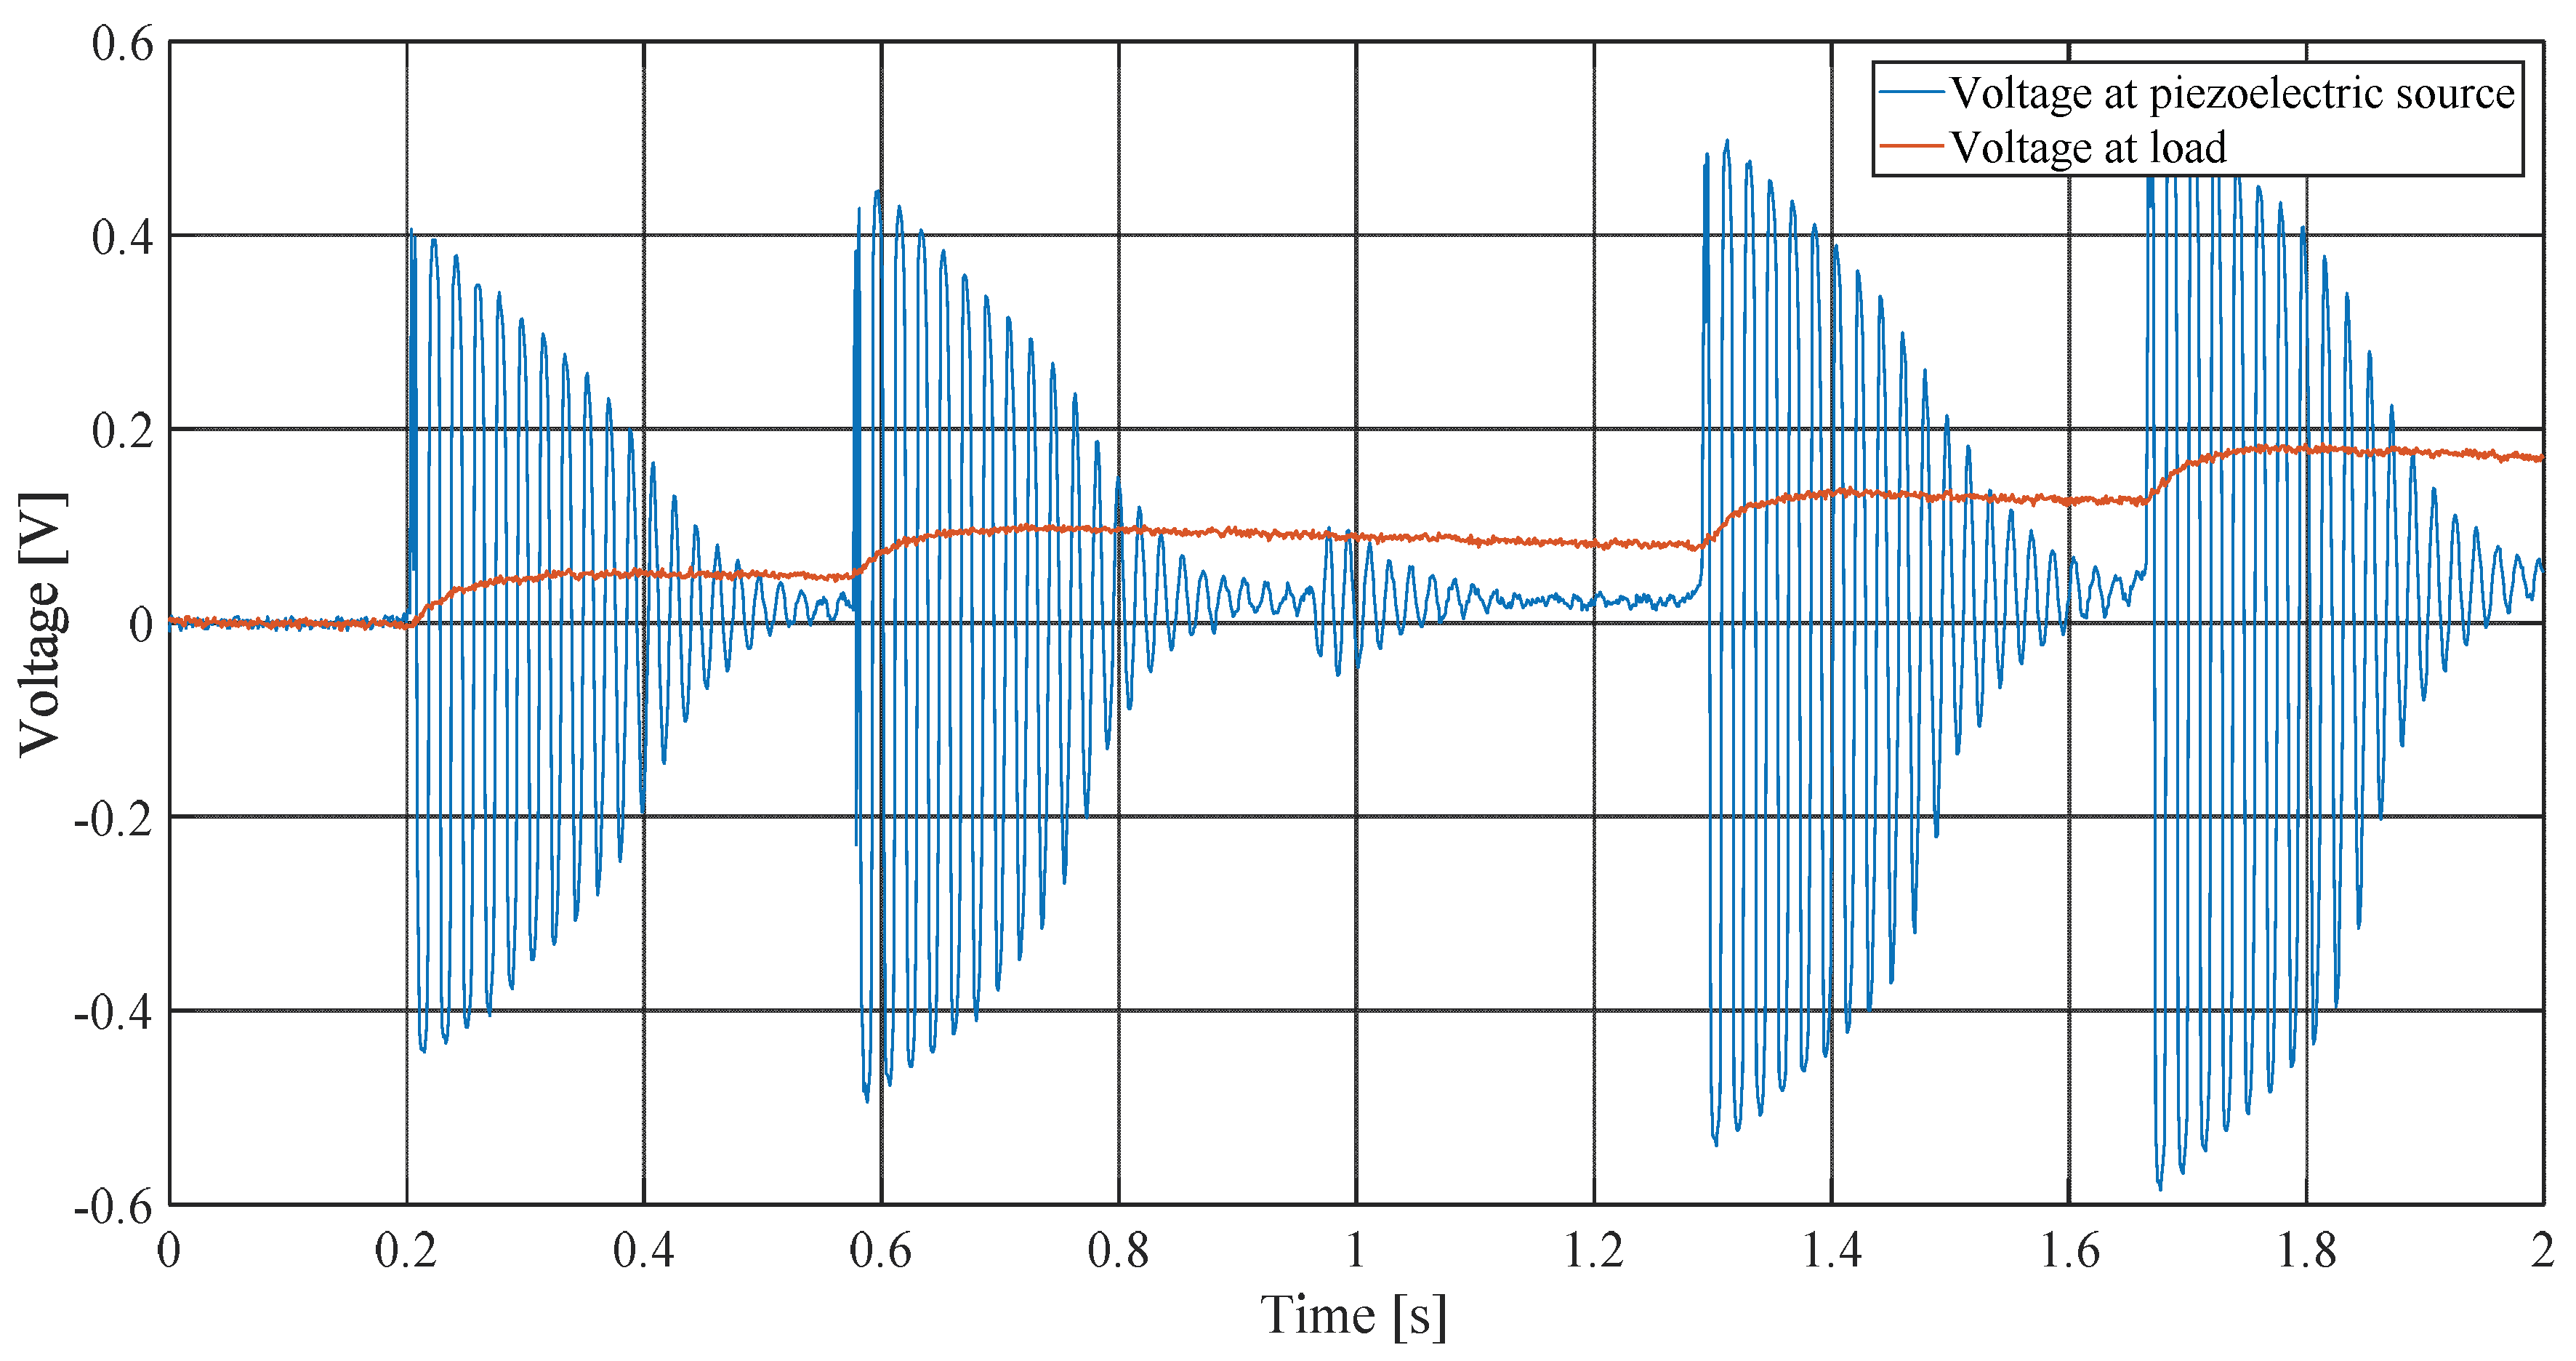
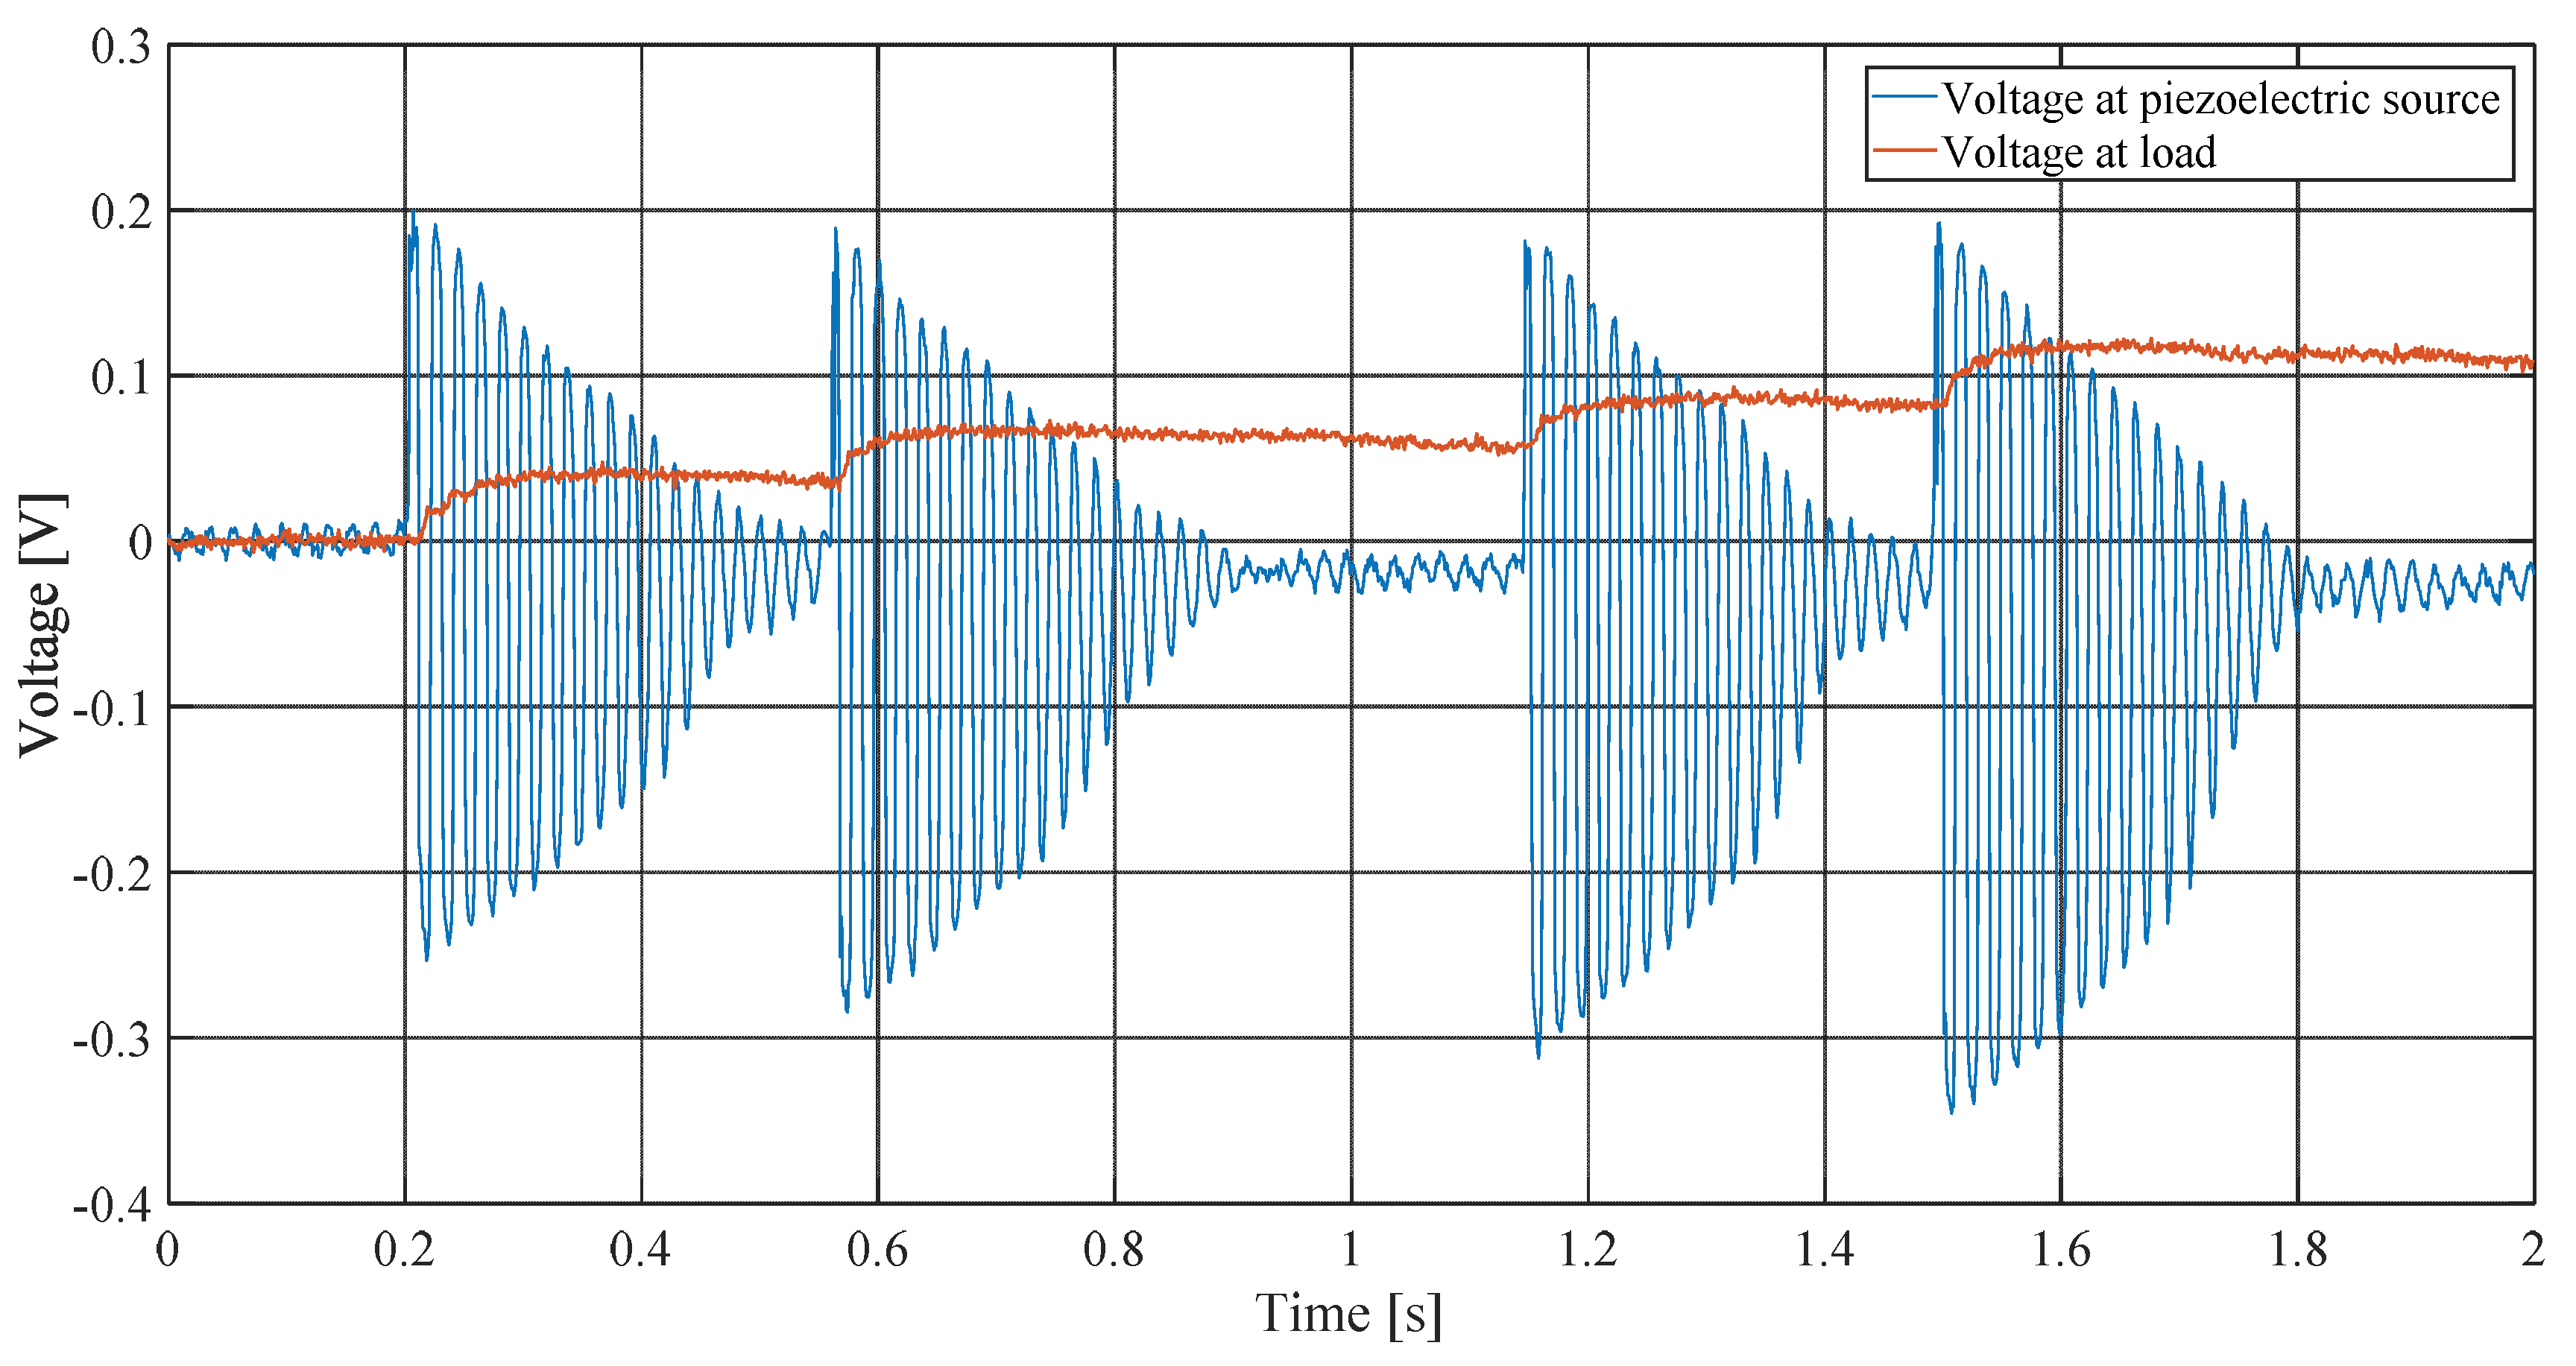
Figure 21 and Figure 22 show the experimental behavior of the full bridge and the Greinacher voltage doubler. Different drops were considered from a height of 0.5 m.
By comparing the voltages on the capacitors, the first clear result is that the full bridges system takes a shorter time to charge the capacitor. A second result is that even the output voltage at the piezoelectric is higher in the case of the full bridge; this is due to the fact that during the positive wave in the Greinacher circuit, there is a series between two identical capacitors, so the impedance is cut in half.
It is also noted that there is no symmetry for the voltages in the Greinacher circuit, since the negative waves have higher peaks, due to the lower-impedance path taken.
The real case also shows that the internal impedance of the piezoelectric absorbs most of the tension.
7. Conclusions
This work has presented the experimental comparison between different harvesting structures, subjected to stresses due to raindrops: the cantilever, the bridge and the floating circle.
Harvesters were subjected to the same artificial rain conditions, using different raindrop heights: 0.5, 1 and 2 m. The intent was not to see the energy collected, but how they behave under the exact same stress conditions.
The collected waveforms were significantly different. The ideal waveform to be used in rectifying circuits is a slightly damped sine wave, which was only approached by the cantilever structure. The cantilever harvester proved itself to be the most suitable harvesting structure, due to which it was the only structure considered in the simulations of electronic circuits.
Based on this information, the comparison was made between different rectifying circuits: full-bridge, Greinacher doubler, the Cockcroft Walton Cascade Voltage doubler and the Karthaus Fisher Cascade Voltage doubler. The best performance for the rectifying circuit was achieved by the full bridge system, followed by the Greinacher doubler. The employment of several stages of energy storage is contrasted by the harvester’s difficulty in extracting energy, such that each capacity can be seen as a bottleneck, rather than a resource.
It was necessary to experimentally compare the two circuits that exhibited the best characteristics. The combination of internal impedance of the piezoelectric generator and impedances of the rectifying circuits highlighted that the full bridge had the best behavior.
Acknowledgments
This work was financially supported by MIUR—Ministero dell’Istruzione dell’Università e della Ricerca (Italian Ministry of Education, University and Research) and by LEAP (Laboratory of Electrical Applications) of the University of Palermo.
Conflicts of Interest
The author declares no conflicts of interest.
References
- Erturk, A.; Inman, D.J. Piezoelectric Energy Harvesting; John Wiley & Sons: Hoboken, NJ, USA, 2011. [Google Scholar]
- Choi, S.B.; Han, Y.M. Piezoelectric Actuators; CRC Press: Boca Raton, FL, USA; Taylor Francis Group: Oxfordshire, UK, 2010. [Google Scholar]
- Abdelaal, W.G.A. Power Enhancement for Piezoelectric Energy Harvesting Systems; Lambert Academic Publishing: Saarbrücken, Germany, 2013. [Google Scholar]
- Van den Ende, D.A.; van de Wiel, H.J.; Groen, W.A.; van der Zwaag, S. Direct strain energy harvesting in automobile tires using piezoelectric PZT–polymer composites. Smart Mater. Struct. 2012, 21, 015011. [Google Scholar] [CrossRef]
- Vatansever, D.; Hadimani, R.L.; Shah, T.; Siores, E. An investigation of energy harvesting from renewable sources with PVDF and PZT. Smart Mater. Struct. 2011, 20, 055019. [Google Scholar] [CrossRef]
- Hobeck, J.D.; Inman, D.J. Artificial piezoelectric grass for energy harvesting from turbulence-induced vibration. Smart Mater. Struct. 2012, 21, 105024. [Google Scholar] [CrossRef]
- Jager, T.; Guigon, R.; Chaillout, J.J.; Despesse, G. Harvesting raindrop energy: Theory. Smart Mater. Struct. 2008, 17, 015038. [Google Scholar]
- Jager, T.; Guigon, R.; Chaillout, J.J.; Despesse, G. Harvesting raindrop energy: Experimental study. Smart Mater. Struct. 2008, 17, 015039. [Google Scholar]
- Viola, F.; Romano, P.; Miceli, R.; Acciari, G. Harvesting rainfall energy by means of piezoelectric transducer. In Proceedings of the International Conference on Clean Electrical Power Renewable Energy Resources Impact 2013, Alghero, Italy, 11–13 June 2013. [Google Scholar]
- Viola, F.; Romano, P.; Miceli, R.; Spataro, C. Performances of rainfall energy harvester. In Proceedings of the 20th IMECO TC4, 2014 Symposium on Measurements of Electrical Quantities: Research on Electrical and Electronic Measurement for the Economic Upturn, Benevento, Italy, 15–17 September 2014. [Google Scholar]
- Viola, F.; Romano, P.; Miceli, R. Rainfall energy harvester. Innov. Mater. Syst. Energy Harvest. Appl. 2015, 116–142. [Google Scholar] [CrossRef]
- Viola, F.; Romano, P.; Miceli, R.; Acciari, G.; Spataro, C. Piezoelectric model of rainfall energy harvester. In Proceedings of the 2014 9th International Conference on Ecological Vehicles and Renewable Energies (EVER), Monte-Carlo, Monaco, 25–27 March 2014. [Google Scholar]
- Acciari, G.; Caruso, M.; Miceli, R.; Riggi, L.; Romano, P.; Schettino, G.; Viola, F. Measuring Piezoelectric Rainfall Energy Harvester Performance by an Advanced Arduino-Based Measuring System. IEEE Trans. Ind. Appl. 2018, 54, 458–468. [Google Scholar] [CrossRef]
- Helseth, L.E.; Wen, H.Z. Evaluation of the Energy Generation Potential of Rain Cells. Department of Physics and Technology, University of Bergen: Bergen, Norway.
- Lin, Z.H.; Cheng, G.; Lee, S.; Pradel, K.C.; Wang, Z.L. Harvesting water drop energy by sequential contact electrification and electrostatic induction process. Adv. Mater. 2014, 26, 4690–4696. [Google Scholar] [CrossRef] [PubMed]
- Chua, K.G.; Hor, Y.F.; Lim, H.C. Raindrop Kinetic Energy Piezoelectric Harvesters and Relevant Interface Circuits: Review, Issues and Outlooks. Sens. Transducers 2016, 200, 1–15. [Google Scholar]
- Wong, C.-H.; Dahari, Z.; Manaf, A.A.; Miskam, M.A. Harvesting Raindrop Energy with Piezoelectrics: A Review. J. Electron. Mater. 2015, 44, 13–21. [Google Scholar] [CrossRef]
- Ong, Z.Z.; Wong, V.-K.; Ho, J.-H. Performance enhancement of a piezoelectric rain energy harvester. Sens. Actuators A Phys. 2016, 252, 154–164. [Google Scholar] [CrossRef]
- Wong, V.-K.; Ho, J.-H.; Chai, A.-B. Performance of a piezoelectric energy harvester in actual rain. Energy 2017, 124, 364–371. [Google Scholar] [CrossRef]
- Abidin, N.A.; Nayan, N.M.; Azizan, M.M.; Ali, A. Analysis of voltage multiplier circuit simulation for rain energy harvesting using circular piezoelectric. Mech. Syst. Signal Process. 2018, 101, 211–218. [Google Scholar] [CrossRef]
- Lin, H.C.; Wu, P.H.; Lien, I.C.; Shu, Y.C. Analysis of an array of piezoelectric energy harvesters connected in series. Smart Mater. Struct. 2013, 22, 094026. [Google Scholar] [CrossRef]
- Ilyas, M.A.; Swingler, J. Piezoelectric energy harvesting from raindrop impacts. J. Energy 2015, 90, 96–806. [Google Scholar] [CrossRef]
- Ilyas, M.A.; Swingler, J. Towards a prototype module for piezoelectric energy harvesting from raindrop impacts. Energy 2017, 125, 716–725. [Google Scholar] [CrossRef]
- Al Ahmad, M. Piezoelectric Water Drop Energy Harvesting. J. Electron. Mater. 2014, 43, 452–458. [Google Scholar] [CrossRef]
- Wong, V.K.; Ho, J.H.; Yap, E.H. Experimental Study of a Piezoelectric Rain Energy Harvester. Adv. Mater. Res. 2014, 1043, 263–267. [Google Scholar] [CrossRef]
- Datasheet of MEAS LDT1-028K. Available online: http://www.meas-spec.com (accessed on 30 November 2017).
- Roundy, S.; Wright, P.K. A piezoelectric vibration based generator for wireless electronics. Smart Mater. Struct. 2004, 13, 1131–1142. [Google Scholar] [CrossRef]
- Inman, D.J. Engineering Vibration; Pearson Education, Inc.: Upper Saddle, NJ, USA, 2008; pp. 43–48. [Google Scholar]
Figure 1.
Piezoelectric cantilever: one edge is bound (orange one), the second is floating.

Figure 2.
Piezoelectric bridge cantilevers: two edges are bound.

Figure 3.
Larger piezoelectric harvesting systems with a floating circle.

Figure 4.
Piezoelectric structures: a 2.9 cm long cantilever. Red wire is connected to the oscilloscope and black to mass. The structure can be inserted into a 2 m long pole, thus testing the energy impact from 0.5–2 m in height.
Figure 4.
Piezoelectric structures: a 2.9 cm long cantilever. Red wire is connected to the oscilloscope and black to mass. The structure can be inserted into a 2 m long pole, thus testing the energy impact from 0.5–2 m in height.

Figure 5.
Piezoelectric structures: two bridges 6 cm and 15 cm long.

Figure 6.
Piezoelectric structures: a floating circle, held up by 4 × 2.5-cm-long piezoelectric structures.
Figure 6.
Piezoelectric structures: a floating circle, held up by 4 × 2.5-cm-long piezoelectric structures.

Figure 7.
Voltage obtained at the ends of the structures due to a raindrop falling from 0.5 m and hitting the free edge.
Figure 7.
Voltage obtained at the ends of the structures due to a raindrop falling from 0.5 m and hitting the free edge.

Figure 8.
Voltage obtained at the ends of the structures due to a raindrop falling from 2.0 m and hitting the free edge.
Figure 8.
Voltage obtained at the ends of the structures due to a raindrop falling from 2.0 m and hitting the free edge.

Figure 9.
Voltage obtained for the bridge structure. Two raindrops were considered falling from 0.5 m, hitting the central point of the bridge.
Figure 9.
Voltage obtained for the bridge structure. Two raindrops were considered falling from 0.5 m, hitting the central point of the bridge.

Figure 10.
Voltage obtained for the floating structure due to a raindrop falling from 0.5 m, hitting the central point of the floating circle.
Figure 10.
Voltage obtained for the floating structure due to a raindrop falling from 0.5 m, hitting the central point of the floating circle.

Figure 11.
Half bridge rectifying circuit. This is the most economical structure, able to use only the positive part of the waveform.
Figure 11.
Half bridge rectifying circuit. This is the most economical structure, able to use only the positive part of the waveform.

Figure 12.
Full bridge rectifying circuit. During its operation, two voltage drops on the diode have to be compensated.
Figure 12.
Full bridge rectifying circuit. During its operation, two voltage drops on the diode have to be compensated.

Figure 13.
Greinacher voltage doubler circuit. During the negative waveform of the input, C1 is charged, then during the positive one, C2 is fed by the series of input and voltage on C1.
Figure 13.
Greinacher voltage doubler circuit. During the negative waveform of the input, C1 is charged, then during the positive one, C2 is fed by the series of input and voltage on C1.

Figure 14.
Cockcroft Walton Cascade Voltage Doubler (CWCVD) circuit. The single stage proposed by the voltage Greinacher doubler is here reproduced in several stages, increasing the level of obtainable voltage.
Figure 14.
Cockcroft Walton Cascade Voltage Doubler (CWCVD) circuit. The single stage proposed by the voltage Greinacher doubler is here reproduced in several stages, increasing the level of obtainable voltage.

Figure 15.
Karthaus Fisher Cascade Voltage Doubler (KFCVD) circuit. Again, the single stage proposed by the Greinacher voltage doubler is reproduced here in several stages, increasing the level of obtainable voltage.
Figure 15.
Karthaus Fisher Cascade Voltage Doubler (KFCVD) circuit. Again, the single stage proposed by the Greinacher voltage doubler is reproduced here in several stages, increasing the level of obtainable voltage.

Figure 16.
Voltages on the load in different cases for a single raindrop hitting the piezoelectric harvester. Blue color indicates the performance without considering any rectifying circuit. Orange is the performance of the full bridge circuit; yellow is that of the Greinacher doubler, pink is that of the CWCVD and finally green is that of the KFCVD.

Figure 17.
Current on the load in different cases for a single raindrop hitting the piezoelectric harvester. Blue color indicates the performance of the diode load series circuit. Orange is the performance of the full bridge circuit; yellow is that of the Greinacher doubler, pink is that of the CWCVD and finally green is that of the KFCVD.

Figure 18.
Voltage increases with different raindrops.

Figure 19.
Voltage obtained for internal resistance of 1000 Ω for the eighth drop. Full bridge and Greinacher doubler circuit performances are similar.
Figure 19.
Voltage obtained for internal resistance of 1000 Ω for the eighth drop. Full bridge and Greinacher doubler circuit performances are similar.

Figure 20.
Voltage obtained for internal resistance of 100 kΩ for the eighth drop. Full bridge has the best performance.
Figure 20.
Voltage obtained for internal resistance of 100 kΩ for the eighth drop. Full bridge has the best performance.

Figure 21.
Transient voltage obtained for full bridge rectifying circuit.

Figure 22.
Transient voltage obtained for Greinacher rectifying circuit.

© 2018 by the author. Licensee MDPI, Basel, Switzerland. This article is an open access article distributed under the terms and conditions of the Creative Commons Attribution (CC BY) license (http://creativecommons.org/licenses/by/4.0/).
Share and Cite
MDPI and ACS Style
Viola, F. Comparison Among Different Rainfall Energy Harvesting Structures. Appl. Sci. 2018, 8, 955. https://doi.org/10.3390/app8060955
AMA Style
Viola F. Comparison Among Different Rainfall Energy Harvesting Structures. Applied Sciences. 2018; 8(6):955. https://doi.org/10.3390/app8060955
Chicago/Turabian StyleViola, Fabio. 2018. "Comparison Among Different Rainfall Energy Harvesting Structures" Applied Sciences 8, no. 6: 955. https://doi.org/10.3390/app8060955
Note that from the first issue of 2016, this journal uses article numbers instead of page numbers. See further details here.