Artificial Neural Networks as Metamodels for the Multiobjective Optimization of Biobutanol Production


Department of Chemical and Biological Engineering, University of Ottawa, 161 Louis Pasteur, Ottawa, ON K1N 6N5, Canada
*
Author to whom correspondence should be addressed.
Appl. Sci. 2018, 8(6), 961; https://doi.org/10.3390/app8060961
Submission received: 29 March 2018
/
Revised: 1 June 2018
/
Accepted: 1 June 2018
/
Published: 12 June 2018
(This article belongs to the Special Issue Applications of Artificial Neural Networks for Energy Systems)
Abstract
:Process optimization using a physical process or its comprehensive model often requires a significant amount of time. To remedy this problem, metamodels, or surrogate models, can be used. In this investigation, a methodology for optimizing the biobutanol production process via the integrated acetone–butanol–ethanol (ABE) fermentation–membrane pervaporation process is proposed. In this investigation, artificial neural networks (ANNs) were used as metamodels in an attempt to reduce the time needed to circumscribe the Pareto domain and identify the best optimal operating conditions. Two different metamodels were derived from a small set of operating conditions obtained from a uniform experimental design. The first series of metamodels were derived to entirely replace the phenomenological model of the butanol fermentation process by representing the relationship that exists between five operating conditions and four performance criteria. The second series of metamodels were derived to estimate the initial concentrations under steady-state conditions for the eight chemical species within the fermenter in order to expedite convergence of the process simulator. The first series of metamodels led to an accurate Pareto domain and reduced the computation time to circumscribe the Pareto domain by a factor of 2500. The second series of metamodels led to only a small reduction of computation time (a factor of approximately 2) because of the inherently slow convergence of the overall fermentation process.

1. Introduction
Because of globalization and environmental regulations, chemical process industries are constantly examining all aspects of their processes in an effort to improve their operations to ensure that they remain competitive. In particular, process optimization has been at the forefront of this undertaking. Optimizing process operations in chemical plants involves developing a sufficiently accurate phenomenological, or empirical, model to assist in finding the optimal operating points. In recent years, multiobjective optimization, instead of the minimization of an aggregate objective function used in traditional optimization, has increased in popularity. Indeed, traditional optimization techniques have resolved multiple objectives by combining them into a single objective comprising the weighted sum of the individual objectives, or by considering one objective while treating the others as constraints. Even though single objective optimization is sufficient in many situations, multiobjective optimization provides additional information on the underlying relationships between various objectives.
In multiobjective optimization, all objectives are initially considered equally important and the concept of domination serves to circumscribe the Pareto domain using a representative process model. Most often, some of the objective functions conflict such that one objective cannot be improved without deteriorating another. The Pareto domain, comprising nondominated solutions, is obtained without any bias with respect to all objectives and is commonly approximated with a large number of solutions. When the Pareto domain has been obtained, all nondominated solutions are ranked using some preferences expressed by an expert or decision-maker, and the optimal solution is identified. The optimal solution, which is obtained using process models, is then validated on the actual process.
Often the solution of the process or plant models used to circumscribe the Pareto domain is computationally expensive, such that determining a sufficiently large number of Pareto-optimal solutions may require an impractically long time. For example, optimization of an ethanol batch fermentation process integrated with a continuous vacuum separation unit performed by combining a Visual Basic for Applications (VBA) code with a Honeywell UniSim® Design R430 process flowsheet took a few days to obtain one Pareto domain [1]. One alternative is to use a metamodel, or a surrogate model, where complete or partial operation of the chemical process is modelled with a representative model, often empirical, for which the computational cost would be significantly reduced. One such model is an artificial neural network (ANN), which is a computational network that attempts to mimic the functionality of neurons within the biological central nervous system. In an ANN, adaptable nodes store experiential knowledge acquired via learning algorithms, allowing the network to recognize and predict patterns with no knowledge of the underlying governing equations. This allows ANNs to be used as black-box tools where no prior knowledge about the system is required, thereby achieving high accuracy in multifactorial and nonlinear analysis of complex processes such as fermentation. However, training a neural network requires a good number of representative solutions, which may counteract efforts to reduce the computation time. Strategies to develop effective neural network models for smaller sets of data using a combination of experimental design and stacked neural networks have been previously proposed [2,3]. In an effort to maximize process information given a small set of data, it is possible to use experimental design. Numerous optimization problems could benefit from such a strategy.
In this paper, metamodels are used in the multiobjective optimization of a continuous biobutanol production process where the fermentation system is integrated with a membrane pervaporation unit to selectively remove solvents from the fermentation broth to enhance the productivity and overall effluent concentration of butanol. This paper is divided as follows. The process to be optimized is first described. Next, the strategy used to develop the ANN metamodels to assist in the computationally effective determination of the Pareto domain is discussed. Finally, results are presented and discussed, prior to presenting the concluding remarks.
2. Description of the Integrated ABE Fermentation–Membrane Pervaporation Process
The process considered in this investigation is the biochemical production of butanol via acetone–butanol–ethanol (ABE) fermentation. ABE fermentation is a biphasic biological production involving acidogenesis and solventogenesis. Acidic metabolites accumulate during the former phase and are subsequently assimilated into industrial relevant solvents such as butanol. Butanol is an important chemical precursor and is currently being produced commercially via the hydroformylation of propylene. ABE fermentation can potentially be used for commercial production of butanol instead of the aforementioned petrochemical-based process. This interest in the development of bio-based processing alternatives is motivated by the enviable characteristic of biobutanol as a renewable liquid fuel.
The ABE fermentation process suffers from low butanol yield and productivity because of the co-production of acetone, ethanol, and organic acids. Moreover, the concentration of butanol in the final fermentation broth is limited to very low concentrations (typically <13 g/L) due to butanol toxicity to the producing bacteria [4]. Consequently, the recovery of ABE solvents is energy-intensive and costly. At such low concentrations, the energy requirement for product recovery is greater than the energy content of the product itself [5]. Significant experimental efforts have been made to optimize ABE fermentation for improved butanol yields. One such method is extractive fermentation, a continuous process in which fermentation and solvent separation are integrated, thereby partly alleviating product inhibition, reducing downtime associated with batch processing, and increasing overall butanol concentration.
Researchers have proposed various mathematical models describing cell growth and variations in the concentration of metabolites over time, by accounting for their rates of production and consumption in the biochemical reaction pathway to adequately represent the experimental observations [6,7]. These mathematical models of ABE fermentation provide cost- and time-effective simulations for fermentation design and optimization studies. Therefore, extractive fermentation can be adequately modelled, allowing researchers to further generate new testable hypotheses and proposals, which can significantly improve the overall process and identify optimal operating conditions.
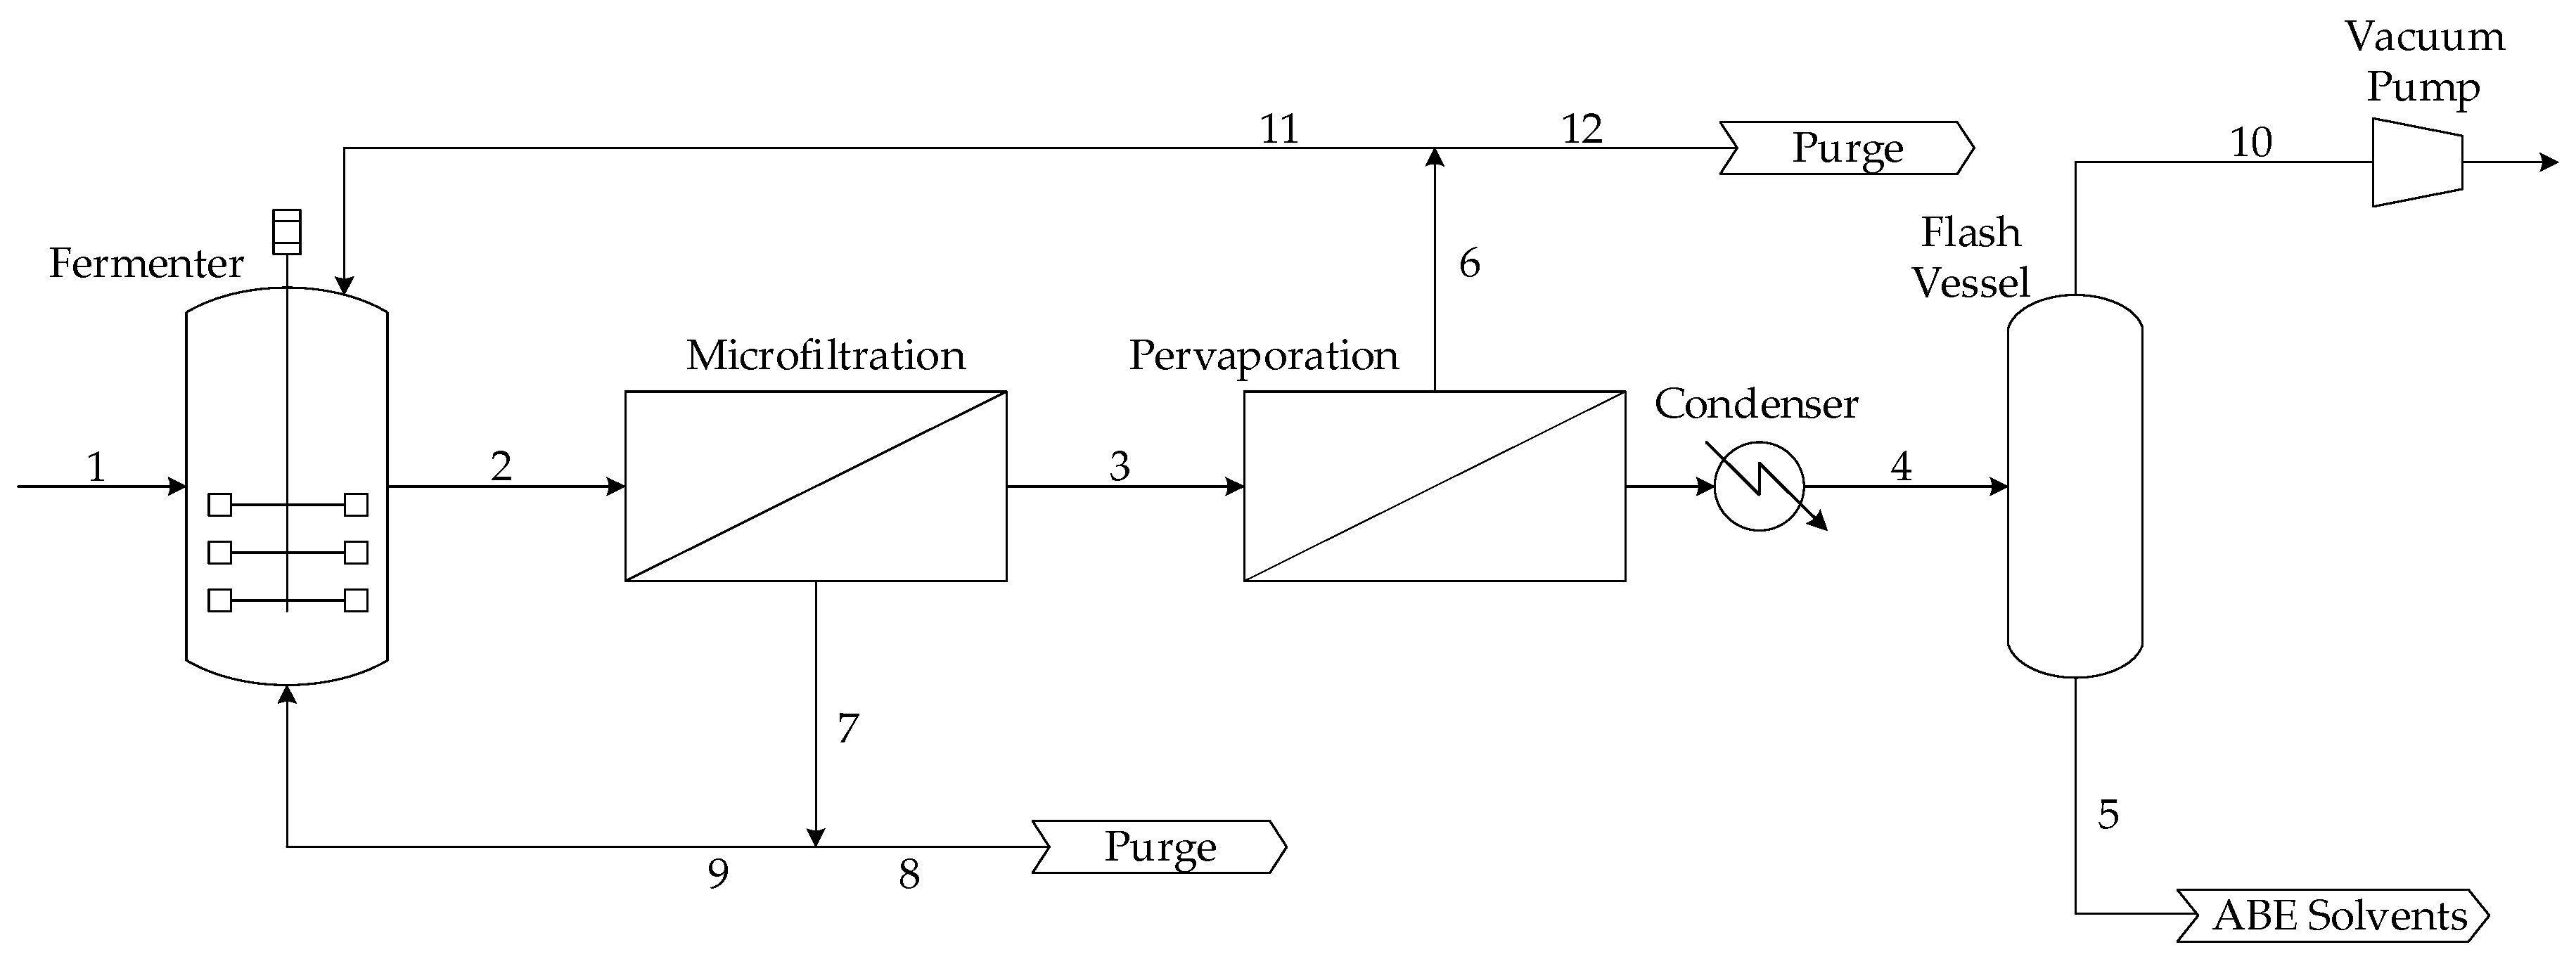
For the continuous integrated fermentation process, pervaporation is an attractive separation method that can be used to continuously recover butanol from the ABE fermentation broth [8]. Pervaporation is a membrane-based separation process of binary or multicomponent liquid mixtures, and, as its name implies, it involves permeation through a dense hydrophobic membrane and evaporation on the permeate side. The permeating vapor is then recovered by condensation. Polydimethylsiloxane (PDMS) membrane is regarded as a promising candidate for butanol separation, as it exhibits high and stable performance in butanol recovery from ABE solvents via pervaporation [9]. The continuous integrated fermentation-membrane pervaporation process that was optimized in this work is presented schematically in Figure 1. This process mainly consists of a continuous fermenter, a microfiltration unit, and a membrane pervaporation system. For a set of input operating conditions of the overall process, the dynamic mass balance of each individual component of the process is solved with time until a steady state is achieved. The main input variables of the process, i.e., the decision variables in the optimization problem, are the fermenter dilution rate, the inlet sugar concentration, the cell retention factor, and the membrane area of the pervaporation unit as dictated by the number of membrane modules and the number of membrane stacks per module. Mass balances for the main species of the fermentation broth, namely acetone, acetic acid, butanol, butyric acid, ethanol, microorganism, glucose, and water, were considered in this work. The detailed set of mass balances and process equations can be found in [10].
In this process, a solution of glucose is continuously fed to a 400 m3 fermenter with a constant flow rate and sugar concentration. Initial species concentrations in the fermenter are assumed. The set of kinetic reactions as described by Mulchandani and Volesky [11], accounting for the production of solvents (acetone, butanol, and ethanol), intermediate products (acetic acid and butyric acid), and microbial cells as well as the consumption of glucose in the fermentation broth was used. This model is still the most commonly used in the literature, because it accounts for the carbon substrate limitation in addition to the inhibition of butanol and butyric acid. Other models were recently proposed in the literature and were tested in this investigation. Shinto et al. [12] presented a kinetic model that considers numerous intermediates in the metabolic pathway as well as product and glucose inhibition. However, this model could not be used, as it leads to unrealistically high butanol concentration, far beyond the inhibitory concentration levels. The dynamic model of Buehler and Mesbah [13] initially seemed interesting, as it accounts for the pH of the fermentation broth, but some dynamic model constants are extremely high, therefore the system of ordinary differential equations cannot be solved with a practical step size in terms of time.
To achieve steady state for a set of input conditions, the overall mass balance is satisfied by removing the same quantity of material through Streams 5, 8, 10 and 12 as the one entering into the process in Stream 1. In a continuous operation, Stream 2 is sent to the microfiltration membrane unit to give the permeate cell-free Stream 3 and the retentate Stream 7 containing all the microbial cells of Stream 2. A large proportion of Stream 7 is returned to the fermenter through Stream 9. Stream 8 is purged and sent to the separation train. Purge Stream 8 is adjusted to maintain an optimal steady-state concentration of microbial cells in the fermenter and provides an exit for other metabolites [14]. Stream 3 flows through the membrane pervaporation unit, where a fraction permeates through the membrane and is subsequently cooled in the condenser to form Stream 4. The permeate side of the membrane is maintained under high vacuum. The rate of permeation depends on the membrane area and permeability as well as stream temperature and composition [10]. Stream 4 is separated to give Streams 5 and 10, assumed to be 99% and 1% of Stream 4, respectively. Stream 5, which has a much higher concentration of ABE solvents than Stream 3, is sent to the separation train. Retentate Stream 6 is split into Streams 11 and 12. Purge Stream 12, used to maintain steady-state operation along with other exiting streams, is sent to the separation train, whereas Stream 11, depleted of ABE solvents, is recycled back to the fermenter.
3. Methodology
3.1. Multiobjective Process Optimization
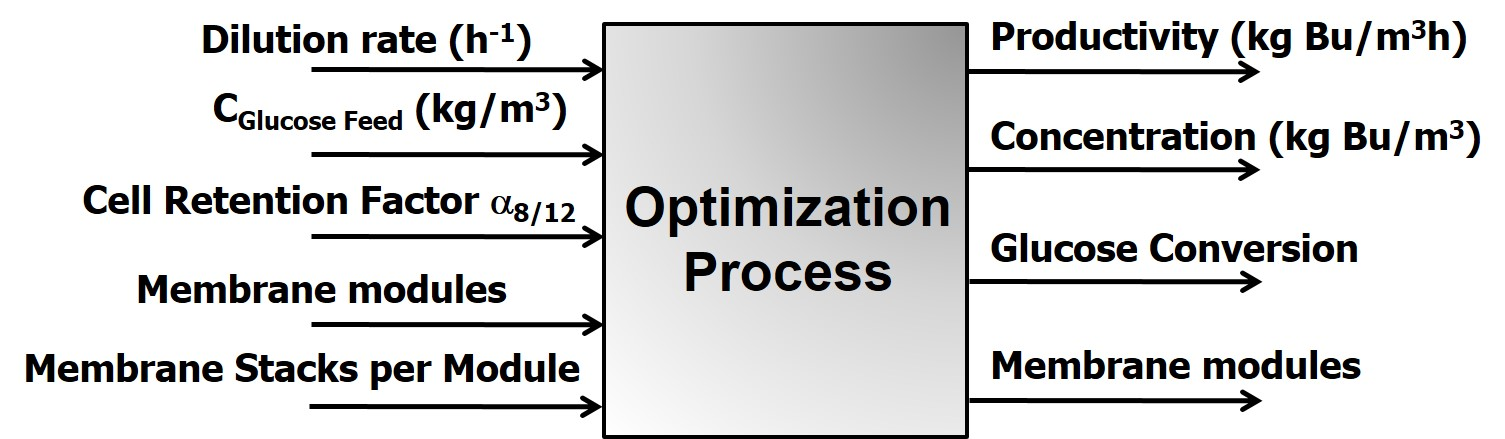
The model of the integrated biobutanol production process in Figure 1 was developed and coded in Fortran programming language. Optimizing this process boils down to determining the set of input variables that will lead to the optimal set of objective criteria. In this investigation, the input or decision variables consist of: (1) the dilution rate, defined as the volumetric input flow rate divided by the volume of the fermenter; (2) the feed glucose concentration; (3) the cell retention factor, defined as the ratio of the flow rate of Stream 8 to the flow rate of Stream 12 (Figure 1), which serves to maintain a steady microbial cell concentration in the fermentation broth; (4) the number of pervaporation modules in series, each module being preceded by a heat exchanger to increase the feed module stream to favor higher permeation flux; and (5) the number of stacked membranes in each membrane module where the stream entering the module is split equally to flow through each individual membrane unit within a stack. For the butanol production process, four objective functions were optimized simultaneously: (1) butanol productivity; (2) overall butanol concentration exiting the process, which represents the combined concentration of Streams 5, 8 and 12; (3) glucose conversion; and (4) number of membrane modules in series, i.e., the fourth decision variable. A summary of the decision variables and the objectives to be optimized is presented in Figure 2. The first three objective functions need to be maximized, whereas the fourth objective needs to be minimized. Many of these objectives conflict, and a judicious trade-off among them needs to be found.
To solve the optimization problem, i.e., circumscribing the Pareto domain associated with the five decision variables and the four objective functions for the butanol production process, the dual population evolutionary algorithm (DPEA) was used [15]. For the first generation, a set of random values of the five decision variables was obtained within their feasible ranges. A total of 5000 sets of decision variables formed the initial population. For each decision variable set, the steady-state solution of the butanol production process was determined, which allowed for calculation of the four objectives. Upon creation of the first generation, containing 5000 vectors of the objective functions associated with each set of decision variables, a pairwise comparison of the objectives of all solutions in the population was performed to determine the number of times a solution was dominated. A solution is dominated if another solution within the population is better for all four objectives. All nondominated solutions and a fraction of the least-dominated solutions were retained as parents for the next generation. For all subsequent generations, two parents from the previous generation were used to give rise to a new individual using the Blend crossover operator and the Gaussian mutation operator. These two operators are essential to obtain a well-circumscribed Pareto domain and allow the diversity of the population to be maintained. This procedure, performed at each generation to keep the population size constant, was repeated until the desired number of nondominated solutions in the population was achieved. In this investigation, the Pareto domain was assumed to have converged when the number of nondominated solutions reached 4900. A good approximation of the Pareto domain, containing only nondominated solutions, is thereby obtained.
The Pareto domain is determined without any biases or preferences by the decision-maker. To rank all solutions in the Pareto domain, the NetFlow method was used, where preferences of an expert, encapsulated in terms of four parameters for each objective, are used [16]. The four parameters for each objective necessary to rank the whole Pareto domain are the relative weight and three threshold parameters: the indifference threshold, the preference threshold, and the veto threshold.
The Pareto domain is usually approximated with a large number of solutions, which tends to be difficult to achieve because of the prohibitive computational cost of process simulation or model evaluation. Sometimes the solution might be an experiment that could take days to perform. This was the case of the optimization performed by Lin et al. [17], where a series of fermentation experiments were performed to determine the operating conditions to maximize both the concentration and the molecular weight of the biopolymer produced. Each experiment required 10 days on average. It is therefore advantageous to develop a methodology to significantly reduce the number of solutions that need to be obtained, and still derive a representative model that can be used with confidence in the optimization process. The application of ANNs as a metamodel (model of a model, or surrogate model) for nonlinear complex simulations has proved to be successful at reducing computation time, applicable to higher-dimensional problems, and simple to construct. An ANN can be regarded as a regression of input–output pairings that captures their interrelationship [18]. Well-distributed sampled input–output data in sufficient quantity is required in order to construct an accurate metamodel. This requirement is satisfied by defining an appropriate design of experiment.
3.2. Uniform Design of Experiment
Design of experiment (DOE) is the sampling plan within the design variable domain whereby experimental design levels are set for each of the contributing factors, and the objective is to obtain a limited number of simulations (due to computational expense) covering the entire design region. Factorial experimental design is commonly used to select experimental points within the design variables domain, thereby allowing for the determination of the relationship between the inputs of a process and its responses, which is encapsulated in regression models. When the relationship between the inputs and the responses of the process is nonlinear or the experimental domain is large, a two-level fractional design does not provide sufficient information to develop a representative model, because most of the information is obtained at the periphery of the experimental domain. To circumvent this limitation, uniform design (UD) can be used, where the design runs are uniformly and optimally scattered within the experimental domain using a small set of design points [19]. UD attempts to choose design points that cover the design region uniformly with limited experimental runs. A website published by Hong Kong Baptist University tabulates the design points for a uniform design, Un(qs), given the number of runs (n), factors (s), and levels (q) [20]. Each table provides the desired number of design points; each design point contains the number of factors (or decision variables) and their respective level, which can be used to determine the actual values of the decision variables using their allowable ranges. These design points (decision variables) are then used to generate the respective objective functions. In this investigation, uniform design U30(55) and U10(55) were used to generate the learning and validation datasets for the artificial neural network (ANN), respectively.
3.3. Artificial Neural Network Metamodels
In this investigation, the phenomenological dynamic model of the fermentation system depicted in Figure 1 was developed to compute the concentrations of the eight chemical species, acetone, acetic acid, butanol, butyric acid, ethanol, glucose, biomass, and water, as a function of time for each set of the five decision variables. When the concentrations in the fermenter do not change within a given tolerance, the system is assumed to have achieved steady state. Then the four objectives (butanol productivity, overall butanol concentration, sugar conversion, and number of membrane modules) are evaluated. To obtain a complete Pareto domain, this procedure needs to be repeated a large number of times. A methodology to achieve a well-defined Pareto domain was therefore developed.
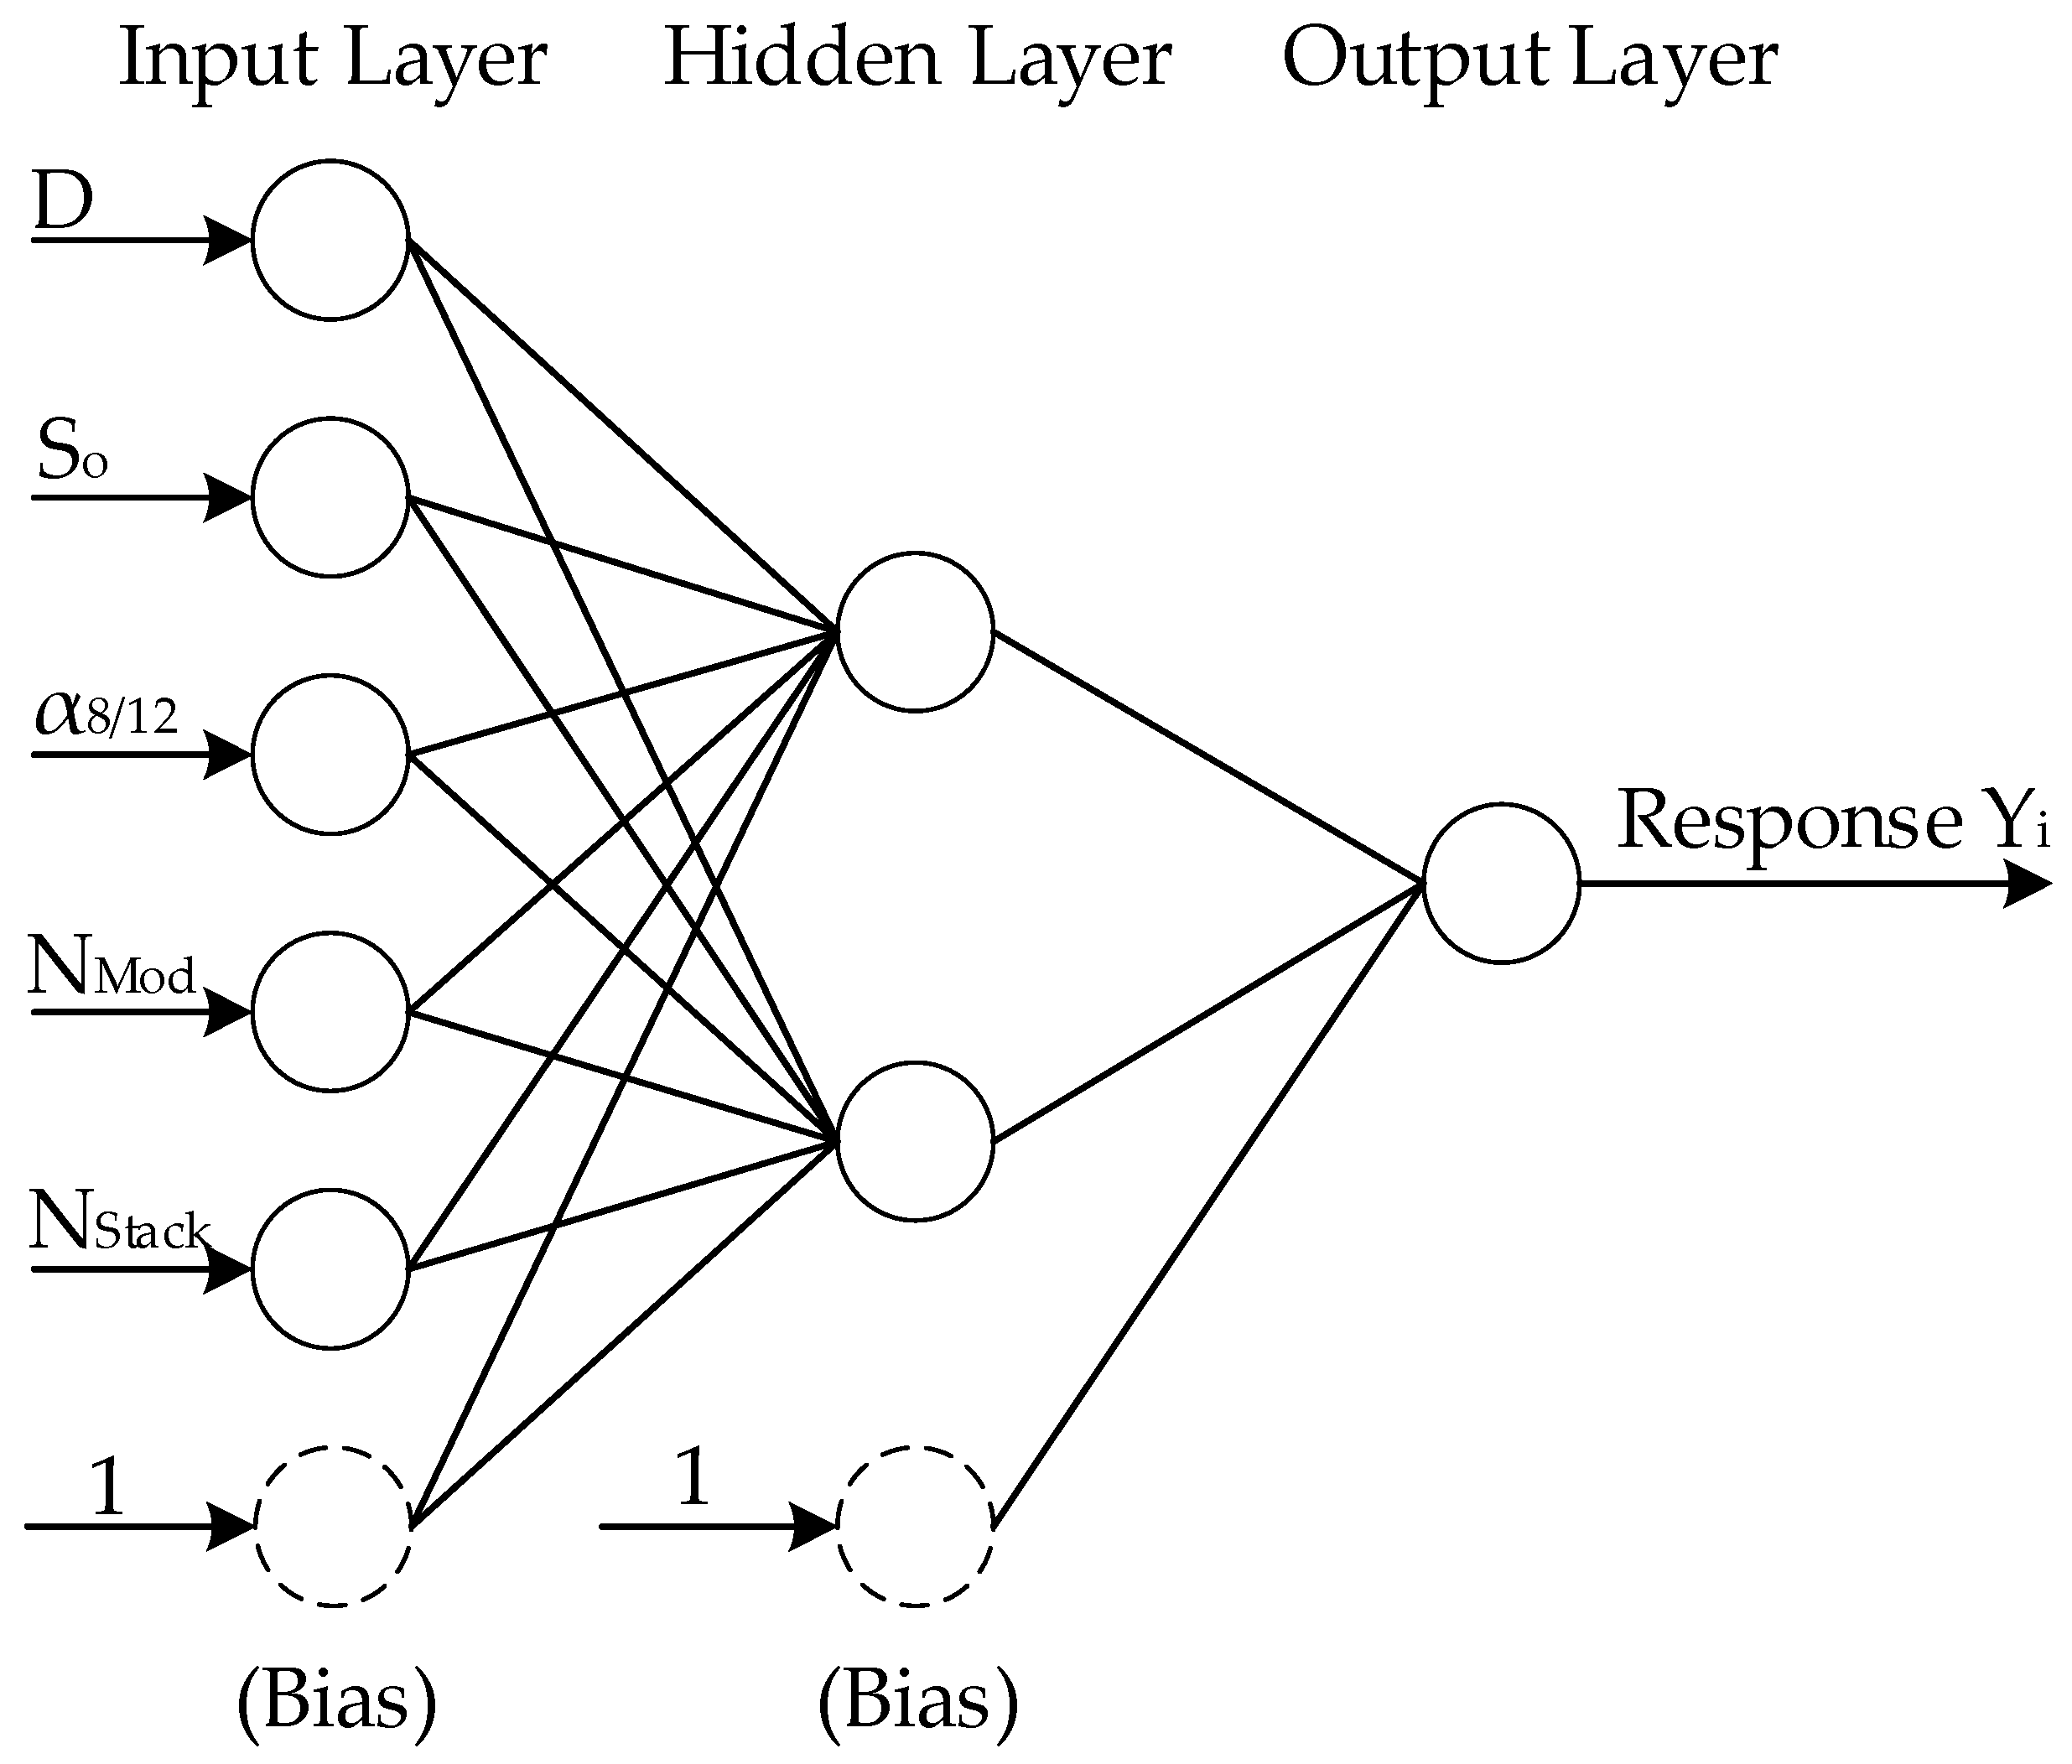
In order to develop the ANNs for the integrated fermentation–membrane pervaporation system, the available datasets from the UD experimental runs were divided into training and validation sets. The dataset consisted of 40 input–output pairs in which a U30(55) and U10(55) were assigned for training and validation of the neural networks, respectively. The architecture of the ANN with inputs and different responses is schematically depicted in Figure 3. The inputs to the ANNs are the five decision variables: dilution rate (D), inlet glucose concentration (So), cell retention factor (α8/12), number of pervaporation modules in series (Nmod), and number of stacked membranes in their respective membrane module (NStack). Two strategies were used in the derivation of ANNs. The first one was aimed at replacing the entire continuous integrated ABE fermentation process, whereby each of the four objective functions (butanol productivity, overall butanol concentration, sugar conversion, and number of membrane modules in series) is modelled. For this first strategy, four ANNs were derived and could be used independent of the actual integrated fermentation model. For a given set of decision variables, the four neural networks can be used in the multiobjective optimization algorithm to calculate the four objective functions. The Pareto domain can therefore be circumscribed using the ANN surrogate models. In the second strategy, it is desired to use the actual integrated ABE fermentation model to converge to steady-state operation but use ANNs to predict the initial concentrations of the main species within the fermentation broth (acetone, acetic acid, butanol, butyric acid, ethanol, glucose, bacteria, and water). The motivation of the latter strategy, with the derivation of eight ANNs, is to converge more rapidly to a steady state, resulting in reduced computation time.
For all 12 ANNs (four for the objectives and eight for the initial species concentrations) derived in this investigation, the architecture corresponded to an input layer of six neurons: the bias, one hidden layer of three neurons including the bias, and an output layer of one neuron, as shown in Figure 3. The activation function for the neurons of the hidden and output layers is a sigmoid function, and the input and output variables were scaled between 0 and 1. Given the reduced number of data points generated by the experimental uniform design and available for training the neural network, it was decided to limit the number of neurons in the hidden layer to three. Moreover, the sum of squares of the prediction errors based on the validation data set was evaluated at each iteration, and the set of weights corresponding to the minimum sum of squares of the errors was the one used for the predictions.
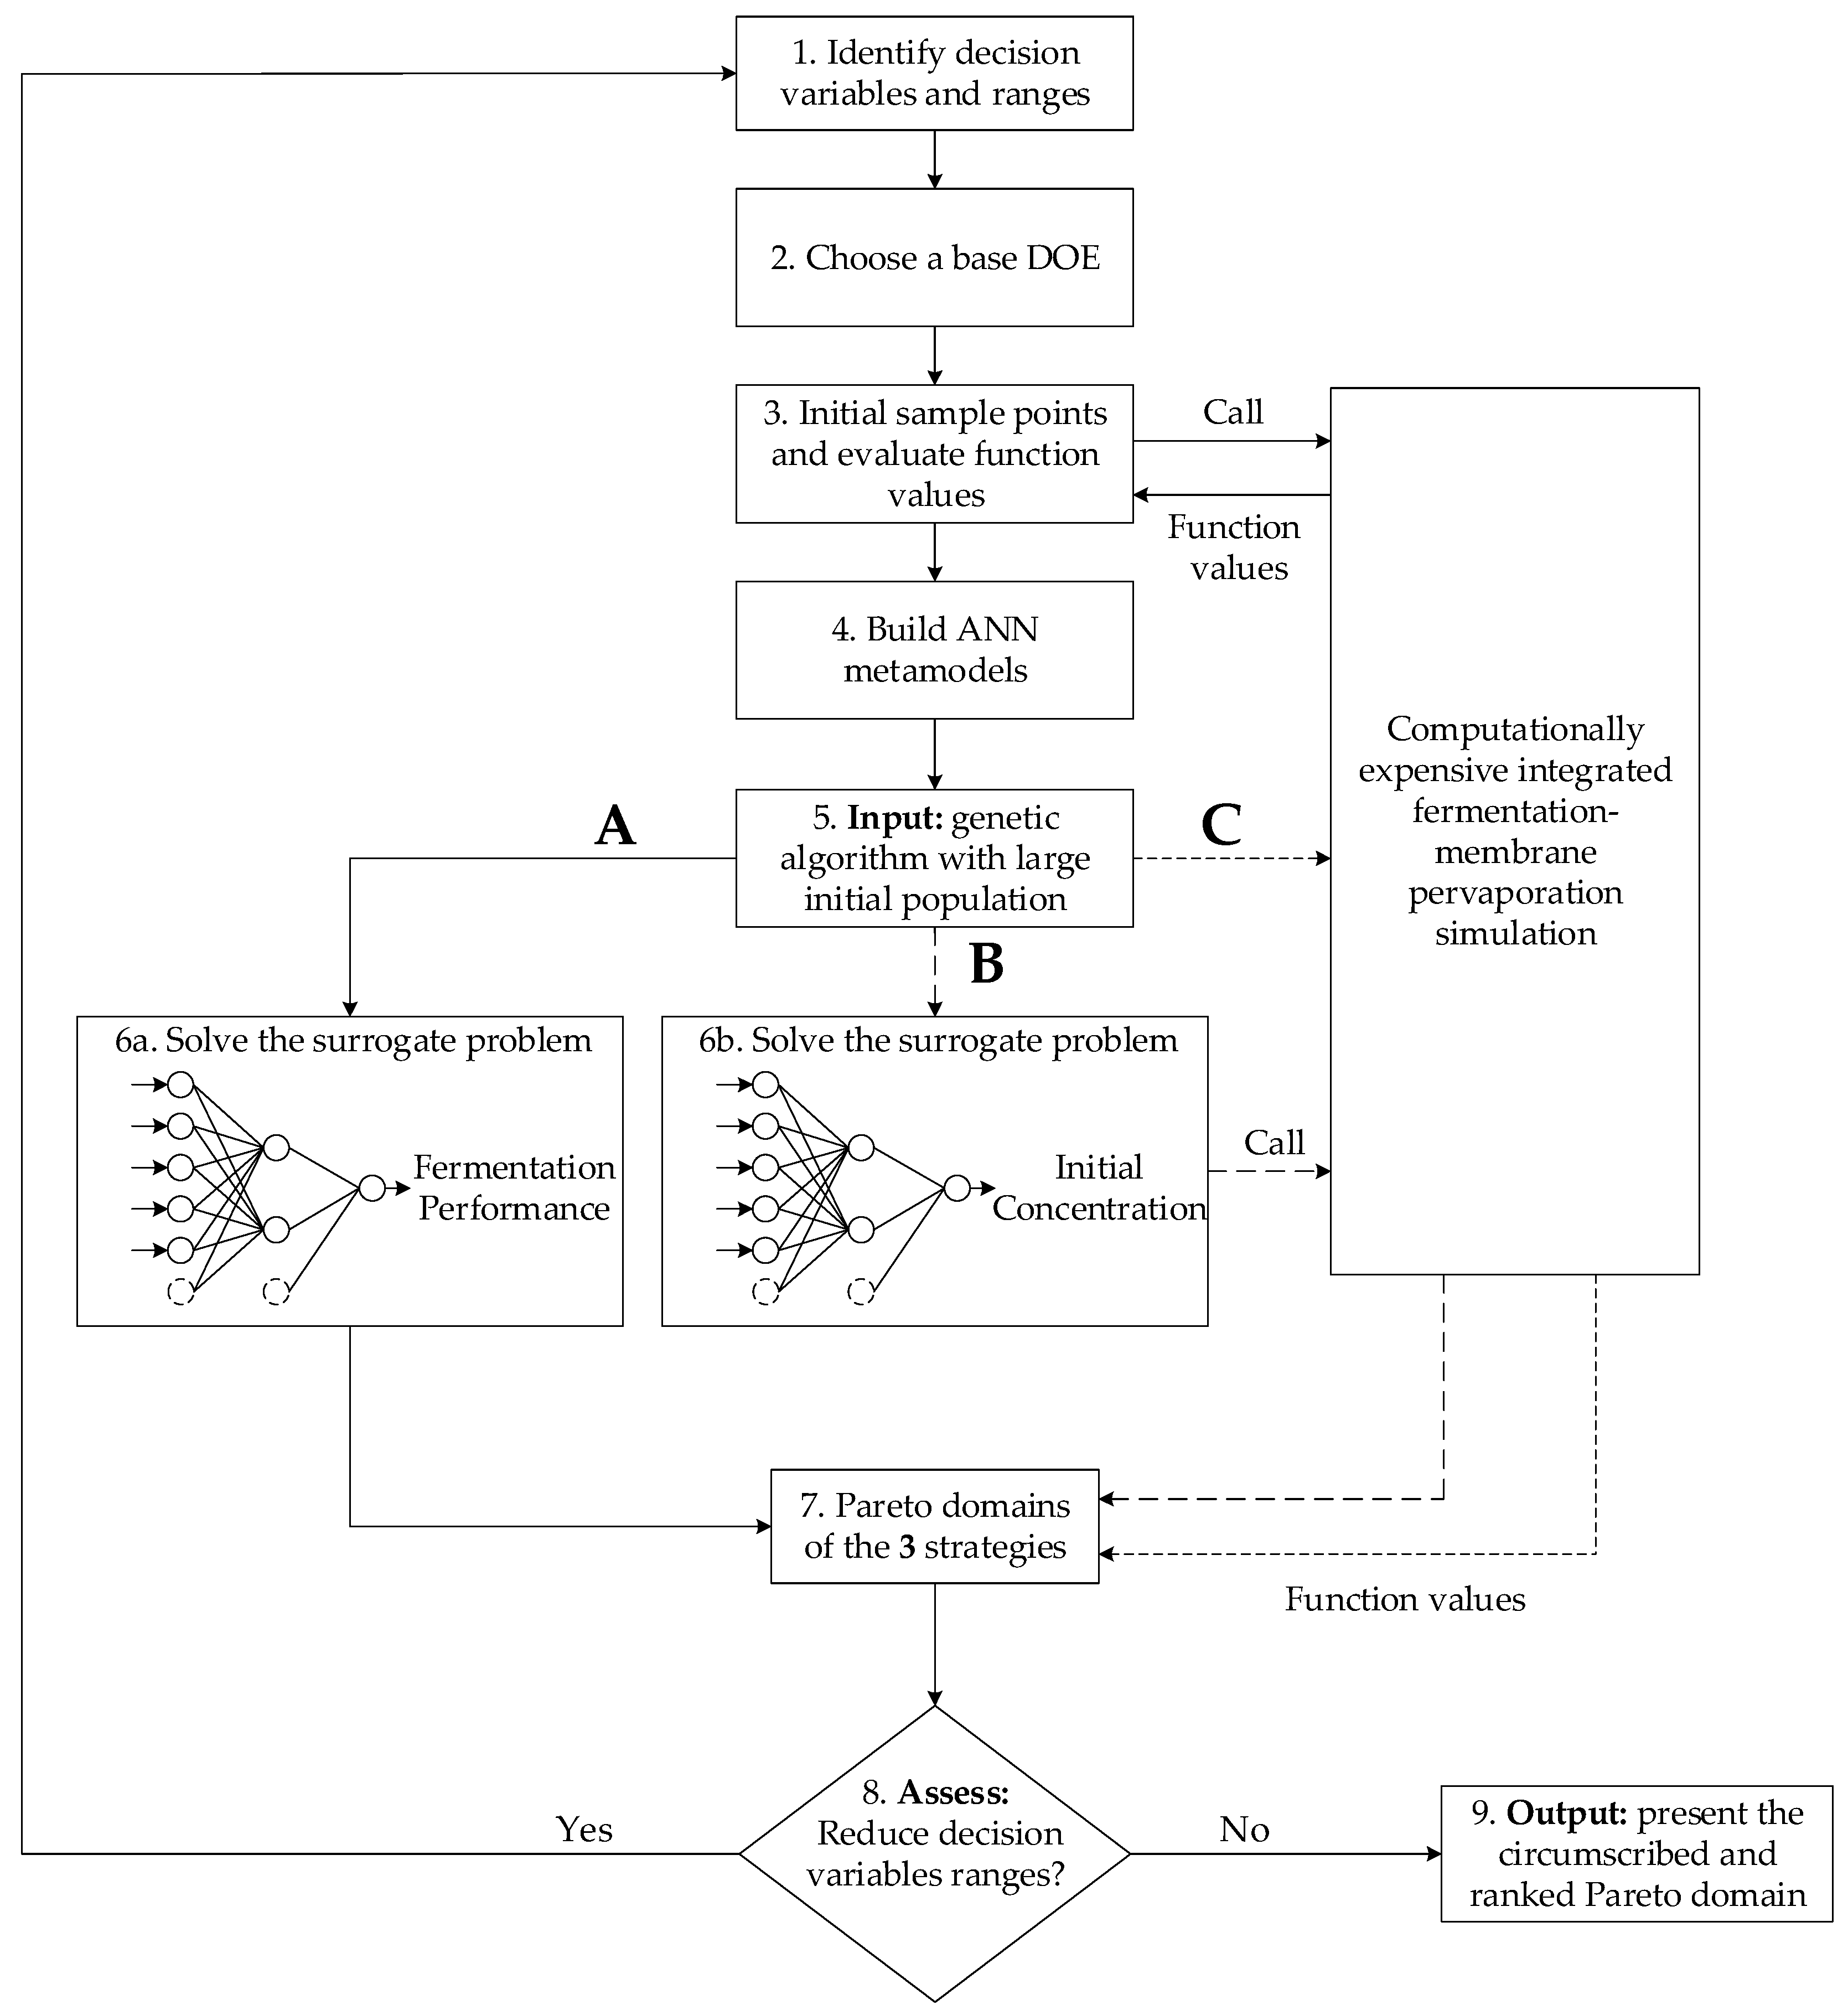
The Pareto domain can now be obtained using three different routes. First, the genetic algorithm can be used along with the four ANNs of the four objective functions. Second, the genetic algorithm can use the original integrated ABE fermentation model with the eight ANNs predicting the initial species concentrations within the fermentation broth, and finally, with the original integrated ABE fermentation model with arbitrary initial species concentrations. Figure 4 depicts these three strategies, referred to as A, B and C, respectively. Steps 1–4 in Figure 4 describe the method for the derivation of the ANNs, discussed previously. In steps 5–7, the genetic algorithm branches to strategy A, B, or C to circumscribe the Pareto domain of the integrated ABE fermentation process, consisting in this investigation of 5000 solutions. The performance of the two ANN metamodels is assessed (Step 8) based on the obtained Pareto domains. To be as inclusive as possible, the initial ranges of the five decision variables may have been chosen using a larger range than the ones corresponding to the obtained Pareto domain. To get a more accurate Pareto domain, it is then possible to perform an additional iteration of the optimization process using metamodels obtained with reduced ranges of the decision variables. When a converged Pareto domain is obtained, the optimal solution is determined using the NetFlow method and then validated using the actual model of the process (step 9).
4. Results and Discussion
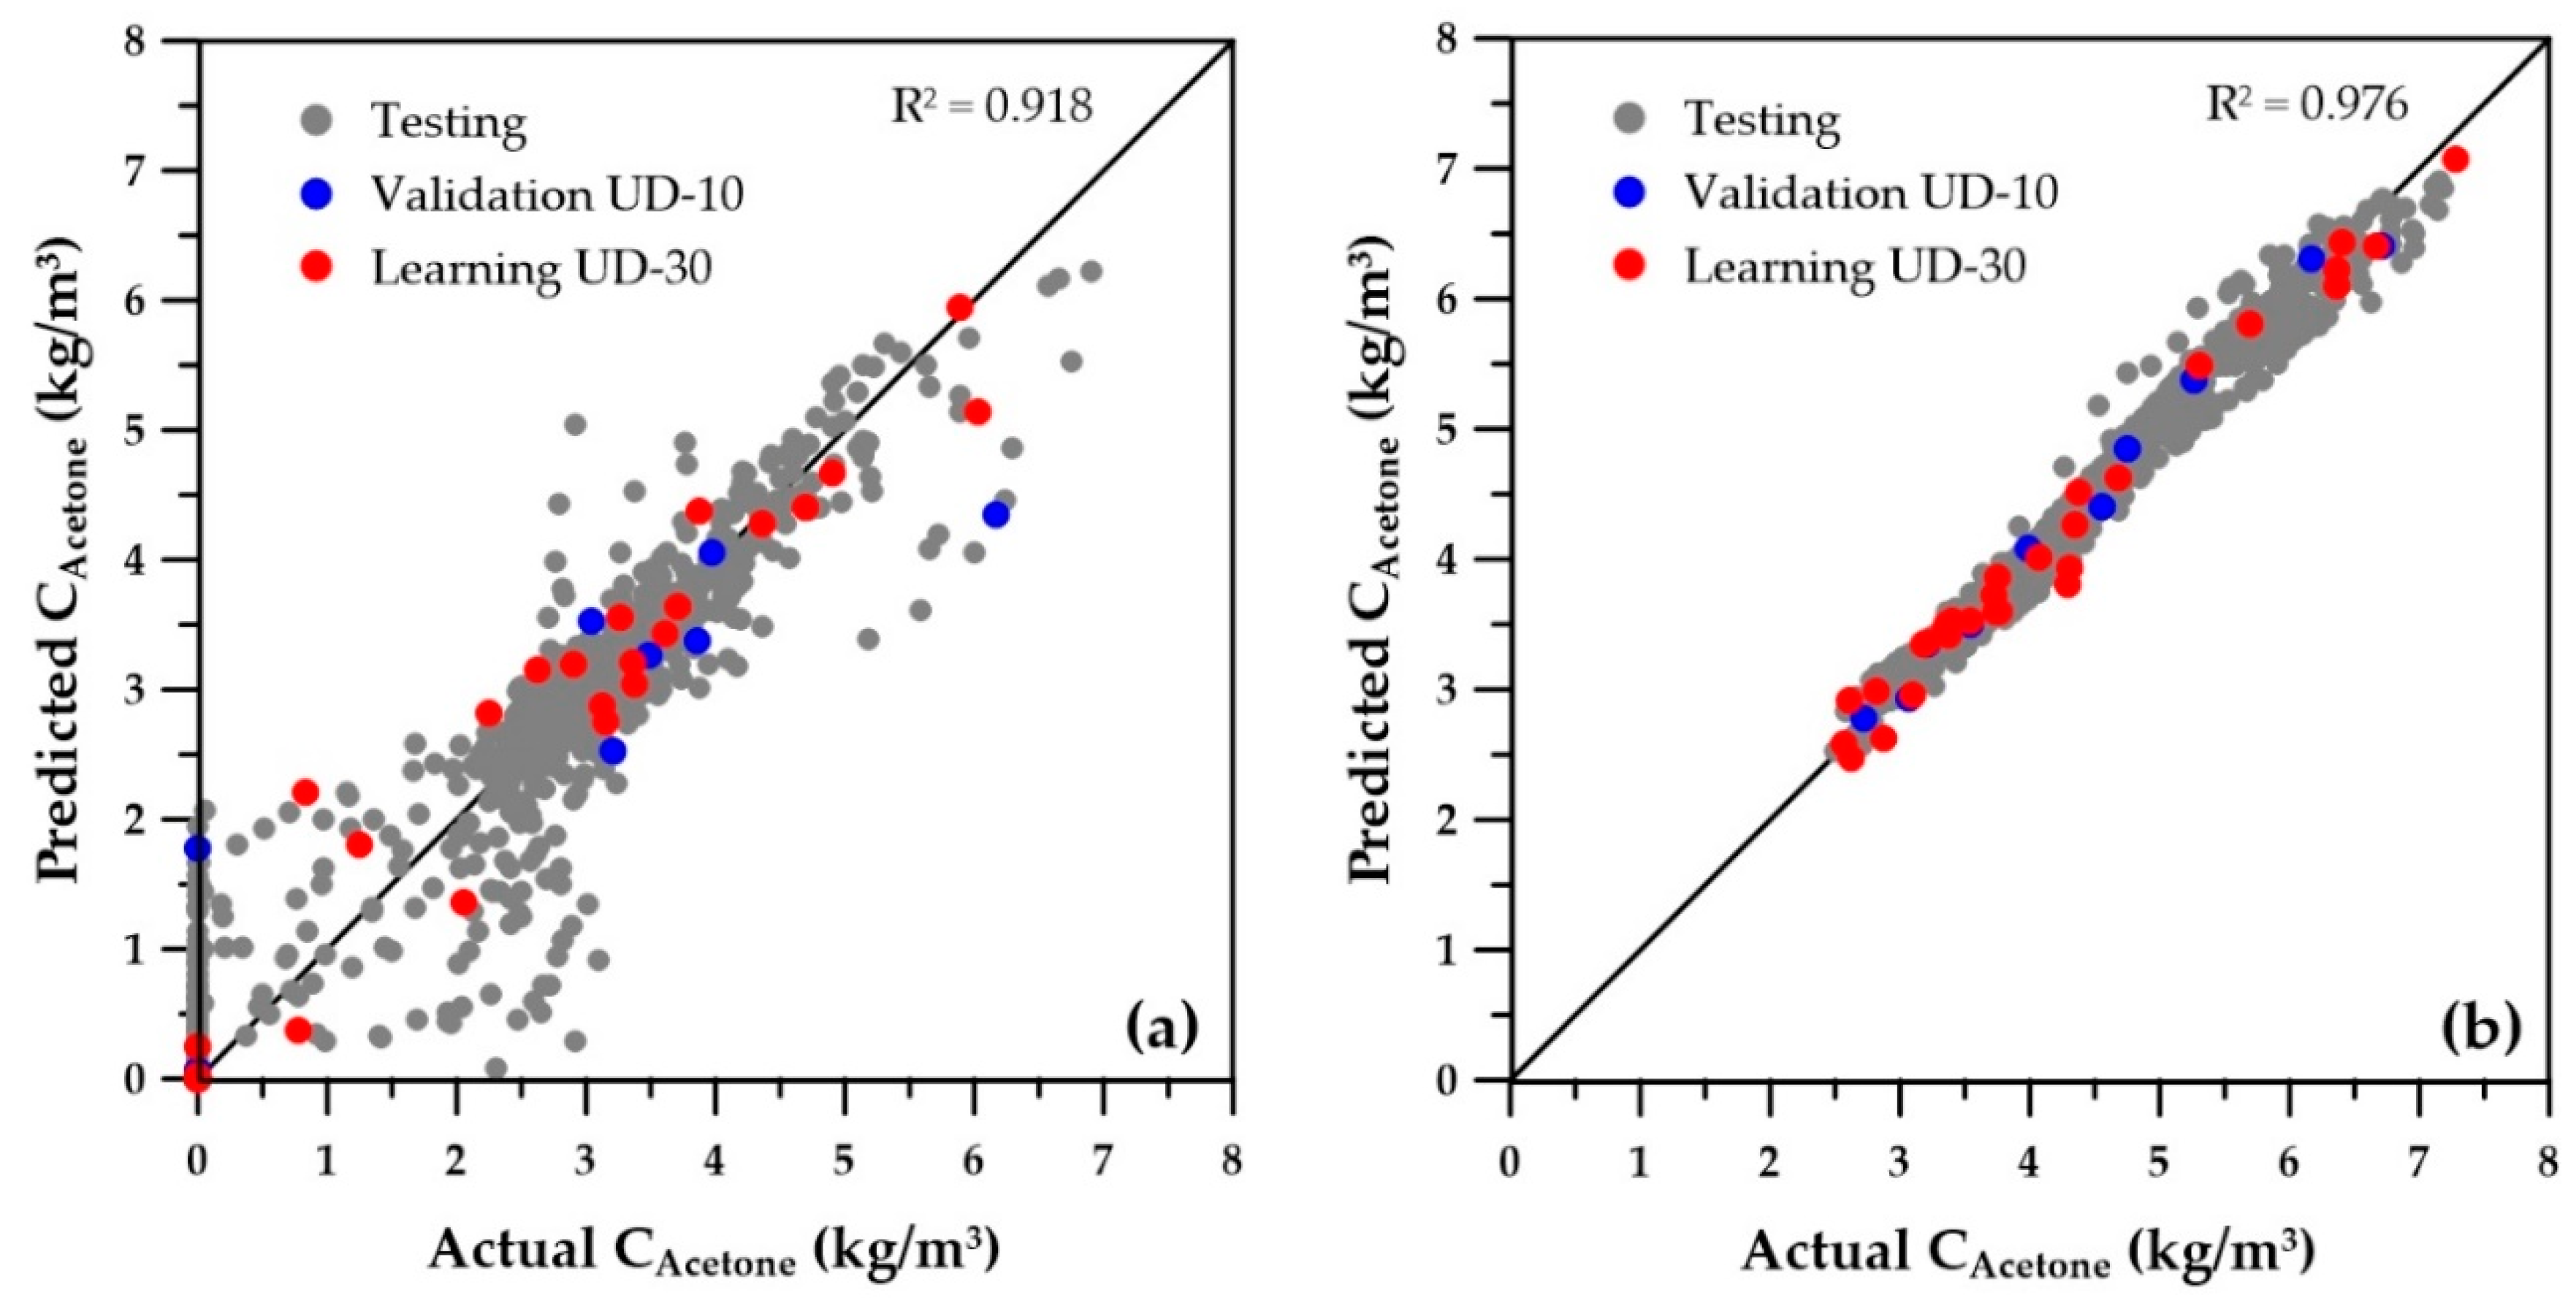
Results of the ANN predictions of the species concentrations are presented first. The parity plot giving the predicted versus actual values for the concentrations of butanol is presented in Figure 5. Very similar results were obtained for the concentrations of the other seven species, so their graphs are not shown. In this graph, points represented by red, blue, and gray symbols correspond to the training (30 solutions), validation (10 solutions), and testing (1000 solutions) data, respectively. The testing data was generated by randomly choosing the five decision variables subjected to the same minimum and maximum bounds of the training and validation datasets. The graph on the left of Figure 5 presents the predictions obtained by the ANNs when the decision variables for training and validation were selected using a wider range (Table 1). Results show that the predicted concentrations have a high degree of scatter, especially at the lower concentrations. The residuals are heteroskedastic for the initial range, as the variance of the error is not constant, and two sections with distinct variability prevail in Figure 5a. There are many solutions with zero concentrations in the actual fermenter, corresponding to operating conditions where the microorganisms were washed out, i.e., the culture was not able to sustain itself through the fermenter due to high dilution rates and high cell retention factor α8/12.
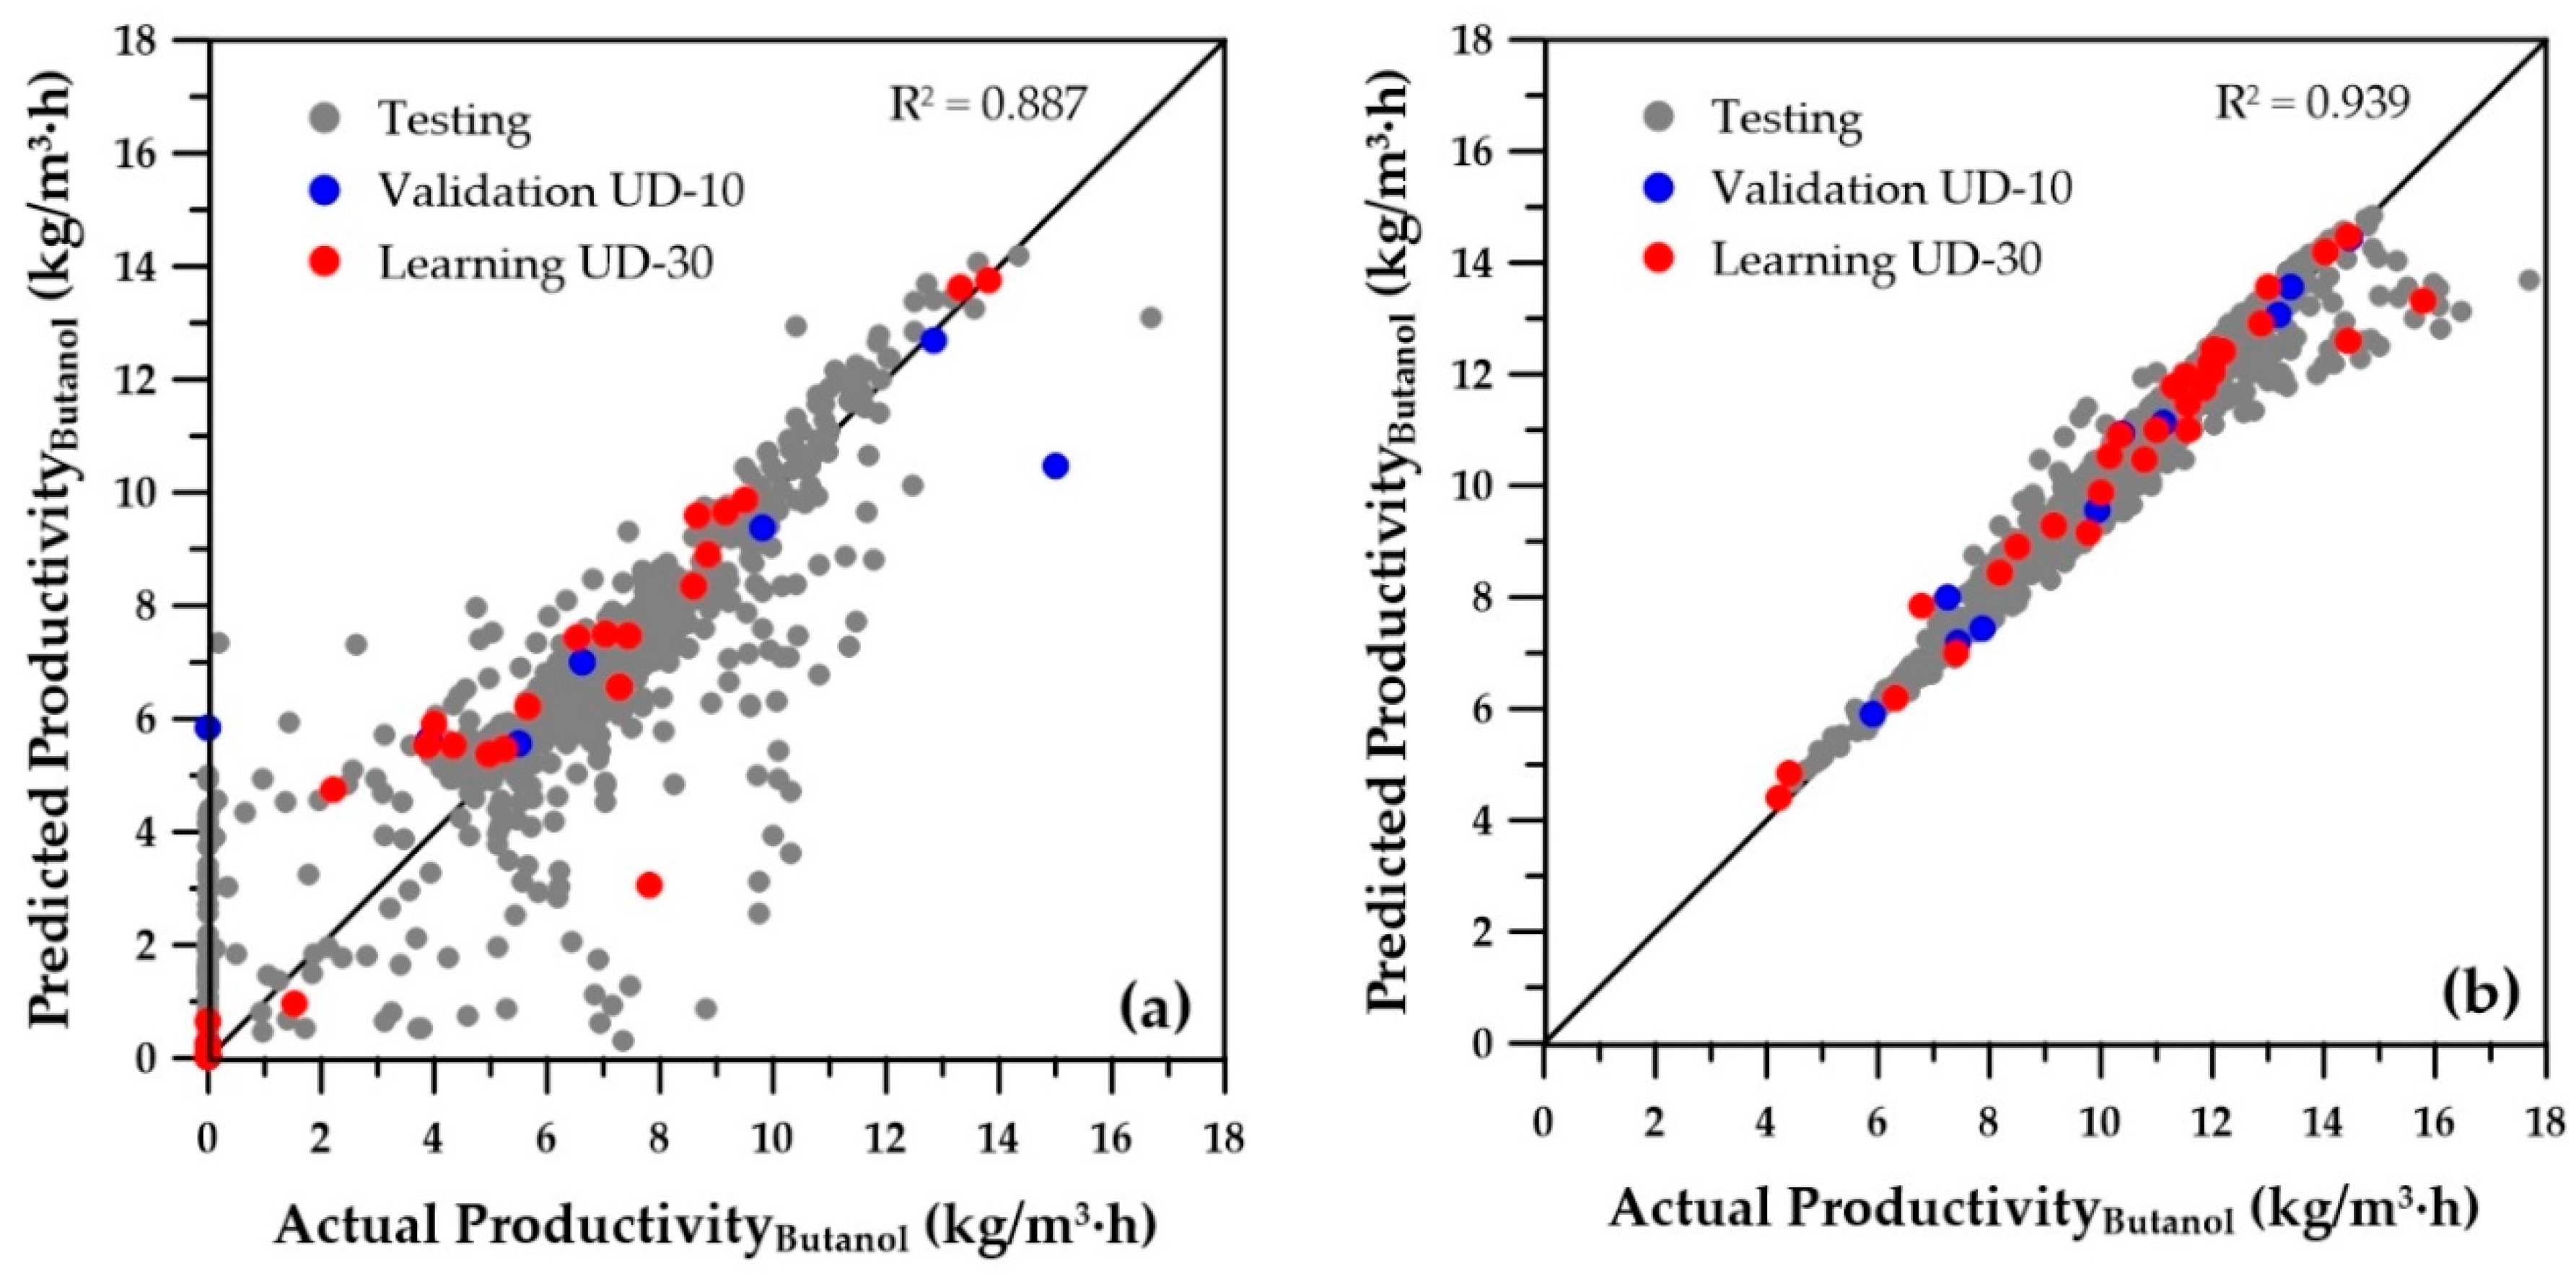
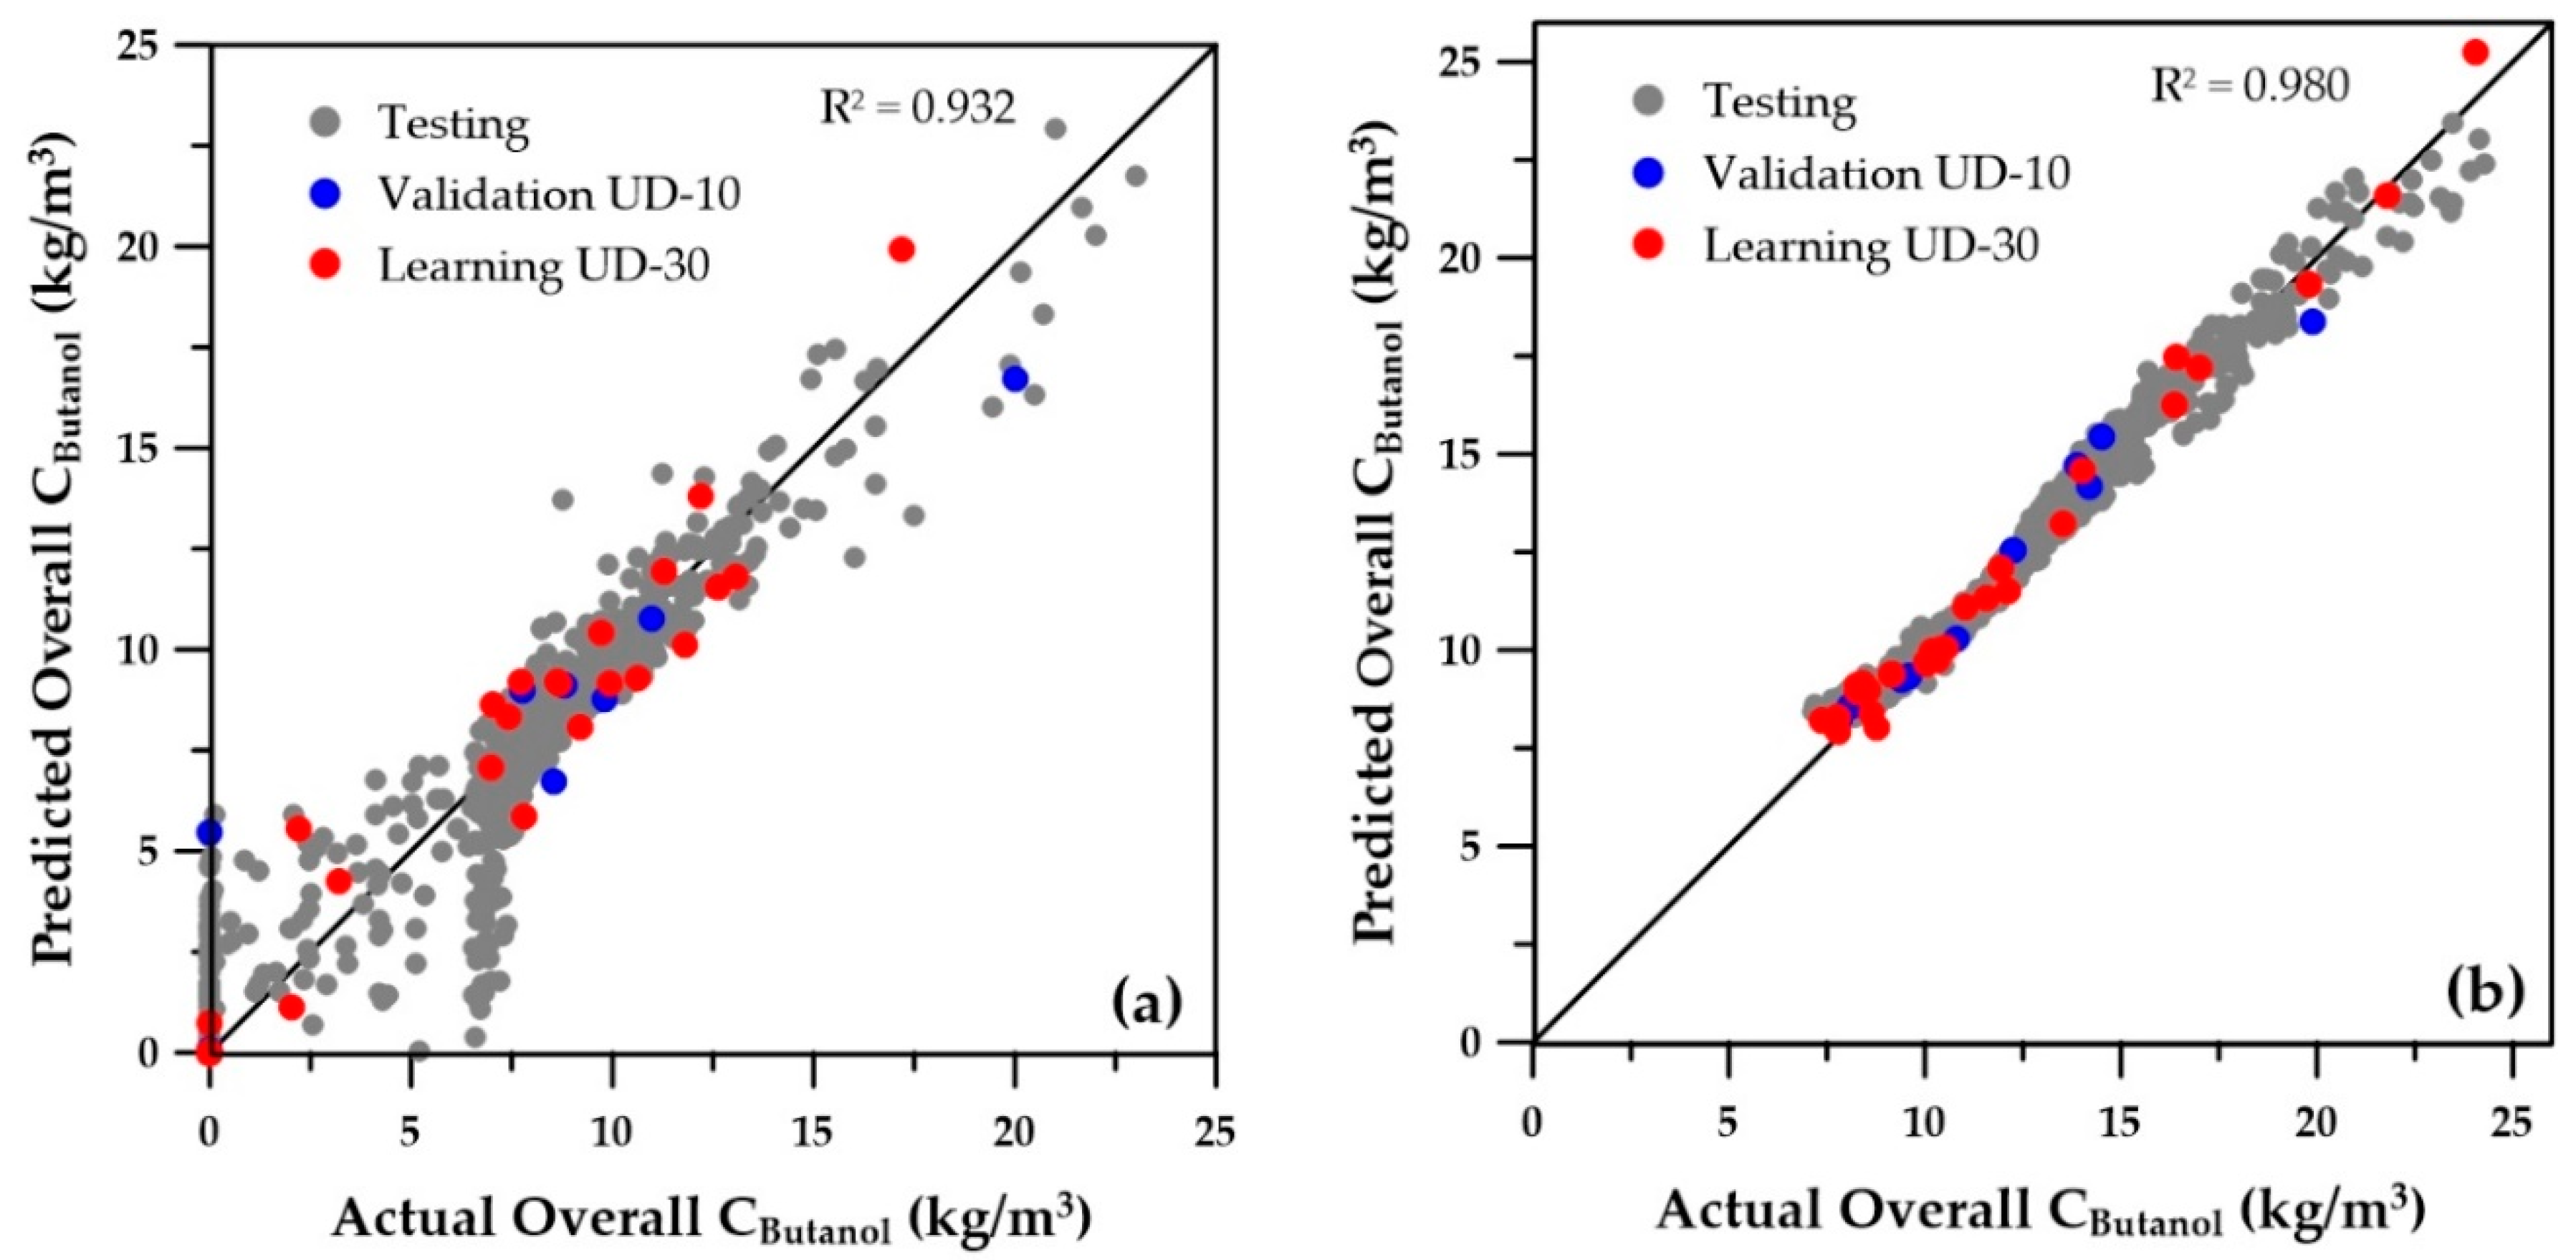
Figure 6 and Figure 7 present the parity plots of the first two objectives obtained with the same set of decision variables. The predictions based on the ANNs for the wider range of decision variables are also relatively scattered, especially at very low values. A similar plot was obtained for the third objective (sugar conversion), whereas predictions of the number of membrane modules showed a perfect regression (data not shown). On the other hand, at higher values of butanol productivity, overall butanol concentration, and sugar conversion, the predictions seem to be acceptable. Nevertheless, they could certainly be improved, provided the ranges of the operating conditions are refined to eliminate solutions that were generated in the lower range of the first three objectives, which in reality would never be part of the final Pareto domain. Indeed, these solutions are clearly dominated when compared to the solutions with higher objective values. To refine the ranges of the decision variables, the genetic algorithm was used to generate the Pareto domain from the four ANN metamodels of the objectives. The obtained Pareto domain allowed for reducing the ranges of the decision variables to those of the second row of Table 1. It was then possible to generate new sets of training and validation data, which were used to generate the 12 new ANNs. The parity plots of the butanol concentration for the first two objectives are presented on the right graphs of Figure 5, Figure 6 and Figure 7. It is obvious that the new ANNs show much better predictions than those obtained with the wider ranges of decision variables. It is believed that these predictions should provide sufficient accuracy to use the ANNs with confidence for directly obtaining the Pareto domain or providing good initial species concentrations. The overall coefficients of determination (R2) are included on each graph and clearly indicate a significant improvement of the metamodels when the reduced ranges are used. Moreover, for all variables, the numerous low values and zeros present with the wider ranges of decision variables disappeared for the ANN predictions obtained with the reduced decision variable ranges. The main change in the ranges was the cell retention factor, which now assumes a unique value of 0.1, allowing elimination of the fermenter washout and retention of a higher microorganism concentration within the fermenter.
A Pareto domain was obtained for each of the three strategies described in Figure 4 using the same generic algorithm. In strategy A, the Pareto domain was obtained from the ANN metamodels of the entire process where the four objectives are predicted from the five decision variables. In strategy B, the phenomenological simulator of continuous fermentation integrated with a pervaporation unit was used with the initial estimates of the concentrations of the eight species in the fermenter being predicted with the eight ANN metamodels. Each concentration estimate was predicted from the five decision variables. Finally, in strategy C, the Pareto domain was circumscribed akin to strategy B, except the initial estimates of the concentrations were set arbitrarily. It is obvious that strategies B and C led to similar Pareto domains, since the phenomenological simulator of the continuous integrated fermentation was used in both cases until convergence was achieved.
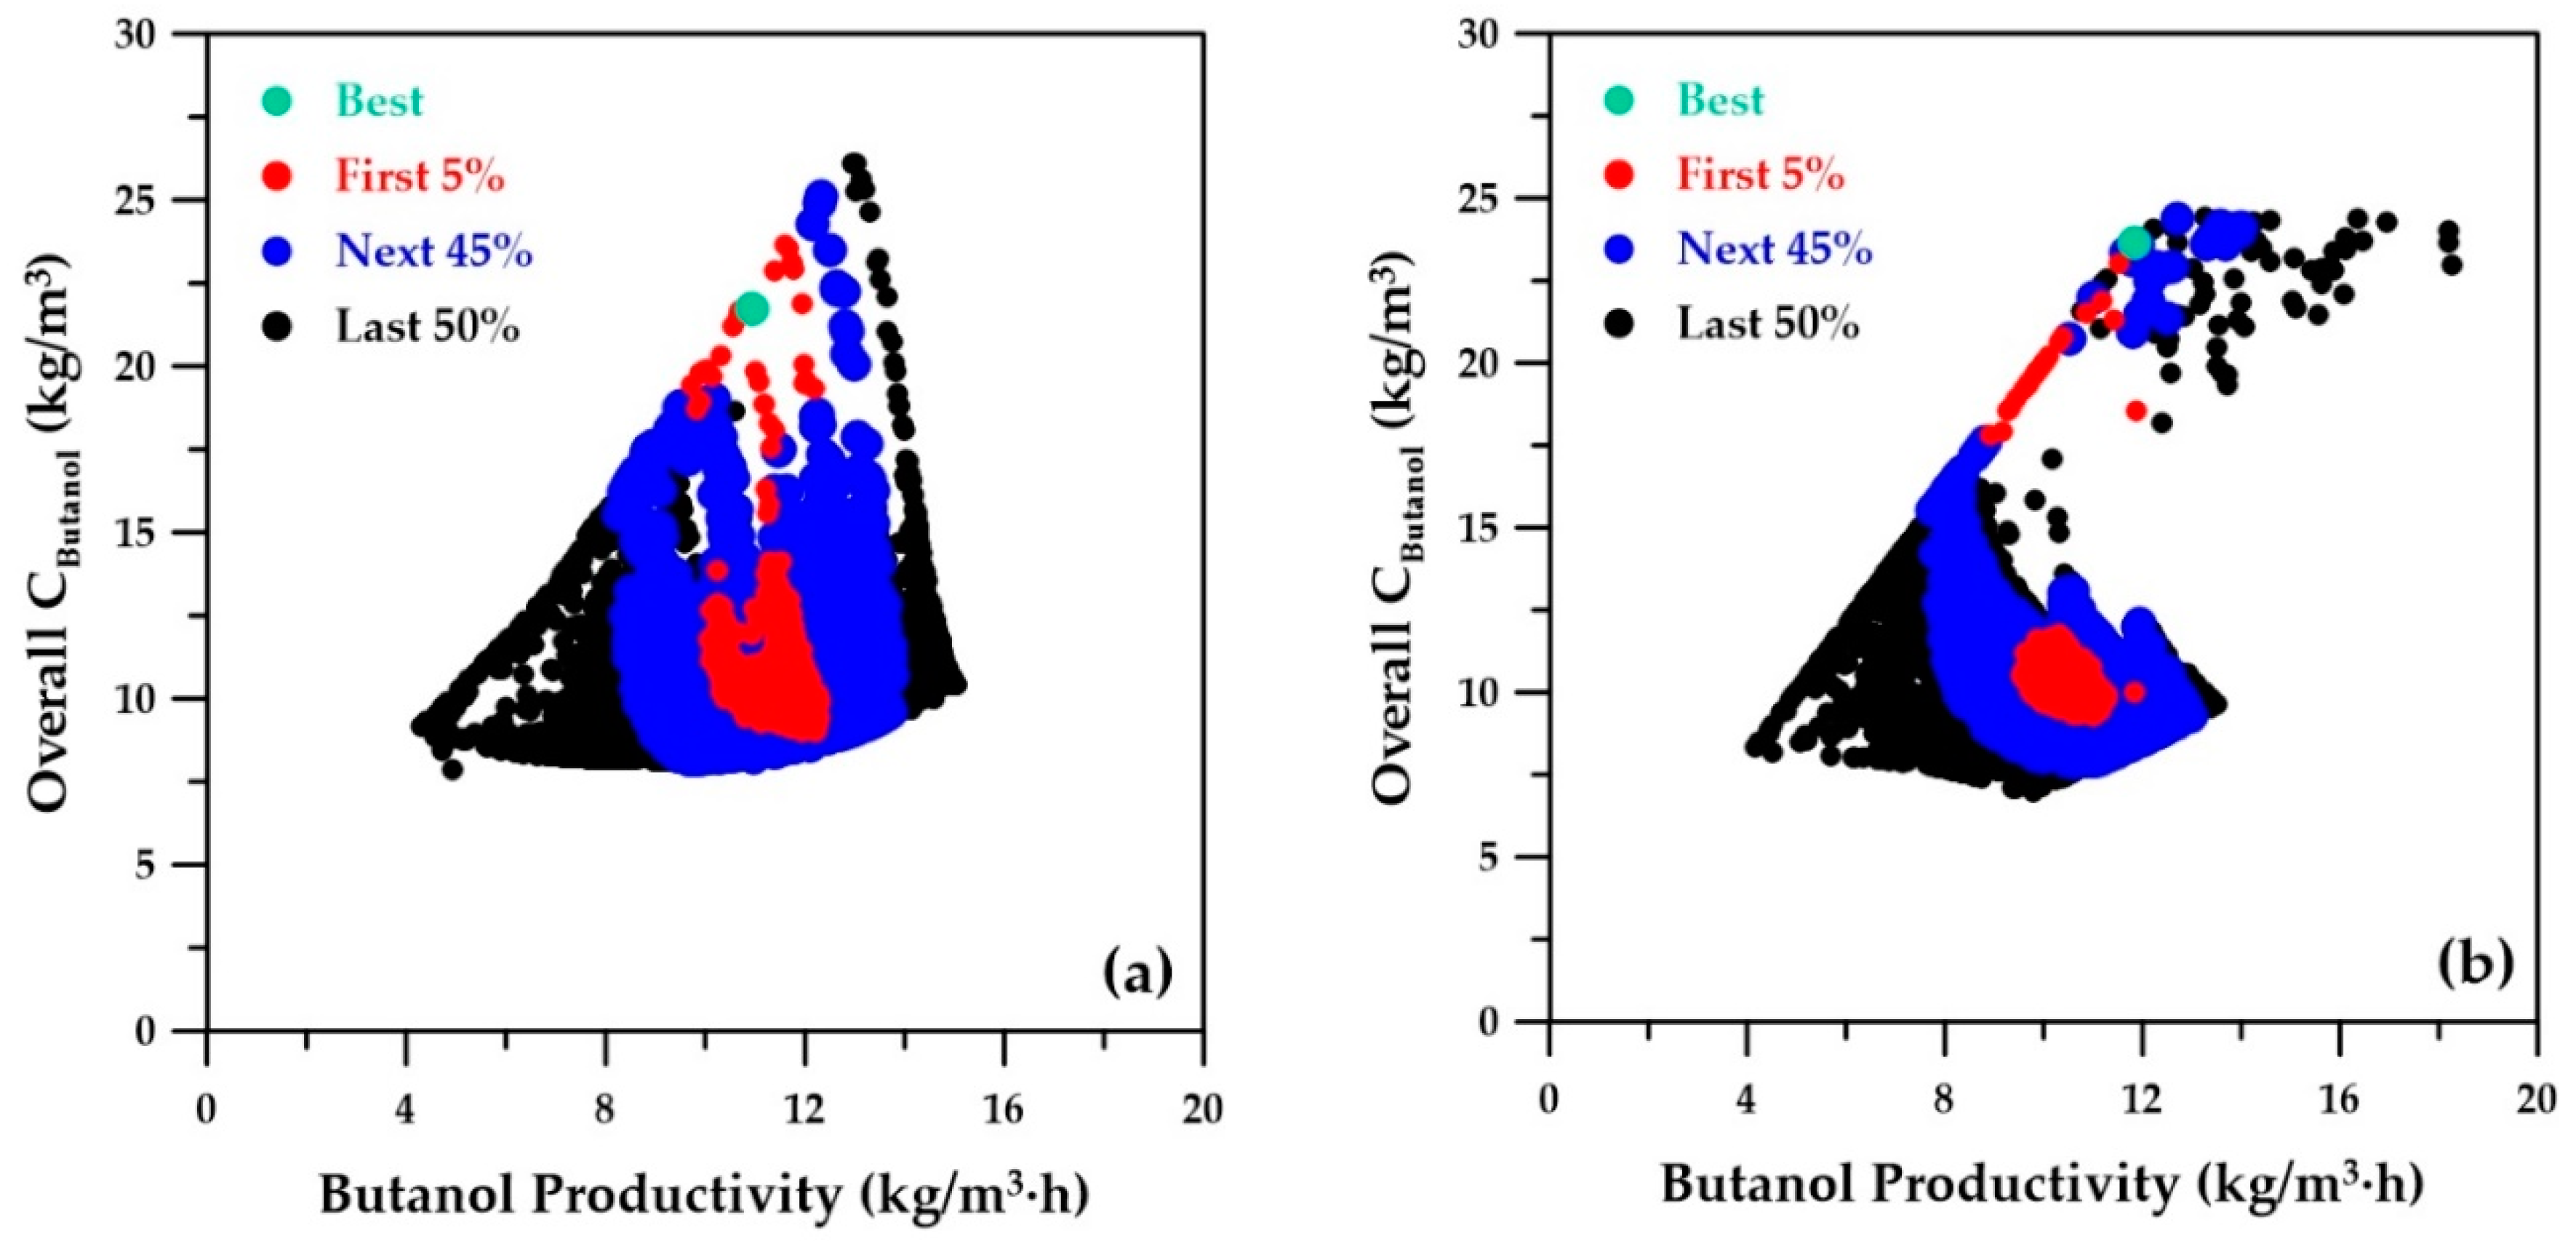
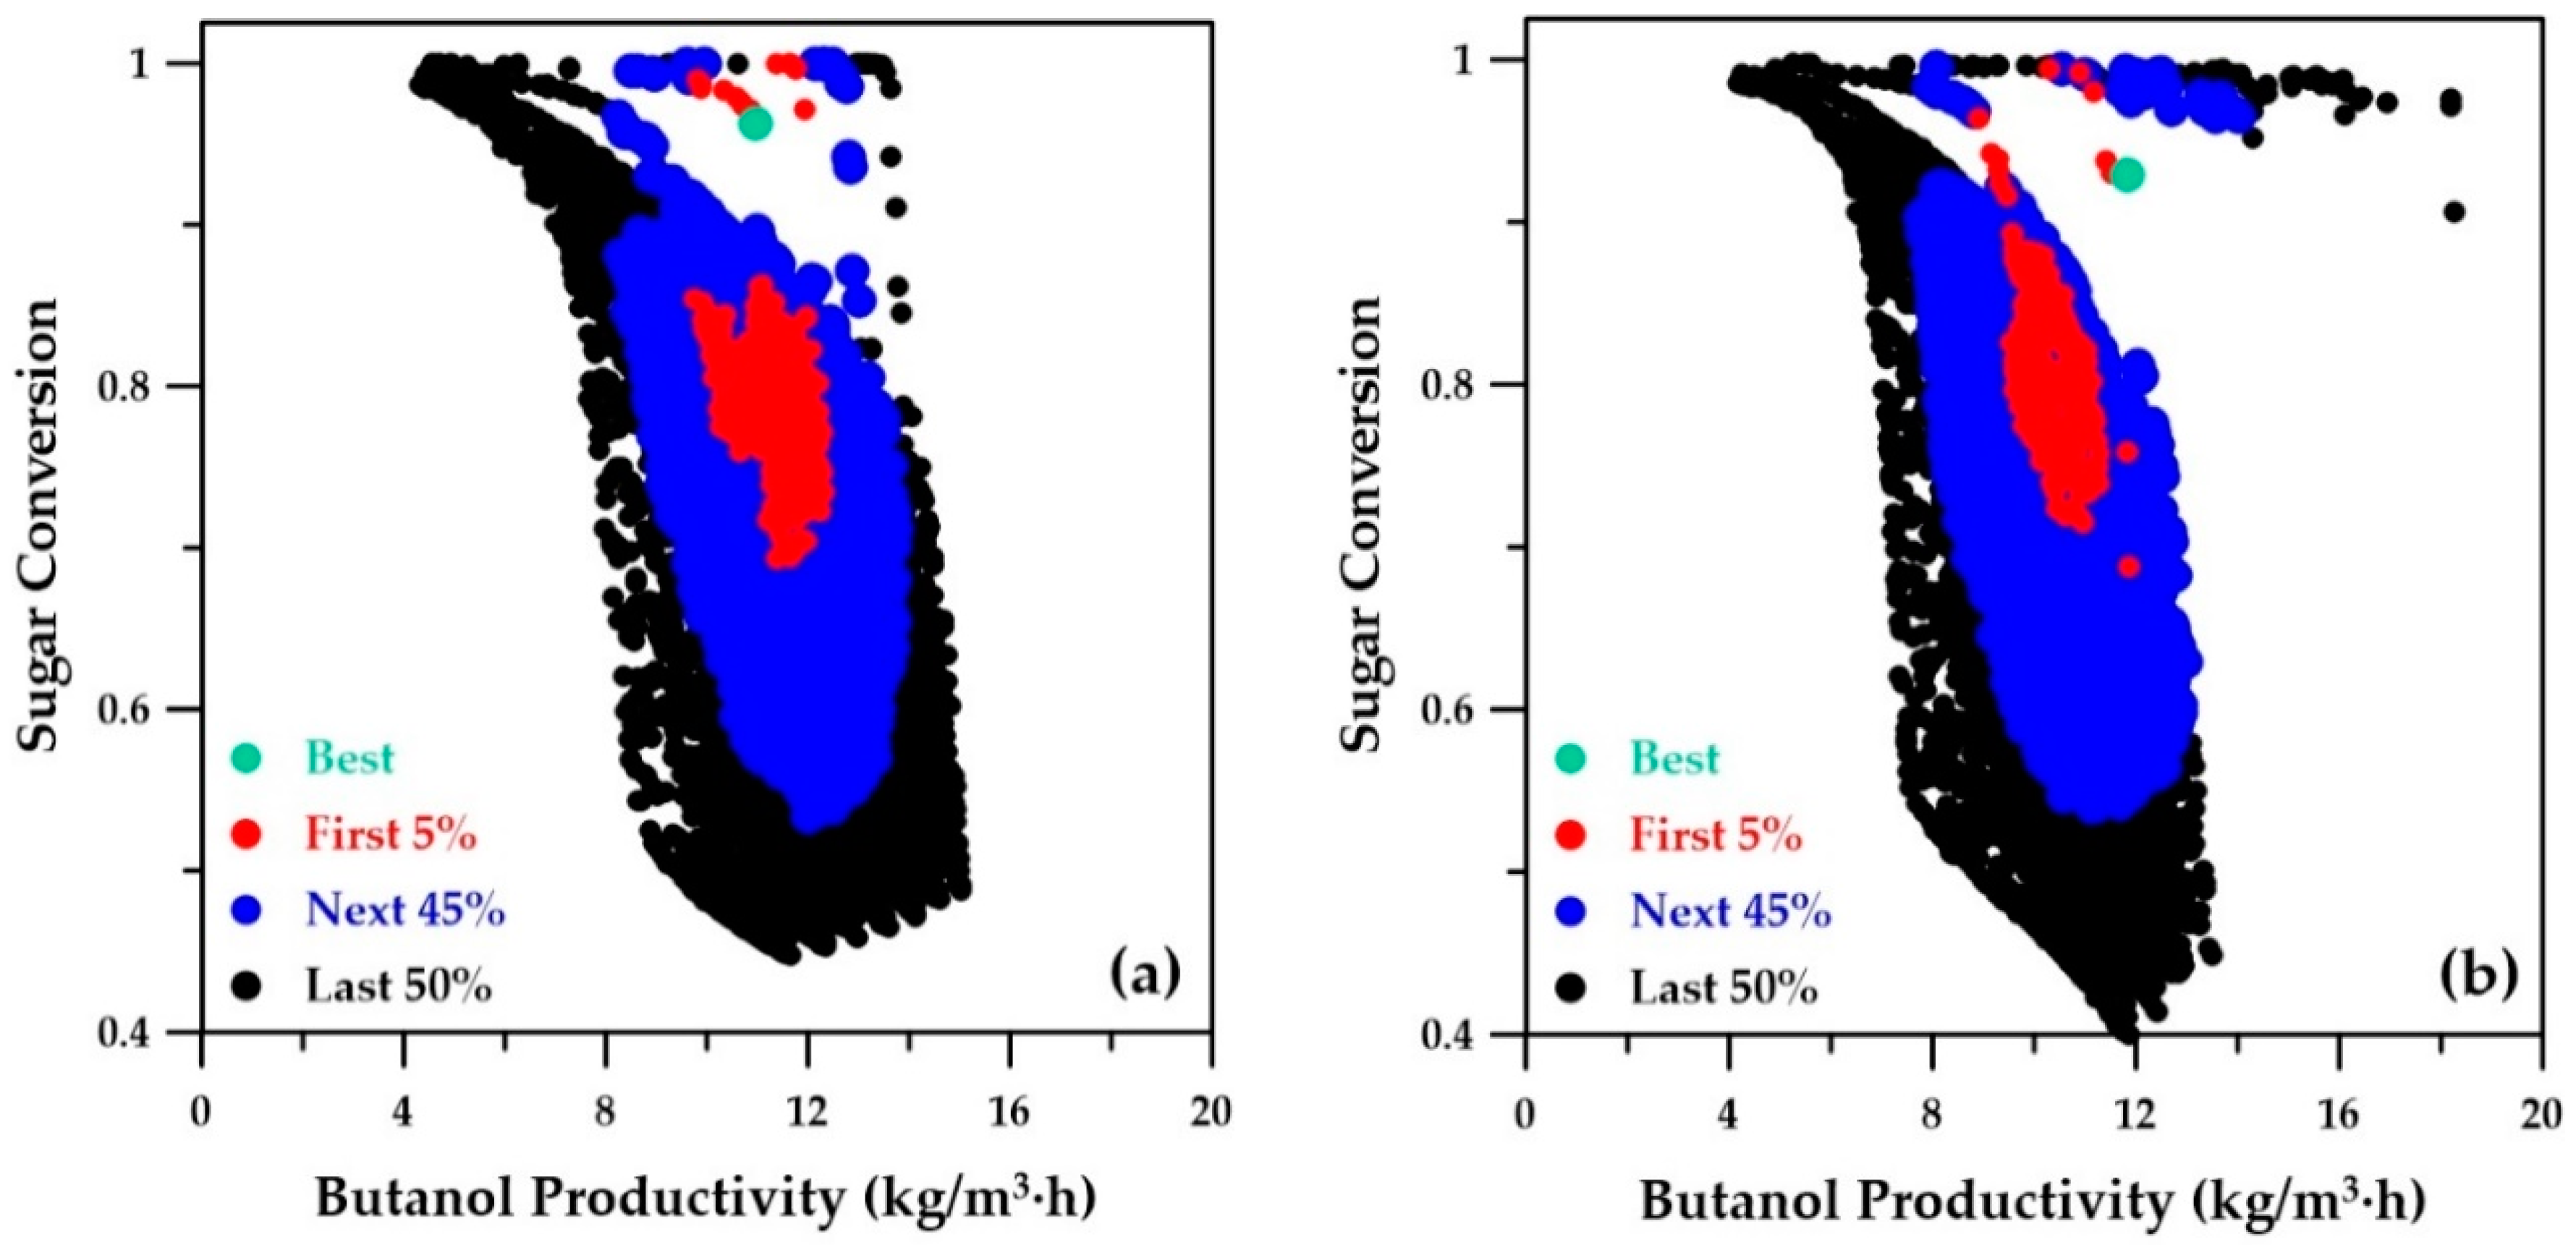
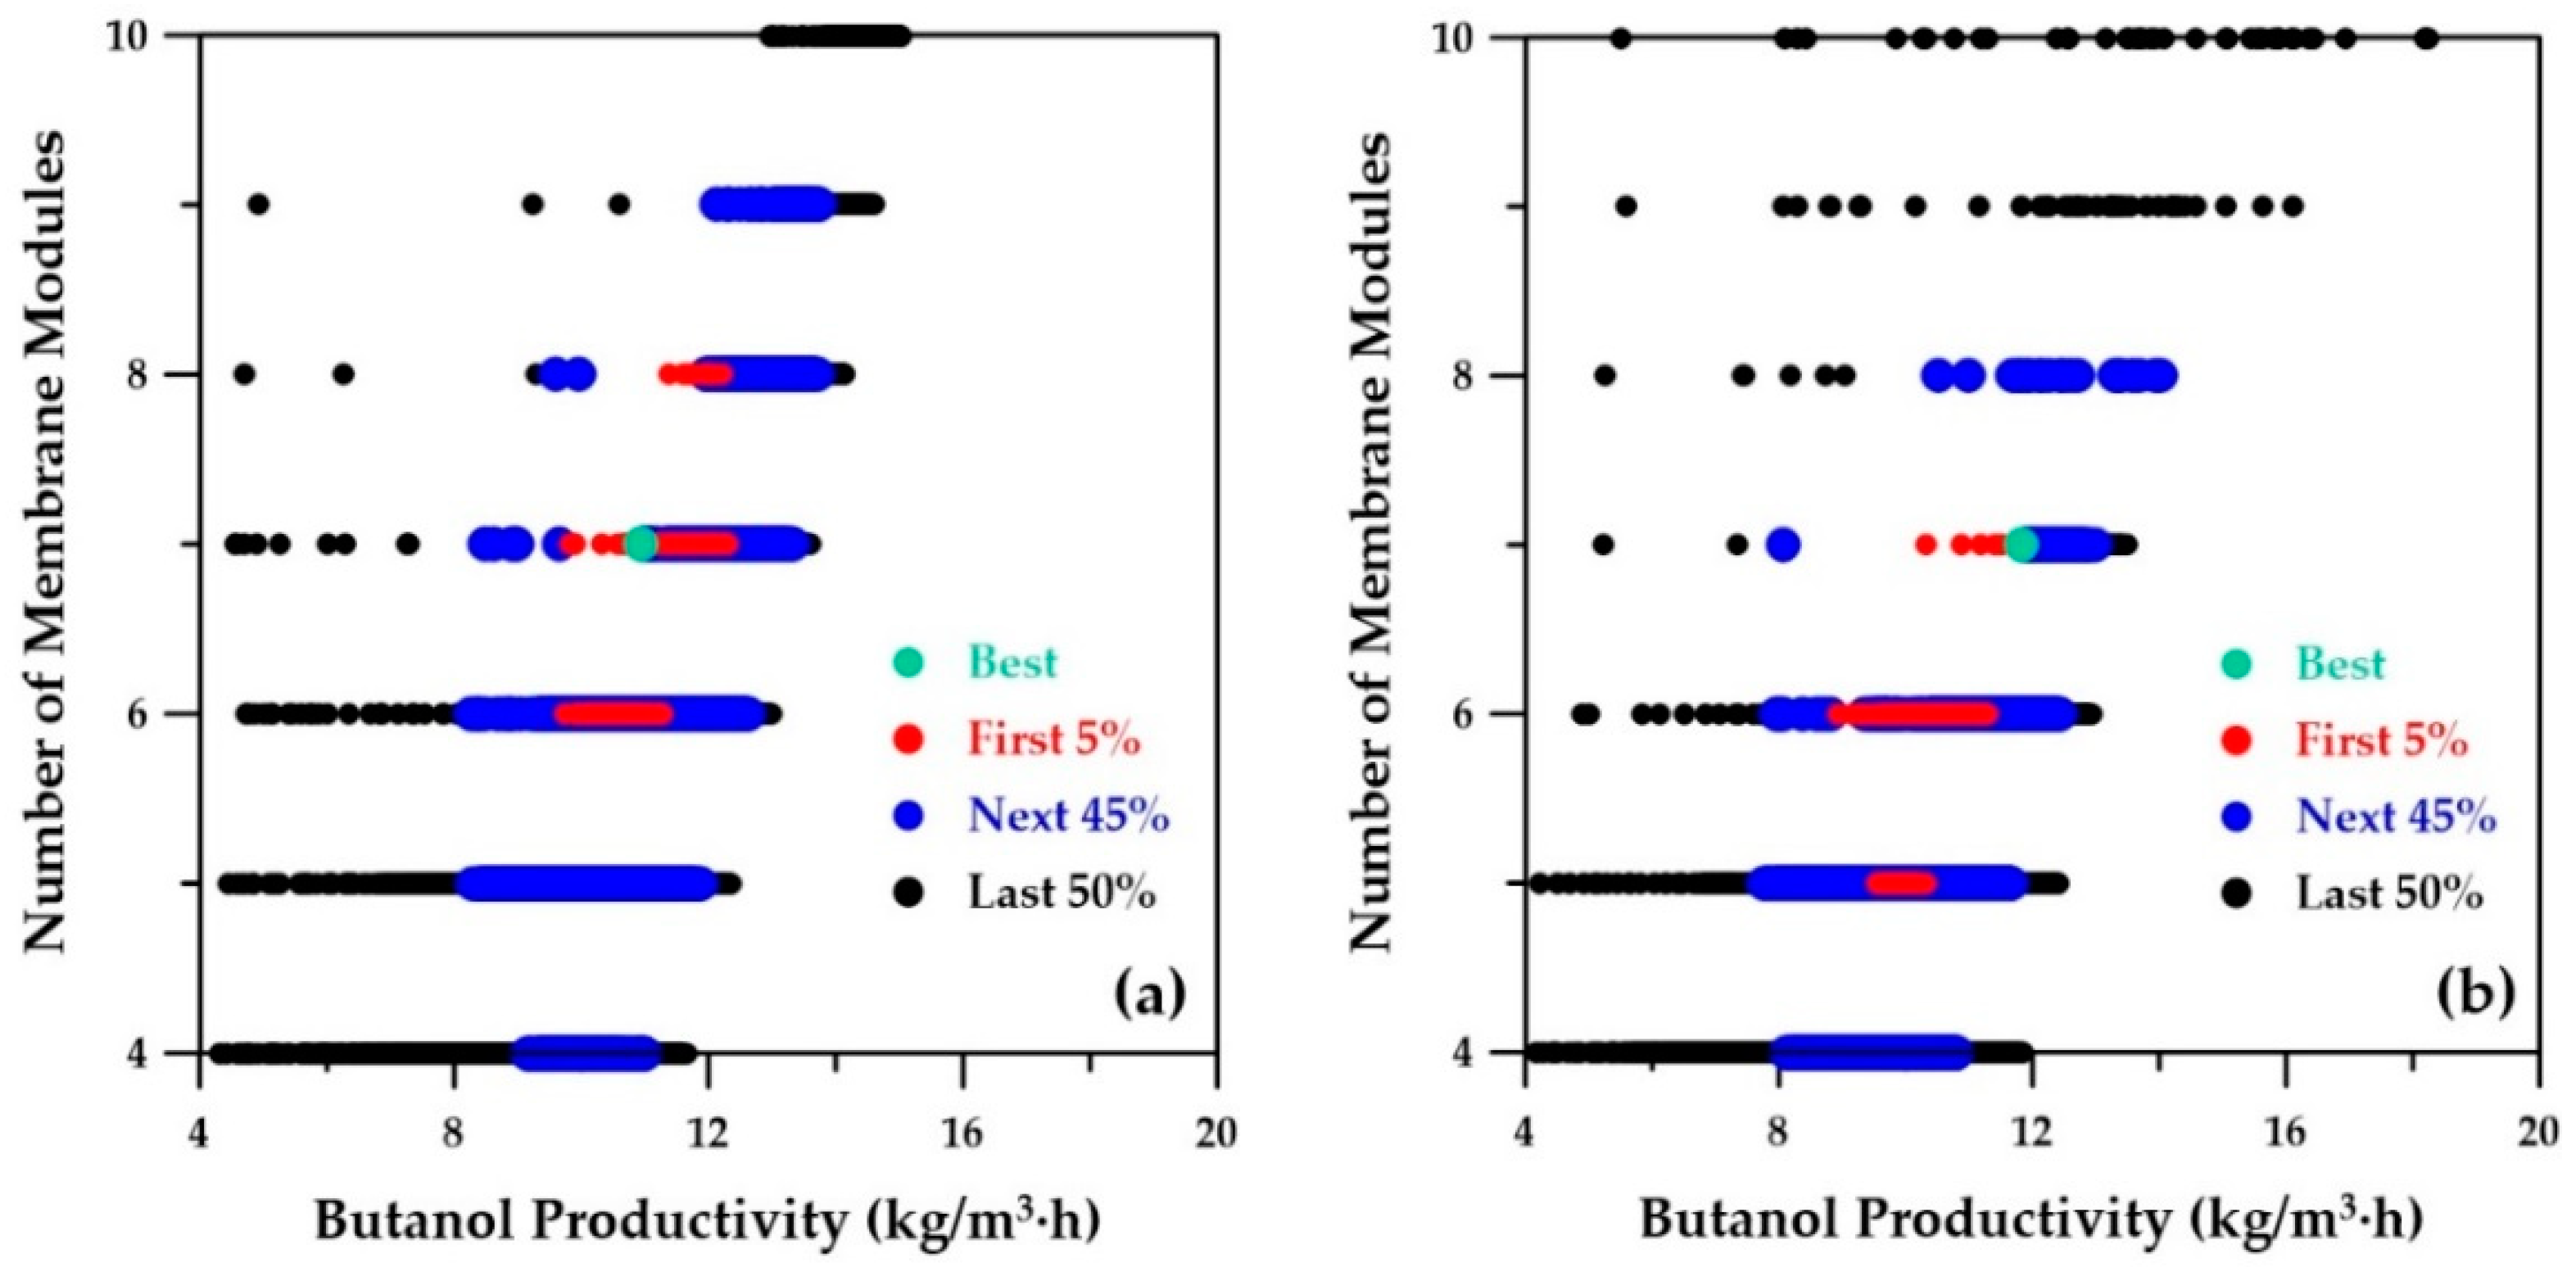
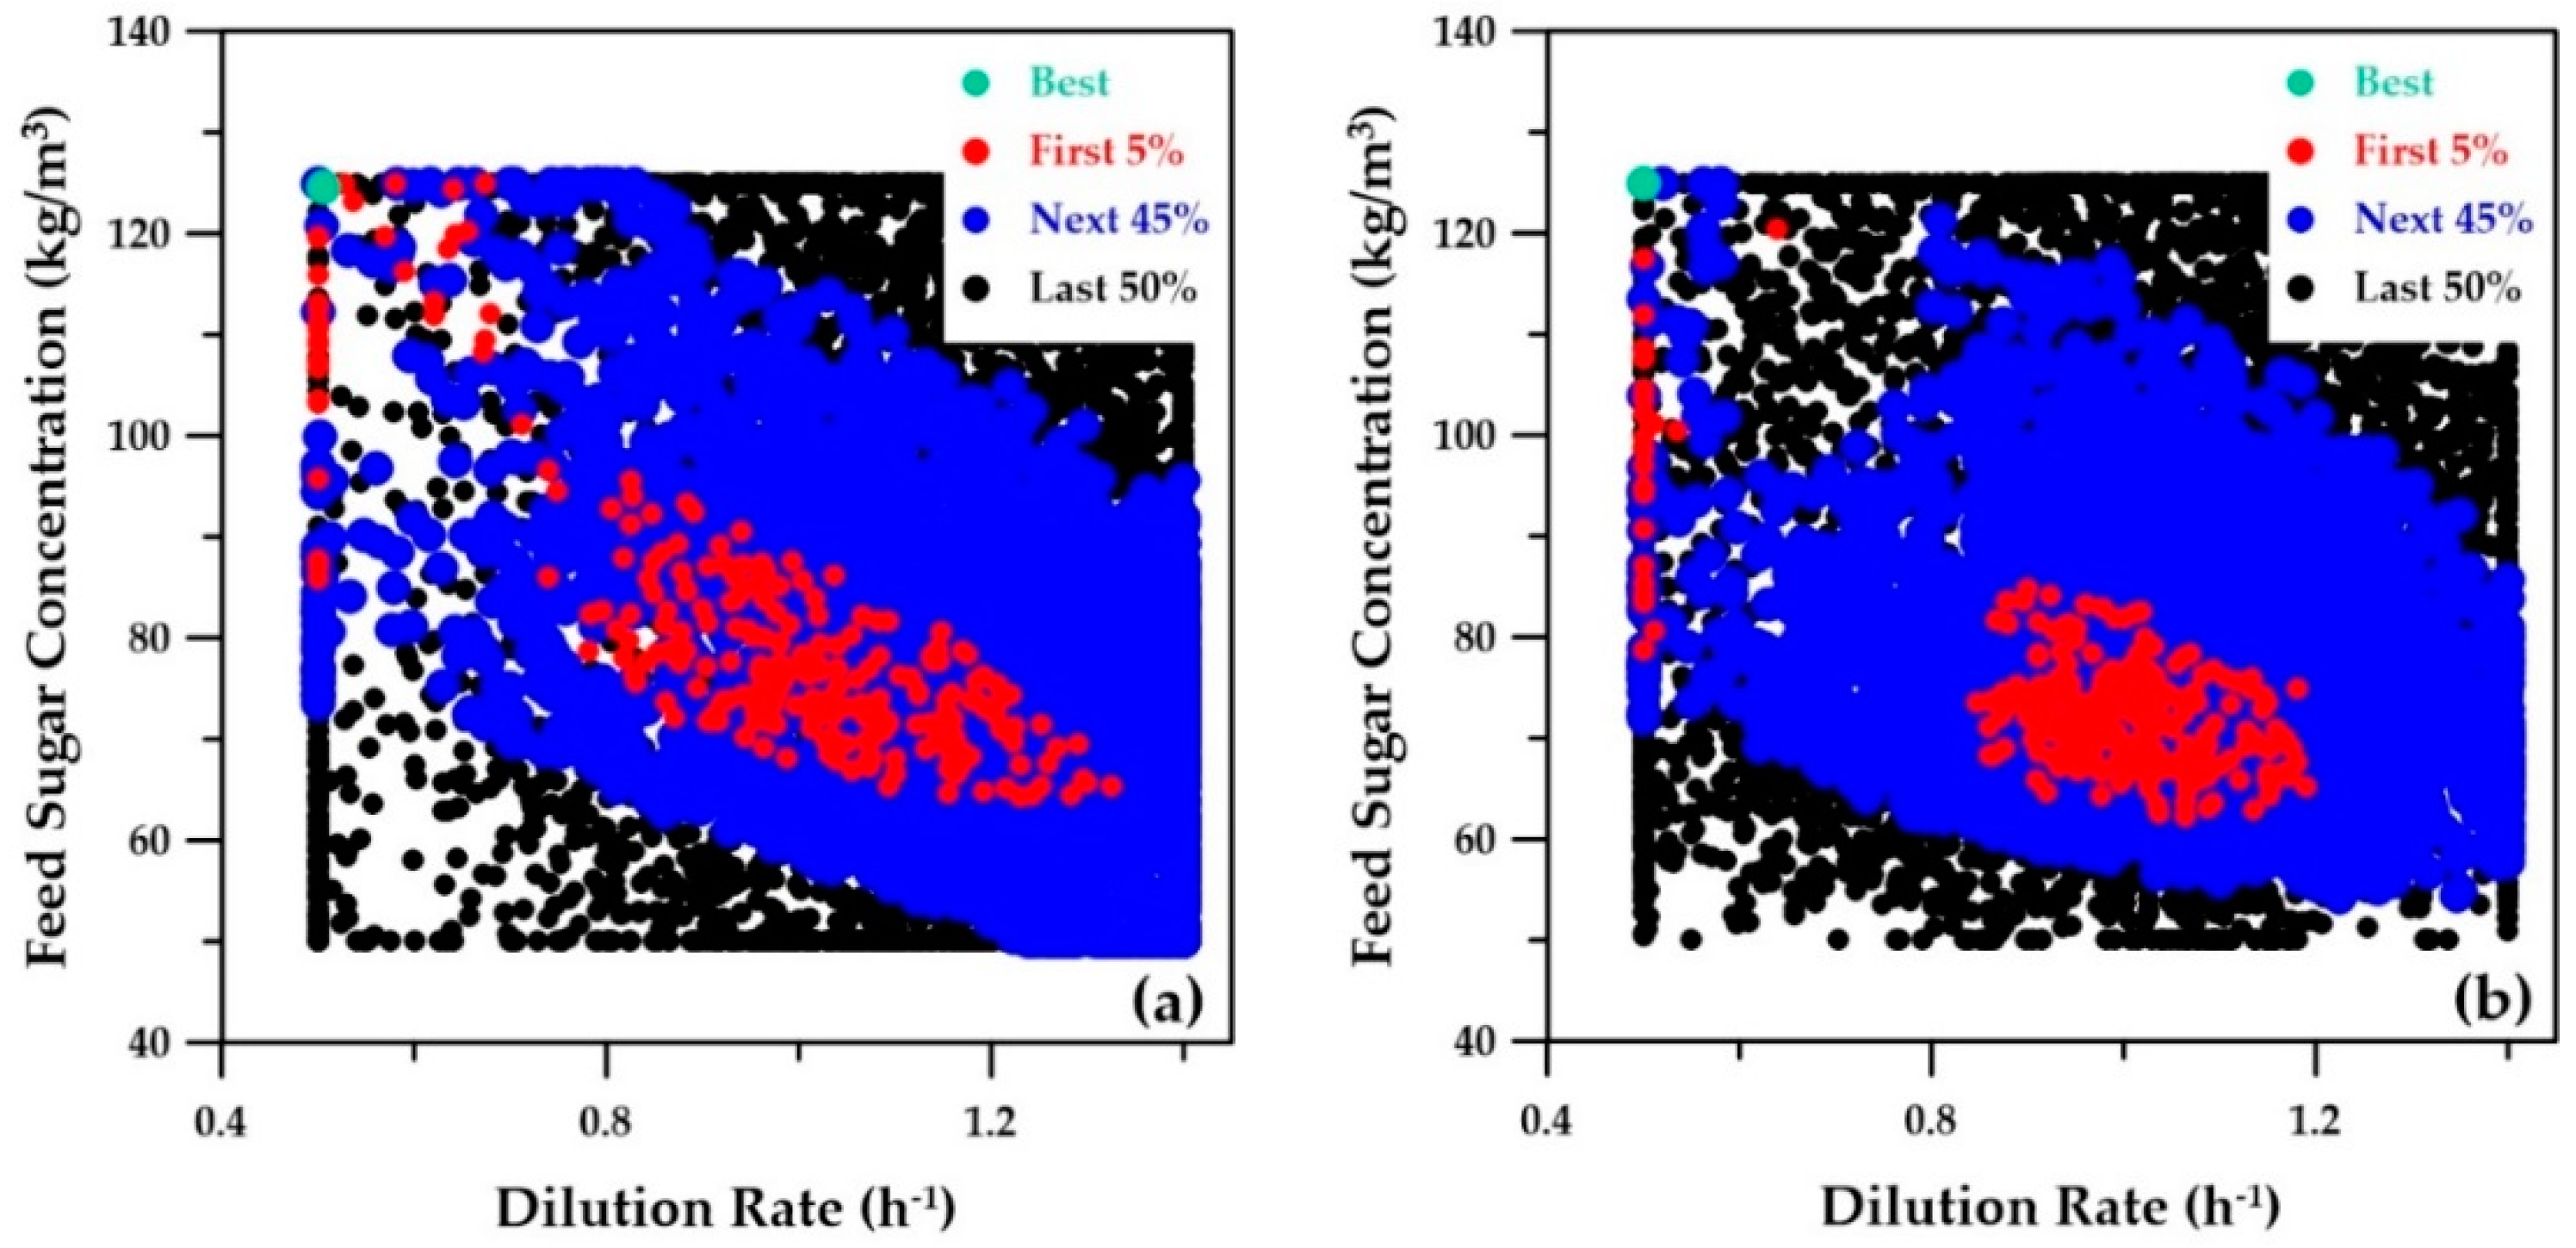
With the initial ranges of the decision variables, strategy A was used to determine the Pareto domain (not shown), which made reducing the ranges of the decision variables possible. With the 12 ANN metamodels developed with the decision variables of the reduced ranges, Pareto domains with a population of 5000 solutions were obtained with strategies A, B and C. All Pareto-optimal solutions were then ranked with the NetFlow method. The method’s relative weights and the three threshold values for each of the four objective functions are summarized in Table 2. The plots of the four objective functions and two of the decision variables are presented in Figure 8, Figure 9, Figure 10 and Figure 11. The Pareto domain is plotted with four distinct regions: (1) best-ranked solution (green point), (2) solutions ranked in the first 5% (red points), (3) solutions ranked in the next 45% (blue points), and (4) solutions of the remaining 50% (black points).
Figure 8a depicts the overall concentration of butanol as a function of butanol productivity, as determined by the genetic algorithm using the four ANN metamodels. The best-ranked solution is located at a butanol productivity of 10.95 kg/m3∙h and an overall butanol concentration of 21.74 kg/m3 (Table 3, column A). When the decision variables associated with the optimal solution obtained with the ANN were used in the phenomenological simulator to validate this optimal point, values of 12.14 kg/m3∙h and 24.04 kg/m3 were obtained, respectively. This is comparable to the best-ranked solution obtained by the genetic algorithm using the phenomenological simulator, as depicted in Figure 8b, where butanol productivity of 11.83 kg/m3∙ was obtained (Table 3, column C). Figure 8 shows the positive correlation between butanol productivity and overall butanol concentration at a constant dilution rate. The dilution rate increases diagonally (left to right) from a lower bound of 0.5 h−1 to an upper bound of 1.4 h−1. The empty portion depicted in the Pareto domain of Figure 8b corresponds to an inoperable range due to the constraints that exist between elevated dilution rate, butanol concentration, and flow rates to achieve steady state. The metamodel failed to recognize these limitations and instead filled the empty region accordingly by interpolating the data. This observation is expected, as a metamodel is based on input–output observations without accounting for the intrinsic constraints of the system. Nevertheless, the best-ranked solution and the solutions ranked in the first 5% were well identified with the metamodels.
Sugar conversion as a function of the butanol productivity of the Pareto domain is depicted in Figure 9. Figure 9a was obtained by the genetic algorithm using the ANN metamodels, while Figure 9b presents the Pareto domain obtained using the phenomenological simulator. Both Pareto domains are nearly identical, which clearly indicates that the ANN metamodels were able to adequately model and well predict the relationship between conversion and butanol productivity. The sugar conversion corresponding to the best-ranked solution is 0.96 and 0.93 for the metamodel and phenomenological simulator, respectively. The same sugar conversion was obtained when the decision variables of the best-ranked solution identified with the ANN metamodels was used in the phenomenological simulator (Table 3). The first three objective functions need to be maximized, whereas the fourth objective, the number of membrane modules in series, needs to be minimized. A trade-off between all four objectives needs to prevail in order to determine the optimal operating conditions for the decision variables via the NetFlow ranking algorithm. Figure 10a depicts the number of membrane modules, also a decision variable, as a function of butanol productivity as determined by the ANN metamodels. The best-ranked solution suggests seven membrane modules, which is the same value as the best-ranked solution obtained with the phenomenological simulator depicted in Figure 10b. An increase in the number of membrane modules is accompanied by an increase in the overall membrane area, which in turn leads to higher solvent recovery, higher sugar conversion, and alleviation of product inhibition.
The first two decision variables, the dilution rate and the feed sugar concentration, are plotted in Figure 11. Both strategies led to very similar graphs. The best-ranked solution shows that the optimal trade-off was obtained for a feed sugar concentration of 125 kg/m3 and a dilution rate of 0.5 h−1 for both strategies. The third decision variable, the cell retention factor, was kept constant at 0.1. A small value of the cell retention factor implies that a higher microorganism concentration prevails inside the fermenter. The optimal operating conditions as determined with the Pareto domains obtained with the three strategies described in Figure 4 are summarized in Table 3. The two sub-columns of Table 3 for strategy A correspond to the first three objectives predicted with the five decision variables by the ANN metamodel and the phenomenological simulator, respectively. The latter is recorded for validation purposes.
Table 3 also provides the computation time needed to circumscribe the Pareto domain for each strategy. It only took 5.6 s to determine the complete Pareto domain with the ANN metamodels, whereas it took about 1500 and 2500 times more computation time with strategies B and C, respectively. It is clear that there is a net advantage to using the ANN metamodels for circumscribing the Pareto domain. This computational time advantage would be even more impressive if the time to perform a single simulation was longer. Previous research has also clearly illustrated the advantage of using neural networks as surrogate models for the optimization of processes [21,22]. In this investigation, the number of evaluations using the phenomenological model for circumscribing the Pareto domain is given in Table 3. It took 81 simulations for the two iterations (initial and reduced ranges of decision variables) to derive the ANN metamodels, including the simulation for validating the optimum solution identified by strategy A. On the other hand, it took more than 250 times the number of evaluations for strategies B and C.
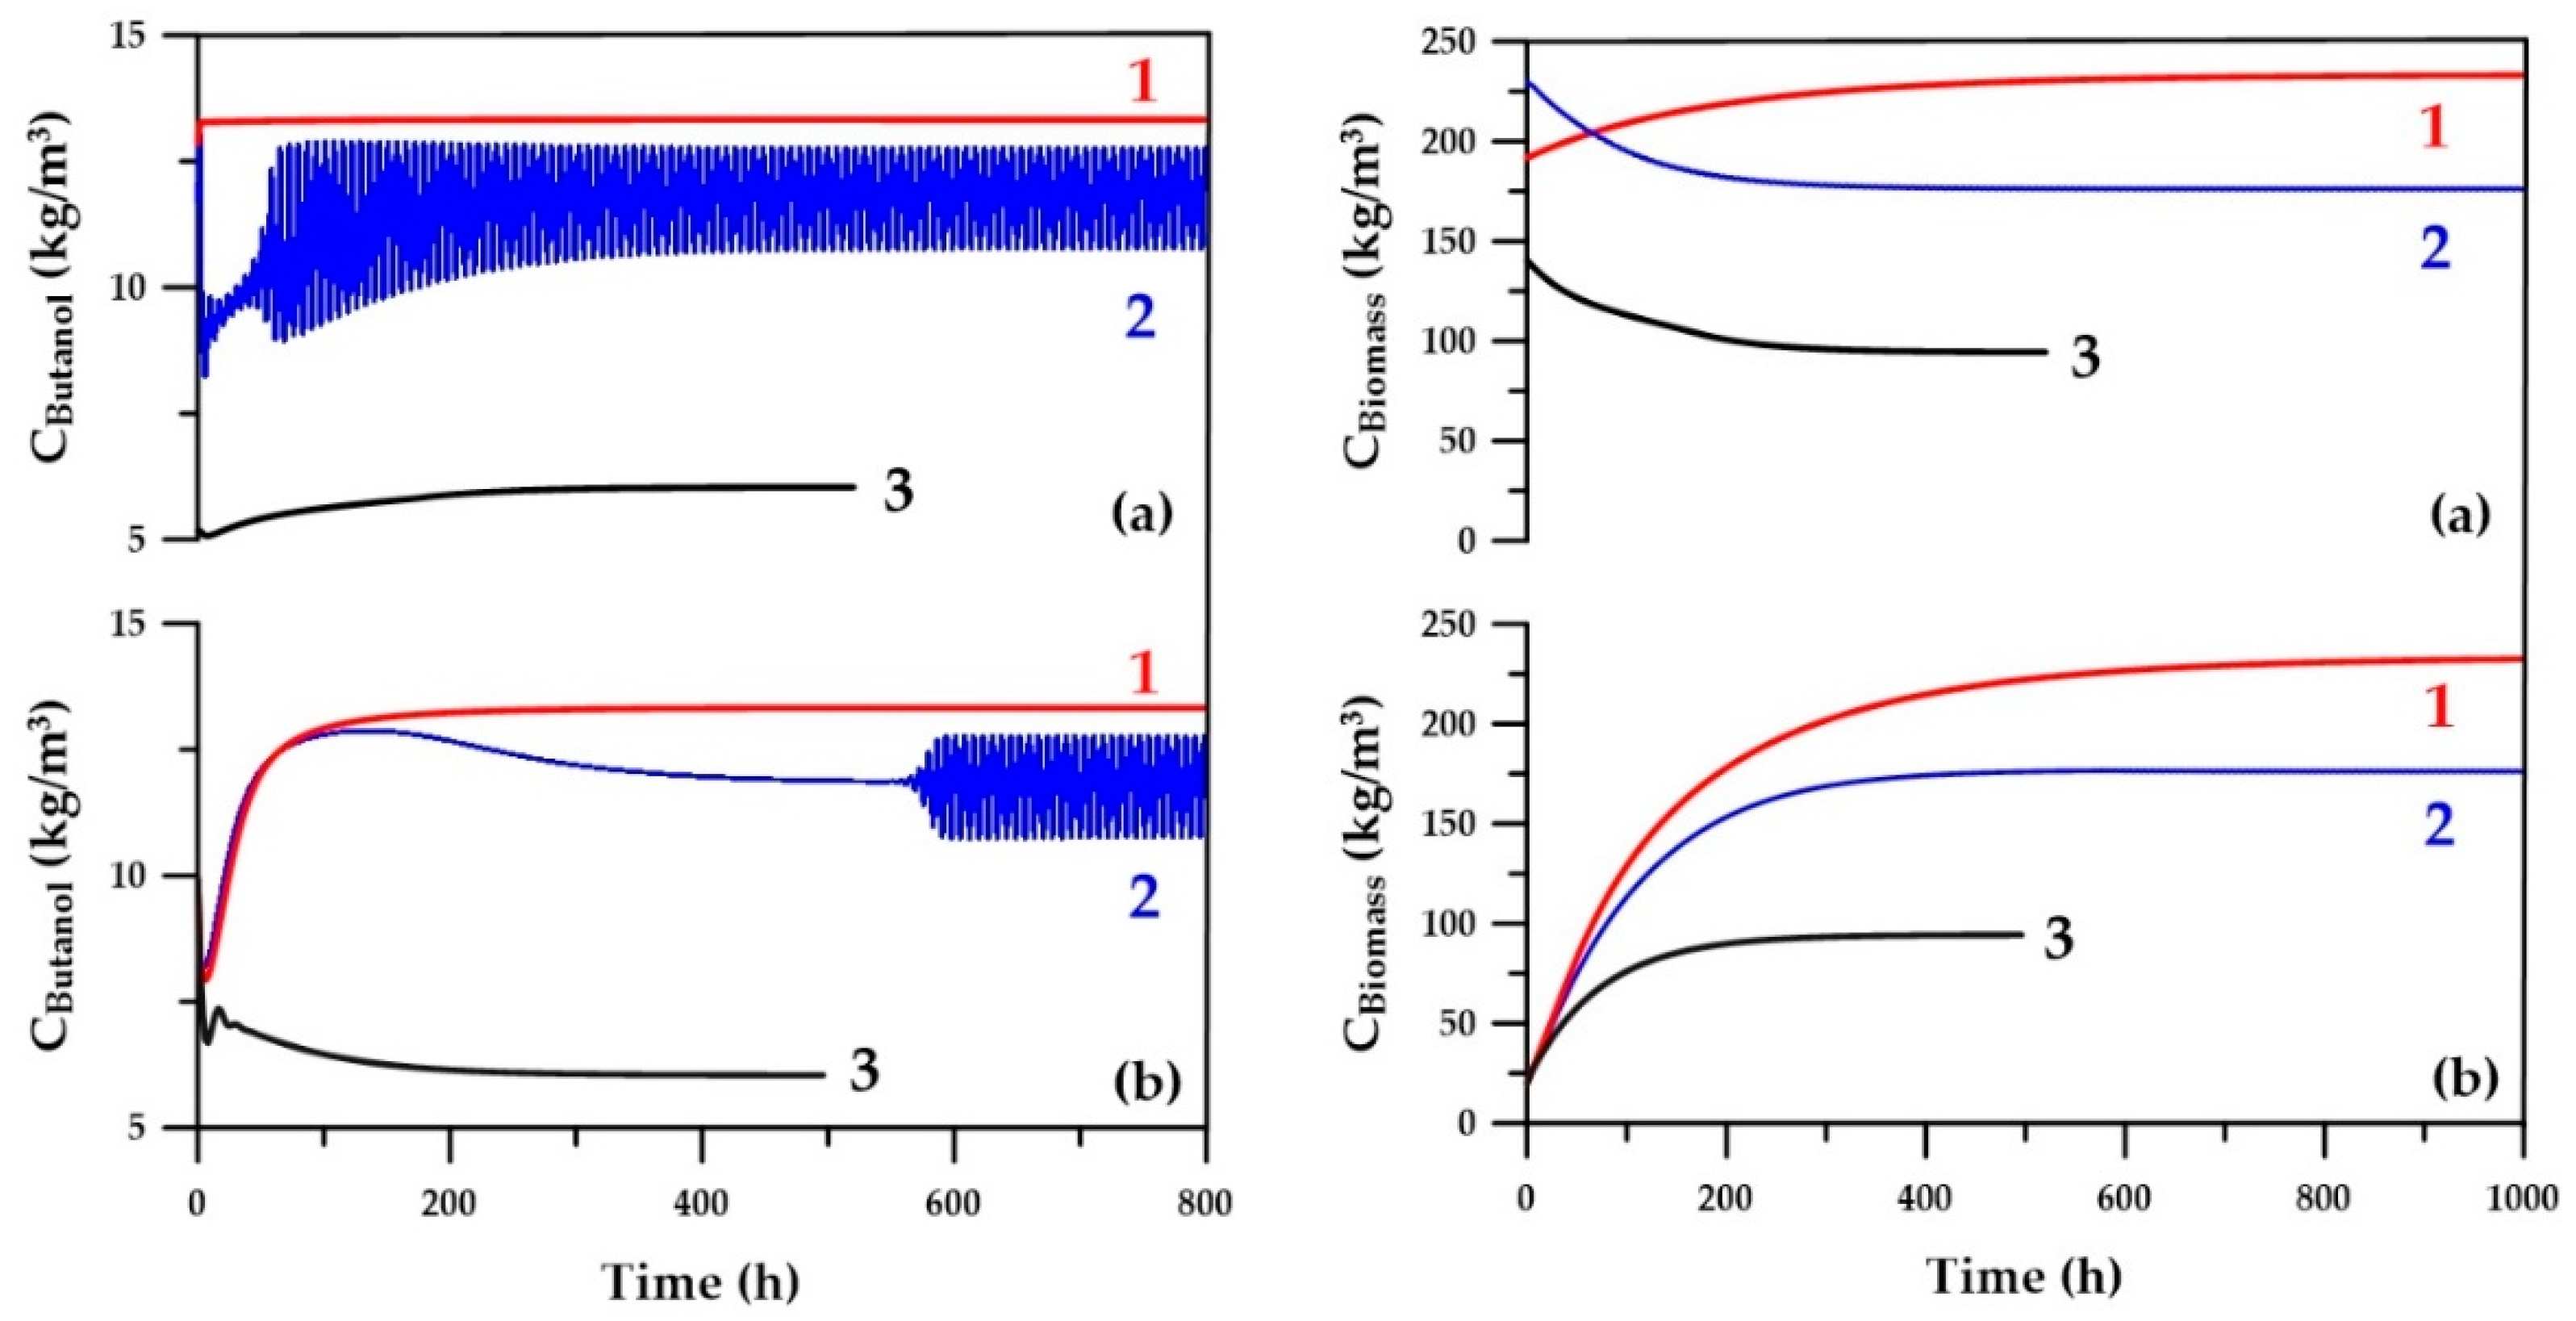
The use of ANN metamodels in strategy B for estimating the initial species concentrations is to accelerate the convergence to steady state. However, only mitigated results were obtained, the main reason being the stringent concentration tolerance for convergence, combined with the accuracy of ANNs. Figure 12 presents variation of butanol and microorganism concentration as a function of time. These results show that for many operating conditions, the time to convergence is significantly improved. For some operating conditions, the concentrations within the fermenter oscillate in a quasi-steady state. This phenomenon, referred to as a chemical feedback loop, sometimes occurs for some chemical systems, such as the oxidation of malonic acid by bromate ions catalyzed by cerium [23]. In the current fermentation system integrated with a pervaporation unit, the dynamics of production and consumption of intermediate metabolites, butyric and acetic acids, and the ABE solvents along with their partial recovery induces this oscillatory behavior under some particular decision variables. This oscillatory behavior prevents satisfaction of the convergence criterion, which was met when all concentrations within the fermenter did not change with time within a given tolerance. Under these conditions, the computation time was obviously longer; therefore, the average steady-state value of each concentration is determined by taking an average of the last segment of each respective curve in order to evaluate the objective functions. As shown in Figure 12, it would be possible to use a shorter simulation time in the case where initial species concentrations are estimated with an ANN.
5. Conclusions
In this investigation, in order to reduce the computation time for the optimization of continuous microbial butanol production, ANNs were used as metamodels of a phenomenological ABE fermentation process integrated with a membrane pervaporation unit. The proposed methodology for using ANNs as metamodels for optimization consists of (1) selecting a small set of experimental runs using uniform design; (2) using these experimental points in the phenomenological model to calculate the steady-state concentrations and performance criteria; (3) deriving eight individual ANNs to estimate the steady-state species concentrations and four ANNs to predict performance criteria from the set of decision variables; (4) using these ANNs as metamodels to circumscribe the Pareto domain in a multiobjective optimization genetic algorithm; (5) ranking all Pareto-optimal solutions to identify the optimal operating conditions; and (6) validating the optimal solution using the phenomenological process simulator or real process. In this investigation, this procedure was repeated with a reduced range of decision variables based on a Pareto domain that was obtained with a larger range, whereby a significant improvement in the prediction of the metamodels was observed.
Results show that the ANN metamodels representing the relationships between the decision variables and the objectives allowed for obtaining a relatively accurate Pareto domain and an optimal solution that was very close to the optimal solution as identified by the phenomenological process simulator. The time required to obtain the Pareto domain and the number of actual process simulations were orders of magnitude smaller. The proposed methodology is therefore deemed to be successful. On the other hand, using ANN metamodels to estimate initial species concentrations in the phenomenological process simulator did not lead to the expected reduction in computation time to achieve steady state because of the slow convergence, and sometimes oscillating behavior, of species concentrations.
Author Contributions
A.E., P.M. and J.T. collectively defined the methodology used to develop metamodels for the optimization of the integrated biobutanol process; A.E. tested the different dynamic models for the biochemical reactions in order to choose the most appropriate model; A.E. and J.T. selected the most suitable experimental uniform design to develop the most appropriate ANNs; J.T. performed the simulations to determine the Pareto domains and their rankings; A.E., P.M. and J.T. analyzed the data and wrote the paper.
Funding
The authors gratefully acknowledge financial support for this project provided by the Natural Science and Engineering Research Council of Canada.
Conflicts of Interest
The authors declare no conflict of interest.
References
- Thibault, J.; Filho, R.M.; Dias, M.O.S.; Junqueira, T.L.; Cavalett, O.; Jesus, C.D.F.; Rossell, C.E.V.; Bonomi, A. Simulation and multi-objective optimization of vacuum ethanol fermentation. In Proceedings of the 2nd International Conference on Simulation and Modeling Methodologies, Technologies and Applications (SIMULTECH 2012), Rome, Italy, 28–31 July 2012; pp. 79–86. [Google Scholar]
- Lanouette, R.; Thibault, J.; Valade, J.L. Process modeling with neural networks using small experimental datasets. Comput. Chem. Eng. 1999, 23, 1167–1176. [Google Scholar] [CrossRef]
- Lin, Y.; Zhang, Z.; Thibault, J. Comparison of experimental designs using neural networks. Can. J. Chem. Eng. 2009, 87, 965–971. [Google Scholar] [CrossRef]
- Green, E.M.; Boynton, Z.L.; Harris, L.M.; Rudolph, F.B.; Papoutsakis, E.T.; Bennett, G.N. Genetic manipulation of acid formation pathways by gene inactivation in Clostridium acetobutylicum ATCC 824. Microbiology 1996, 142, 2079–2086. [Google Scholar] [CrossRef] [PubMed] [Green Version]
- Friedl, A.; Qureshi, N.; Maddox, I.S. Continuous acetone-butanol-ethanol (ABE) fermentation using immobilized cells ofClostridium acetobutylicum in a packed bed reactor and integration with product removal by pervaporation. Biotechnol. Bioeng. 1991, 38, 518–527. [Google Scholar] [CrossRef] [PubMed]
- Millat, T.; Winzer, K. Mathematical modelling of clostridial acetone-butanol-ethanol fermentation. Appl. Microbiol. Biotechnol. 2017, 101, 2251–2271. [Google Scholar] [CrossRef] [PubMed] [Green Version]
- Liao, C.; Seo, S.-O.; Lu, T. System-level modeling of acetone–butanol–ethanol fermentation. FEMS Microbiol. Lett. 2016, 363. [Google Scholar] [CrossRef] [PubMed] [Green Version]
- Abdehagh, N.; Tezel, F.H.; Thibault, J. Separation techniques in butanol production: Challenges and developments. Biomass Bioenergy 2014, 60, 222–246. [Google Scholar] [CrossRef]
- Dong, Z.; Liu, G.; Liu, S.; Liu, Z.; Jin, W. High performance ceramic hollow fiber supported PDMS composite pervaporation membrane for bio-butanol recovery. J. Membr. Sci. 2014, 450, 38–47. [Google Scholar] [CrossRef]
- Azimi, H. Pervaporation Separation of Butanol Using PDMS Mixed Matrix Membranes. Ph.D. Thesis, University of Ottawa, Ottawa, ON, Canada, 2017. [Google Scholar]
- Mulchandani, A.; Volesky, B. Modelling of the acetone-butanol fermentation with cell retention. Can. J. Chem. Eng. 1986, 64, 625–631. [Google Scholar] [CrossRef]
- Shinto, H.; Tashiro, Y.; Yamashita, M.; Kobayashi, G.; Sekiguchi, T.; Hanai, T.; Kuriya, Y.; Okamoto, M.; Sonomoto, K. Kinetic modeling and sensitivity analysis of acetone-butanol-ethanol production. J. Biotechnol. 2007, 131, 45–56. [Google Scholar] [CrossRef] [PubMed]
- Buehler, E.A.; Mesbah, A. Kinetic study of acetone-butanol-ethanol fermentation in continuous culture. PLoS ONE 2016. [Google Scholar] [CrossRef] [PubMed]
- Ezeji, T.C.; Qureshi, N.; Blaschek, H.P. Microbial production of a biofuel (acetone–butanol–ethanol) in a continuous bioreactor: Impact of bleed and simultaneous product removal. Bioprocess Biosyst. Eng. 2013, 36, 109–116. [Google Scholar] [CrossRef] [PubMed]
- Halsall-Whitney, H.; Thibault, J. Multi-objective optimization for chemical processes and controller design: Approximating and classifying the Pareto domain. Comput. Chem. Eng. 2006, 30, 1155–1168. [Google Scholar] [CrossRef]
- Thibault, J. Net Flow and Rough Sets: Two Methods for Ranking the Pareto Domain. In Multi-Objective Optimization—Techniques and Applications in Chemical Engineering. Advances in Process Systems Engineering; Rangaiah, P.G., Ed.; World Scientific: Singapore, 2009; Volume 1. [Google Scholar]
- Lin, Y.; Zhang, Z.; Thibault, J. Aureobasidium pullulans batch cultivations based on a factorial design for improving the production and molecular weight of exopolysaccharides. Process Biochem. 2007, 42, 820–827. [Google Scholar] [CrossRef]
- Caballero, J.A.; Grossmann, I.E. An algorithm for the use of surrogate models in modular flowsheet optimization. AIChE J. 2008, 54, 2633–2650. [Google Scholar] [CrossRef]
- Fang, K.-T.; Lin, D.K.J.; Winker, P.; Zhang, Y. Uniform Design: Theory and Application. Technometrics 2000, 42, 237–248. [Google Scholar] [CrossRef]
- Yeung, K. The Uniform Design. Available online: http://www.math.hkbu.edu.hk/UniformDesign (accessed on 13 January 2018).
- Holeña, M.; Linke, D.; Rodemerck, U.; Bajer, L. Neural Networks as Surrogate Models for Measurements in Optimization Algorithms. In Proceedings of the International Conference on Analytical and Stochastic Modeling Techniques and Applications (ASMTA 2010), Cardiff, UK, 14–16 June 2010; Al-Begain, K., Fiems, D., Knottenbelt, W., Eds.; Springer: Berlin, Germany, 2010; pp. 351–366. [Google Scholar]
- Anna, H.R.S.; Barreto, A.G.; Tavares, F.W.; de Souza, M.B. Machine learning model and optimization of a PSA unit for methane-nitrogen separation. Comput. Chem. Eng. 2017, 104, 377–391. [Google Scholar] [CrossRef]
- Field, R.J.; Noyes, R.M. Oscillations in chemical systems. 18. Mechanisms of chemical oscillators: Conceptual bases. Acc. Chem. Res. 1977, 10, 214–221. [Google Scholar] [CrossRef]
Figure 1.
Schematic diagram of the butanol fermentation system integrated with a membrane pervaporation separation unit. Numbers correspond to process streams.
Figure 1.
Schematic diagram of the butanol fermentation system integrated with a membrane pervaporation separation unit. Numbers correspond to process streams.

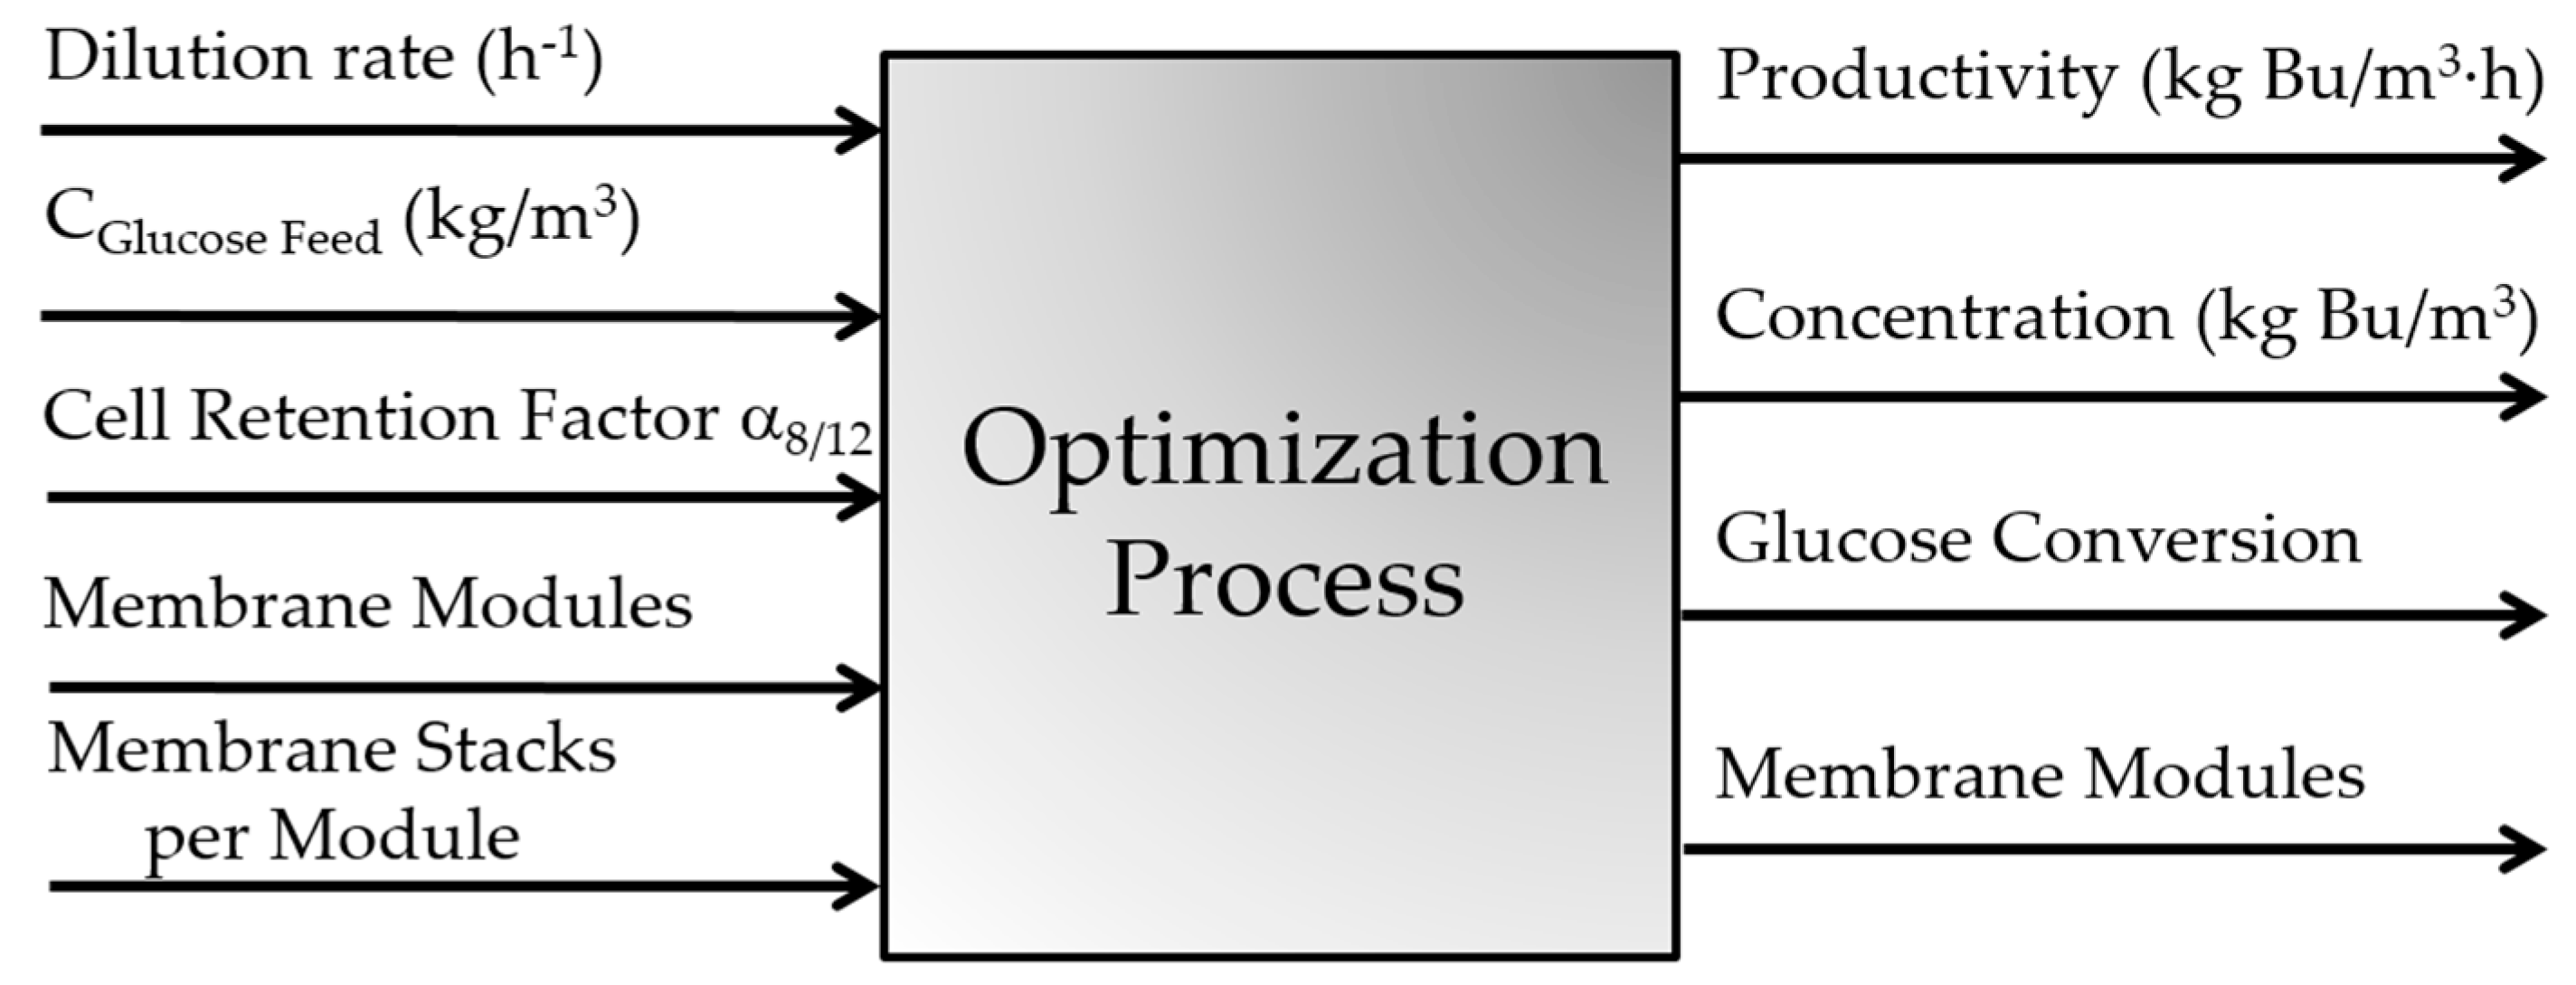
Figure 2.
Decision variables and objective functions defining the optimization process of the integrated biobutanol production process.
Figure 2.
Decision variables and objective functions defining the optimization process of the integrated biobutanol production process.

Figure 3.
Architecture of the artificial neural network (ANN) used for the modelling of the four objectives and eight initial species concentrations of the integrated fermentation–membrane pervaporation system.
Figure 3.
Architecture of the artificial neural network (ANN) used for the modelling of the four objectives and eight initial species concentrations of the integrated fermentation–membrane pervaporation system.

Figure 4.
Multiobjective optimization and analysis of the integrated fermentation–membrane pervaporation system flowchart: (A) ANN metamodels of the four objective functions; (B) process simulator with ANN metamodels providing the eight initial species concentrations; and (C) process simulator with arbitrary initial concentrations.

Figure 5.
Predicted versus actual butanol concentration within the fermenter under steady state for (a) initial ranges and (b) reduced ranges of the five decision variables.
Figure 5.
Predicted versus actual butanol concentration within the fermenter under steady state for (a) initial ranges and (b) reduced ranges of the five decision variables.

Figure 6.
Predicted versus actual butanol productivity for (a) initial ranges and (b) reduced ranges of the five decision variables.
Figure 6.
Predicted versus actual butanol productivity for (a) initial ranges and (b) reduced ranges of the five decision variables.

Figure 7.
Predicted versus actual overall process butanol concentration for (a) initial ranges and (b) reduced ranges of the five decision variables.
Figure 7.
Predicted versus actual overall process butanol concentration for (a) initial ranges and (b) reduced ranges of the five decision variables.

Figure 8.
Plots of the Pareto-optimal overall butanol concentration versus butanol productivity for the integrated fermentation–membrane pervaporation system: (a) ANN metamodels; (b) actual integrated acetone–butanol–ethanol (ABE) fermentation simulation.
Figure 8.
Plots of the Pareto-optimal overall butanol concentration versus butanol productivity for the integrated fermentation–membrane pervaporation system: (a) ANN metamodels; (b) actual integrated acetone–butanol–ethanol (ABE) fermentation simulation.

Figure 9.
Plots of sugar conversion versus butanol productivity for the integrated fermentation–membrane pervaporation system: (a) ANN metamodels; (b) actual integrated system simulation.
Figure 9.
Plots of sugar conversion versus butanol productivity for the integrated fermentation–membrane pervaporation system: (a) ANN metamodels; (b) actual integrated system simulation.

Figure 10.
Plots of the numbers of membrane modules versus butanol productivity for the integrated fermentation–membrane pervaporation system: (a) ANN metamodels; (b) actual integrated system simulation.
Figure 10.
Plots of the numbers of membrane modules versus butanol productivity for the integrated fermentation–membrane pervaporation system: (a) ANN metamodels; (b) actual integrated system simulation.

Figure 11.
Plots of feed sugar concentration versus dilution rate for the integrated fermentation–membrane pervaporation system: (a) ANN metamodels; (b) actual integrated system simulation.
Figure 11.
Plots of feed sugar concentration versus dilution rate for the integrated fermentation–membrane pervaporation system: (a) ANN metamodels; (b) actual integrated system simulation.

Figure 12.
Butanol and biomass concentration as a function of time with (a) initial concentrations predicted by ANNs and (b) arbitrary initial concentrations. (1) Best ranked solution; (2) medium-ranked solution; (3) lowest-ranked solution.
Figure 12.
Butanol and biomass concentration as a function of time with (a) initial concentrations predicted by ANNs and (b) arbitrary initial concentrations. (1) Best ranked solution; (2) medium-ranked solution; (3) lowest-ranked solution.


Table 1.
Initial and reduced ranges of the decision variables.
| Range | D (h−1) | So (kg/m3) | α8/12 | Nmod | NStack |
|---|---|---|---|---|---|
| Initial | 0.5–1.5 | 50–150 | 0.1–0.3 | 2–10 | 1000–2500 |
| Reduced | 0.5–1.4 | 50–125 | 0.1 | 4–10 | 2000–2500 |
Table 2.
Initial and reduced ranges of the decision variables.
| Objective | Relative Weight | Thresholds | ||
|---|---|---|---|---|
| Indifference | Preference | Veto | ||
| Butanol productivity | 0.35 | 0.75 | 1.50 | 3.00 |
| Butanol concentration | 0.35 | 0.75 | 1.50 | 3.00 |
| Sugar conversion | 0.25 | 0.04 | 0.08 | 0.16 |
| Number of membrane modules | 0.05 | 1.00 | 2.00 | 4.00 |
Table 3.
Decision variables and objectives of best solutions of Pareto domains with a population of 5000 individuals obtained with strategies A, B and C (see Figure 4).
Table 3.
Decision variables and objectives of best solutions of Pareto domains with a population of 5000 individuals obtained with strategies A, B and C (see Figure 4).
| Decision Variable/Objective | Strategy | |||
|---|---|---|---|---|
| A | B | C | ||
| Dilution rate D (h−1) | 0.51 | 0.51 | 0.50 | |
| Feed sugar concentration S0 (kg/m3) | 125 | 122 | 125 | |
| Cell retention factor α8/12 | 0.1 | 0.1 | 0.1 | |
| Number of membrane modules NMod | 7 | 7 | 7 | |
| Number of membrane stacks NStack | 2500 | 2480 | 2389 | |
| Butanol productivity (kg/m3∙h) | 10.95 1 | 12.14 2 | 12.10 | 11.83 |
| Butanol concentration (kg/m3) | 21.74 1 | 24.04 2 | 23.68 | 23.65 |
| Sugar conversion | 0.96 1 | 0.96 2 | 0.95 | 0.93 |
| Computation time (s) | 5.6 | 8353 | 14052 | |
| Number of actual model evaluations | 81 | 21573 | 21347 | |
1 Values determined by the genetic algorithm using the ANN metamodels. 2 Values determined by the phenomenological simulator for validation using decision variables of Column A.
© 2018 by the authors. Licensee MDPI, Basel, Switzerland. This article is an open access article distributed under the terms and conditions of the Creative Commons Attribution (CC BY) license (http://creativecommons.org/licenses/by/4.0/).
Share and Cite
MDPI and ACS Style
Elmeligy, A.; Mehrani, P.; Thibault, J. Artificial Neural Networks as Metamodels for the Multiobjective Optimization of Biobutanol Production. Appl. Sci. 2018, 8, 961. https://doi.org/10.3390/app8060961
AMA Style
Elmeligy A, Mehrani P, Thibault J. Artificial Neural Networks as Metamodels for the Multiobjective Optimization of Biobutanol Production. Applied Sciences. 2018; 8(6):961. https://doi.org/10.3390/app8060961
Chicago/Turabian StyleElmeligy, Ahmed, Poupak Mehrani, and Jules Thibault. 2018. "Artificial Neural Networks as Metamodels for the Multiobjective Optimization of Biobutanol Production" Applied Sciences 8, no. 6: 961. https://doi.org/10.3390/app8060961
Note that from the first issue of 2016, this journal uses article numbers instead of page numbers. See further details here.