Study on the Self-Monitoring of Bending Fatigue Cumulative Damage for Carbon Nanofiber Polyurethane Cement

1
School of Civil Engineering, Northeast Forestry University, Harbin 150040, China
2
Architecture and Civil Engineering School, Qiqihar University, No. 42, Wenhua Street, Qiqihar 161006, China
*
Author to whom correspondence should be addressed.
Appl. Sci. 2019, 9(10), 2128; https://doi.org/10.3390/app9102128
Submission received: 3 April 2019
/
Revised: 18 May 2019
/
Accepted: 20 May 2019
/
Published: 24 May 2019
(This article belongs to the Special Issue New Materials and Techniques for Environmental Science)
Abstract
:Polyurethane cement (PUC) is a kind of high-strength composite bending and strengthening material that is made by adding an appropriate amount of super fine aggregate, such as cement, into the polyurethane matrix. Carbon nanofiber polyurethane cement (CNFPUC) prepared by adding an appropriate amount of carbon nanofiber (CNF) can significantly reduce the resistivity of PUC. In order to reveal the change regulation of electrical resistivity of CNFPUC under fatigue load, the four-point bending fatigue life test of CNFPUC under different temperatures and stress levels was conducted by using a multifunction test device on a mixture of UTM-30 asphalt. The results showed that the resistivity increased slightly with the increase of bending strain in the process of the CNFPUC bending test, which presented a two-stage trend of a small increase and a sharp increase, and the maximum bending tensile stress was up to 26.65 MPa. Under periodic load, the resistivity increased with the increase of stress level and cycle times. When the damage amount reached 90%, the fatigue resistivity increased sharply, and with the increase of stress level, the effect of temperature on resistivity decreased gradually. This study may provide a theoretical basis for practical engineering applications.
1. Introduction
As a new reinforcing material being used in recent years, polyurethane cement (PUC) is a kind of high-strength composite made by adding an appropriate amount of superfine aggregate, such as cement, into a polyurethane matrix. By pouring PUC material at about the thickness of 25 mm onto the bottom of a concrete beam or onto the side of a concrete column, the concrete beam and the column will be subjected to force in coordination with the concrete beam and the column. This reinforcement method is between the external reinforcement method and the increasing section method, but the increased area of the cross-section is small, which has little effect on the structural appearance and the bridge clearance; this consequently has a good reinforcement effect [1,2,3,4]. Compared with traditional reinforcing methods, this method has the advantages of having strong adhesion to the concrete as well as good fluidity, and it is environmentally friendly, light weight, high in toughness, and easy for use in construction, etc. PUC composite has been gradually applied to the reinforcement and renovation of concrete bridges and pier columns [5,6,7]. However, the reinforcement is limited to the improvement of strength, stiffness, and durability. With the gradual improvement of the reliability requirements of the structure, it is urgent that methods to monitor and evaluate the safety conditions of the strengthened bridges be adopted and that a timely diagnosis be made regarding the health condition of the strengthened bridge during the period of service [8,9].
Ordinary PUC materials do not have electrical conductivity. After adding an appropriate amount of carbon nanofiber (CNF) into PUC material, a carbon nanofiber polyurethane cement (CNFPUC) composite would not only improve its mechanical properties but also enhance its ductility, crack resistance, and durability, and it would significantly reduce the resistivity of PUC. Under the action of external forces, the elastic modulus is small. It is not only possible to form the first line of defense against the external load but also to monitor the change of resistivity in the CNFPUC material. The self-induction of stress and strain of the reinforced structure is achieved, and the development process of internal damage of CNFPUC is present [10,11]. The function of self-sensing, self-diagnosis, and self-monitoring of a component is established by using the super bond capacity between the CNFPUC and the concrete, the assumption of the plane section, and the relation of elastic modulus to strengthening. Therefore, the CNFPUC composite material could be used as a load-bearing reinforcement material and a functional material to diagnose and monitor the bridge, which has the double effect of strengthening and monitoring [12]. Therefore, it can not only prolong the service life of a bridge in service and enhance the seismic effect of the structure, but it can also monitor the development and change of the internal damage of the bridge in real time, save a great deal of manpower, material, and financial resources, and improve the safety and the reliability of the bridge [9,12].
Bridges strengthened by CNFPUC are usually subjected to random or periodic repeated loads during their service. Under the action of fatigue load, the fatigue accumulative damage degenerates the bearing capacity of the CNFPUC and concrete components, increases the stiffness attenuation and deformation, and affects the normal service and even safety [13,14]. How to easily monitor the damage of the bridge under fatigue load and then take effective measures to maintain and strengthen the bridge structure is the key to ensuring safe operation of the bridge. Therefore, it is very important for bridge self-monitoring to study the rules of cumulative fatigue damage and resistivity change of the CNFPUC material [15].
Xu ZH et al. [16] reported the possibility of damage during the fatigue loading of the intelligent carbon fiber concrete by the resistivity method. The accumulative damage of a carbon fiber concrete specimen under fatigue load destroys the local conductive network near the microcrack, which leads to the increase of the whole volume resistivity. Resistance measurement has a great potential role for damage monitoring and the evaluation of carbon fiber reinforced concrete in the whole fatigue process. One study reported that electrical resistance change (ERC) may provide real-time monitoring and qualitatively estimate bending fatigue damage evolution of carbon fiber composites [17]. The degree of disorder of the resistance change increases with the increase of the stress level. The shape of the resistance change rate–fatigue cycle curve can reflect the stress level and the damage type of a specimen. By observing the change of direct current resistivity of carbon fiber polymer matrix composites, it was found that the resistance decreases irreversibly due to the damage of the matrix at the adjacent fiber junction, which increases the probability of adjacent fiber contact in the initial stage of fatigue loading [18]. As the fatigue increases, the resistance increases, but the degree of increase is diminished. Sevostianov I et al. [19] carried out tensile fatigue tests on a 2024-T3 aluminum plate specimen and revealed the decrease in strength due to cumulative damage and the relationship between the resistance variation of the damaged specimen and the electromechanical impedance (EMI) response. The change of EMI and resistance were used to monitor the local electrical properties in order to evaluate the decrease of the material strength. Moreover, an evaluation model for fatigue damage, EMI response, and resistance change was established. In the above fatigue tests, whether under tensile or bending conditions, the volume conductivity of polymer or cement-based composites decreases irreversibly with the increase of fatigue times [15,20]. Therefore, this phenomenon can be used to monitor the fatigue cumulative damage.
As far as we know, there are few reports of fatigue damage between resistivity and cycle times at different temperatures and stress levels for conductive polymer-based intelligent reinforcement materials. In this paper, CNFPUC was taken as the research object; the variation of resistivity was measured in the bending condition at different temperatures by UTM-30 asphalt mixture multifunctional test equipment. Four-point bending fatigue life tests at different stress levels were carried out at corresponding temperatures to study the relationship between the fatigue cumulative damage and the resistivity change.
2. Materials and Experimental Methods
2.1. Materials
The CNFPUC composite is a kind of intelligent reinforcing material with polyurethane (PU) as a cementitious material, cement and silica fume as fine aggregates, and it is widely used in concrete reinforcement.
2.1.1. Polyurethane Material
For this study, the isocyanate WannatePM-200 was produced by Wanhua Chemical Group Co., Ltd. in Shanghai, and the combined polyether ES-305 was produced by Yisheng Polyurethane Co., Ltd. in Zibo. The main physicochemical properties can be seen in Table 1.
2.1.2. Fine Aggregate
Cement and silica fume were used for the fine filling aggregate. The cement used was 42.5 ordinary Portland cement produced by the Harbin Yatai cement factory (Harbin, China). The initial setting time was 185 min, and the final setting time was 265 min. The silica fume was provided by the Xinlei Mineral Powder Processing Plant in Xingtang county of Shijiazhuang City, China. The specific surface area was 1.5 × 10⁴ m2/kg, and the silicon content was greater than 96%. The composition of the cement and the silica fume are presented in Table 2. The cumulative pass rates of the cement and the silica particles are presented in Table 3.
2.1.3. Conductive Filler
The carbon nanofibers were manufactured by Nanjing Xian Feng Nanomaterials Technology Co., Ltd. (Nanjing, China) (see Table 4).
2.1.4. Mix Proportion of the Concrete
CNFPUC is usually used to strengthen the tensile zone of the bottom of concrete beams. In order to test the change of resistivity under the condition of CNFPUC bending and tension, we poured a certain thickness of CNFPUC material in the tensile zone of concrete beams for bending and fatigue tests.
The strength grade of the reinforced concrete was C40. The cement and the silica fume compositions were the same as the above material. The coarse aggregate was from gravel produced in the Acheng quarry of Harbin City, Heilongjiang Province. The particle size of coarse aggregate was 5–20 mm continuous gradation, the test sand was from Songhua River, and the fineness modulus was 2.75, which belonged to the middle sand of II regional gradation. The water reducer was a kind of polycarboxylic acid high-performance water reducer produced by Harbin Institute of Technology Qiangshi Group. The appearance of the water reducer was a brown microemulsion solution, and the water reduction rate was up to 40%. The concrete mix ratio can be seen in Table 5.
The prismatic trabecular beams with the sizes of 250 mm × 30 mm × 25 mm and 380 mm × 63.5 mm × 35 mm were poured with the above mix ratio. To ensure the bonding effect, the bottom of the beam bonded to CNFPUC was roughened, the concrete surface was removed from the slurry and loose parts, and the coarse aggregate was exposed and dried for reserve.
2.2. Preparation of CNFPUC Specimen
First, the CNFs were dried to a constant weight at 120 °C to remove the moisture absorbed during storage. Next, the surfaces of the CNFs underwent oxidation treatment, where they were immersed in a mixture of concentrated sulfuric acid and concentrated nitric acid (1:3 by volume) for 2 h and subsequently washed in clear water and dried at 120 °C [21,22]. Then, the cement was baked (relative humidity of less than 20%) for 1 h at high temperature (500 °C) to remove free water and seal reserve. Using a high-precision electronic scale (accurate to 0.001 g), an accurately weighed CNF was added to the weighed polyol and then dispersed for 1 h at 60 °C with a Ningbo Xinzhi scientz-750F ultrasonic dispersion instrument. Then, the composite polyether mixed with CNF was dried at 120 °C for 2 h (the vacuum degree was 0.1 MPa), and then it was quickly added into the weighed cement. This was placed into a JJ-5 planetary cement mortar mixer and rotated at low speed for 30 s, and then the isocyanate was added evenly and stirred at high speed for 60 s. The silica fume was added slowly into the mixing process. Finally, the stirred CNFPUC was poured into a mold coated with a few mold-release agents. Continuous vibration was needed during the molding process in order for the bubbles to gather and escape (see Figure 1a). After 24 h, the mold was removed, and the mix was cured at room temperature for 3 days. The experimental temperature was 14–17 °C, and the relative humidity was 30–50%. The ratio of the components can be found in Table 6. According to the existing experimental results, the content of CNF was in the seepage zone, and the CNFPUC had good sensitivity characteristics [23].
2.3. Experimental Methods
2.3.1. Bond Test
To test the bond performance between CNFPUC and concrete, the concrete was cut into 100 mm × 100 mm × 100 mm cubes by a concrete cutting machine. The concrete was exposed to the aggregate, and the floating ash on the concrete surface was removed. Then, a mold was made with an internal cavity of 50 mm × 50 mm × 50 mm. The mold was placed on the concrete block to ensure the mold was perpendicular to the surface of the concrete and the superfluous stress was avoided. An 80 mm bolt was placed in the mold to ensure the center of the bolt corresponded to the center of the concrete test block. Finally, the CNFPUC material was poured into the mold, and the mold was removed after 7 days. Six of the same test blocks were produced. The block sizes are shown in Figure 1b.
2.3.2. Bending Test
On the bottom of the treated 250 mm × 30 mm × 25 mm concrete trabeculae, a 10 mm thickness of CNFPUC mixture was poured, and a 10-mesh copper mesh electrode with a size of 20 mm × 30 mm was embedded in the concrete mixture, as shown in Figure 2. As a part of “JTG E20-2011 Standard Test Methods of Bitumen and Bituminous Mixtures for Highway Engineering”, the bending test specimen dimension based on “T0715-2011 Bituminous Mixtures Bending Test”, and the size of the specimen after pouring CNFPUC was 250 mm × 30 mm × 35 mm.
The four-electrode method was used in the loading process [20,24,25,26,27]. The bending resistance test was carried out with the outer two electrodes as the current poles and the inside two electrodes as the voltage poles; the test power supply adopted a 0–60 V 5 A adjustable direct current (DC) voltage regulator to provide a constant current by the UT61E digital multimeter (Dongguan Youlide Technology Co., Ltd., Dongguan City, China), which recorded voltage changes during loading in real time, as shown in Figure 3. The resistivity between the inner two electrodes was calculated by the formula ρ = RS/L. The LVDT displacement sensor was set in the middle of the span, and three resistance strain gauges were pasted equally at the center of the bottom span of the beam. The type of the strain gauges was BX120-3AA, and the dimension (base length × base width) of the strain gauges was 6.6 × 3.6 mm. Using the DH5921 dynamic stress–strain test and analysis system (Jiangsu Donghua Test Technology Co., Ltd., China) to test the strain variation of CNFPUC during loading, the calculated results were taken as the average.
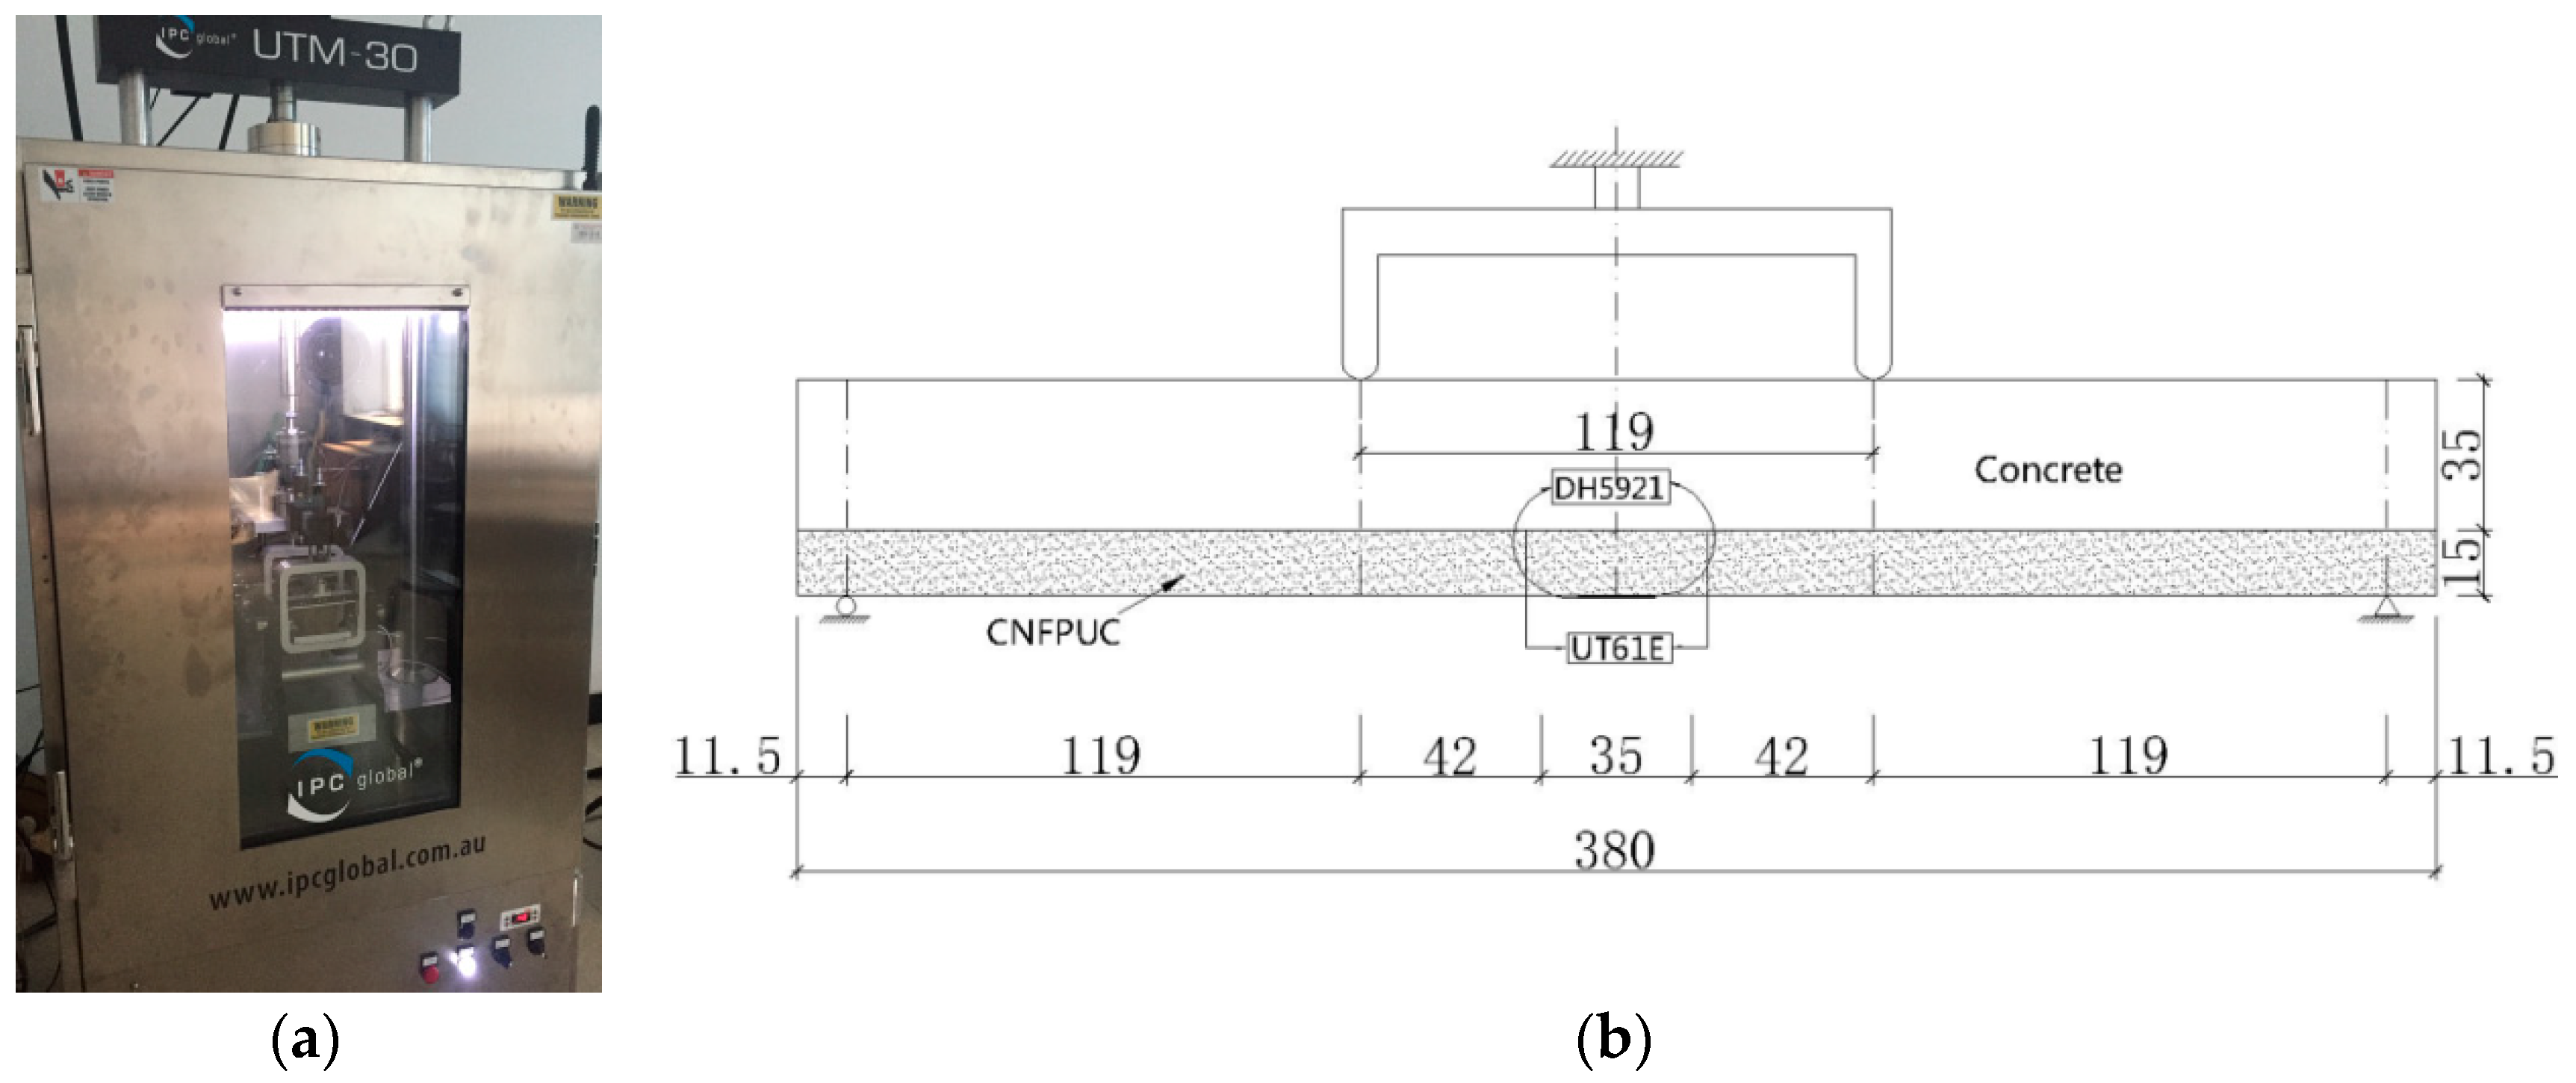
The test device was the UTM-30 test system produced by IPC Company of Australia. The maximum loading force was 30 kN, the displacement sensor range was 0–50 mm, the temperature control range of the test environment box was −50–100 °C, and the loading rate was 50 mm/min. The variations of resistivity with strains at −40 °C, −20 °C, 0 °C, 20 °C, and 40 °C were tested. The formulas involved were as follows:
RB—Flexural tensile strength of specimen under failure (MPa);
εB—Maximum flexural tensile strain of specimen under failure (με);
SB—Flexural stiffness modulus of specimen under failure (MPa);
b—Width of span center across (mm);
h—Height of span center across (mm);
L—Span of specimen (mm);
PB—Maximum load on specimen failure (N);
d—Mid-span deflection of specimen under failure (mm).
Three parallel tests were carried out under the same test conditions, and the results of the parallel tests were discarded according to the discrete degree of the test data. The standard of abandonment deviation is: when the difference between one of the measured values and the average value of a group of specimens is more than 1.15-times greater than the standard deviation, the test data should be rejected; at the same time, there should be no less than three valid specimens in each set of the tests.
2.3.3. Four-Point Bending Fatigue Test
The 15 mm thickness of the CNFPUC material was poured on the bottom of treated concrete beams. According to the industry standard of China “JTG E20-2011 Standard Test Methods of Bitumen and Bituminous Mixtures for Highway Engineering” and the four-point bending fatigue dimension based on “T 0739-2011 Four-point Bending Fatigue Life Test of Bituminous Mixtures”, the size of the specimen after pouring CNFPUC was 380 mm × 50 mm × 63.5 mm. At the same time, a 10-mesh copper mesh electrode with a size of 25 mm × 40 mm was embedded in the specimen. The electrode position is shown in Figure 4b. The resistance changes during fatigue loading were measured by using the UT61E digital multimeter, and the resistivity between the two electrodes was calculated by the formula ρ = RS/L [28]. Three resistance strain gauges were pasted equally at the middle of a pure curved section of the beam bottom span. The dynamic stress–strain test and analysis system of DH5921 were used to test the bending tensile strain variation of CNFPUC during the fatigue process, as shown in Figure 4a.
Using a four-point bending fatigue fixture with a UTM-30 test system, the loading frequency was 10 Hz, and the constant strain control mode of continuous partial sine loading was adopted. Based on the constant strain controlled mode of continuous partial sine loading, the fatigue stress levels at corresponding ambient temperatures were determined to be 0.6, 0.7, and 0.8, respectively, by the bending test results. The loading waveform was a half sine wave; the test termination condition was the number of loading cycles in which the bending stiffness modulus was reduced to 50% of the initial bending stiffness modulus, and the stress ratio was 0.1. The maximum fatigue strain, fatigue cycle number, load size, specimen displacement, and maximum tensile stress on the bottom of the specimen were recorded in real time and then calculated. The maximum tensile stress was determined according to formula:
σt—Maximum tension stress (Pa);
L—Beam span, i.e., the distance between two clamps at the outer end (m);
P—Peak load (N);
w—Beam breadth (m);
h—Beam depth (m).
The maximum tensile strain formula is:
εt—Maximum tensile strain (m/m);
δ—Beam center maximum displacement (m);
a—Adjacent chuck center spacing.
Bending stiffness modulus: .
The relationship between the macroscopic phenomenon of the specimen at each fatigue stage was observed in detail, especially the formation and the propagation of the macro crack, the complete failure of the specimen, the number of cycles, the stress levels, and the temperatures of the specimens. Six parallel tests were carried out under the same test conditions, and when the difference between one of the measured values and the average value of a group of specimens was more than 1.82-times greater than the standard deviation, the test data were rejected. At the same time, there should have been no less than six valid specimens in each set of tests.
3. Results and Discussion
3.1. Direct Bond Tensile Strength
The test results of the direct tensile bond between the CNFPUC material and the concrete are shown in Table 7.
The bond strength between the CNFPUC and the concrete was greater than that of the concrete material itself. The cohesional strength between CNFPUC and concrete was greater than 3.47 MPa. Bond failure occurred in the concrete material itself during the tensile process. The failure interface did not occur on the interface between the concrete and the CNFPUC material, which indicated that the CNFPUC material had good bonding performance with the concrete.
3.2. Bending Test
3.2.1. Stress–Strain Curves under Static Loading
The initial crack of CNFPUC under bending load occurred at the bottom of the maximum tensile stress. As shown in Figure 5, the stress–strain curves of CNFPUC at different ambient temperatures showed that, with the increase of ambient temperature, the deformation of CNFPUC under the same static load increased, the peak failure strain increased, the ultimate flexural tensile strength decreased, and the flexural tensile modulus decreased slightly. The bending tensile strain was 5100–6000 με, and the ultimate strength was up to 26.65 MPa.
According to experimental observations, the CNFPUC bending tensile stress and strain curve could be divided into three stages. The slope of each stage was fitted linearly, and the results are shown in Table 8. Stage I: The strain range was between 0–1000 με, the stress increased linearly with the increase of strain at various ambient temperatures, the range of variation was high, and the slope of each curve had almost no change with the increase of temperature. The data points fell within the range of one time the standard deviation. Stage II: The strain range was between 1000–2000 με. Compared with Stage I, the stress at various ambient temperatures increased linearly with the increase of strain, and the increase reduced. The slope decreased slightly with the increase of temperature. Stage III: The strain range was from 2000 με to specimen failure. The slope decreasing amplitude of stress–strain curves increased significantly at various ambient temperatures. The curve was relatively flat and had a tendency towards plasticity. The slope of the curve decreased more obviously with the increase of temperature. The data points were discrete. The tensile strength of −40 °C was close to the glass transition temperature, the tensile strength was increased, and a small part of the data points fell outside one time the standard deviation. As the temperature increasing, the cementitious action decreased, the strength weakened, and the deformation increased. When the temperature reached 40 °C, the molecular chains of polyurethane elastomers had lower potential energy, more flexibility, and more space of movement of chain segments between molecules. Under the same stress condition, the corresponding strain was larger. Additionally, under the same strain condition, a relative stress of 40 °C was lower than that of other temperatures.
Different from the brittle failure of plain concrete, the neutral axis of the member decreased after the plain concrete bottom bonded to CNFPUC. In the process of loading, CNFPUC limited the development of concrete cracks and delayed the time of cracking at the lower edge of concrete. Because the elastic modulus of CNFPUC was lower than that of concrete, cracks first appeared at the lower edge of concrete and gradually extended to the neutralizing axis. After that, vertical cracks began to appear in the underside of the CNFPUC, and eventually transverse fractures occurred on the bottom of the CNFPUC and broke away from the concrete, as shown in Figure 6.
3.2.2. Resistivity Strain Curve under Static Load
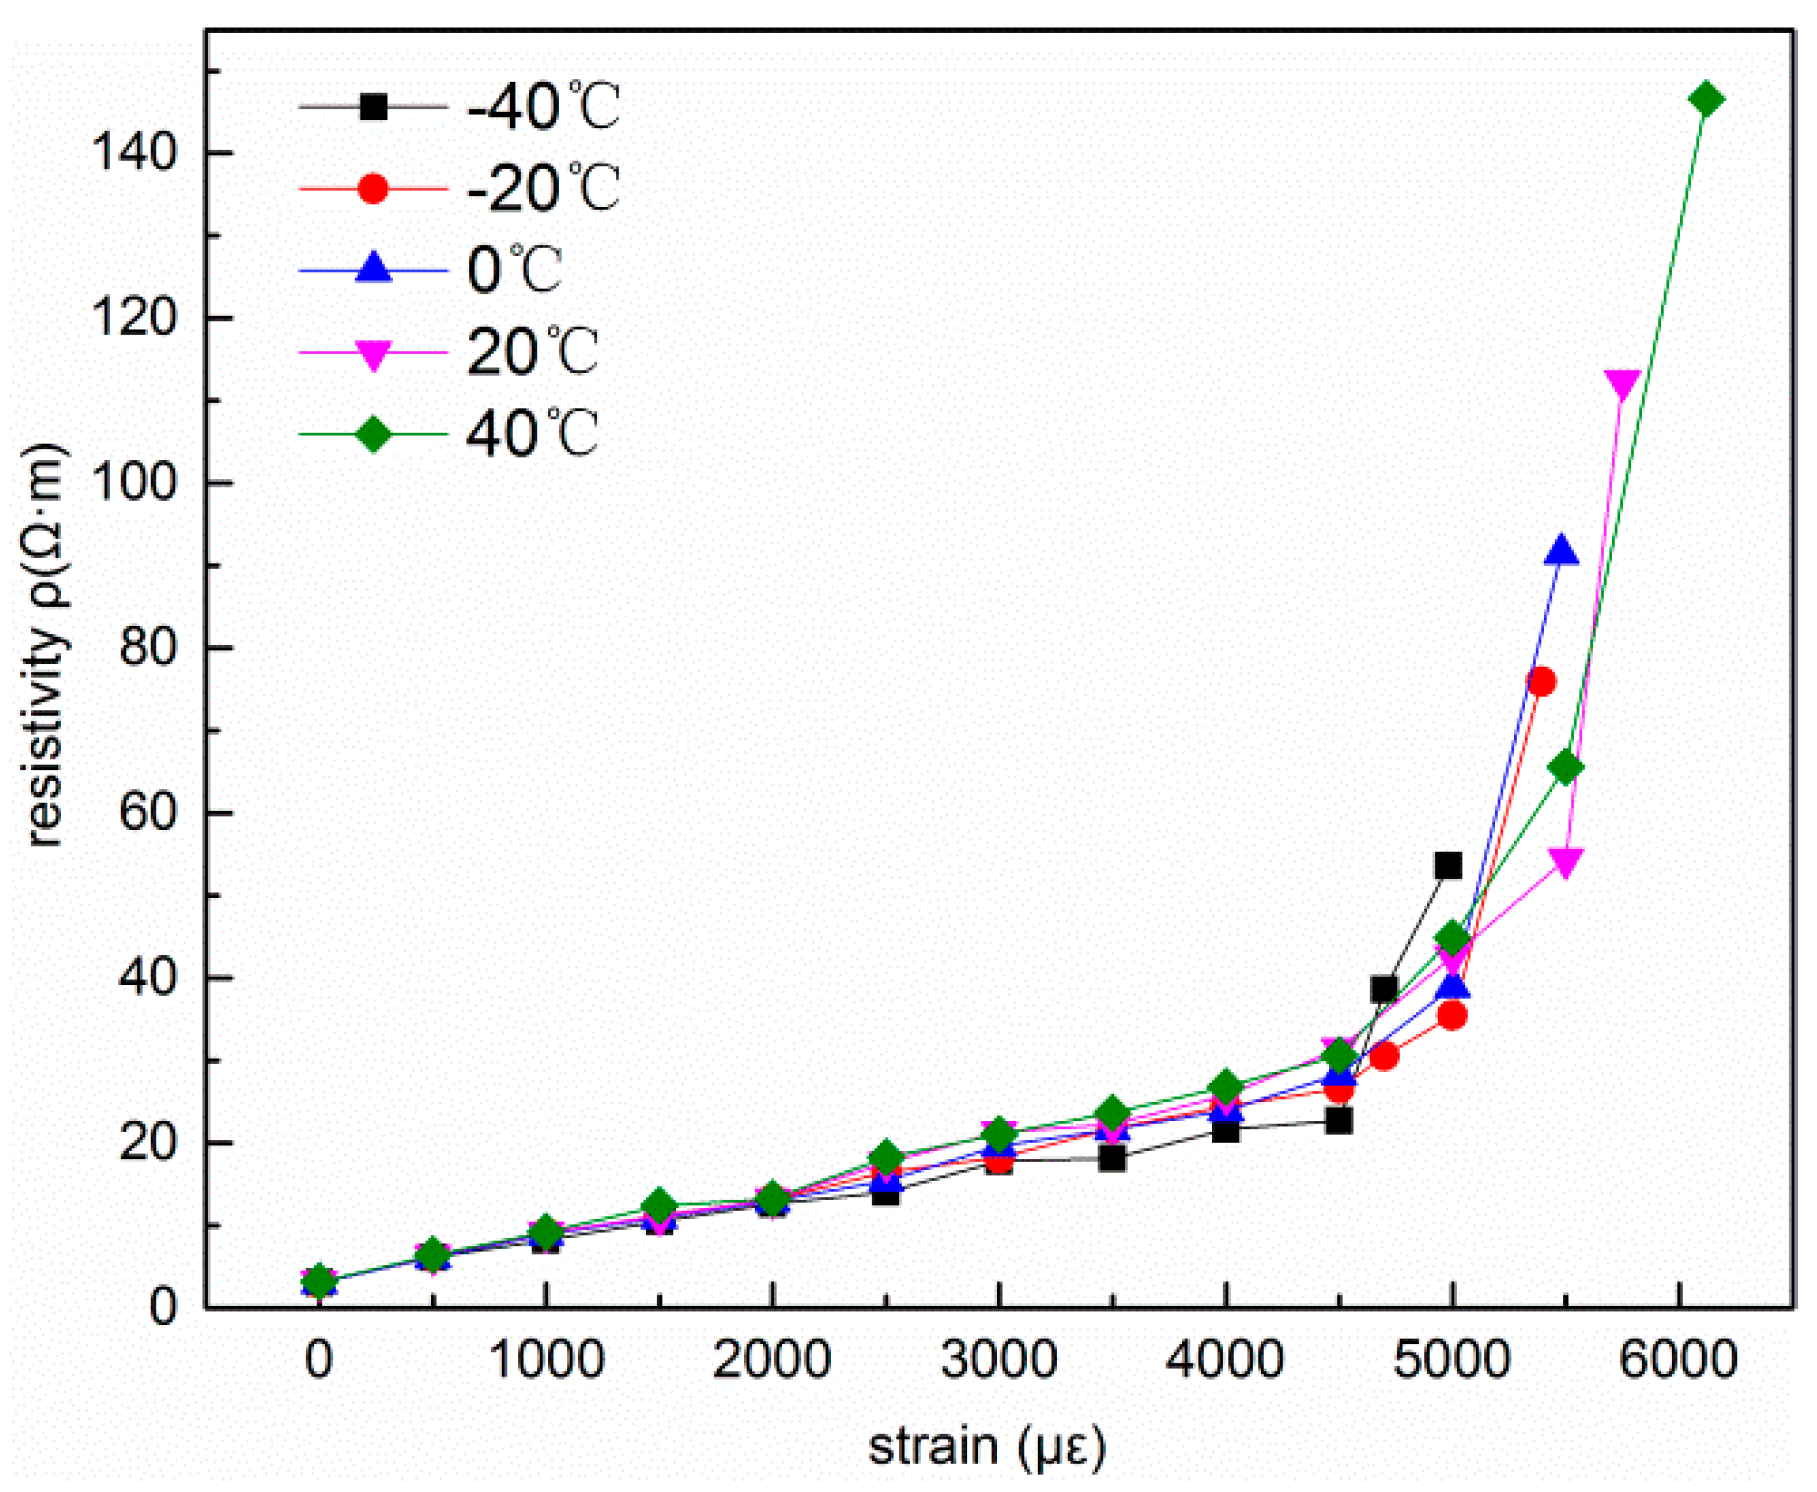
In Figure 7, the curves were roughly divided into two stages. Stage I: The strain range was between 0 μ and 5000 μ (the strain range of −40 °C curve was 0~4500 μ). The resistance increased linearly with the increase of strain at all ambient temperatures, and the increasing amplitude was low. Stage II: The strain level began at 5000 μ (the strain range of −40 °C curve began at 4500 μ). The electrical resistance increased geometrically with the increase of strain at each ambient temperature until the specimen was destroyed. At −40 °C ambient temperature, the tensile strength and the modulus of CNFPUC were close to the glass transition temperature, the deformation properties were decreased, and the starting point of the second stage was earlier than other temperatures.
3.2.3. Mechanism Analysis
The content of CNF in CNFPUC was located in the seepage zone, thus the CNF overlapped with each other to form a three-dimensional grape-like network conductivity pathway. With the increase of strain, the interfacial degumming phenomenon and partial fiber pullout appeared between CNF and the polyurethane matrix, which destroyed the lap-over network between CNFs. At this time, the resistivity increased gradually. When the strain was close to the limit, the microcracks developed into main cracks, and the CNF fibers had few lap connections, thus the resistivity rose sharply until fracture. Through the change of resistivity in the bending process of CNFPUC, the three failure processes of elastic deformation, stable crack propagation, and unstable propagation were reflected [23].
3.3. Four-Point Bending Fatigue Test
3.3.1. Four-Point Bending Fatigue Test Results
The failure forms of the bending fatigue specimens were all flexural and tensile failure of CNFPUC under fatigue load. The fatigue life of CNFPUC tested at different ambient temperatures and different stress levels is shown in Table 9. Six effective test blocks were at different ambient temperatures per stress level. The fatigue life was arranged from small to large. It could be seen that, under the same stress level, the fatigue life decreased with the increase of the temperature, and the fatigue life decreased with the increase of the stress level at the same ambient temperature.
The fatigue life of CNFPUC was sensitive to temperature. With the increase of temperature, the hydrogen bond in the elastomer was gradually dissociated, which led to the decrease of physical cross-linking density. Then, the effective cross-linking density of elastomer decreased, and the gelation effect weakened, resulting in a reduction in fatigue life. Compared with temperature, stress level had great influence on fatigue life.
3.3.2. Fatigue Equation of Two-Parameter Weibull Distribution
Due to the discreteness of the CNFPUC material during preparation and fatigue tests, to get a more reliable result with a smaller sample, the test results could only be analyzed by means of scientific and reasonable statistical methods. In this paper, the Weibull distribution of two parameters was used to analyze the fatigue life distribution of CNFPUC [14,29,30,31,32].
The probability density function of a two-parameter Weibull distribution is:
b—Weibull shape parameter;
Na—Characteristic lifetime of Weibull distribution.
According to Equation(1), the distribution function of the Weibull variable F (Np) is obtained:
The reliability p can be obtained from the failure probability distribution function P(N < Np):
Expression (2) can be changed: , and the two sides can be obtained by taking the second natural logarithm: ,
Therefore:
In this formula: ; ; .
Equation (3) is a linear equation; b and β can be obtained directly from the straight line, thus two parameters of the Weibull distribution can be obtained. Equation (3) can be used to verify the hypothesis of whether a set of test data obeys the two-parameter Weibull distribution. If the regression analysis of the test data shows that there is a good statistical linear relationship between Y and X, the hypothesis will be true and vice versa. The k numbers fatigue test data obtained under a given stress level were arranged in order from small to large. The sequence number is i, and the reliability factor p corresponding to fatigue life Np is calculated by Equation (4):
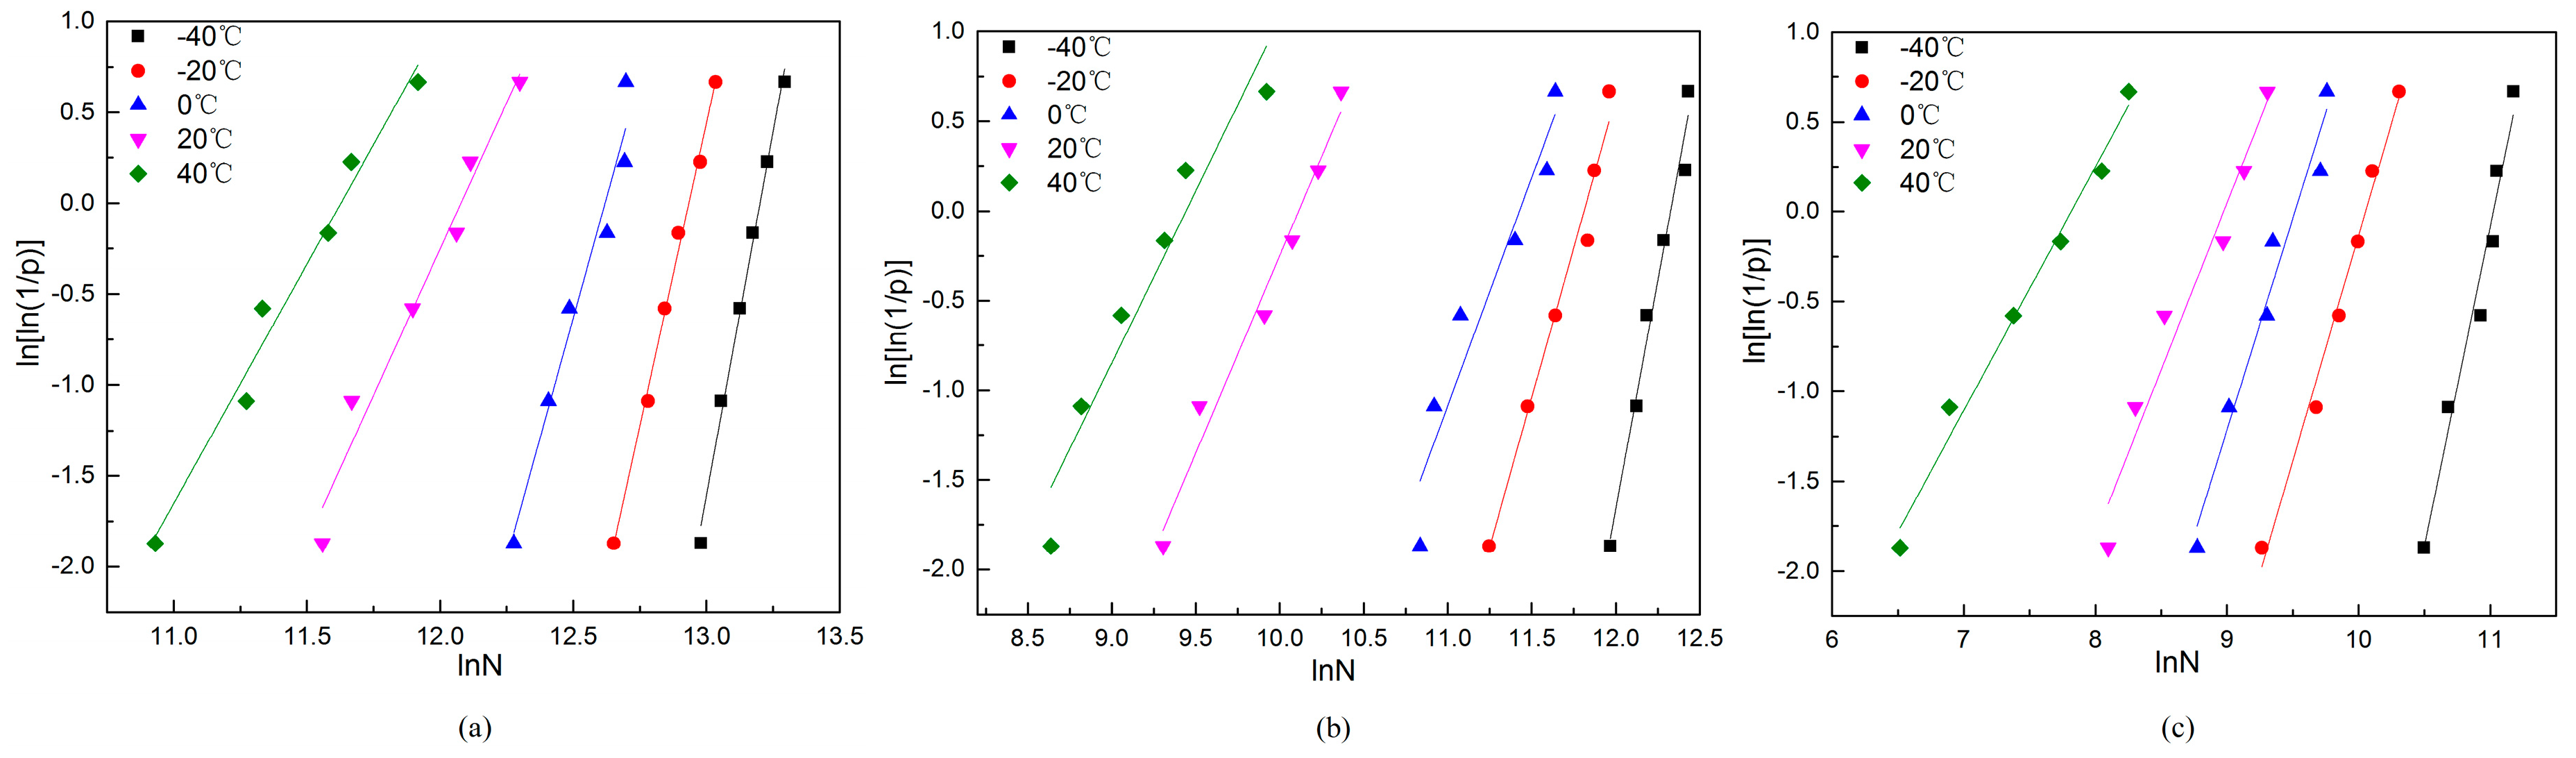
The fatigue test results in Table 9 were tested for the Weibull probability distribution at various stress levels. According to Equation (4), the survival rate p and of CNFPUC specimens at various stress levels were calculated. The fatigue test results were tested for the Weibull probability distribution at various ambient temperatures and stress levels, as shown in Figure 8.
Table 10 shows the regression coefficients and the correlation coefficients of various ambient temperatures and stress levels obtained by regression analysis of fatigue data. It can be seen from the regression analysis that the slope decreased with the increase of temperature at the same stress level, indicating that the dispersion of fatigue life increased with the increase of temperature. CNFPUC had a good statistical linear relationship between the ln[ln(1/p)] and lnN at the stress levels and ambient temperatures, and the corresponding determination coefficient R2 was above 0.90. This indicated that the fatigue life of CNFPUC showed better adherence to the two-parameter Weibull distribution.
3.3.3. Fatigue Equation Considering Failure Probability
According to the above analysis, the fatigue life Np of CNFPUC obeyed the two-parameter Weibull distribution. Therefore, the failure probability F should satisfy Equation (2), and the corresponding equivalent fatigue life Nf can be obtained:
The coefficients b and blnNa given in Table 10 are substituted into Equation (5), and the fatigue life Np of given failure probability F can be obtained by calculation. The calculation results of fatigue life Np at three stress levels corresponding to different failure probabilities F are shown in Table 11.
Based on the actual boundary conditions of the practical and the CNFPUC fatigue tests of the project, a double-logarithm fatigue equation is established:
S = lgA − BlgN
The double-logarithm fatigue equation can fit the test results well, and it may exactly satisfy the boundary condition of S → 0 when the N → ∞. The values of coefficients A and B depend on the degree of safety that the equation can guarantee [13,33,34]. As shown in Table 11, the determination coefficients R2 under the failure probability of CNFPUC were above 0.90, indicating that the linear relation of the Nf double-logarithm equation of equivalent fatigue life under the two parameter Weibull distribution was basically valid. The equivalent fatigue life of CNFPUC under failure probability Nf decreased with the increase of the stress level and temperature.
Based on the above analysis, a P-S-N fatigue equation considering the failure probability can be obtained by taking the corresponding coefficient in Table 11 into account. After the survival rate is determined according to the reliability requirements in engineering practice, the fatigue life of the CNFPUC bending fatigue with different survival rates at the corresponding ambient temperature and the stress level can be generally predicted.
3.3.4. Maximum Fatigue Strain Evolution Curve
In this paper, the Miner criterion [35] was used to define damage variables. First, the following basic assumptions were made:
- (1)
- Assuming that the original miner criterion is valid, the Miner criterion can be simplified under constant amplitude fatigue loading as follows: , where is the number of cycles at the level of the first order stress, and is the fatigue life of order i stress level;
- (2)
- It is assumed that the damage is only related to the maximum strain reached in the history of loading; there is no damage prior to unloading and loading to the maximum strain on the history, and therefore the maximum strain of the cycle is known as the fatigue strain of the cycle, which is referred to as the maximum fatigue strain εmax.
- (3)
- It is assumed that, under different loading conditions, the failure limit strain rate εf of the individual specimen is a certain value, which is the material parameter.
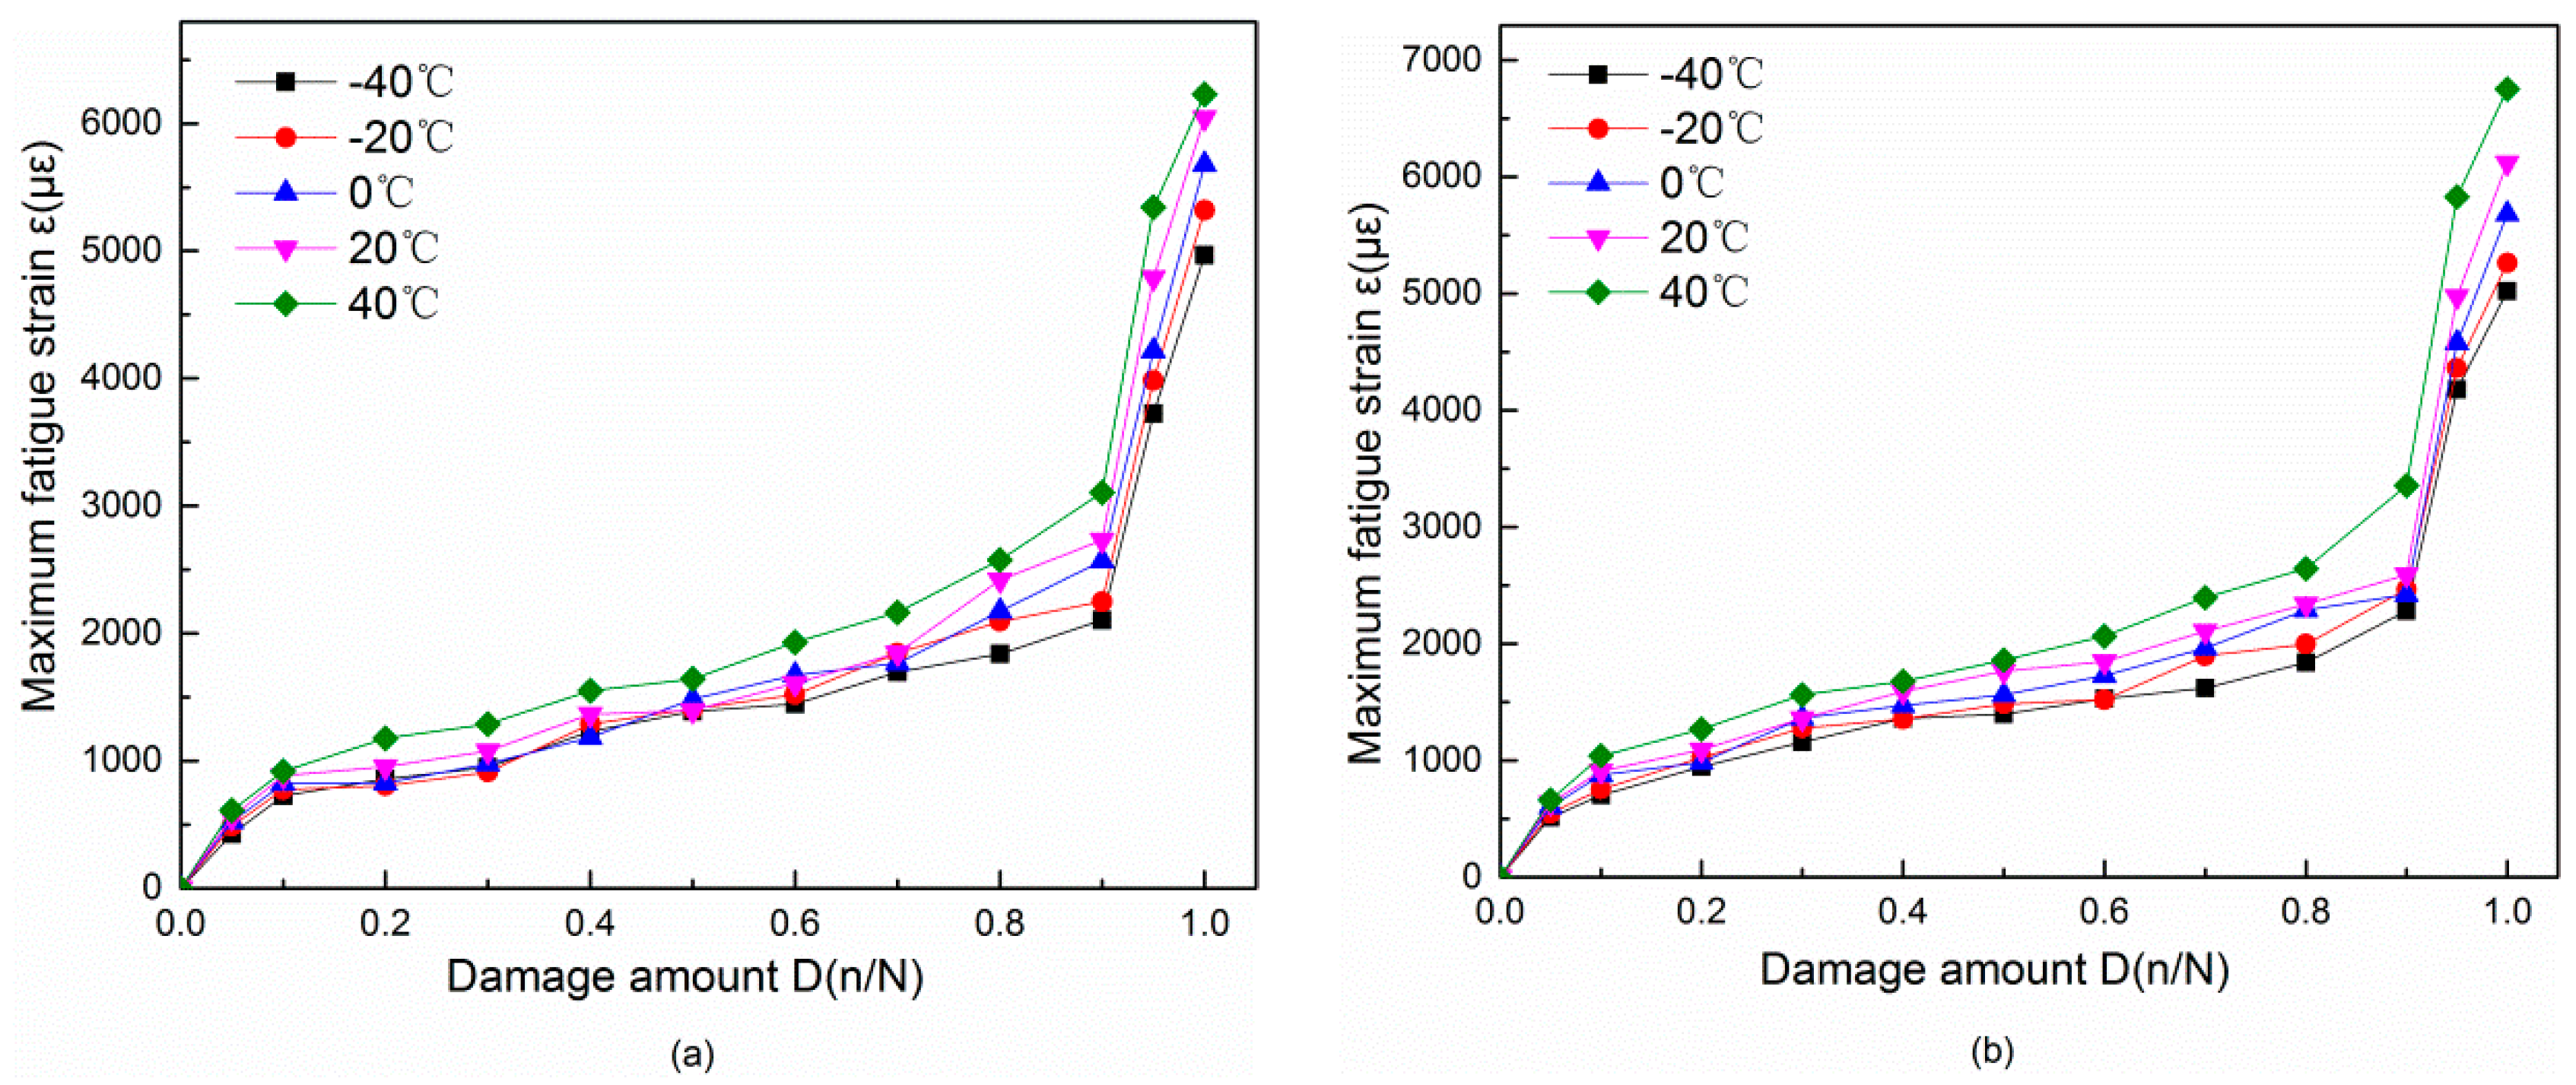
With the abovementioned basic assumptions and under different loading conditions, the damage amount–fatigue strain curve of the individual test piece was the only option, thus the fatigue strain and the damage amount may have been a one-to-one relationship. The D-ε curve of the CNFPUC at different stress levels is shown in Figure 9.
As seen in Figure 9, εmax represents a change regulation of a power function with the increase of cycle times. With the increase of the stress level S, the deformation growth rate of the specimen was accelerated. This meant that the strain growth rate was proportional to the stress level of S. At the same stress level, the growth rate of the strain increased with the increase of temperature. The maximum fatigue strain under constant amplitude load showed a three-stage strain law independent of the stress ratio. Stage I: In the formation of internal damage, the strain increased rapidly and then slowed down with the increase in the number of cycles, which accounted for approximately 10% of the total fatigue life. Stage II: This was the internal damage stable expansion phase with strain varying at a near constant rate of growth, which accounted for approximately 90% of the total fatigue life. Stage III: The internal damage instability developed, and the strain increased sharply until the specimen was broken, which accounted for approximately 10–15% of the total fatigue life. The idealized curve of the three-stage law of fatigue deformation development is expressed in Figure 10.
Based on the three-stage development rule of maximum fatigue strain εmax, a damage variable based on the definition of the maximum fatigue strain is proposed:
In the equation, is the longitudinal fatigue initial maximum strain of CNFPUC corresponding to the deformation at the end of Stage I of the curve, which is the fatigue damage threshold. is the instantaneous maximum strain after n times fatigue, and is the limit of the maximum strain corresponding to the maximum strain at the end of Stage II (when the specimen began to fail). In the range of 4200–6100 με, this value can be used as the ultimate maximum strain of the CNFPUC bending fatigue deformation.
When the damage began , the macroscopic fatigue damage began to occur. After that, the macroscopic mechanical properties of the specimen began to decline, and the strain value was at this time. When , D was equal to 0. When damage developed into an unstable fracture at the time of , D = 1.
3.3.5. Fatigue Cumulative Damage Regulation Based on Fatigue Resistivity
The resistivity corresponding to the maximum fatigue strain εmax is called the fatigue resistivity ρ. The change curve of fatigue resistivity ρ with a cyclic ratio (the ratio of the cycle number to the cycle life) is called the fatigue resistivity evolution curve. The ρ—n/N curve is shown in Figure 11. It was not difficult to find that εmax and ρ had the same three-stage change trend with the increase of the cycle ratio in the fatigue process. In the first stage, n/N was approximately 0.1, and ρ increased rapidly with the increase of cycle ratio, but the growth rate gradually slowed down. In the second stage, n/N was approximately 0.1–0.9, and ρ increased steadily and had a linear relationship with the cycle ratio; its growth rate was basically a fixed value. In the third stage, n/N was approximately 0.9, and ρ increased sharply until the specimen was destroyed. As shown in Figure 11a, the stress level was low, and the fatigue resistivity changed more obviously with the increase of temperature than it did in Figure 11b,c. With the increase of stress level, the influence of temperature on fatigue life decreased gradually.
It can be seen that, in the damage stability stage and Stage II of linear development in the entire process of fatigue damage, the resistivity was approximately linear with the fatigue damage D; the fatigue resistivity and the damage amount corresponded to a one-to-one relationship, as shown in the BC section of Figure 12.
The fatigue resistivity is the same as εmax, which can be used to characterize the fatigue cumulative damage process of CNFPUC materials. Because of this, the damage variables defined by the fatigue resistivity ρ are proposed:
where is the resistivity corresponding to the initial damage of the specimen and corresponding to the end of Stage I of the curve; is the ultimate resistivity in the final fatigue failure of the specimen, and is the instantaneous resistivity. It can be seen that, when the damage began, , D = 0, might have been called the damage threshold resistivity. When damage developed to an unstable fracture, usually adopted the resistivity at the critical cycle ratio Ncr/N of 0.9, thus , D = 1. Therefore, the damage variable D could meet the requirements of the generalized damage variable, and the physical meaning of the definition was clear; the response of each parameter was remarkable and easy to measure and calculate. The means of and are shown in Table 12 and Table 13.
It can be seen from the tables that and increased with the increase of stress level S and the increase of temperature. There was a linear relationship between the damage variables and the fatigue resistivity. The bending fatigue damage of CNFPUC materials at different ambient temperatures and stress levels could be obtained by numerical substitution (8) in Table 12 and Table 13. The cumulative damage of the CNFPUC could be quantitatively evaluated in engineering practice. Damage threshold resistivity or ultimate resistivity could be used as a standard for initial damage or failure.
3.4. Analysis of Fatigue Cumulative Damage Mechanism of CNFPUC Predicted by Fatigue Resistivity
The CNF in the seepage zone overlapped with each other, as shown in Figure 13a. On one hand, it played a bridging role at the crack tip, which could consume energy by drawing out the fibers and sharing a large part of the energy used to develop the main crack and the microcrack in the matrix. On the other hand, the pull out of CNF destroyed the overlapping connection between the fibers, and the resistivity of CNFPUC increased gradually with the propagation of the main crack and the microcrack.
In the initial stage, due to the inevitable existence of some initial microcracks and micropores in the CNFPUC matrix, the deformation and the resistivity of CNFPUC increased rapidly owing to the existence of these initial defects. At the initial stage of bending fatigue, the main macrocrack had not developed yet because of the restriction of CNF; the main fatigue crack and the microcrack could not develop rapidly, and the growth rate of strain and resistivity was changed from fast to slow at the macro level.
On one hand, with the increase of the amplitude of the fatigue stress and the number of fatigue cycles, microcracks were formed by matrix cracking and shearing failure at the interface between the matrix and the fibers, resulting in further crack propagation. On the other hand, when the interface between the CNF and the polyurethane was degummed, some fibers were drawn out. The crack tip extended to the interface of the matrix fiber, and if the stress at the tip had been large enough, fracture of the fiber may have occurred. The overlapping conductive network of CNF was further destroyed, resulting in a gradual increase in the CNFPUC resistivity. Macroscopically, the resistivity growth rate of CNFPUC increased with the increase of stress level.
When the main crack developed to the critical state of unstable propagation, and the CNF had been pulled out and could no longer consume energy, the fatigue damage entered the third stage of rapid growth, as shown in Figure 13b. At this time, the damage accumulation in the material was serious. At the macro level, the bending deformation of the specimen increased rapidly, the surface of the specimen showed obvious cracks, the fiber lap joint condition worsened, and the resistivity of the specimen increased sharply. Finally, the development of cracks in the internal weakness of CNFPUC led to fracture failure of the specimen.
4. Conclusions
In this paper, the change of the resistivity of the CNFPUC material with the bending strain at different ambient temperatures was tested, and the four-point bending fatigue life tests of different stress levels were conducted at the corresponding temperatures; the relationship between the fatigue cumulative damage and the change of the resistivity was analyzed. The following conclusions can be drawn:
- (1)
- As an intelligent flexural reinforcement material, the resistivity increased with flexural tensile strain at various ambient temperatures, presenting a two-stage trend of small increase and sharp increase.
- (2)
- Under periodic loading, the fatigue life of CNFPUC was in accordance with the Weibull distribution of two parameters. The resistivity increased with the increase of stress level and cycle times in the bending state, showing a three-stage variation rule. When the damage amount was up to 90%, the resistivity increased sharply. With the increase of stress level, the effect of temperature on resistivity decreased gradually.
- (3)
- When the bond between CNFPUC and the bottom of the concrete beam was used as flexural reinforcement, the fatigue cumulative damage of flexural tension could be predicted by using the first two stages of CNFPUC fatigue resistivity evolution curve. Damage threshold resistivity or ultimate resistivity could be used as a reference standard for starting damage or failure, which provides a theoretical basis for practical engineering application.
Author Contributions
N.Y. and Q.S. conceived the study; N.Y. performed the experiments, formal analysis and wrote the main manuscript; Q.S. reviewed and edited this manuscript; and all authors approved the final manuscript.
Funding
This research was funded by Scientific Research Project of Qiqihar University, No. 135309357,135309358.
Conflicts of Interest
The authors declare no conflicts of interest.
References
- Hussain, H.K.; Liu, G.W.; Yong, Y.W. Experimental study to investigate mechanical properties of new material polyurethane–cement composite (PUC). Constr. Build. Mater. 2014, 50, 200–208. [Google Scholar] [CrossRef]
- Hussain, H.K.; Zhang, L.Z.; Liu, G.W. An experimental study on strengthening reinforced concrete T-beams using new material poly-urethane-cement (PUC). Constr. Build. Mater. 2013, 40, 104–117. [Google Scholar] [CrossRef]
- Hussain, H.K.; Zhang, L.Z.; Liu, G.W. Study of Concrete Strain for T-Beams Retrofitting by Poly-Urethane-Cement Material (PUC). Res. J. Appl. Sci. Eng. Technol. 2013, 5, 2354–2359. [Google Scholar] [CrossRef]
- Liu, G.; Otsuka, H.; Mizuta, Y.; Shimitsu, A. A Foundational Study on Static Mechanical Characteristics of the Super Lightweight and High Strength Material Using Fly-ash. J. Soc. Mater. Sci. Jpn. 2006, 55, 738–745. [Google Scholar] [CrossRef] [Green Version]
- Zhang, K.; Sun, Q. The use of Wire Mesh-Polyurethane Cement (WM-PUC) composite to strengthen RC T-beams under flexure. J. Build. Eng. 2017, 15, 122–136. [Google Scholar] [CrossRef]
- Zhang, K.; Sun, Q. Experimental Study of Reinforced Concrete T-Beams Strengthened with a Composite of Prestressed Steel Wire Ropes Embedded in Polyurethane Cement (PSWR–PUC). Int. J. Civ. Eng. 2017, 16, 1109–1123. [Google Scholar] [CrossRef]
- Zhang, K.; Sun, Q. Strengthening of a Reinforced Concrete Bridge with Polyurethane-cement Composite (PUC). Open Civ. Eng. J. 2016, 10, 768–781. [Google Scholar]
- Kim, H. Enhanced crack detection sensitivity of carbon fiber composites by carbon nanotubes directly grown on carbon fibers. Compos. Part B Eng. 2014, 60, 284–291. [Google Scholar] [CrossRef]
- Ding, Y.; Huang, Y.; Zhang, Y.; Jalali, S.; Aguiar, J.B. Self-monitoring of freeze–thaw damage using triphasic electric conductive concrete. Constr. Build. Mater. 2015, 101, 440–446. [Google Scholar] [CrossRef]
- Mahapatra, S.S.; Yadav, S.K.; Yoo, H.J.; Ramasamy, M.S.; Cho, J.W. Tailored and strong electro-responsive shape memory actuation in carbon nanotube-reinforced hyperbranched polyurethane composites. Sens. Actuators B Chem. 2014, 193, 384–390. [Google Scholar] [CrossRef]
- Jung, Y.C.; Yoo, H.J.; Kim, Y.A.; Cho, J.W.; Endo, M. Electroactive shape memory performance of polyurethane composite having homogeneously dispersed and covalently crosslinked carbon nanotubes. Carbon 2010, 48, 1598–1603. [Google Scholar] [CrossRef] [Green Version]
- Chu, H.-Y.; Chen, J.-K. The experimental study on the correlation of resistivity and damage for conductive concrete. Cem. Concr. Compos. 2016, 67, 12–19. [Google Scholar] [CrossRef]
- Urban, S.; Strauss, A.; Schütz, R.; Bergmeister, K.; Dehlinger, C. Dynamically loaded concrete structures-monitoring-based assessment of the real degree of fatigue deterioration. Struct. Concr. 2015, 15, 530–542. [Google Scholar] [CrossRef]
- Liu, F.; Zhou, J. Experimental Research on Fatigue Damage of Reinforced Concrete Rectangular Beam. Ksce J. Civ. Eng. 2018, 22, 3512–3523. [Google Scholar] [CrossRef]
- Vavouliotis, A.; Paipetis, A.; Kostopoulos, V. On the fatigue life prediction of CFRP laminates using the Electrical Resistance Change method. Compos. Sci. Technol. 2011, 71, 630–642. [Google Scholar] [CrossRef] [Green Version]
- Xu, Z.H.; Liu, Z.T. Fatigue Damage Sensing in Smart Carbon Fiber Concrete by Electrical Resistivity Measurement. Key Eng. Mater. 2007, 348–349, 345–348. [Google Scholar] [CrossRef]
- Xue, L.Z.; Li, K.Z.; Zhang, S.Y.; Li, H.J.; Cheng, J.; Luo, W.F. Monitoring the damage evolution of flexural fatigue in unidirectional carbon/carbon composites by electrical resistance change method. Int. J. Fatigue 2014, 68, 248–252. [Google Scholar] [CrossRef]
- Wang, S.; Shui, X.; Fu, X.; Chung, D.D.L. Early fatigue damage in carbon-fibre composites observed by electrical resistance measurement. J. Mater. Sci. 1998, 33, 3875–3884. [Google Scholar] [CrossRef]
- Sevostianov, I.; Zagrai, A.; Kruse, W.A.; Hardee, H.C. Connection Between Strength Reduction, Electric Resistance and Electro-Mechanical Impedance in Materials with Fatigue Damage. Int. J. Fracture 2010, 164, 159–166. [Google Scholar] [CrossRef]
- Wang, S.; Chung, D.D.L. Self-sensing of flexural strain and damage in carbon fiber polymer-matrix composite by electrical resistance measurement. Carbon 2006, 44, 2739–2751. [Google Scholar] [CrossRef]
- Szeląg, M. Mechano-Physical Properties and Microstructure of Carbon Nanotube Reinforced Cement Paste after Thermal Load. Nanomaterials 2017, 7, 267. [Google Scholar] [CrossRef]
- Al-Rub, R.K.A.; Tyson, B.M.; Yazdanbakhsh, A.; Grasley, Z. Mechanical Properties of Nanocomposite Cement Incorporating Surface-Treated and Untreated Carbon Nanotubes and Carbon Nanofibers. J. Nanomech. Micromech. 2012, 2, 1–6. [Google Scholar] [CrossRef] [Green Version]
- Yang, N.; Zhang, K.; Sun, Q. Dispersion and Pressure Sensitivity of Carbon Nanofiber-Reinforced Polyurethane Cement. Appl. Sci. 2018, 8, 2375. [Google Scholar] [CrossRef]
- Ding, Y.; Han, Z.; Zhang, Y.; Aguiar, J.B. Concrete with triphasic conductive materials for self-monitoring of cracking development subjected to flexure. Compos. Struct. 2016, 138, 184–191. [Google Scholar] [CrossRef] [Green Version]
- Wen, S.; Chung, D.D.L. Defect dynamics of cement paste under repeated compression studied by electrical resistivity measurement. Cem. Concr. Res. 2001, 31, 1515–1518. [Google Scholar] [CrossRef]
- Wen, S.; Chung, D.D.L. Self-sensing of flexural damage and strain in carbon fiber reinforced cement and effect of embedded steel reinforcing bars. Carbon 2006, 44, 1496–1502. [Google Scholar] [CrossRef]
- Chung, D.D.L. Carbon materials for structural self-sensing, electromagnetic shielding and thermal interfacing. Carbon 2012, 50, 3342–3353. [Google Scholar] [CrossRef]
- Lee, H.; Kang, D.; Kim, J.; Choi, K.; Chung, W. Void detection of cementitious grout composite using single-walled and multi-walled carbon nanotubes. Cem. Concr. Compos. 2019, 95, 237–246. [Google Scholar] [CrossRef]
- Claßen, M.; Gallwoszus, J. Concrete fatigue in composite dowels. Struct. Concr. 2016, 17, 63–73. [Google Scholar] [CrossRef]
- Liang, J.; Ding, Z.; Jie, L. A probabilistic analyzed method for concrete fatigue life. Probab. Eng. Mech. 2017, 49, 13–21. [Google Scholar] [CrossRef]
- Isojeh, B.; El-Zeghayar, M.; Vecchio, F.J. Engineering structures high-cycle fatigue life prediction of reinforced concrete deep beams. Eng. Struct. 2017, 150, 12–24. [Google Scholar] [CrossRef]
- Hümme, J.; von der Haar, C.; Lohaus, L.; Marx, S. Fatigue behaviour of a normal-strength concrete-number of cycles to failure and strain development. Struct. Concr. 2016, 17, 637–645. [Google Scholar] [CrossRef]
- Teworte, F.; Herbrand, M.; Hegger, J. Structural Assessment of Concrete Bridges in Germany—Shear Resistance under Static and Fatigue Loading. Struct. Eng. Int. 2015, 25, 266–274. [Google Scholar] [CrossRef]
- Shen, G.; Zhu, Z.H. On the mechanism of piezoresistivity of carbon nanotube polymer composites. Polymer 2014, 55, 4136–4149. [Google Scholar]
- Mohamadi, M.; Mohandesi, J.A.; Homayonifar, M. Fatigue behavior of polypropylene fiber reinforced concrete under constant and variable amplitude loading. J. Compos. Mater. 2013, 47, 3331–3342. [Google Scholar] [CrossRef]
Figure 1.
Vibratory compactness of specimens and their dimensions. (a) Specimen vibration compactness; (b) drawing of test piece size (mm).
Figure 1.
Vibratory compactness of specimens and their dimensions. (a) Specimen vibration compactness; (b) drawing of test piece size (mm).

Figure 2.
Sample pouring process. (a) Cast-in-place specimen; (b) insertion of electrode; (c) molded specimen.
Figure 2.
Sample pouring process. (a) Cast-in-place specimen; (b) insertion of electrode; (c) molded specimen.

Figure 3.
Bending test. (a) Bending test loading diagram; (b) four-electrode method (mm).

Figure 4.
Four-point bending fatigue test. (a) Fatigue test device; (b) two electrode position diagram (mm).
Figure 4.
Four-point bending fatigue test. (a) Fatigue test device; (b) two electrode position diagram (mm).

Figure 5.
Bending tensile stress-strain curve.

Figure 6.
Flexural failure. (a) Bottom transverse fracture; (b) CNFPUC is separated from the concrete.
Figure 6.
Flexural failure. (a) Bottom transverse fracture; (b) CNFPUC is separated from the concrete.

Figure 7.
ρ-ε curve.

Figure 8.
Two-parameter Weibull distribution test for fatigue life. (a) Stress level is S = 0.6; (b) stress level is S = 0.7; (c) stress level is S = 0.8.
Figure 8.
Two-parameter Weibull distribution test for fatigue life. (a) Stress level is S = 0.6; (b) stress level is S = 0.7; (c) stress level is S = 0.8.

Figure 9.
The D-ε curves of CNFPUC at different stress levels. (a) D-ε curve at stress level 0.6; (b) D-ε curve at stress level 0.7; (c) D-ε curve at stress level 0.8; (d) D-n/N trend diagram.
Figure 9.
The D-ε curves of CNFPUC at different stress levels. (a) D-ε curve at stress level 0.6; (b) D-ε curve at stress level 0.7; (c) D-ε curve at stress level 0.8; (d) D-n/N trend diagram.


Figure 10.
Maximum fatigue deformation cycle ratio curve diagram.

Figure 11.
Fatigue resistivity evolution curve. (a) ρ-D curve at stress level 0.6; (b) ρ-D curve at stress level 0.7; (c) ρ-D curve at stress level 0.8.
Figure 11.
Fatigue resistivity evolution curve. (a) ρ-D curve at stress level 0.6; (b) ρ-D curve at stress level 0.7; (c) ρ-D curve at stress level 0.8.

Figure 12.
Fatigue resistivity cycle ratio curve diagram.

Figure 13.
SEM diagram. (a) CNF lap conduction; (b) CNF pull out voids.


Table 1.
The physicochemical property of the polyurethane component.
| Item | Extrinsic Feature | Viscosity (25 °C)/mPa·s | Hydroxyl Value/mg KOH/g | Density (25 °C)/(g/cm3) | Acidity/% | Hydrolyzed Chlorine/% |
|---|---|---|---|---|---|---|
| WannatePM-200 | brown liquid | 150–250 | 30.5–32.0 | 1.220–1.250 | ≤0.030 | ≤0.20 |
| Combined polyether ES-305 | colorless transparent liquid | 200–1500 | 350 ± 30 | 1.11 ± 0.20 | - | - |
Table 2.
The mass percentage of chemical composition of fine aggregate (%).
| Item | CaO | SiO2 | Al2O3 | Fe2O3 | MgO | SO3 | Na2O | K2O | Cl | f-CaO | Loss |
|---|---|---|---|---|---|---|---|---|---|---|---|
| Cement | 60.19 | 20.58 | 5.58 | 2.84 | 2.47 | 2.18 | 0.18 | 0.48 | 0.03 | 1.94 | 4.04 |
| Silica fume | 0.3 | 85–96 | 1.0 | 0.9 | 0.7 | - | 1.3 | - | - | - | - |
Table 3.
Cumulative passing percentage of filler material particles.
| Item | Particle Size (μm) | |||||||
|---|---|---|---|---|---|---|---|---|
| 0.3 | 0.6 | 1 | 4 | 8 | 16 | 32 | 64 | |
| Cement | 0 | 0.37 | 2.97 | 16.35 | 27.34 | 47.55 | 75.36 | 95.32 |
| Silica fume | 35.2 | 60.2 | 89.6 | 100 | 100 | 100 | 100 | 100 |
Table 4.
Physical parameters of carbon nanofibers.
| Purity | Diameter (nm) | Length (μm) | Draw Ratio | Resistivity (Ω·m) | Thermal Expansivity (ppm/°C) | Thermal Conductivity (W/m) | Specific Area (m2/g) | Stacking Density (g/cm3) | Density (g/cm3) |
|---|---|---|---|---|---|---|---|---|---|
| 99.9% | 150–200 | 10–20 | 70 | 6 × 10⁻⁶ | 1.0 | 2000 | 300 | 0.18 | 2 |
Table 5.
Mix proportion and major parameters of concrete.
| Concrete Grade | Mix Proportion/(kg·m−3) | Air Void (by Volume)/% | Compressive Strength at 28 d/MPa | |||||
|---|---|---|---|---|---|---|---|---|
| Water | Cement | Sand | Crushed Stone | Fly Ash | Water Reducer | |||
| C40 | 180 | 410 | 725 | 1085 | 50 | 5.35 | 2.4 | 44.2 |
Table 6.
Mass ratio of carbon nanofiber polyurethane cement (CNFPUC) components (%).
| CNFPUC Component | Isocyanate | Polyether | Cement | Silica fume | CNF |
|---|---|---|---|---|---|
| Mass (%) | 28.5 | 28.5 | 38 | 3.5 | 1.5 |
| Volume (%) | 27.2 | 30.4 | 30 | 2.6 | 9.8 |
Table 7.
Bond strength results.
| Number | 1 | 2 | 3 | 4 | 5 | 6 | Mean Value |
|---|---|---|---|---|---|---|---|
| Strength (MPa) | 3.42 | 3.17 | 3.58 | 3.26 | 3.74 | 3.68 | 3.47 |
Table 8.
Three-stage slope linear fitting of stress-strain curve.
| Stage | −40 °C | −20 °C | 0 °C | 20 °C | 40 °C |
|---|---|---|---|---|---|
| I | 8.74(1) | 8.58(1) | 8.32(1) | 7.96(1) | 7.58(1) |
| II | 6.92(0.98) | 6.73(0.97) | 6.61(0.96) | 6.51(0.95) | 6.37(0.95) |
| III | 4.01(0.99) | 3.51(0.98) | 3.77(0.97) | 3.43(0.98) | 3.18(0.94) |
() represents determination coefficient of fitting.
Table 9.
Fatigue life test results (times).
| Stress Level | Number | Test Temperature | ||||
|---|---|---|---|---|---|---|
| −40 °C | −20 °C | 0 °C | 20 °C | 40 °C | ||
| 0.6 | 1 | 433,654 | 312,683 | 214,860 | 104,655 | 55,855 |
| 2 | 467,852 | 355,462 | 244,379 | 116,756 | 78,624 | |
| 3 | 501,687 | 378,562 | 264,677 | 146,890 | 83,562 | |
| 4 | 526,574 | 398,565 | 304,692 | 173,216 | 106,875 | |
| 5 | 556,230 | 432,566 | 325,688 | 182,368 | 116,535 | |
| 6 | 593,782 | 457,852 | 326,985 | 219,640 | 149,856 | |
| 0.7 | 1 | 157,655 | 76,543 | 50,796 | 10,984 | 5640 |
| 2 | 184,633 | 96,425 | 55,249 | 13,653 | 6756 | |
| 3 | 195,679 | 113,609 | 64,538 | 20,075 | 8564 | |
| 4 | 216,430 | 137,688 | 89,436 | 23,694 | 11,080 | |
| 5 | 246,582 | 143,266 | 107,855 | 27,682 | 12,568 | |
| 6 | 250,643 | 156,429 | 113,563 | 31,691 | 20,354 | |
| 0.8 | 1 | 36,215 | 10,567 | 6456 | 3286 | 676 |
| 2 | 43,542 | 15,984 | 8237 | 4036 | 985 | |
| 3 | 55,756 | 18,972 | 10,988 | 5033 | 1598 | |
| 4 | 61,235 | 21,943 | 11,462 | 7862 | 2288 | |
| 5 | 62,895 | 24,477 | 16,467 | 9236 | 3126 | |
| 6 | 71,405 | 29,945 | 17,315 | 11,030 | 3838 | |
Table 10.
The results of regression analysis of fatigue test according to Equation (3).
| Temperature (°C) | Stress Level Smax = 0.60 | Stress Level Smax = 0.70 | Stress Level Smax = 0.80 | ||||||
|---|---|---|---|---|---|---|---|---|---|
| b | β = blnNa | R2 | b | β = blnNa | R2 | b | β = blnNa | R2 | |
| −40 | 7.99 | 105.52 | 0.99 | 5.09 | 62.69 | 0.97 | 3.55 | 39.15 | 0.96 |
| −20 | 6.66 | 86.19 | 0.99 | 3.34 | 39.48 | 0.97 | 2.51 | 25.19 | 0.98 |
| 0 | 5.29 | 66.81 | 0.95 | 2.54 | 29.07 | 0.90 | 2.35 | 22.39 | 0.95 |
| 20 | 3.22 | 38.88 | 0.96 | 2.20 | 22.28 | 0.97 | 1.85 | 16.63 | 0.94 |
| 40 | 2.63 | 30.59 | 0.97 | 1.92 | 18.12 | 0.92 | 1.36 | 10.59 | 0.98 |
Note: b—regression coefficient, R2—determination coefficient, β—regression coefficient.
Table 11.
The change of the fatigue life with the failure probability F (A–D). Change of fatigue life of CNFPUC with failure probability F at −40 °C.
Table 11.
The change of the fatigue life with the failure probability F (A–D). Change of fatigue life of CNFPUC with failure probability F at −40 °C.
| Failure Probability | Livability | Stress Levels | Regression Coefficient | Determination Coefficient | |||
|---|---|---|---|---|---|---|---|
| F | P | S = 0.6 | S = 0.7 | S = 0.8 | lgA | B | R2 |
| 0.10 | 0.90 | 410,389 | 143,514 | 32,672 | 0.41 | 0.11 | 0.96 |
| 0.20 | 0.80 | 450,801 | 166,312 | 40,362 | 0.44 | 0.12 | 0.96 |
| 0.30 | 0.70 | 478,055 | 182,365 | 46,063 | 0.47 | 0.12 | 0.96 |
| 0.40 | 0.60 | 500,037 | 195,700 | 50,968 | 0.49 | 0.12 | 0.96 |
| 0.50 | 0.50 | 519,508 | 207,793 | 55,544 | 0.51 | 0.13 | 0.96 |
| (A) Change of fatigue life of CNFPUC with failure probability F at −20 °C. | |||||||
| 0.10 | 0.90 | 320,816 | 69,327 | 9314 | 0.23 | 0.08 | 0.97 |
| 0.20 | 0.80 | 359,080 | 86,792 | 12,560 | 0.25 | 0.08 | 0.97 |
| 0.30 | 0.70 | 385,279 | 99,877 | 15,140 | 0.27 | 0.09 | 0.96 |
| 0.40 | 0.60 | 406,629 | 111,218 | 17,470 | 0.29 | 0.09 | 0.96 |
| 0.50 | 0.50 | 425,698 | 121,860 | 19,729 | 0.30 | 0.09 | 0.96 |
| (B) Change of fatigue life of CNFPUC with failure probability F at 0 °C. | |||||||
| 0.10 | 0.90 | 199,604 | 38,519 | 5271 | 0.20 | 0.08 | 0.98 |
| 0.20 | 0.80 | 230,026 | 51,759 | 7255 | 0.21 | 0.08 | 0.97 |
| 0.30 | 0.70 | 251,351 | 62,256 | 8857 | 0.24 | 0.08 | 0.96 |
| 0.40 | 0.60 | 269,011 | 71,713 | 10,320 | 0.26 | 0.09 | 0.96 |
| 0.50 | 0.50 | 284,989 | 80,869 | 11,751 | 0.27 | 0.09 | 0.95 |
| (C) Change of fatigue life of CNFPUC with failure probability F at 20 °C. | |||||||
| 0.10 | 0.90 | 87,174 | 8995 | 2375 | 0.16 | 0.08 | 0.98 |
| 0.20 | 0.80 | 110,053 | 12,651 | 3563 | 0.19 | 0.08 | 0.98 |
| 0.30 | 0.70 | 127,309 | 15,657 | 4591 | 0.21 | 0.09 | 0.98 |
| 0.40 | 0.60 | 142,333 | 18,434 | 5575 | 0.23 | 0.09 | 0.98 |
| 0.50 | 0.50 | 156,484 | 21,177 | 6575 | 0.24 | 0.09 | 0.98 |
| (D) Change of fatigue life of CNFPUC with failure probability F at 40 °C. | |||||||
| 0.10 | 0.90 | 47,836 | 3887 | 460 | 0.07 | 0.06 | 0.98 |
| 0.20 | 0.80 | 63,631 | 5746 | 799 | 0.09 | 0.07 | 0.99 |
| 0.30 | 0.70 | 76,053 | 7336 | 1129 | 0.11 | 0.07 | 0.99 |
| 0.40 | 0.60 | 87,183 | 8845 | 1470 | 0.12 | 0.07 | 0.98 |
| 0.50 | 0.50 | 97,912 | 10,369 | 1840 | 0.14 | 0.07 | 0.99 |
Table 12.
The average value of at different ambient temperatures and stress levels (Ω·m).
| Stress Level | Temperature (°C) | ||||
|---|---|---|---|---|---|
| −40 | −20 | 0 | 20 | 40 | |
| 0.6 | 7.86 | 9.07 | 9.8 | 10.37 | 11.68 |
| 0.7 | 12.85 | 15.47 | 18.46 | 21.66 | 23.46 |
| 0.8 | 22.57 | 26.85 | 27.99 | 30.2 | 35.26 |
Table 13.
The average value of at different ambient temperatures and stress levels (Ω·m).
| Stress Level | Temperature (°C) | ||||
|---|---|---|---|---|---|
| −40 | −20 | 0 | 20 | 40 | |
| 0.6 | 15.96 | 33.64 | 39.24 | 42.3 | 51.65 |
| 0.7 | 32.47 | 39.12 | 46.55 | 52.35 | 66.56 |
| 0.8 | 45.99 | 50.35 | 59.88 | 62.9 | 85.47 |
© 2019 by the authors. Licensee MDPI, Basel, Switzerland. This article is an open access article distributed under the terms and conditions of the Creative Commons Attribution (CC BY) license (http://creativecommons.org/licenses/by/4.0/).
Share and Cite
MDPI and ACS Style
Yang, N.; Sun, Q. Study on the Self-Monitoring of Bending Fatigue Cumulative Damage for Carbon Nanofiber Polyurethane Cement. Appl. Sci. 2019, 9, 2128. https://doi.org/10.3390/app9102128
AMA Style
Yang N, Sun Q. Study on the Self-Monitoring of Bending Fatigue Cumulative Damage for Carbon Nanofiber Polyurethane Cement. Applied Sciences. 2019; 9(10):2128. https://doi.org/10.3390/app9102128
Chicago/Turabian StyleYang, Nan, and Quansheng Sun. 2019. "Study on the Self-Monitoring of Bending Fatigue Cumulative Damage for Carbon Nanofiber Polyurethane Cement" Applied Sciences 9, no. 10: 2128. https://doi.org/10.3390/app9102128
Note that from the first issue of 2016, this journal uses article numbers instead of page numbers. See further details here.