Article

Machine Vision System for Counting Small Metal Parts in Electro-Deposition Industry

Department of Industrial Engineering, University of Florence, 50134 Firenze, Italy
*
Author to whom correspondence should be addressed.
Appl. Sci. 2019, 9(12), 2418; https://doi.org/10.3390/app9122418
Submission received: 20 May 2019 / Revised: 12 June 2019 / Accepted: 13 June 2019 / Published: 13 June 2019
(This article belongs to the Special Issue Texture and Colour in Image Analysis)

Abstract

:

Featured Application

The present work has application in the field of galvanic coating for the fashion industry by proposing a method and a machine able to count the number of items attached to a galvanic frame.

Abstract

In the fashion field, the use of electroplated small metal parts such as studs, clips and buckles is widespread. The plate is often made of precious metal, such as gold or platinum. Due to the high cost of these materials, it is strategically relevant and of primary importance for manufacturers to avoid any waste by depositing only the strictly necessary amount of material. To this aim, companies need to be aware of the overall number of items to be electroplated so that it is possible to properly set the parameters driving the galvanic process. Accordingly, the present paper describes a simple, yet effective machine vision-based method able to automatically count small metal parts arranged on a galvanic frame. The devised method, which relies on the definition of a rear projection-based acquisition system and on the development of image processing-based routines, is able to properly count the number of items on the galvanic frame. The system is implemented on a counting machine, which is meant to be adopted in the galvanic industrial practice to properly define a suitable set or working parameters (such as the current, voltage, and deposition time) for the electroplating machine and, thereby, assure the desired plate thickness from one side and avoid material waste on the other.

Graphical Abstract

1. Introduction

As widely recognized, electroplating (more precisely electrodeposition) is a chemical process that uses electric current to transfer metal from a cation to an electrode (i.e., the object to be treated), to form a coherent thin metal coating [1]. The amount of mass deposit derives from Faraday’s laws on electrolysis [2] and directly depends on current intensity and time:
m = M · I · t Z · F
where:
  • m = mass deposited on electrode [g];
  • M = molar mass of the material to be deposited [g/mol];
  • I = current intensity (A);
  • t = time (s);
  • Z = valence of material’s ions;
  • F = Faraday’s constant (96485.33 C mol−1).
The process used by manufacturers working in the electrodeposition of fashion accessories consists of arranging the (usually) small parts to be plated on a frame by using hooks or, more often, metal wires, as shown in Figure 1.
Therefore, electrodeposition simultaneously occurs on a number of parts. Since the material to be deposited on electrode (multiple items to be plated) is required to form a uniform thin layer, the overall mass is given by:
m = n · s · T · ρ
where: where:
  • n = number of items to be electroplated;
  • s = surface of a single item;
  • T= coating thickness;
  • ρ = material mass density.
Hence, in order to obtain the desired coating thickness, both the number and surface of the items to be plated need to be known. While the item’s surface is retrievable by means of possibly available items, Computer Aided Design (CAD) models, or by using 3D scanning, the number of items arranged on the galvanic frame is not straightforwardly available in order to compute the overall surface to be electroplated.
To date, the parts attached to the frame are manually counted, however, the reliability of the process is limited by ensuing weakness and inattentiveness; in other words, it is inevitably prone to errors due to the operators’ tiredness and lack of attention, etc.
In scientific literature, several papers specifically address the topic of designing counting systems with reference to a variety of industrial fields [3,4]. In addition, many counting machines have been available on the market for years [5,6]. Unfortunately, regardless of the technology adopted (e.g., weight measurement, free-fall, optical scan lines), almost all the machines available on the market require items to be physically separated one from each other (i.e., not disposed on package or frames), or to be arranged upon a moving tray. Therefore, such solutions are not suitable or adaptable to count items that are already arranged on a galvanic frame. Fortunately, machine vision (MV) systems have the potential to solve this issue by implementing a combination of optical devices and proper image processing algorithms, finalized to determine the overall number of objects captured in a scene. Not by chance, a relevant number of MV systems have been proposed in the scientific literature to address the object counting issue [7]. However, the main issue for devising a system for counting metal parts attached to a galvanic frame is related to the high reflectivity of the items themselves, which presents an incredible challenge for any kind of optical acquisition system. For this reason, to the best of the authors’ knowledge, no automatic counting system has been devised so far for the galvanic industry. Accordingly, the present paper proposes a machine vision-based method to automatically count small metal parts arranged on a galvanic frame. The devised method, relying on the definition of a proper acquisition system and on the development of image processing-based routines, is implemented on a counting machine to be adopted in the galvanic industrial practice. The machine architecture is designed to discard the undesired reflections due to the metal surface so to properly detach all attached items from the background. This allows a set of simple, yet effective image processing algorithms to correctly determine the number of items to be coated in the galvanic bath. Finally, the knowledge of the number of items will allow companies to define a suitable set or working parameters (such as the current, voltage and deposition time) for the electroplating machine and, thereby, assure the desired plate thickness from one side and avoid material waste on the other.

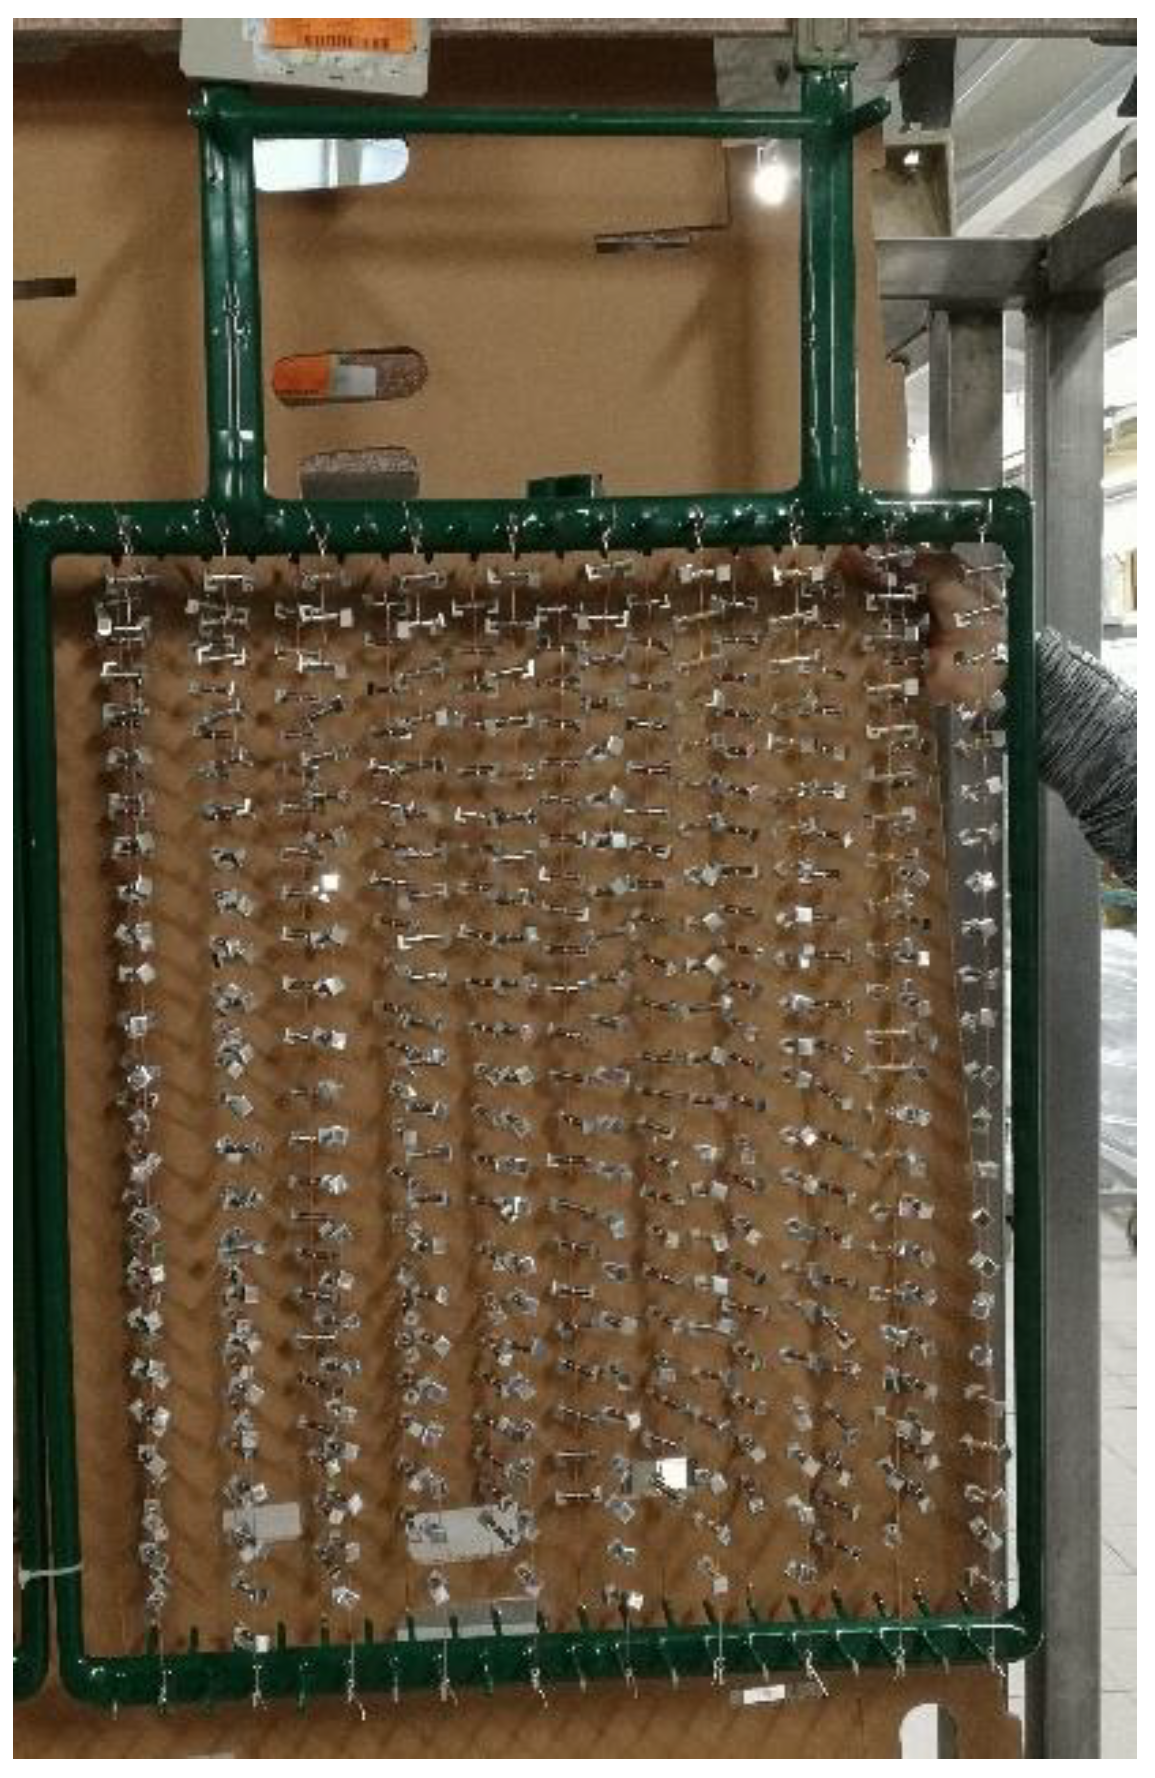
2. Materials and Methods

As shown in Figure 1, the galvanic frame is formed by 4 tubular beams welded to compose a rectangle. In the general configuration, on the shorter sides, several hooks are joined. The workers use inert metal wires to knot together a variable number of items. Successively, each wire is linked to a couple of corresponding hooks (i.e., the nth on the upper side with the nth on the lower) so that the wire results in an arrangement on the frame along an approximately vertical direction. Once all the couples of hooks are filled, the galvanic frame is sent to the electroplating bath. Considering that items can be very small in size (down to 10 mm on the shorter side), the variability in length (thus in mass) of the wire itself precludes the adoption of any weight-based approach for the counting system. Moreover, two consecutive items can be attached at a relative distance down to 20 mm.
Consequently, attention has been focused on computer vision-based approaches. The main idea is to properly acquire a 2D digital image of the frame, on which to detect each item by means of computer vision (CV) tools [7].

2.1. Literature Methods

According to scientific literature, several different CV approaches can be adopted. Considering the task, three among them seem to deserve further investigation: Deterministic template-matching, neural network-based algorithms or brightness-based segmentation. The applicability, effectiveness, and robustness of each of them strictly depend on the typology of the image to be analyzed. It has to be noted that other approaches, such as color-based ones, are not applicable since the wire color can be very close to that of the items.
In more detail, deterministic template-matching algorithms are intended to find, into an image, instances of a given template. For example, OCR (optical character recognition) procedures—which recognize text within pictures (e.g., a PDF file)—are usually built based on template matching algorithms. This approach would be optimal to solve our problem if only the items were arranged on a rigid grid, so that each item was oriented in the same way with respect to the camera. In fact, some companies use galvanic frames, where items are placed into a fixed position on the frame, as shown in Figure 2.
However for such cases, the operators usually fill all the available slots with items, therefore, the number of items on the galvanic frame is known a priori. However, as already mentioned, in the general configuration described previously, the items are knotted on wires and, consequently, their orientation in space is far from being equal. This issue inevitably limits the applicability of deterministic template-based algorithms and makes their adoption inconvenient for the specific case analyzed in this paper.
With respect to this limitation, an evolution of the template-based algorithm, as defined above, can be found in the neural network (NN)-based approaches [8,9,10,11]. Some of them, in fact, are able to detect a specific object independently from its orientation and position in the scene. Among them, YOLO (you only look once) [12] is a state-of-the-art real-time object detection system, targeted for real-time processing. Object detection is a computer technology related to computer vision and image processing that deals with detecting instances of semantic objects of a certain class (humans, cars, etc.) in digital images and videos.
Differently from prior approaches, which apply the model to an image at multiple locations and scales and then high scoring regions of the image are considered detections, YOLO applies the network to the full image. Specifically, the image is divided into an S x S grid and the algorithm returns bounding boxes and predicted probabilities for each of these regions. The method used to compute these probabilities is logistic regression [13]. This way, other than performing a very fast detection, predictions are informed by the global context in the image.
Off-the-shelf YOLO nets with pre-trained weights, but is not able to give predictions on our subject of interest, as they have not been trained in detecting these particular objects (see Figure 3).
On the other hand, to achieve a proper result using these networks, it is not sufficient to provide a limited number of training images (e.g., ten to twenty images). In the light of these considerations, and given that the shape of the items can change frequently (each month, all lots can be completely new), it is not practical for users to train the algorithm each time.
For this reason, another approach has been explored: The classical brightness-based segmentation [14,15,16]. Assuming that the item brightness (or range of brightness) is different from that of the background, it is possible to isolate the background itself. The resulting image contains only pixels belonging to the items and connecting wires. Unfortunately, wire and item colors can be so close that color segmentation cannot be used to separate the one from the other. Fortunately, since wires are thinner than items, their pixels can be removed by means of CV tools such as pixel erosion/dilation. The number of separate clusters of pixels describing the items can then be easily retrieved by means of labeling tools.
In detail, a threshold value (or at least a range) must be used in order to isolate on the image only pixels relative to the items to be counted. Supposing that the threshold operation works flawlessly, a binary image can be obtained, where white pixels represent items to be counted and black pixels are the background and the wires. Afterward, many well-known algorithms can be used to count the number of isolated regions in binary images.

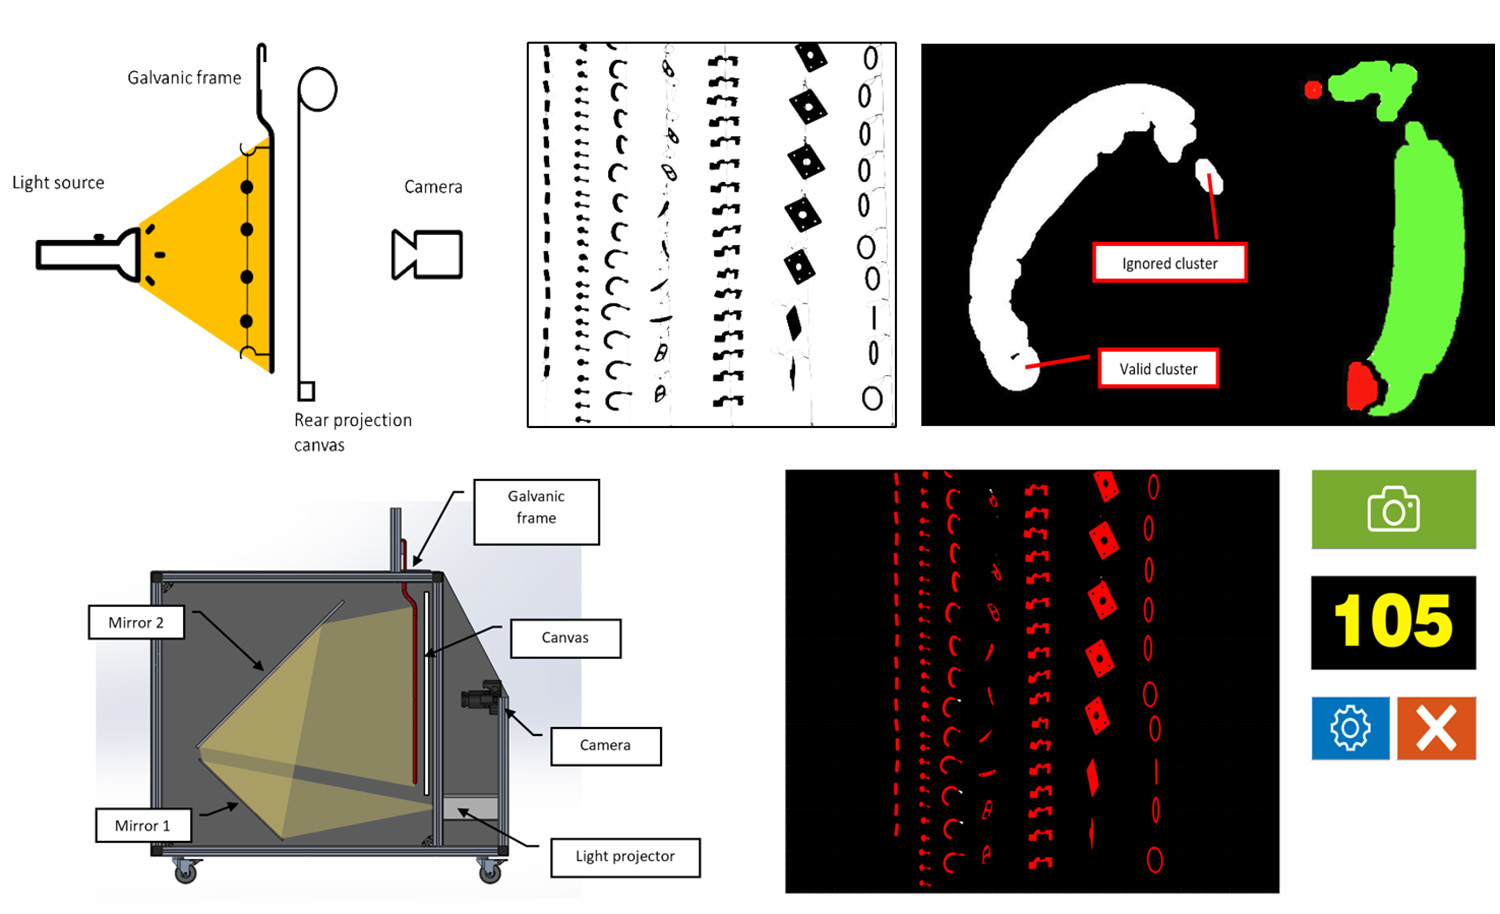
2.2. Image Acquisition Requirements

The brightness-based segmentation approach seems the most promising for the specific application but needs to be tailored to the peculiarities entailed by the small dimensions and high reflectivity of the items to be counted. Consequently, the definition of a proper input image has primary importance for the success of the method.
Depending on the finishing and on the material of which the items are made, their aspect is rarely opaque but rather it is highly reflexive. Obviously, even color may change, varying from copper-like to silver and gold, thus resulting in different brightness. All these characteristics make it very difficult (or even impossible) to obtain satisfactory threshold values or ranges, on which set the segmentation.
To make it more complicated, the silhouette of the same items knotted to the galvanic frame varies significantly, due to their almost-random orientation. Moreover, the placement is far from being equally spaced.
Therefore, in order to make the segmentation algorithms effective, it is of critical importance to obtain a suitable image, where it is possible to separate the items from the background. To this purpose, three different lighting settings have been considered in order to evaluate their efficacy in favoring image segmentation operations:
  • Frontal lighting with a black uniform background;
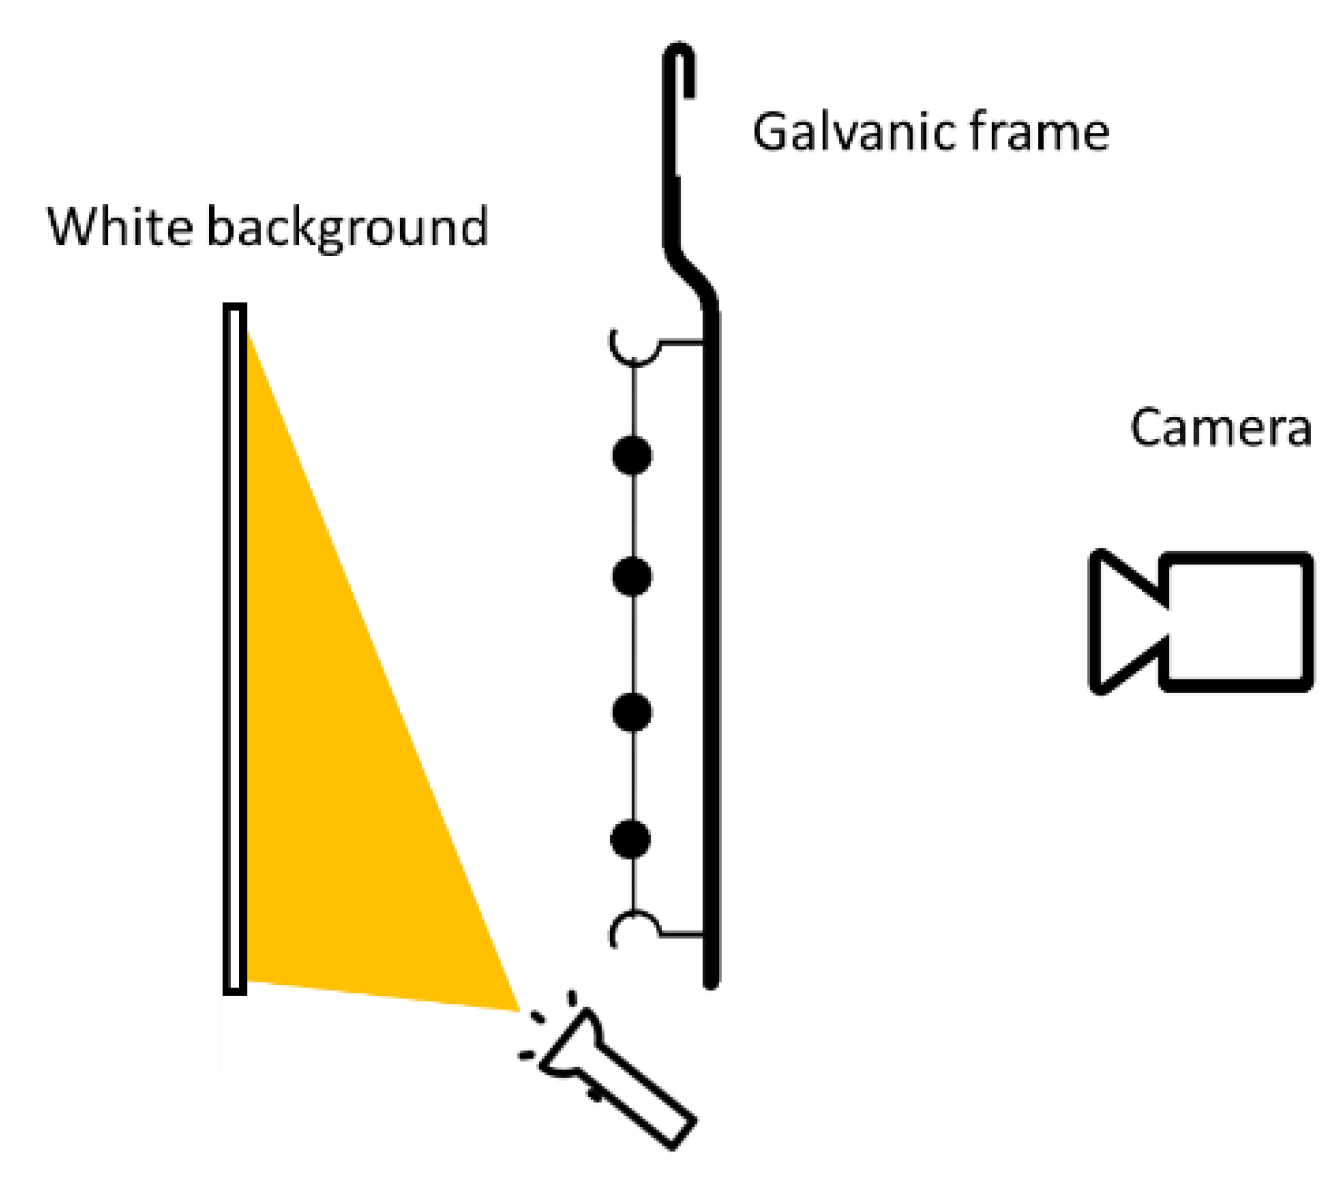
  • Lighted white background;
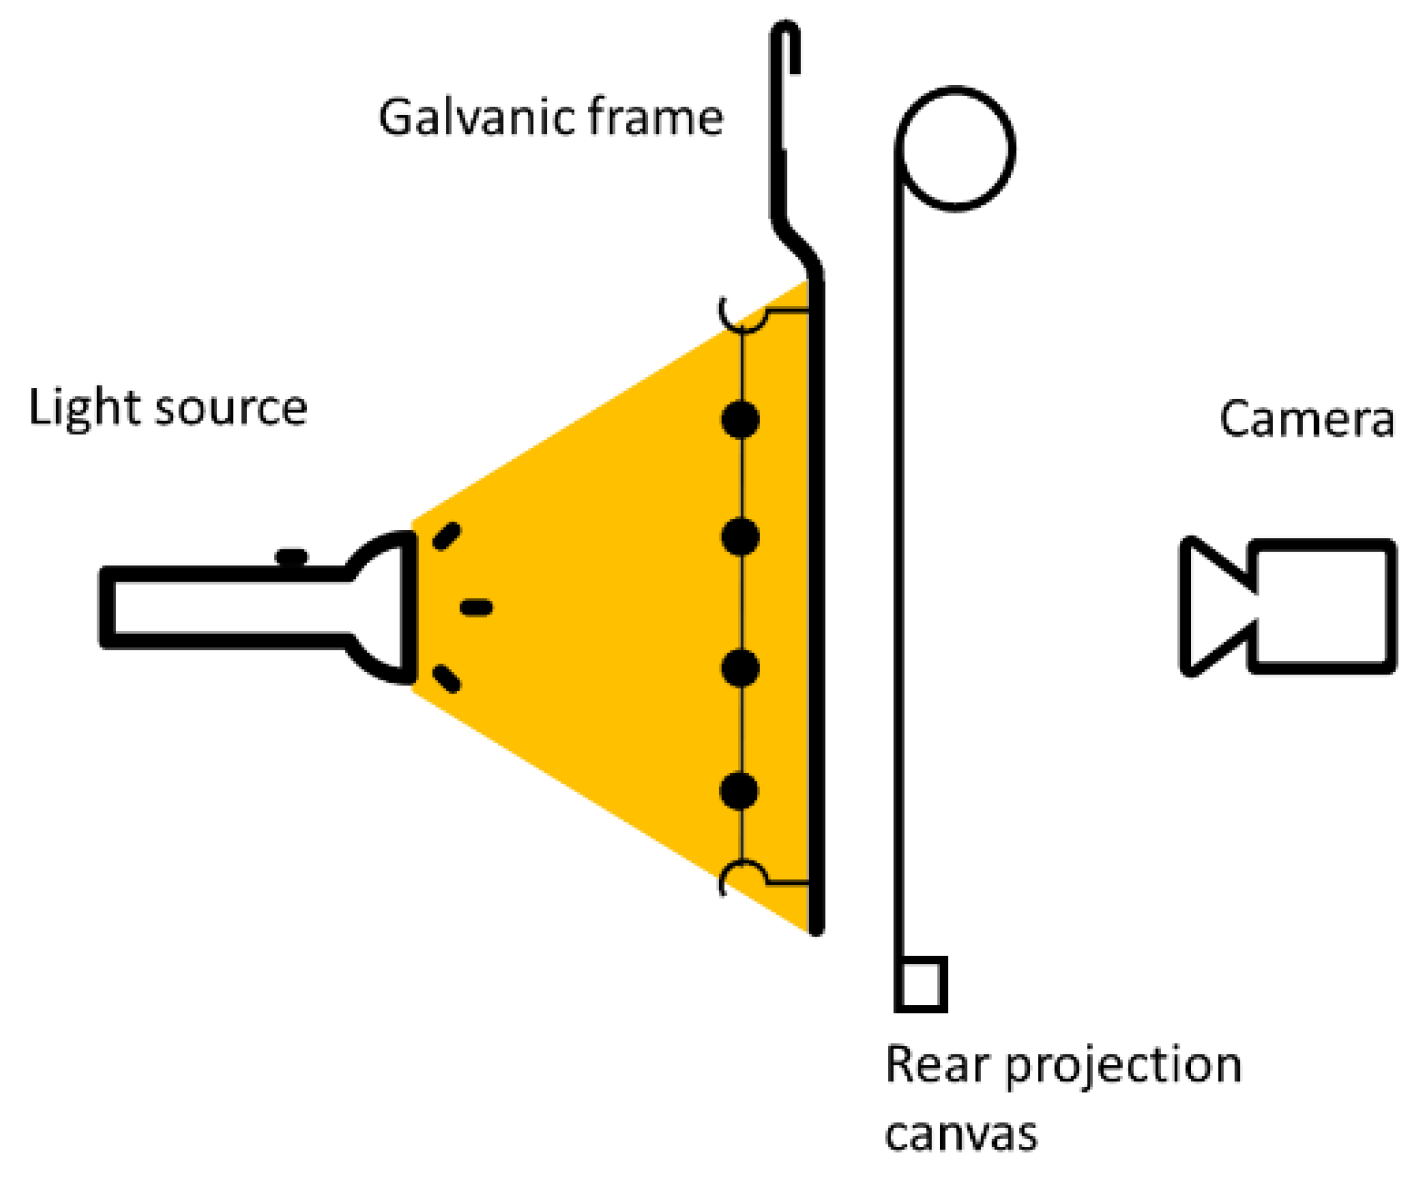
  • Light rear-projection.

2.3. Light Settings

In industrial practice, a single galvanic frame is filled with a number of identical items. In order to make the performed tests representative and speed-up the testing process, we chose to use typical galvanic frames filled with a variety of items of different shapes and dimensions arranged on vertical metal wires, instead of using multiple frames (each one with a single item typology). Image acquisition was carried out by using a Fujifilm T1 SLR camera (APS-C sensor format, Fujifilm Holdings Corporation, Tokio, Japan) and an 18 mm focal length lens. The acquired images had a resolution of 15.8 megapixels (4826 × 3264 pixels).

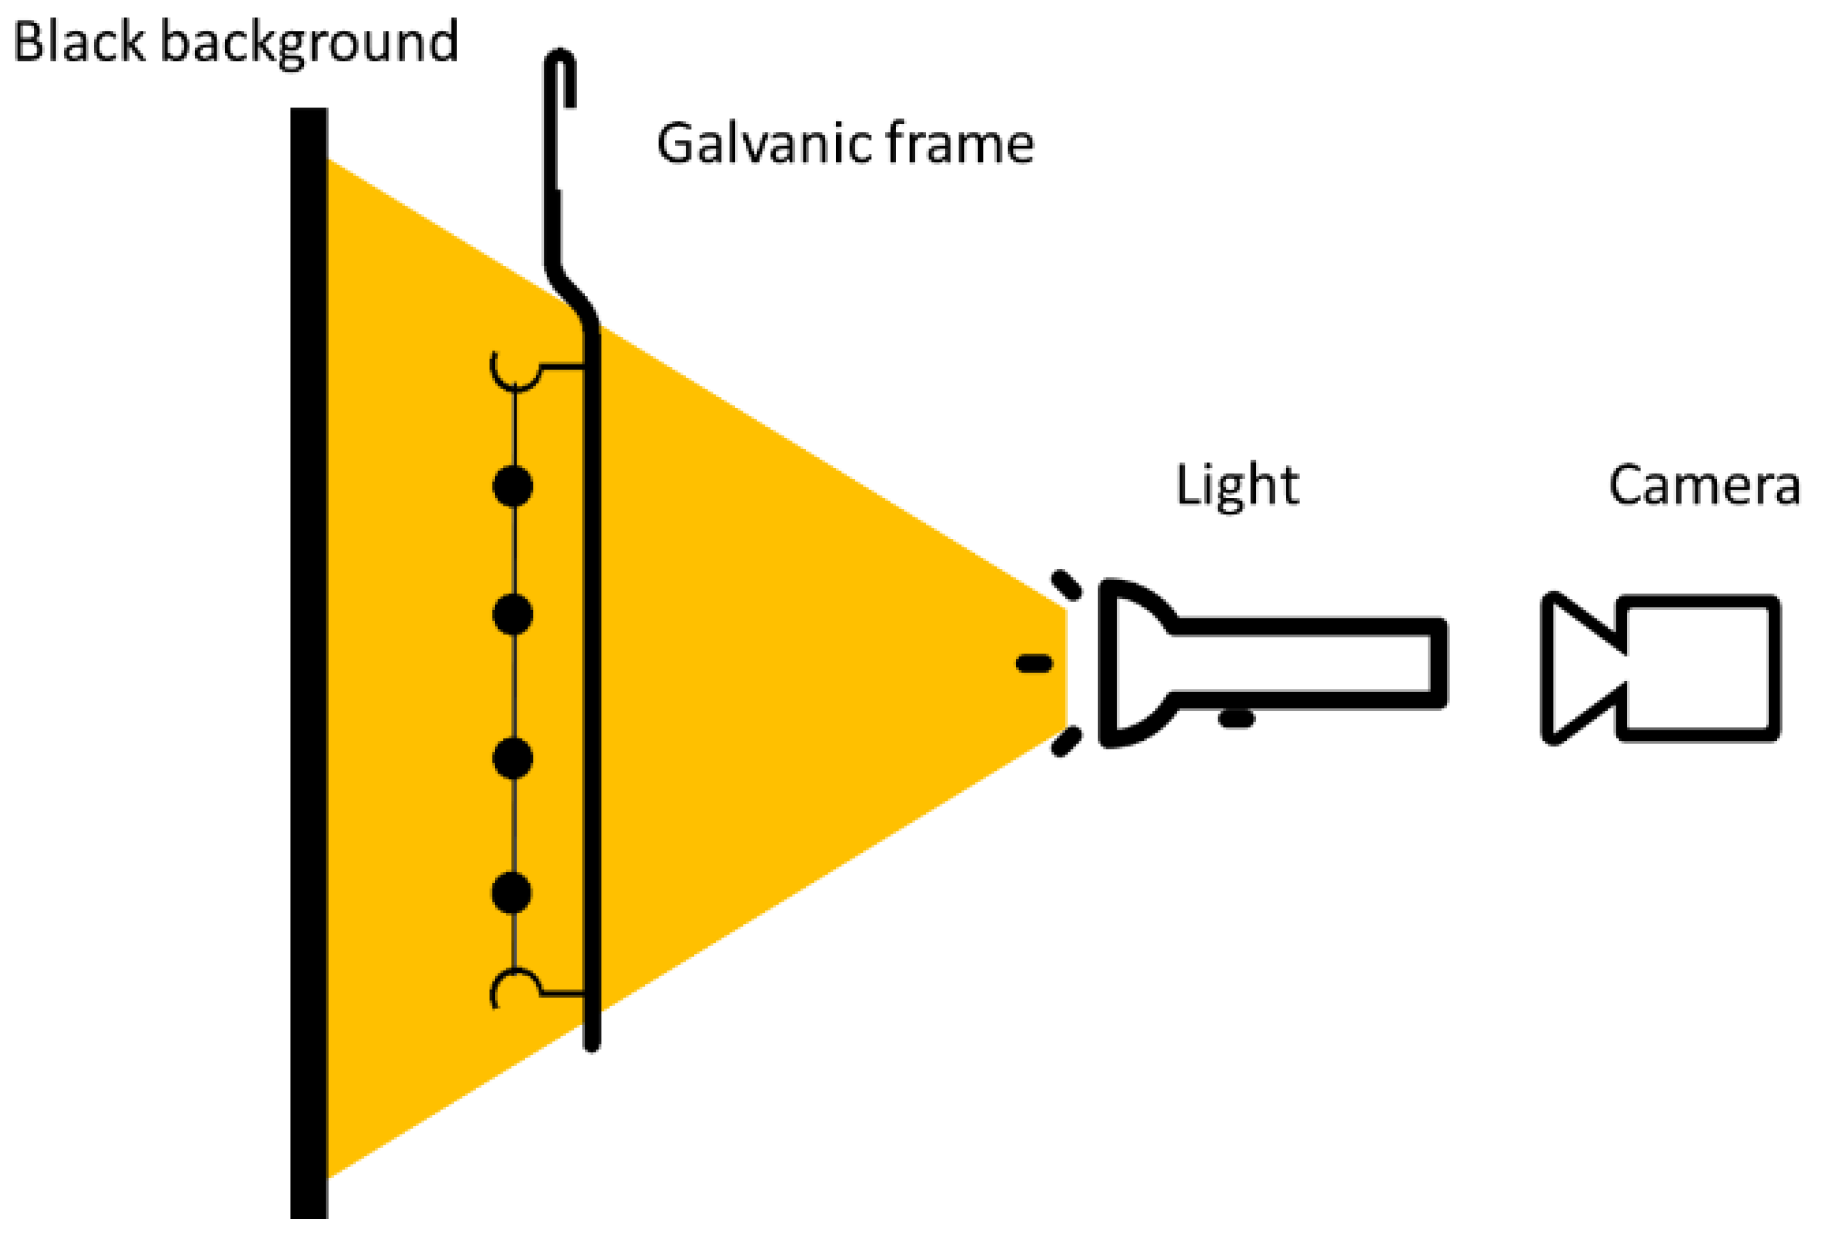
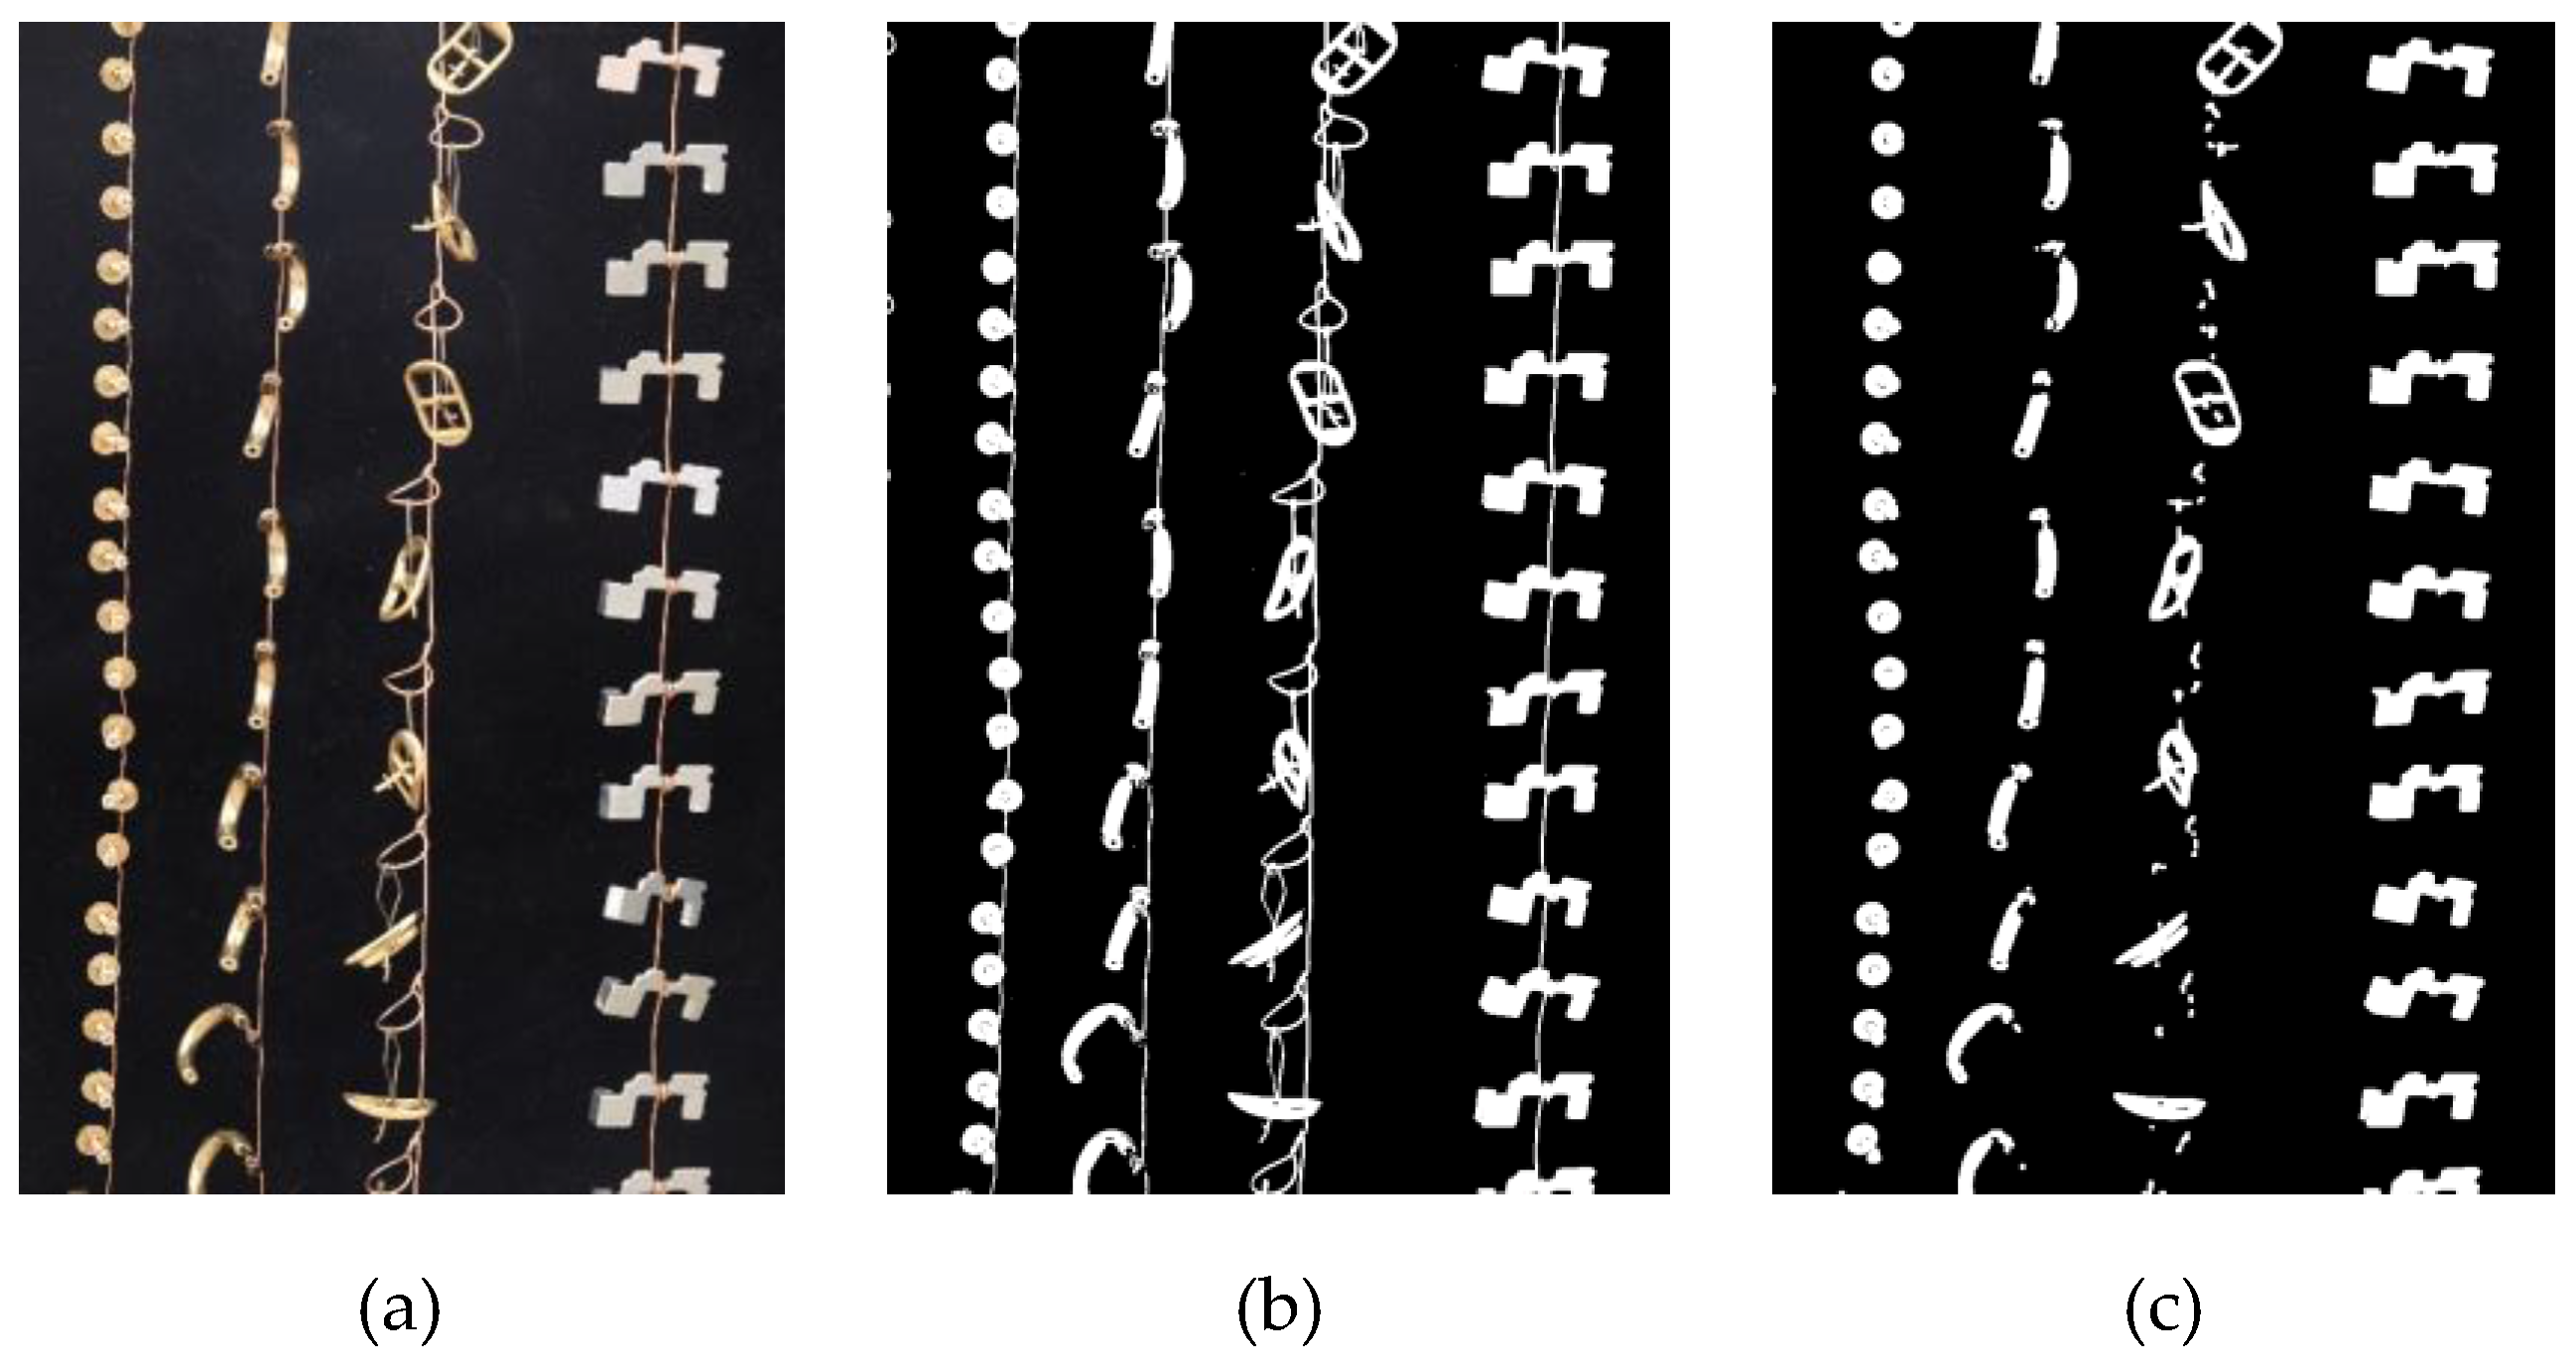
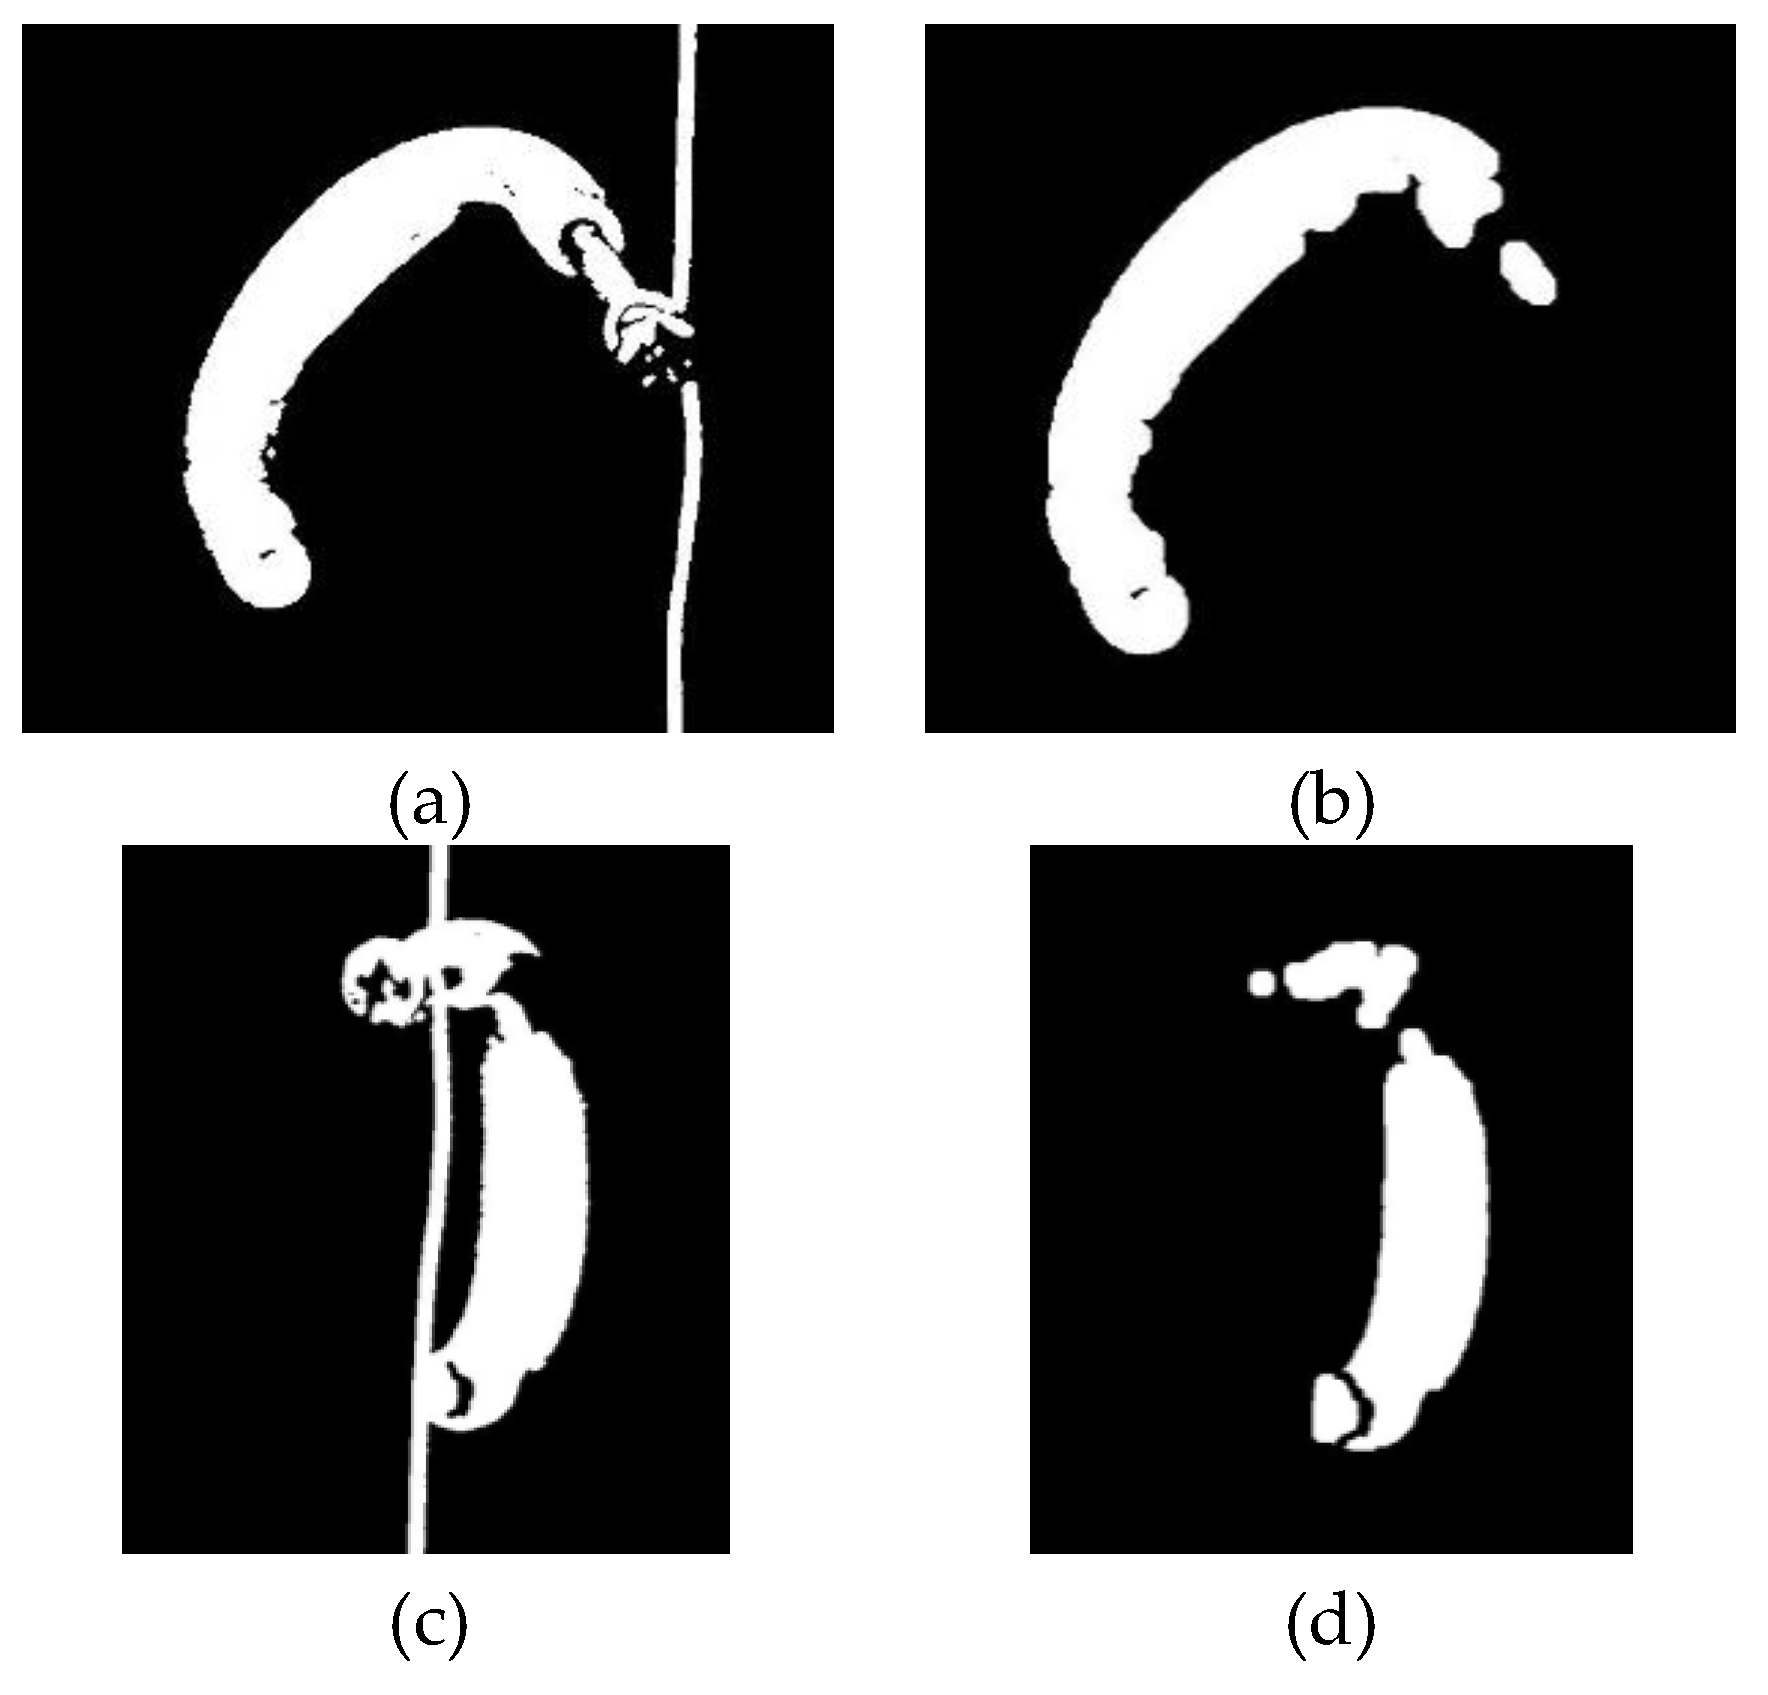
2.3.1. Frontal Light with Black Uniform Background

The first tested layout setting is meant to physically isolate items from the rest of the scene by putting an opaque black canvas behind the frame. The frame, containing four different item typologies, is positioned approximately perpendicular to the camera optical axis at a distance of 500 mm, so that the frame occupies completely the field of view. The set (see Figure 4) is illuminated by a frontal lighting source (800 lm focusable LED torch, Essilor International S.A., Paris, France). This layout allows obtaining an almost-uniform black background on which the item shape appears enhanced.
In the resulting digital image, background pixels are characterized by low brightness. On the contrary, the items pixel brightness has, as expected, high values due to the frontal and strong illumination (see for instance Figure 5a, referred to four different kind of items). However, this layout is not optimal for a number of reasons. First, the background subtraction (i.e., to subtract from the image to be analyzed a reference image of the background canvas acquired prior to positioning the galvanic frame) is not applicable, since shadows/reflections projected on the canvas by the items and the wires make the background itself different from the reference.
In addition, brightness-based segmentation leads to two additional main issues, as explained below:
  • Items and background pixels may be incorrectly detected/assigned;
  • The wire and item brightness are similar and thus difficult to separate.
Starting from Figure 5a, it was not possible to isolate the items from the wires by thresholding, as shown in Figure 5b, since the resulting binary image also contained also the wires. The only filtering operation that could allow wires deletion is image erosion. Unfortunately, since the item dimensions and wire thicknesses are similar, the operation (even if combined with successive dilation filtering, thus performing a morphological opening) led to sub-fragmentation of single items into multiple pixel clusters (see Figure 5c), thus invalidating the successive counting operation.
Observing in detail the image of two items (named item A and B, respectively) right after thresholding (Figure 6a,c), the first issue became evident. It was noted that, for some items, the darkest pixels were mistakenly assigned to background. Consequently, some of them already fragmented into multiple parts (see Figure 6b,d). In other cases, the effects were less evident but equally dangerous, due to the successive (required) erosion operation. As shown in Figure 6c, the items may result so thinned that successive operations unavoidably cause fragmentation.
In more detail, sub-fragmentation can occur in two possible scenarios: In the presence of bridges (Figure 6a) or in the case of inner holes (Figure 6c). In the first case, the thickness of the bridge may be similar to the thickness of the wires to be removed. Consequently, a common occurrence was that the morphological opening on the binary image (i.e., the erosion followed by dilation) removed both the wires and bridges, thus causing undesired fragmentation of the cluster (Figure 6d). Similarly, in the case of the inner holes—given by the actual shape of the item or caused by thresholding—morphological opening may cause fragmentation.
This issue can be possibly avoided by using a morphological image closure (i.e., the dilation followed by erosion) followed by an additional erosion. Figure 7a demonstrates the result of such an operation applied to Figure 6c.
However, this solution may also lead to some unwanted side effects that make this alternative unsuitable. In fact, in Figure 7b, it can be noted that, in some cases, the wires formed closed loops in the image. Such loops may result in being completely closed by a morphological closing filtering. If sufficiently large, they can be easily mistaken for items in the counting phase. In addition, if a couple of items are sufficiently close, the filter may cause the fusion of the relative clusters into one (see Figure 7c).
Between the two alternatives proposed above, the better performance proved to be the first one (i.e., the morphological opening-based solution). Starting from the morphologically opened image (see Figure 5c), the connected regions representing the actual items needed to be discriminated from the ones representing small wire portions and/or item fragments. To this aim, an elective method could be to perform area-based discrimination, carried out by imposing an appropriate area threshold.
Since the item dimensions are widely variable and unknown a priori, a fixed area threshold value cannot be based on the item dimension itself. On the contrary, the wire dimension is constant. Accordingly, it is possible to define a fixed area threshold under which clusters are considered too small to be an item, thus must be ignored. Considering that the wire thickness is approximately 1 mm—corresponding to 7 pixels in the image (based on the shooting setup described in the previous section), a limit dimension was set at 4 mm2—corresponding to 200 pixels. In the example shown in Figure 8a, this method allowed appropriate discarding of small clusters.
However, in several other situations, such as the one depicted in Figure 8b, this criterion led to misclassification. This was mainly due to the heavy image cluster fragmentation induced by the acquisition setup and the subsequent image filtering. Other than the simple criterion described above, other more complex techniques have been tested in order to cluster pixel regions, namely k-means clustering and Support Vector Machine (SVM) [17,18]. The results, not detailed in the present paper, show that this misclassification still occurs.

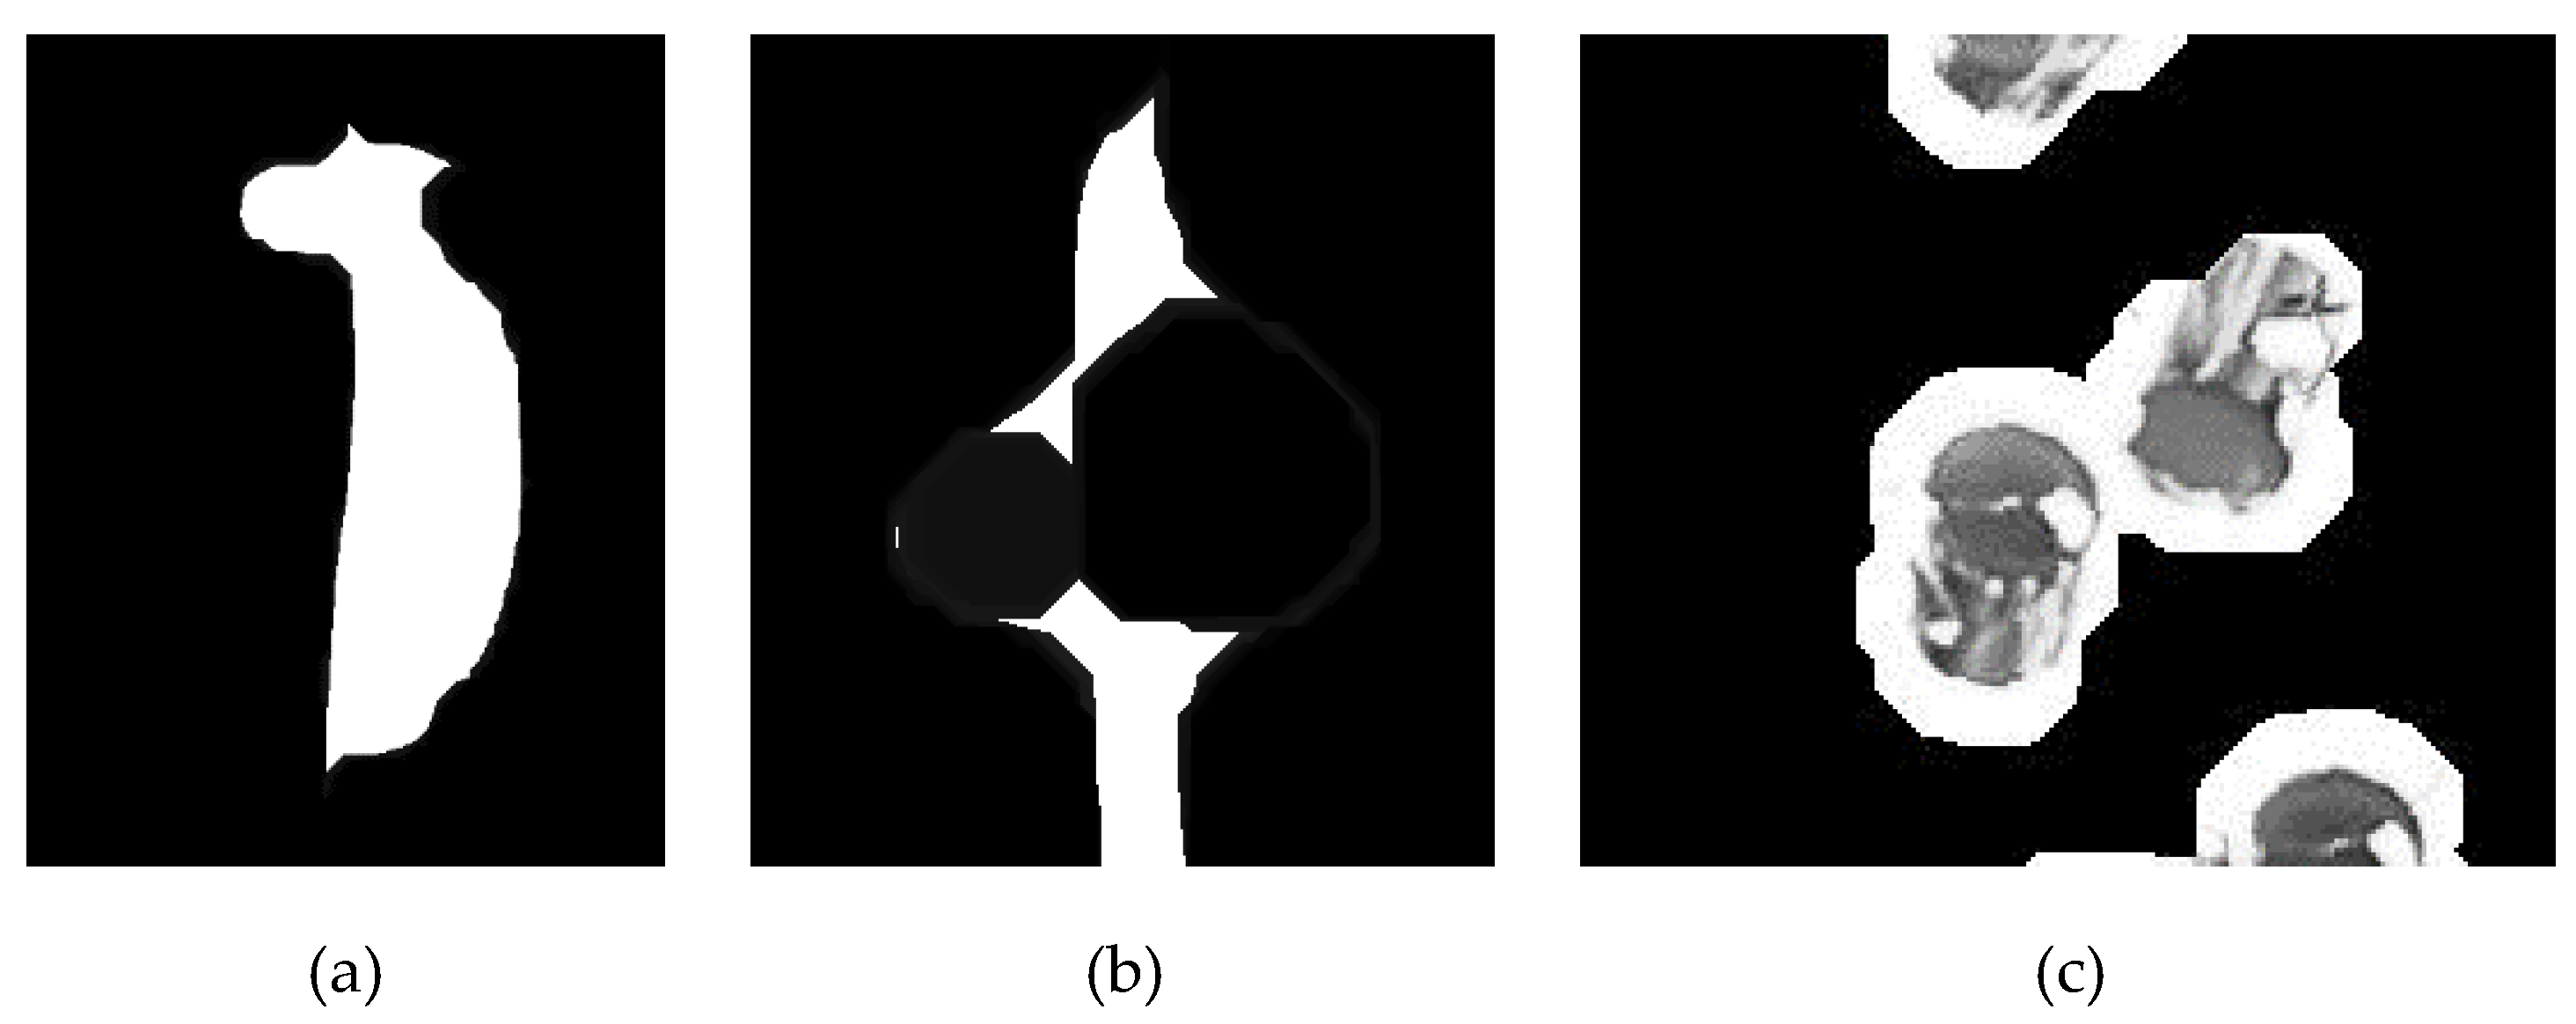
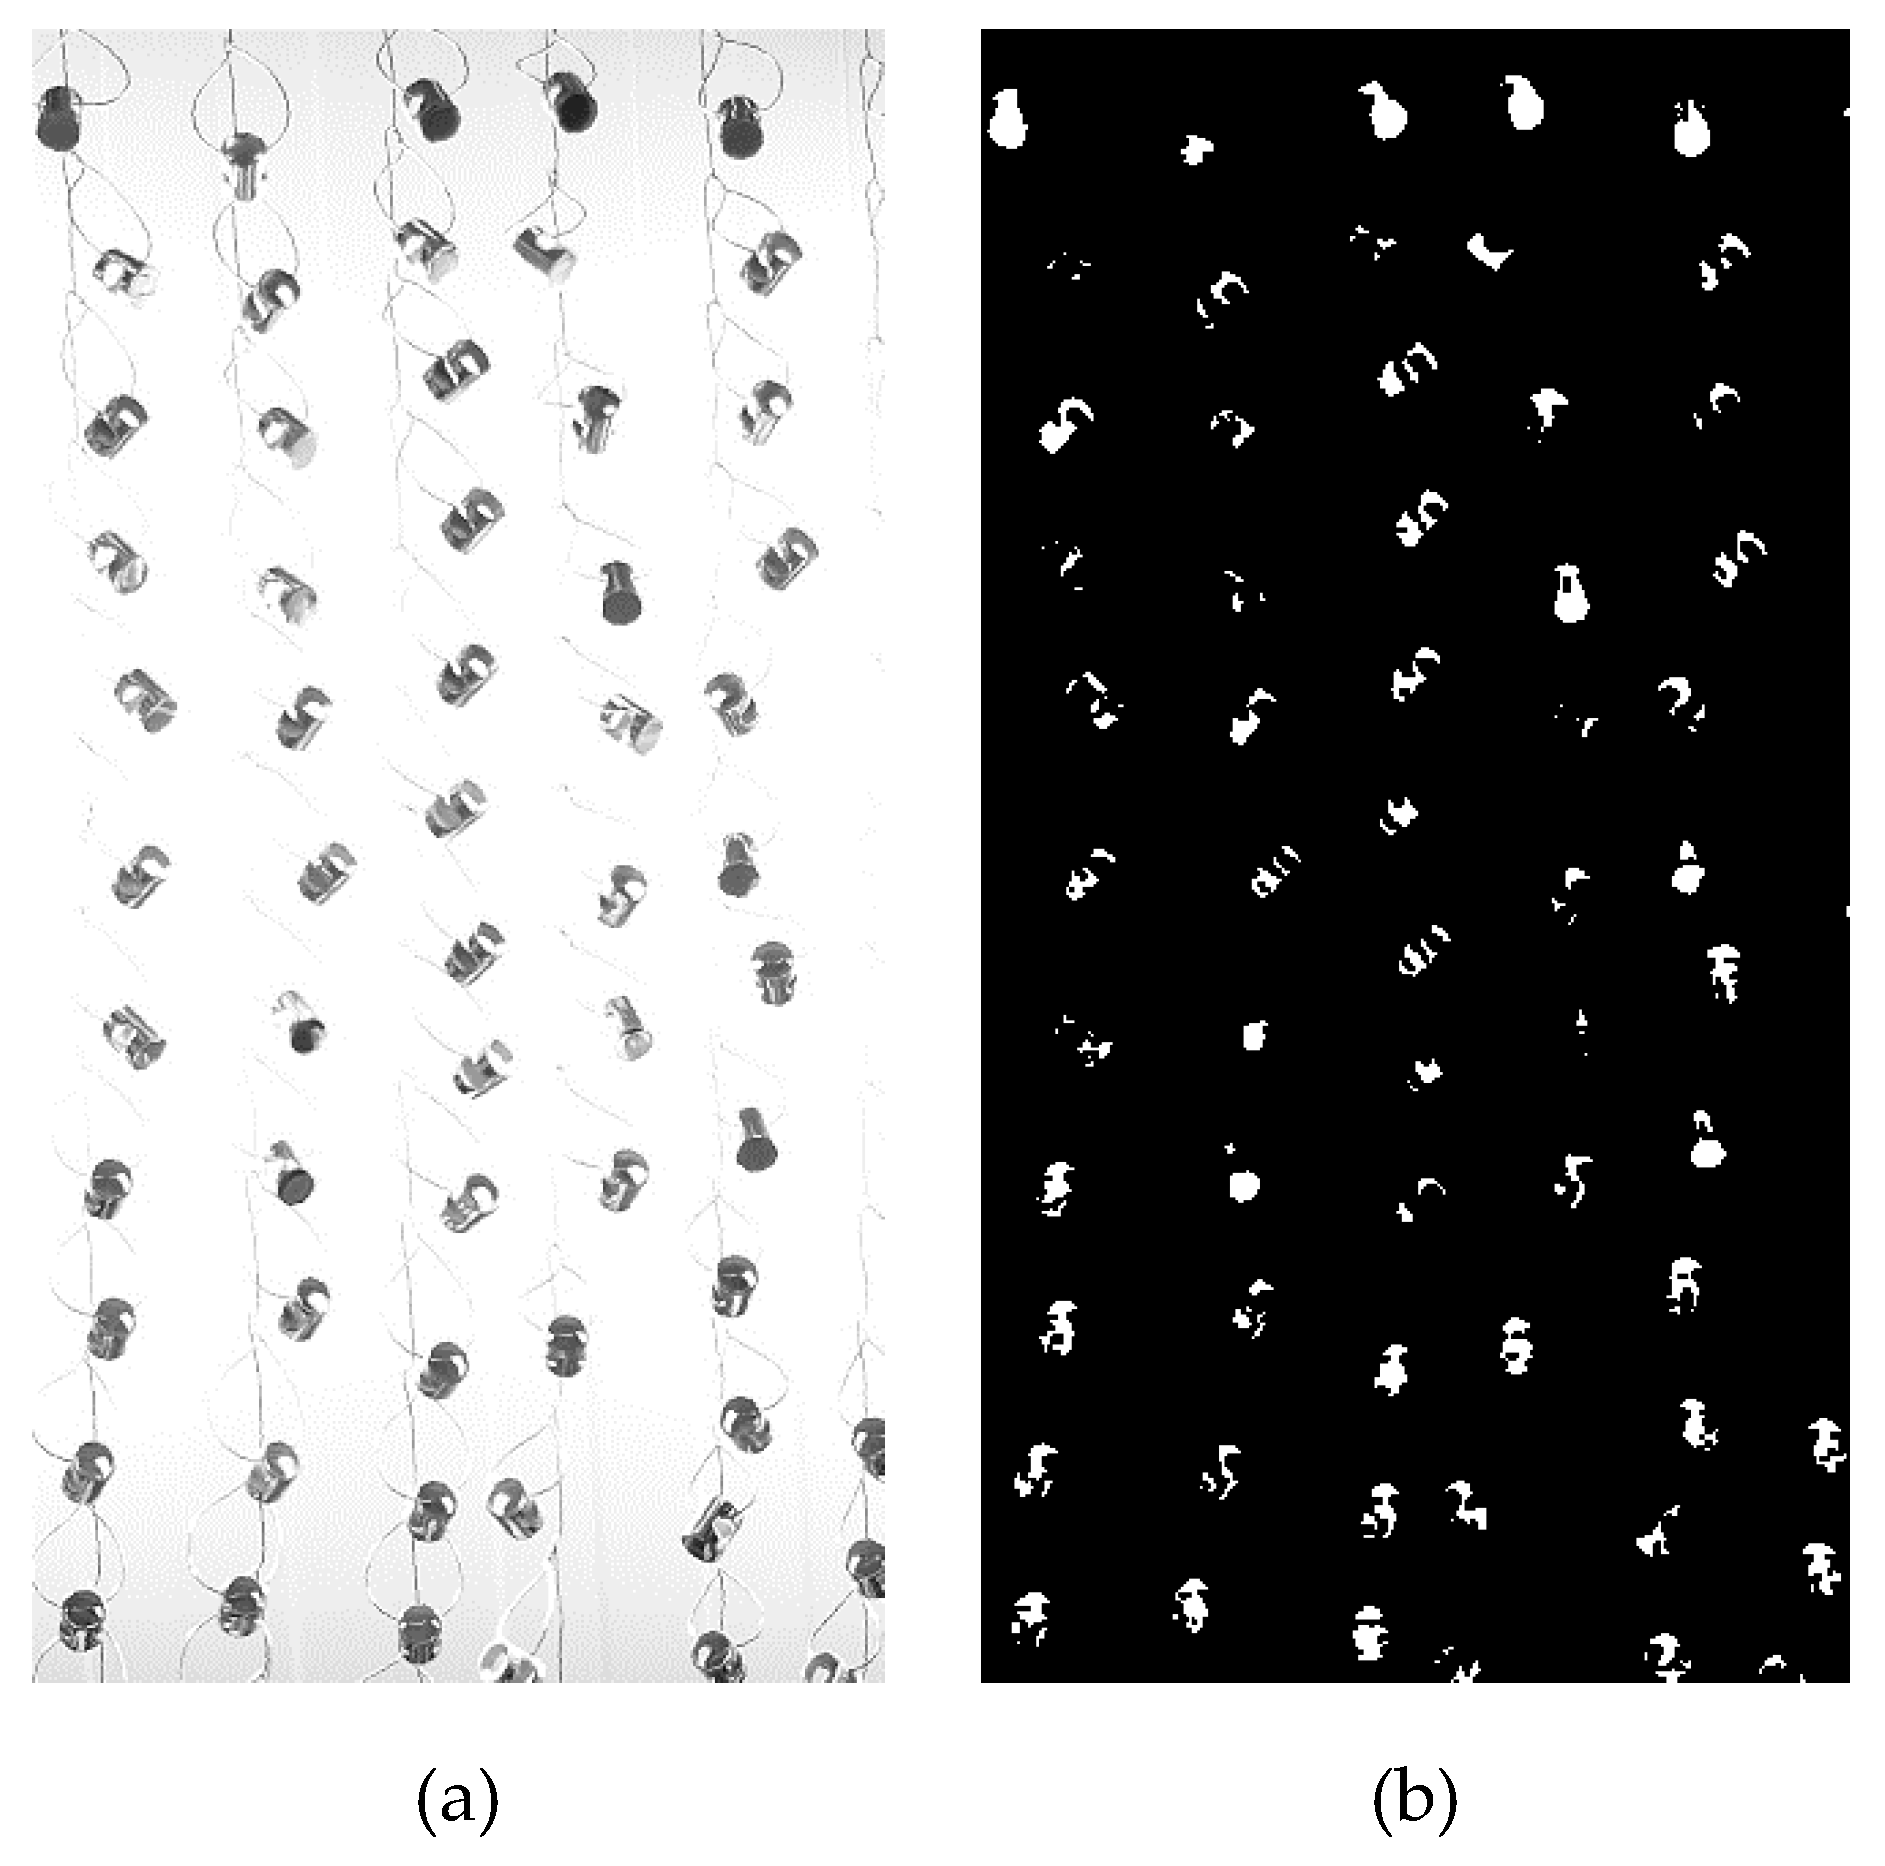
2.3.2. Lighted Background

Moving from the issues faced with the first setting, the second layout makes use of backlighting. The galvanic frame, containing a set of identical items, is arranged between the camera and an approximately uniformly illuminated white background (see Figure 9).
Under the proper camera settings, the lights saturate the brightness for the background, while the pixels belonging to the items generally appear darker (Figure 10a).
Awkwardly, many item regions appeared bright due to specular reflections/inter-reflections among the items themselves. Similarly to the configuration described in the previous section, over-fragmentation issues arose. In fact, despite the setup, the entire background was better detected and isolated. Some item portions, which appeared light due to the inter-reflections mentioned above, were mistakenly assigned to the background (see Figure 10b). Even using morphological operators similar to the ones described in Section 2.3.1, the fragmentation issue persisted, making it practically unfeasible to correctly classify the pixel clusters.

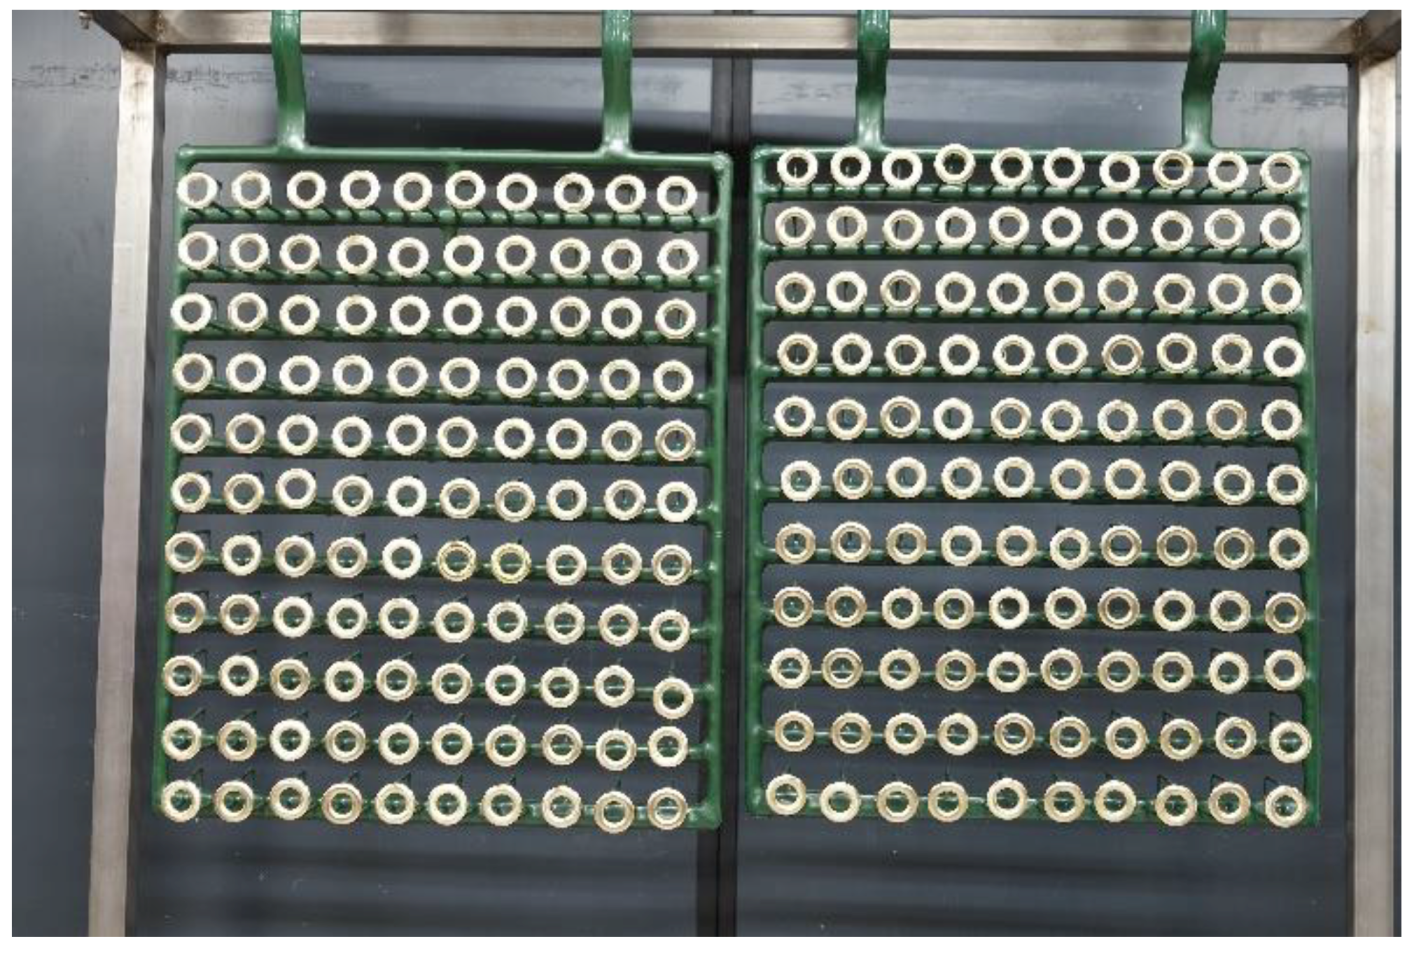
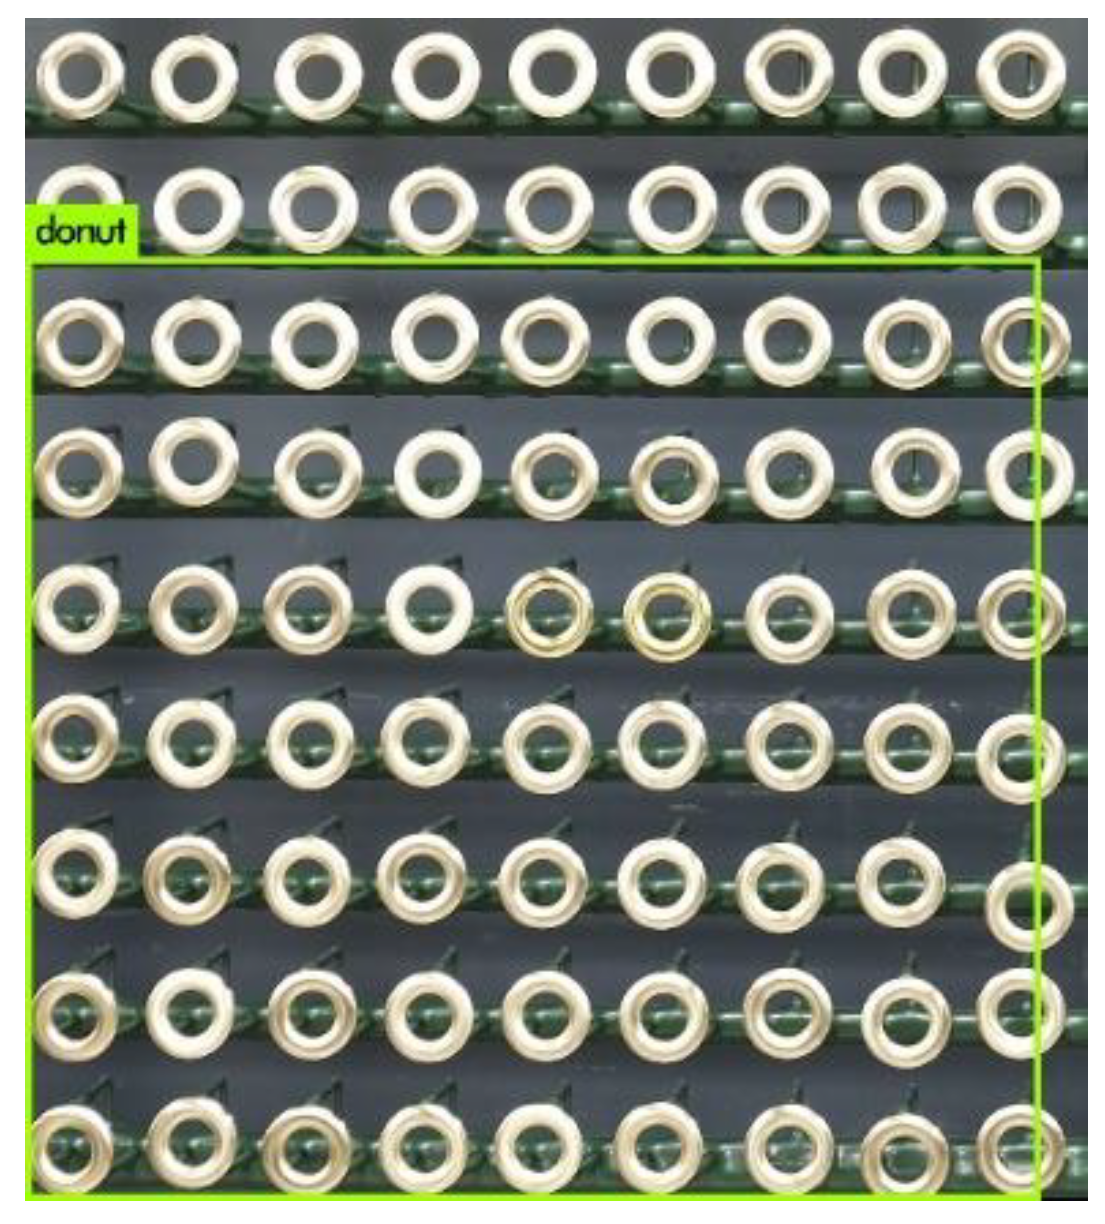
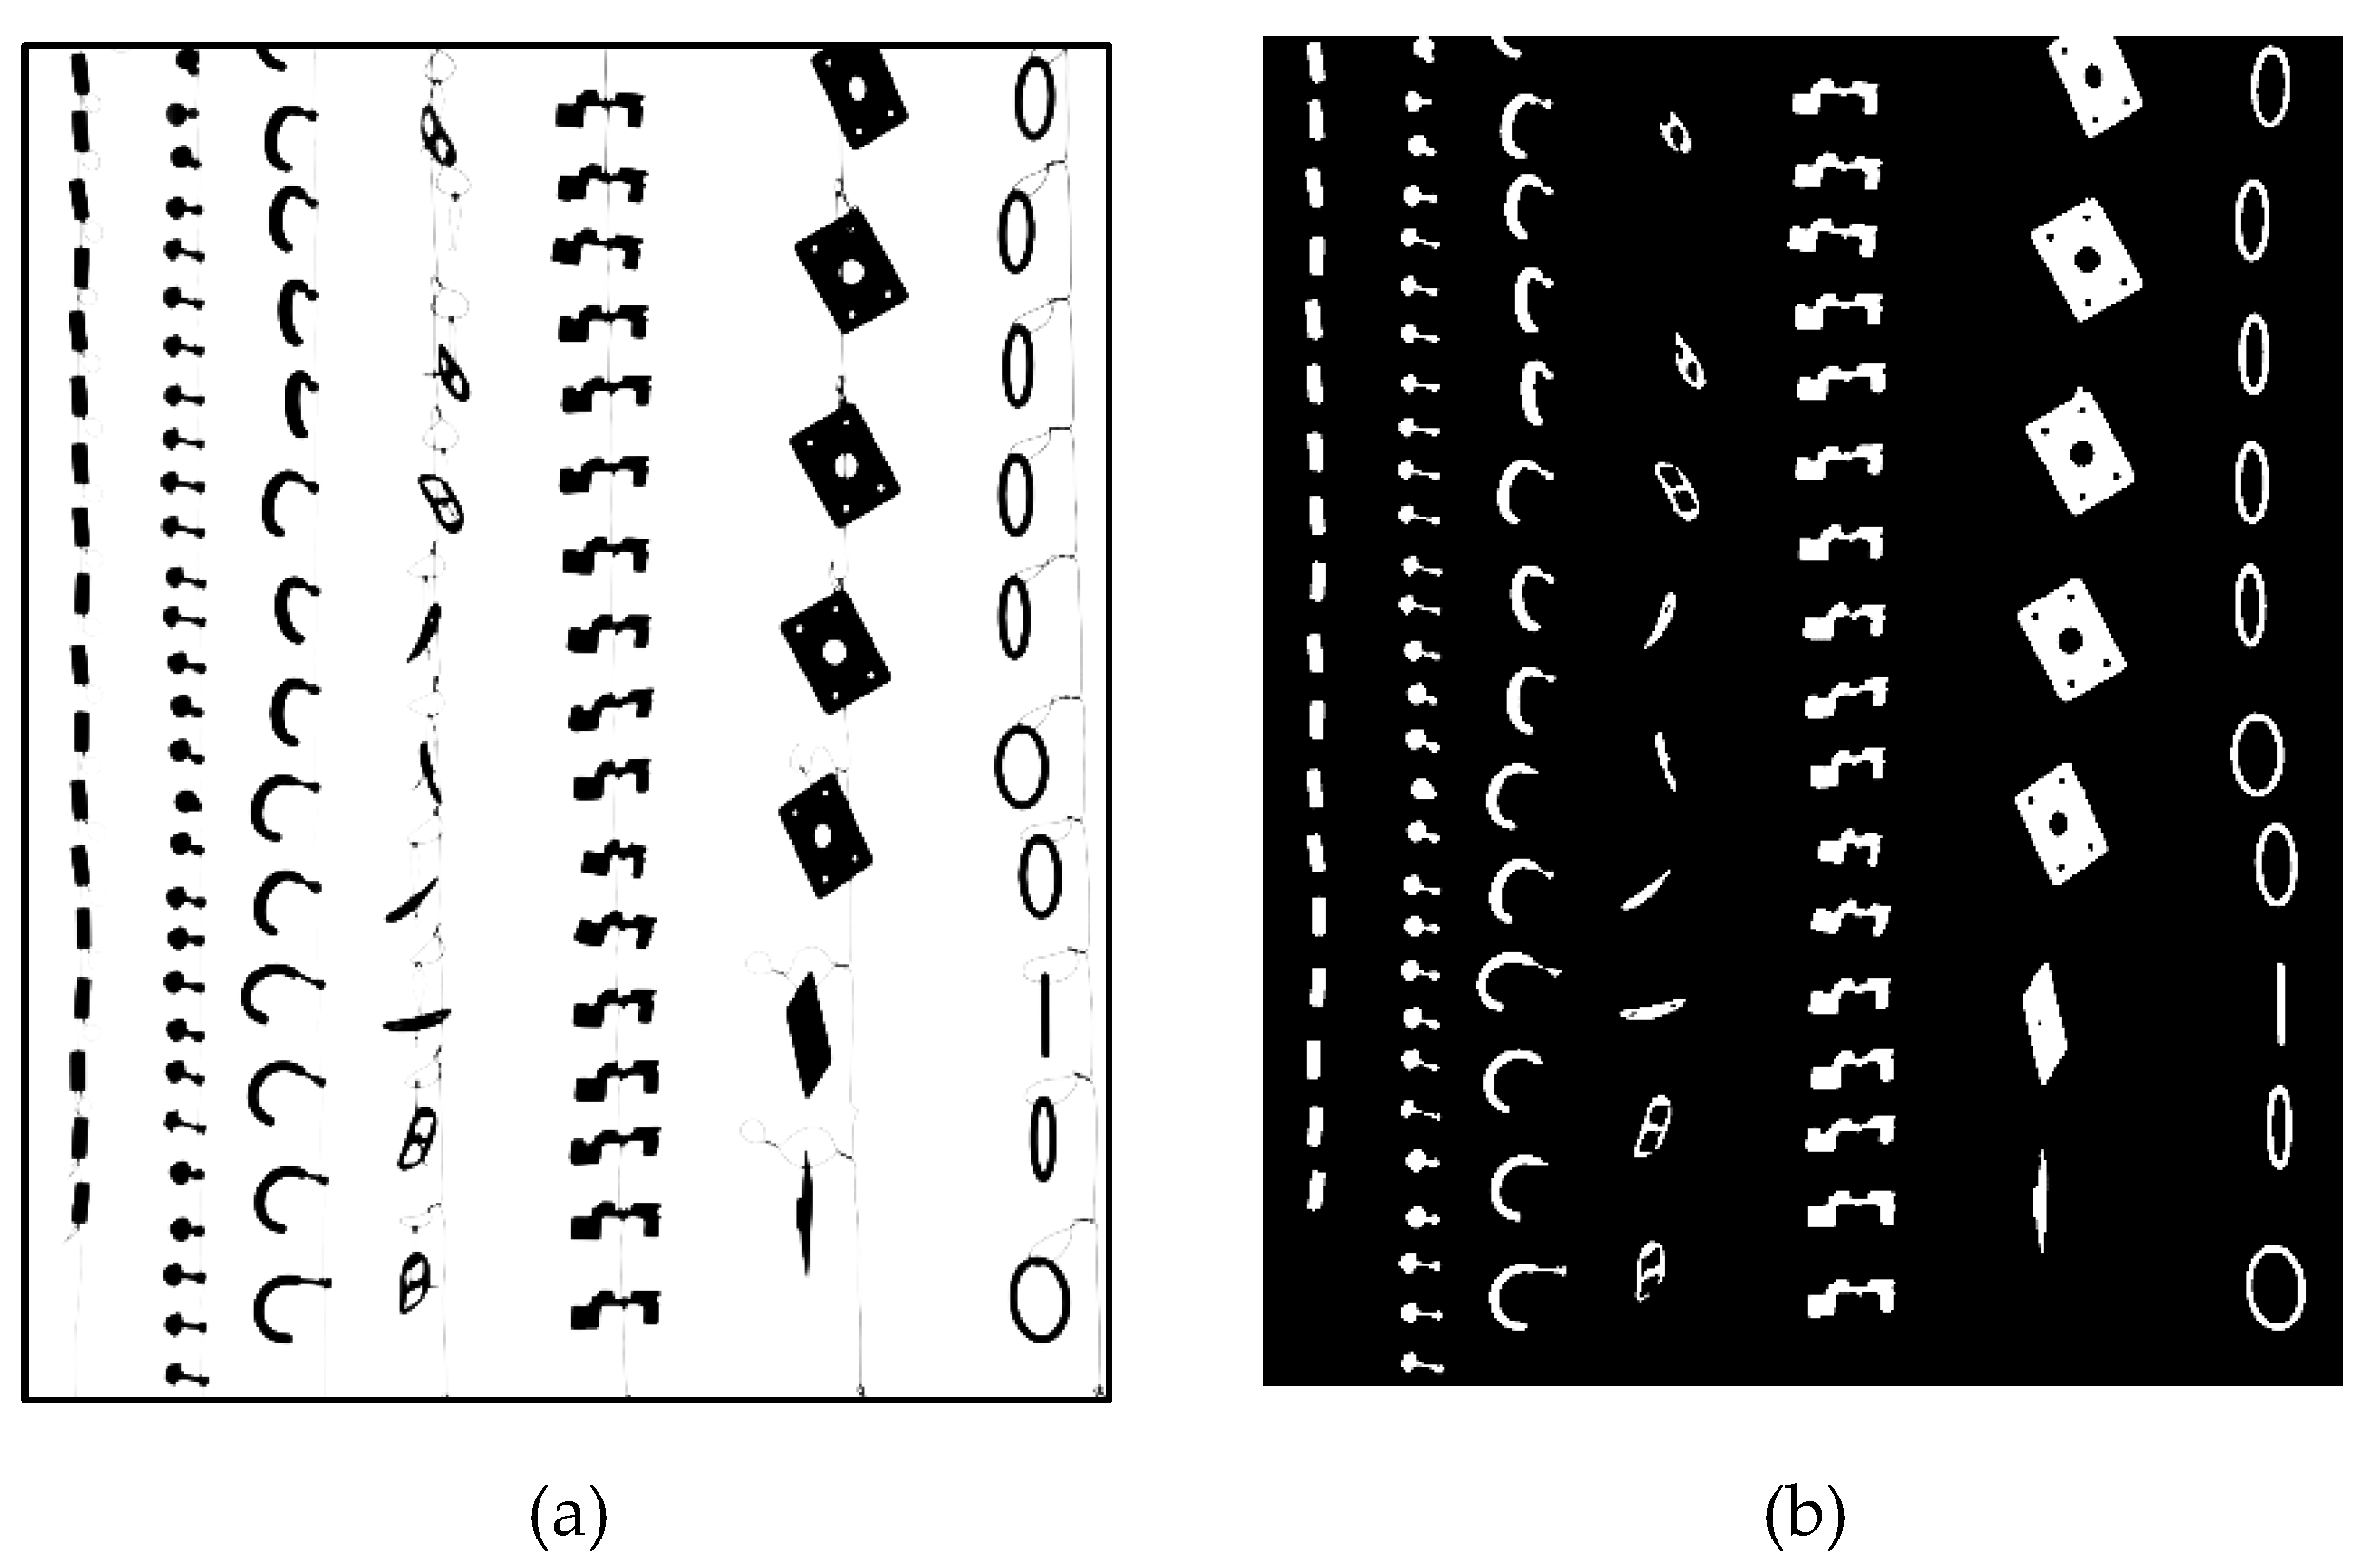
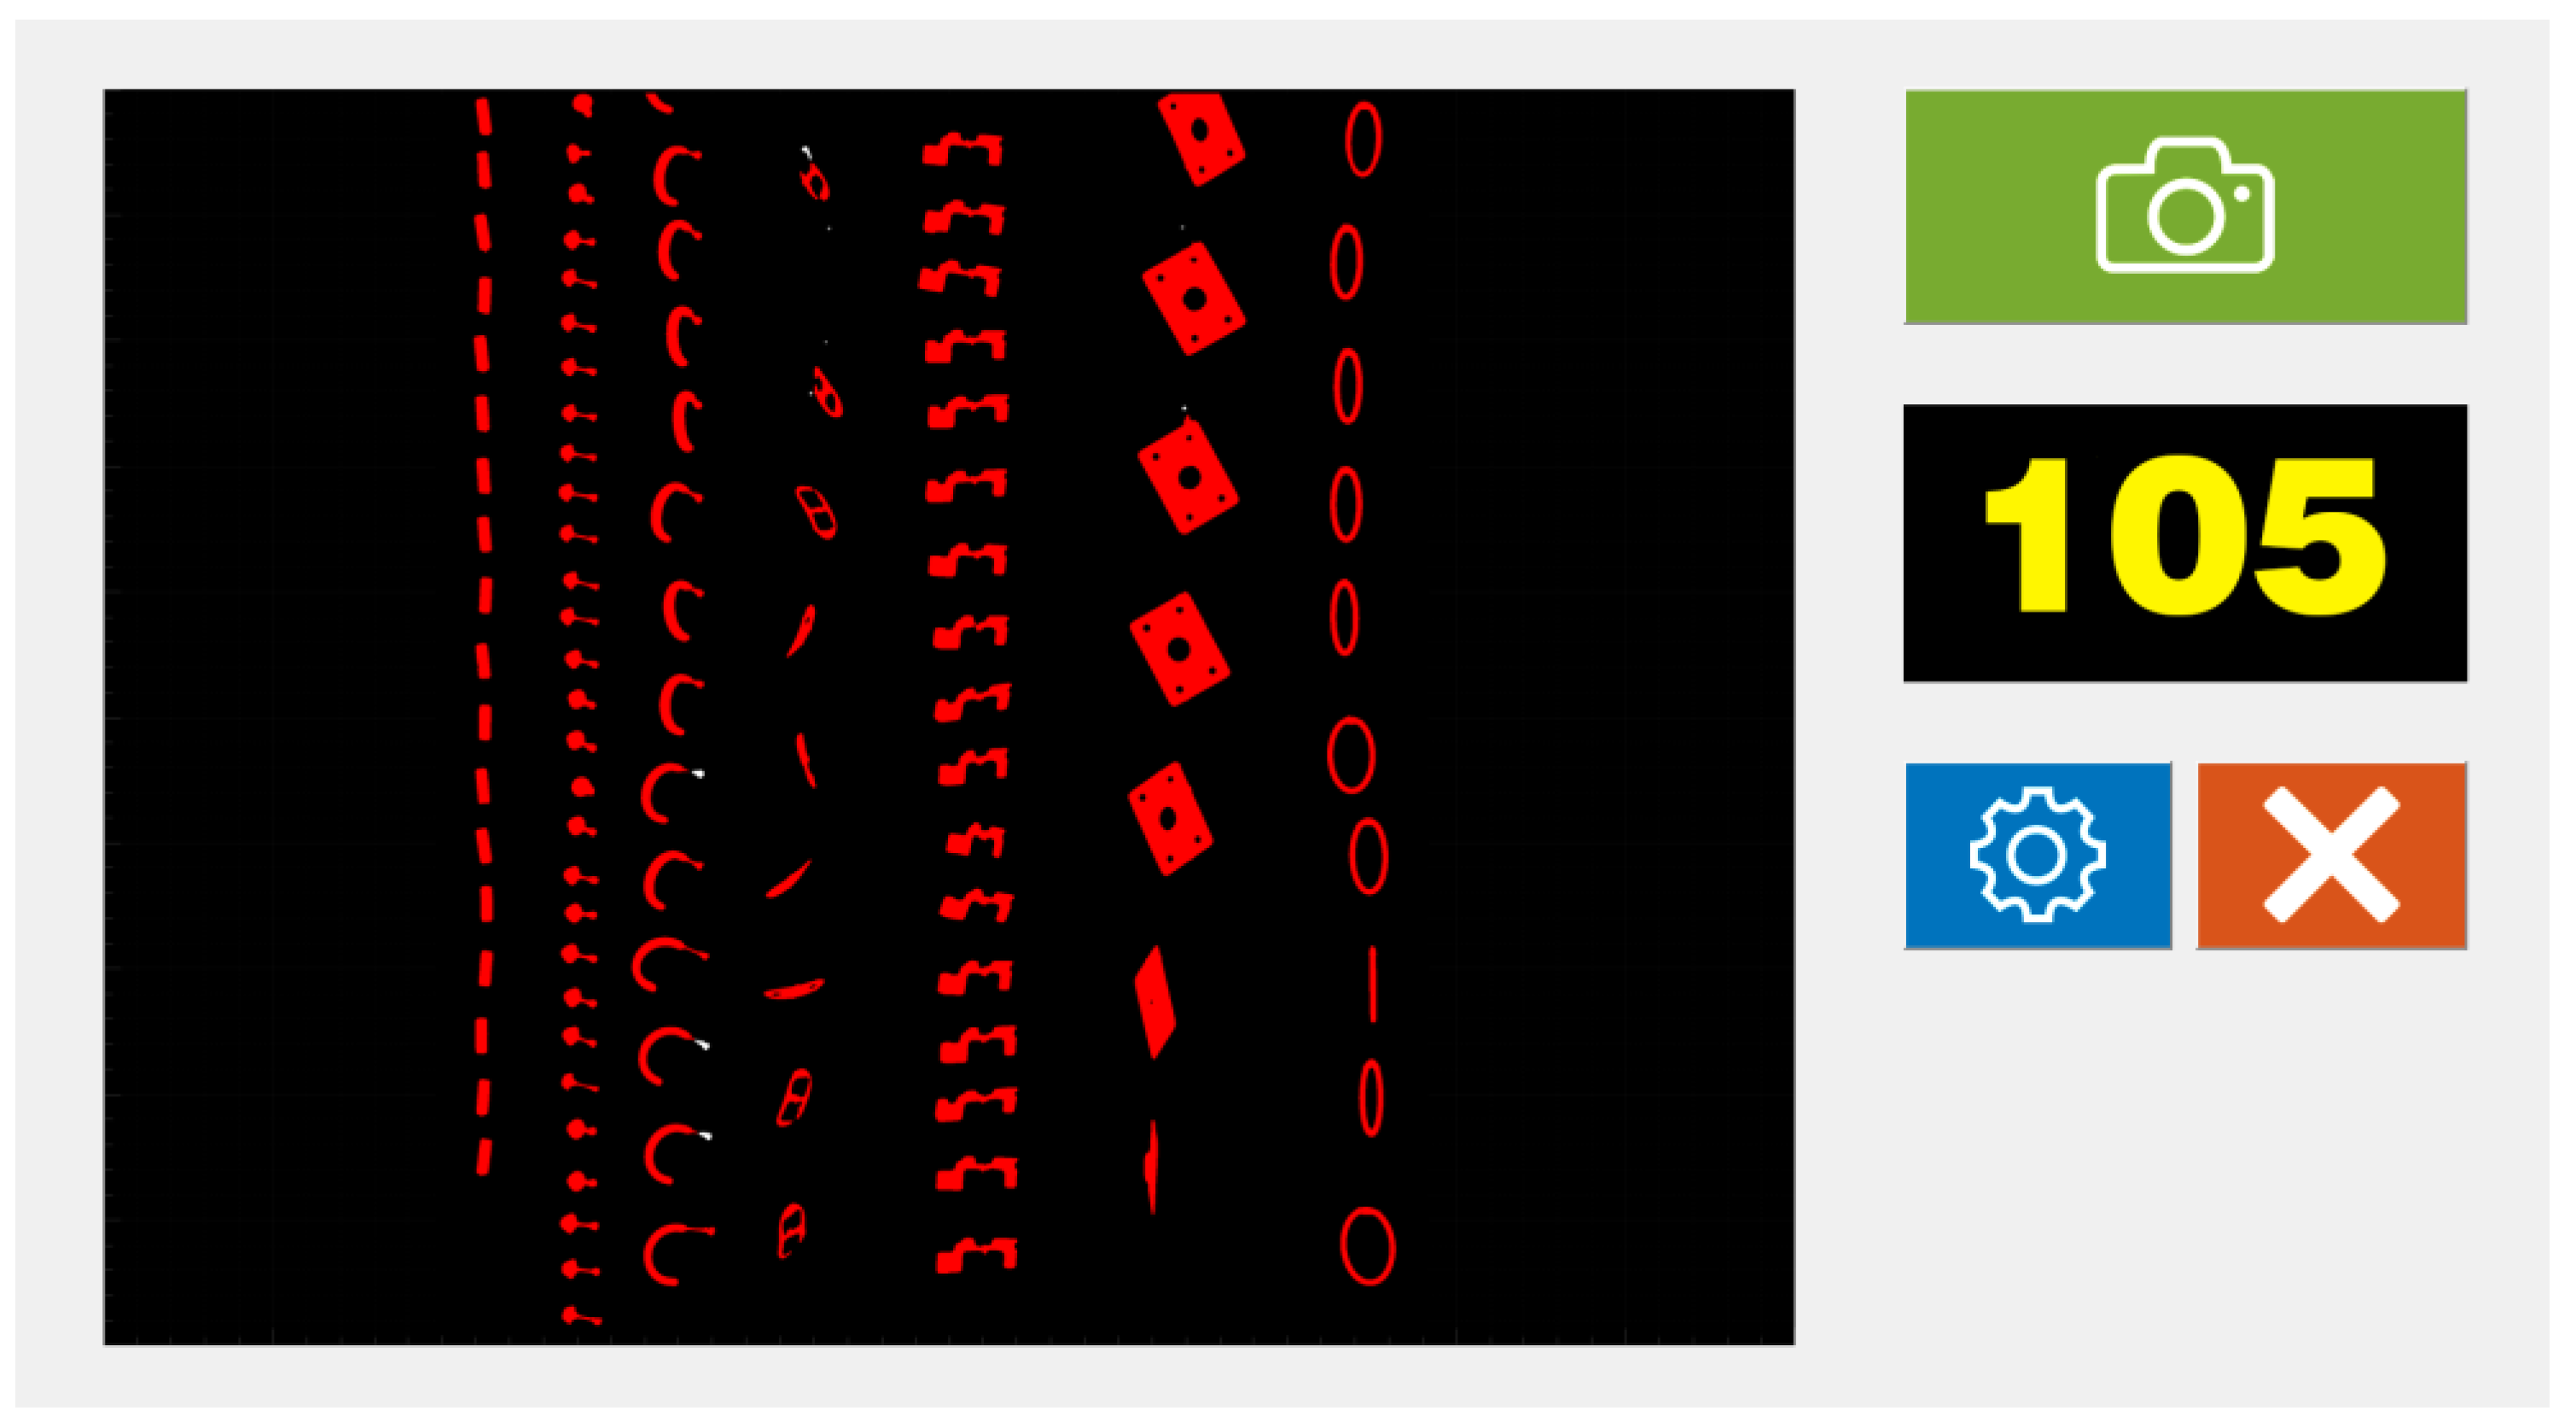
2.3.3. Rear Projection

To overcome all the discussed drawbacks related to direct backlighting, a third solution was developed and tested. In detail, a 0.5 mm thickness white canvas for rear-projection (100% polyvinyl chloride - PVC) was placed at a 20 mm distance from the galvanic frame, containing seven item typologies while the light source (in this case, an overhead projector with a 3300 lumen light source) and camera were arranged as depicted in Figure 11. This architecture allowed acquiring, from the scene, the projected item shadows rather than the items themselves. This enabled discarding of any kind of reflection. The light source came from an LCD overhead projector with 1000 lumens.
Experimental tests showed that, due to the item thickness and shape, the minimum distance between the projector and the frame needed to be set at 1.8 m, in order to avoid shadow blurring. As depicted in Figure 12a, the items cast a very sharp and uniform dark shadow on the canvas. At the same time, the wires appeared thinner than (for instance) the ones shown in Figure 5b.
Starting from the acquired image (see Figure 12a) a binary image was obtained by thresholding, using the Otsu method [18]. Subsequently, the resulting image was filtered using a 3 × 3 morphological image opening. As shown in Figure 12b, this approach led to minimally fragmented pixel clusters. Therefore, by using an area threshold equal to 200 pixels, it was possible to correctly count the item number.
In summary, the rear projection setup proved to be the most suitable among the ones tested in order to correctly isolate items to be counted. In fact, the key point of the procedure resided in the very sharp native image, in which the shadows were extremely defined. Consequently, the required filtering operations were far less aggressive than needed in previous cases.
For this reason, this method has been selected to design the counting machine, as described in the next Session.

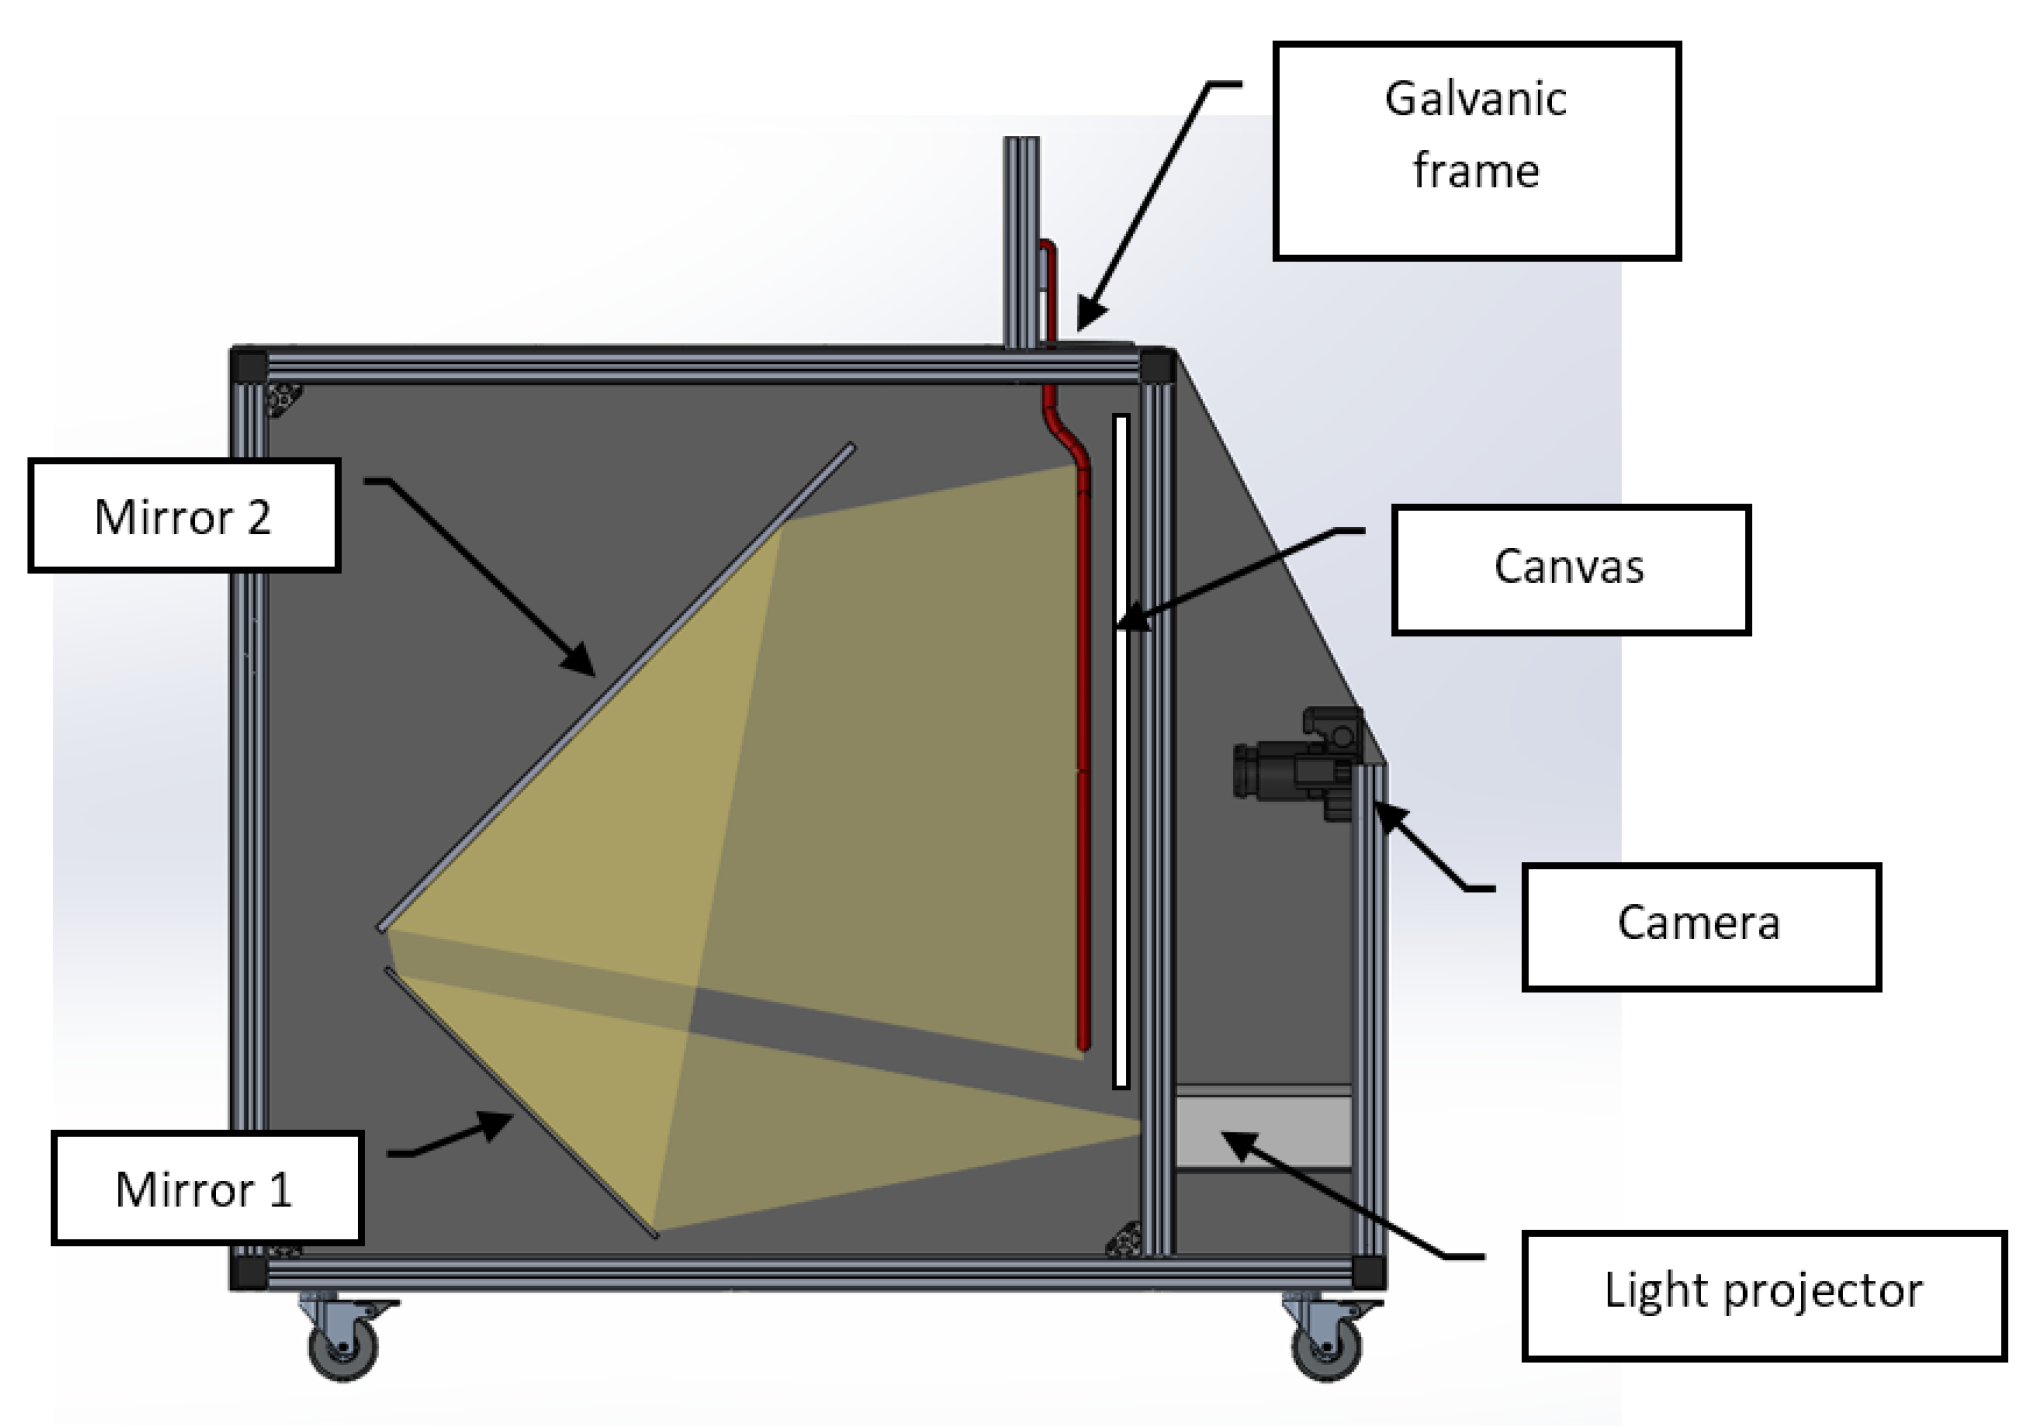
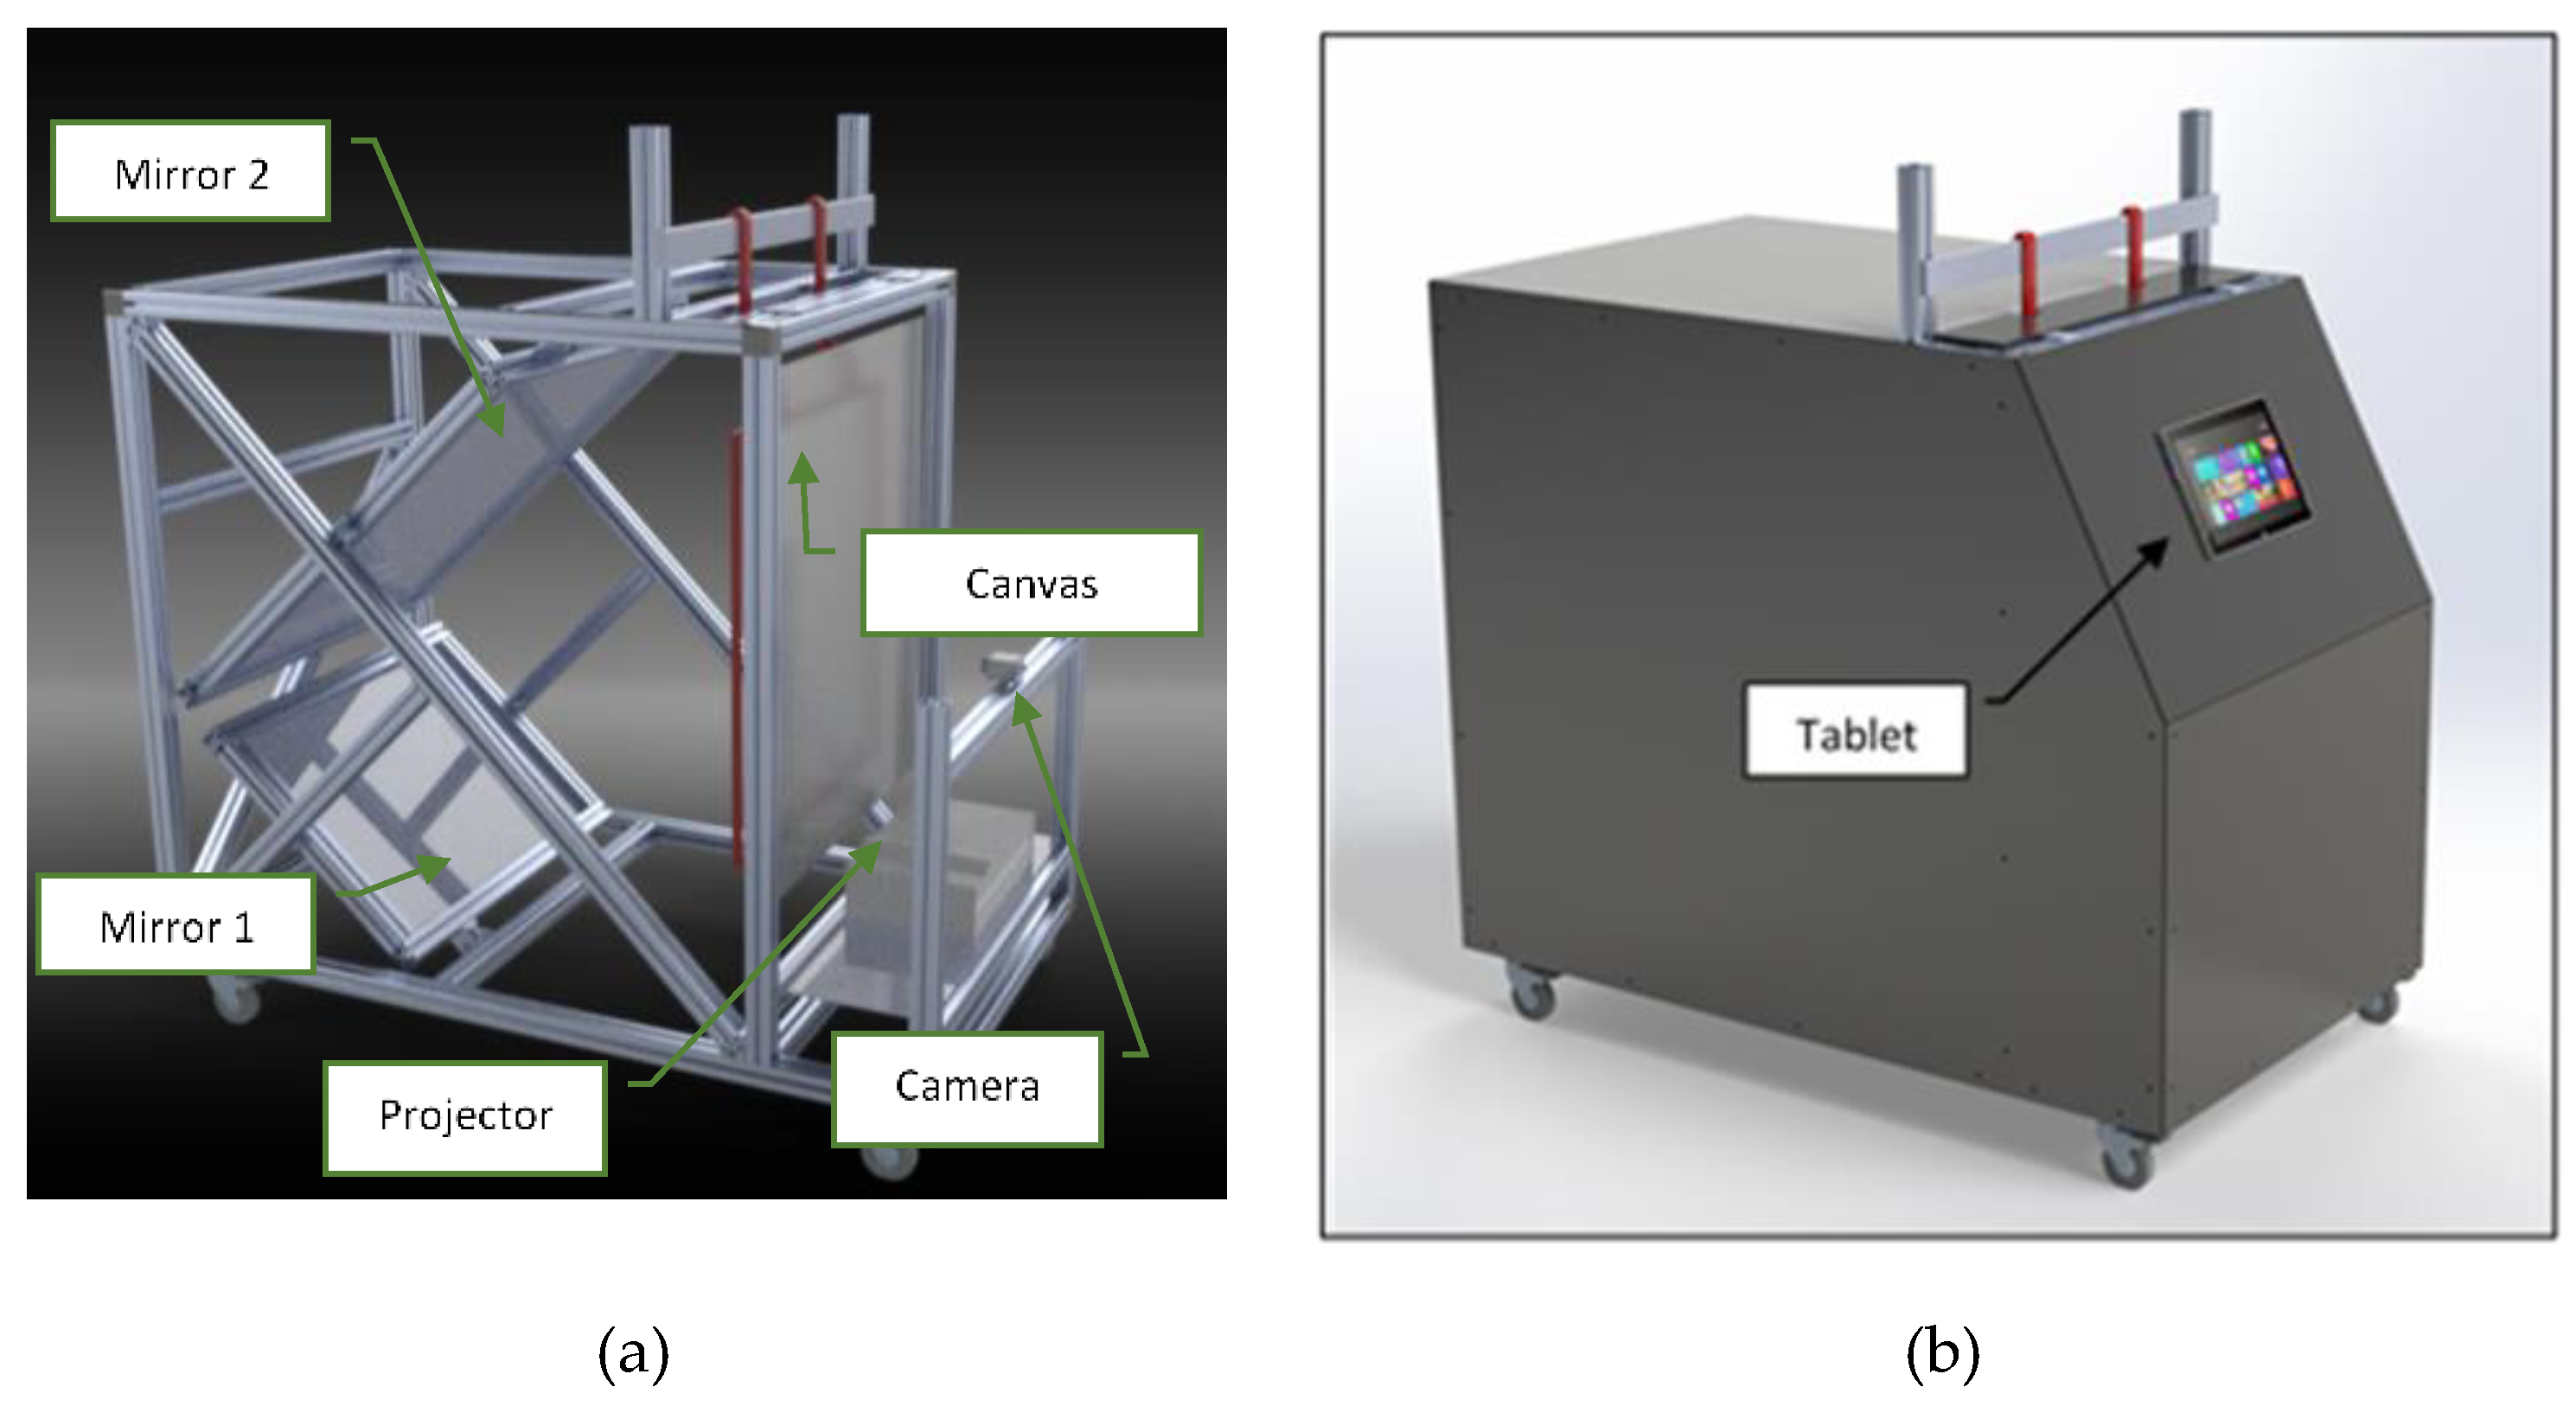
3. Rear Projection-Based Counting Machine Prototype

Though the preliminary tests performed using the seven different item typologies, shown in Figure 12a, were deemed representative, a prototypal rear projection-based counting machine was designed in order to perform extensive testing in an industrial environment. As shown in Figure 13, the system comprises:
-
An image acquisition device (industrial monochrome camera IDS UI 3200-SE-M with a 6 mm lens with 12-megapixel resolution (4104 × 3006 pixels);
-
An LCD overhead light projector, to assure uniform lighting;
-
A couple of orientable mirrors (used to extend the light path up to the 1.8 m, mentioned in Section 3). Such mirrors are used to reduce the overall dimensions of the counting machine, which must not exceed 1.5 × 1.0 × 1.0 m, in order to not to be excessively cumbersome for an industrial environment;
-
An enclosure system, to assure the environmental light does not affect the scene.
The projector is placed backward, on the frontal part of the machine. Light is reflected by the first mirror upwards towards the second one; this last mirror reflects it forward to hit the galvanic frame. Its shadow is projected on the rear-projection canvas, which is arranged parallel to the frame. In the prototypal implementation of the system, the setup described above did not show any unevenness in the screen illumination using a perfectly white projected image. However, in case this should happen, it is possible to compensate by projecting an image appositely designed in order to feature slightly darker or lighter regions in correspondence to more or less illuminated areas of the screen, respectively. This is a major advantage entailed by the use of the overhead LCD projector rather than a conventional light source (i.e., a lamp).
In Figure 14a, a rendering of the designed counting machine architecture shows the arrangement of the above-mentioned components. The final design of the machine is shown in Figure 14b.
A Surface Go tablet (Microsoft Corporation, Washington, U.S.)—on which ran the designed application (developed in Matlab®, MathWorks, Inc., Natick, Massachusetts, U.S., 2019)—was then used to command the industrial camera. By means of a dedicated Graphical User Interface (GUI), the operator could check the position of the frame and can start the acquisition when such a position was considered correct (see Figure 15).
The procedure was then able, in approximately 0.3s, to provide the number of the detected items. Simultaneously, it showed a control picture, on which clusters that had been considered were colored red, while those that were ignored were white. In this way, the operator could rapidly check the effectiveness of the procedure and make corrections if needed.

4. Discussion and Conclusions

In this paper, a method and a machine for counting the number of small metal parts randomly arranged on a galvanic frame was proposed. A priori knowledge of the area of each item that will be treated by the galvanic bath made it possible to estimate, with satisfying accuracy, the overall area to be treated and, consequently, optimize the settings of the treatment itself. Especially in the high fashion field, in which precious materials are often used to realize plates, this enables minimization of material waste, thus leading to a significant cost saving. Considering all the limitations that the application imposes (e.g., pieces already mounted on the frame and high reflectivity), many of the approaches usually adopted for counting machines (e.g., free fall and weight analysis) cannot be followed. The procedure is hence based on machine vision and makes use of rear-projection on a canvas to obtain a sufficiently sharp and easy to elaborate image with simple morphological operators. A counting machine, which implements the devised system was designed.
This prototypal counting machine was pre-tested with 20 different galvanic frames, hosting 20 different kinds of objects, with maximum dimensions spanning from 10 to 80 mm. In Table 1, the results obtained for 5 of the 20 tests are listed.
Referring to the entire set of 20 tests, the frontal light architecture showed proper counting of the number of the items in nine cases (45%), while the lighted background-based architecture was successful in eight cases (40%). For both the systems, over-fragmentation led to an excessive number of items counted. This was particularly true when the number of items increased and the minimum dimensions decreased down to 50 mm. Therefore, their use is not recommended for this kind of application, since an overestimation of the number of attached items may cause a coating thickness lower than the desired one. By using the frontal light-based architecture with the addition of the image morphological closure algorithm, the percentage of correctly counted items increased to 60%. However in two cases out of 12 correctly counted frames, the number of items erroneously counted twice, due to clusters fragmentation, were compensated by the erroneous counting of two adjacent items merged together by the image closure. Quite the reverse, for all the test cases, the number of counted objects was exactly equal to the number of actual objects mounted on the frames (100%). As already mentioned, since the surface of each item is a technical specification for the galvanic companies, by multiplying it by the number of items, it is possible to know the overall surface to be coated.
Despite these encouraging results, the system will undergo an extensive test campaign in an Italian company working in the galvanic coating industry to increase the number of test cases up to 1000 different frames.
Accordingly, future work will extensively test the devised procedure, both in terms of the performance (i.e., the counted number of items vs. the actual number, verified by visually inspecting the frames) and of the usability.

Author Contributions

Conceptualization, L.P, L.G. and R.F; methodology, L.G. and R.F.; software, M.S. and L.P.; validation, Y.V., L.P. and M.S.; data curation, M.S. and Y.V.; writing—original draft preparation, L.P.; writing—review and editing, L.G., R.F and Y.V.; supervision, L.G. and R.F.; project administration, L.G.

Funding

This work has been carried out thanks to the decisive regional contribution from the Regional Implementation Programme co-financed by the FAS (now FSC) and the contribution from the FAR funds made available by the MIUR.
Applsci 09 02418 i001

Conflicts of Interest

The authors declare no conflict of interest.

References

  1. Bard, A.J.; Faulkner, L.R. Electrochemical Methods: Fundamentals and Applications; Wiley: Hoboken, NJ, USA, 1980; p. 718. [Google Scholar]
  2. Barker, D.; Walsh, F.C. Applications of Faraday’s Laws of Electrolysis in Metal Finishing. Trans. IMF 1991, 69, 158–162. [Google Scholar] [CrossRef]
  3. Phromlikhit, C.; Cheevasuvit, F.; Yimman, S. Tablet counting machine base on image processing. In Proceedings of the 5th 2012 Biomedical Engineering International Conference, Ubon Ratchathani, Thailand, 5–7 December 2012. [Google Scholar]
  4. Nudol, C. Automatic jewel counting using template matching. In Proceedings of the IEEE International Symposium on Communications and Information Technology 2004 (ISCIT 2004), Sapporo, Japan, 26–29 October 2004; Volume 2. [Google Scholar]
  5. Sokkarie, A.; Osborne, J. Object counting and sizing. In Proceedings of the SoutheastCon’94, Miami, FL, USA, USA, 10–13 April 1994. [Google Scholar]
  6. Courshee, R.J. Testing a counting machine. Br. J. Appl. Phys. 1954, 5. [Google Scholar] [CrossRef]
  7. Barbedo, J.G.A. A Review on Methods for Automatic Counting of Objects in Digital Images. IEEE Latin Am. Trans. 2012, 10, 5. [Google Scholar]
  8. Chauhan, V.; Joshi, K.D.; Surgenor, B. Machine Vision for Coin Recognition with ANNs: Effect of Training and Testing Parameters. In Proceedings of the Engineering and Applications of Neural Networks: 18th International Conference, Athens Greece, 25–27 August 2017. [Google Scholar]
  9. Bremananth, R.; Balaji, B.; Sankari, M.; Chitra, A. A New Approach to Coin Recognition using Neural Pattern Analysis. In Proceedings of the 2005 Annual IEEE India Conference-Indicon, Chennai, India, 11–13 December 2005. [Google Scholar]
  10. Furferi, R.; Governi, L. Prediction of the spectrophotometric response of a carded fiber composed by different kinds of coloured raw materials: An artificial neural network-based approach. Color Res. Appl. 2011, 36, 179–191. [Google Scholar] [CrossRef]
  11. Sharma, T.; Rajurkar, S.D.; Molangur, N.; Verma, N.K.; Salour, A. Multi-faced Object Recognition in an Image for Inventory Counting. Adv. Intell. Syst. Comput. 2019, 799, 333–346. [Google Scholar]
  12. Redmon, J.; Divvala, S.; Girshick, R.; Farhadi, A. You Only Look Once: Unified, Real-Time Object Detection. In Proceedings of the 2016 IEEE Conference on Computer Vision and Pattern Recognition (CVPR), Las Vegas, NV, USA, 27–30 June 2016. [Google Scholar]
  13. Peduzzi, P.; Concato, J.; Kemper, E.; Holford, T.R.; Feinstein, A.R. A simulation study of the number of events per variable in logistic regression analysis. J. Clin. Epidemiol. 1996, 49, 1373–1379. [Google Scholar] [CrossRef]
  14. van den Boomgaard, R.; van Balen, R. Methods for fast morphological image transforms using bitmapped binary images. CVGIP: Graph. Models Image Process. 1992, 54, 252–258. [Google Scholar] [CrossRef]
  15. Gonzalez, R.C.; Richard, R.E.; Woods, E.; Eddins, S.L. Digital Image Processing Using MATLAB; Dorsing Kindersley: London, UK, 2004; p. 620. [Google Scholar]
  16. Haralick, R.M.; Shapiro, L.G. Computer and Robot Vision; Addison-Wesley Pub Co.: Boston, MA, USA, 1992. [Google Scholar]
  17. Wang, J.; Wu, X.; Zhang, C. Support vector machines based on K-means clustering for real-time business intelligence systems. Int. J. Bus. Intell. Data Min. 2005, 1, 54–64. [Google Scholar] [CrossRef] [Green Version]
  18. Furferi, R.; Governi, L.; Volpe, Y. Modelling and simulation of an innovative fabric coating process using artificial neural networks. Text. Res. J. 2012, 82, 1282–1294. [Google Scholar] [CrossRef]
Figure 1. Typical galvanic frame.
Applsci 09 02418 g001
Figure 2. Galvanic frame with items placed in a fixed position.
Applsci 09 02418 g002
Figure 3. Prediction result obtained with an off-the-shelf pre-trained YOLO (you only look once) net.
Applsci 09 02418 g003
Figure 4. Frontal light with black uniform background setup.
Applsci 09 02418 g004
Figure 5. (a) Acquired image using the first setup: (b) Image after thresholding and (c) image after morphological opening.
Applsci 09 02418 g005
Figure 6. (a) Item A, fragmented after thresholding; (b) item A, after morphological opening; (c) item B, thinned after thresholding; (d) item B, fragmented after morphological opening.
Applsci 09 02418 g006
Figure 7. (a) Item B after morphological image closing plus image erosion; (b) an example of wires loop after morphological closing followed by image erosion; (c) clusters merged after dilation. The image is intentionally left in grayscale to show actual original items.
Applsci 09 02418 g007
Figure 8. (a) Discrimination among valid and ignored clusters; (b) misclassification of small clusters: Red-colored clusters are discarded since their area is lower than the selected threshold (i.e., 200 pixels); green-colored clusters are counted, thus leading to counting error since both belongs to a single item.
Applsci 09 02418 g008
Figure 9. Lighted background setup.
Applsci 09 02418 g009
Figure 10. (a) Original image acquired with backlighting; (b) image of Figure 10a after thresholding showing that some items portions are mistakenly assigned to the background.
Applsci 09 02418 g010
Figure 11. Rear projection setup.
Applsci 09 02418 g011
Figure 12. (a) Original image acquired with the rear projection setup; (b) binary image after morphological opening process.
Applsci 09 02418 g012
Figure 13. Counting system main components.
Applsci 09 02418 g013
Figure 14. (a) Counting machine architecture; (b) final design of the counting machine.
Applsci 09 02418 g014
Figure 15. Dedicated GUI implemented for controlling the counting machine performance. On the left, it is possible to read the number of items. Moreover, it is possible to save the screened image (green camera icon) and to close the application (red X in figure). The user can also access a setting panel (blue gear icon) in case they want to set a different threshold value for the algorithm.
Applsci 09 02418 g015
Table 1. The results obtained with the three developed systems for counting the items attached to a galvanic frame.
Test #Actual # of ItemsMinimum Item Dimension (mm)Frontal Light* (# of items)Lighted Background (# of items)Rear Projection (# of items)
160100626160
212040124124120
340200404040
410030104105100
520300202020
* Without image closure

