Optimal Intrinsic Mode Function Based Detection of Motor Bearing Damages

1
Department of Electrical Engineering, Chung Yuan Christian University, Taoyuan 320, Taiwan
2
Department of Electrical Engineering, St. John’s University, Xinbei 251, Taiwan
*
Author to whom correspondence should be addressed.
Appl. Sci. 2019, 9(13), 2587; https://doi.org/10.3390/app9132587
Submission received: 20 May 2019
/
Revised: 17 June 2019
/
Accepted: 19 June 2019
/
Published: 26 June 2019
(This article belongs to the Special Issue Intelligent System Innovation)
Abstract
:This paper proposes a model which uses the greedy algorithm to select the optimal intrinsic mode functions (IMFs) of the empirical mode decomposition (EMD), namely the greedy empirical mode decomposition (GEMD) model. The optimal IMFs can more sufficiently represent the characteristics of damage bearings since the proposed GEMD model effectively selects some IMFs not affected by noise. To validate the superiority of the proposed GEMD model, various damage types of motor bearings were shaped by electrical discharge machining (EDM) in this experiment. The measured motor current signals of various types were decomposed to IMFs by using EMD. Then the optimal IMFs can be obtained by using the proposed GEMD model. The results show that the Hilbert–Huang transform (HHT) spectrums when using the optimal IMFs become easier in the detection system than when using all IMFs. Simultaneously, the detection accuracy of motor bearing damages is increased by using the features extracted from the lower complexity HHT spectrum. The average detection accuracy can be also improved from 69.5% to 74.6% by using the features extracted from the GEMD-HHT spectrum even in a noise interference 10dB
1. Introduction
Motors are widely applied as reliable pieces of equipment in many industries. However, unwarned motor failure could happen due to several factors: improper operation, manufacturing defects and/or mechanical wear [1,2]. According to literature [3,4], the most possible motor failure event is bearing damages. Understanding the signals of bearing damages could prevent unwarned motor failure events [5,6,7].
Classical signal analysis such as fast Fourier transforms (FFT) [8] and wavelet transform (WT) [9,10,11] have been widely applied in realizing the problem of abnormal bearings. However, the disadvantages include that FFT is constrained by limited basis, and WT encounters difficulty in mother wavelet selection. These existing disadvantages of the two methods sometimes result in the distortion of signal analysis results.
Recently, Hilbert–Huang transform (HHT) [12,13,14], composed of empirical mode decomposition (EMD) [15,16], and Hilbert transform (HT) [17,18] have been widely applied to analyze nonlinear and non-stationary signals. EMD decomposes measured signals to several layers of intrinsic mode functions (IMFs), but EMD also decomposes noise signals into IMFs. Therefore, it is important to select some IMFs not affected by noise to avoid the noise interference.
Particle swarm optimization (PSO), ant colony optimization (ACO), and bee colony optimization (BCO) are discussed in search optimal solution [19,20,21]. However, dimensional search-spaces of these algorithms are high for complicated problems. Using these optimization models for problems, the convergence parameters need to be determined by specific empiricism, which need extra computational time to obtain the optimal solution. The superiority of the greedy algorithm (GA) [22,23] to select optimal IMFs is simple and easy-to-implement to complicated or/and multi-step problems. Therefore, the paper proposes a model which applies the GA to select the optimal IMFs of EMD, namely greedy empirical mode decomposition (GEMD), to simplify the bearing damage detection system.
Compared to other artificial neural networks (ANNs), such as feed-forward network [24,25] or probabilistic neural network (PNN) [26,27], back propagation neural network (BPNN) [28,29] is a supervised neural network in which signals will be trained in advance to obtain the network weight parameters. The detection accuracy of BPNN is superior to that of other ANN models. Therefore, the BPNN is adopted in the detection system based on the proposed GEMD model, and the detection accuracy in noise interference environments will validate that the GEMD model is more suitable for the application to detect bearing damages.
This paper first introduces the HHT and the proposed GEMD models, and then motors’ current signals of different types of bearing damages were measured and analyzed. The modular structure serves to detect the bearing damages as subjected to damaged bearings such as in Figure 1. EMD decomposes the measured current signals to a number of layers of IMFs, and then the optimal IMFs by using the proposed GEMD can be obtained. The HHT spectrum of the optimal IMFs transformed by HT can be used to observe the damage characteristics for the alarm system. Compared with the classical HHT method, the proposed GEMD model renders the current signal analysis as a refined HHT spectrum. Alternatively, the features of various damage types can be extracted from the HHT spectrums, and the superior recognition accuracy by using the BPNN model can be validated.
2. Hilbert–Huang Transform
HHT mainly includes two models, EMD and HT models, whose brief review are as follows:
2.1. Empirical Mode Decomposition (EMD)
IMFs must satisfy the following definitions
- (1)
- In a whole data set, the number of zero-crossing must either equal or differ at most by one.
- (2)
- At any point, the mean value of the envelope defined by local maxima and minima is zero.
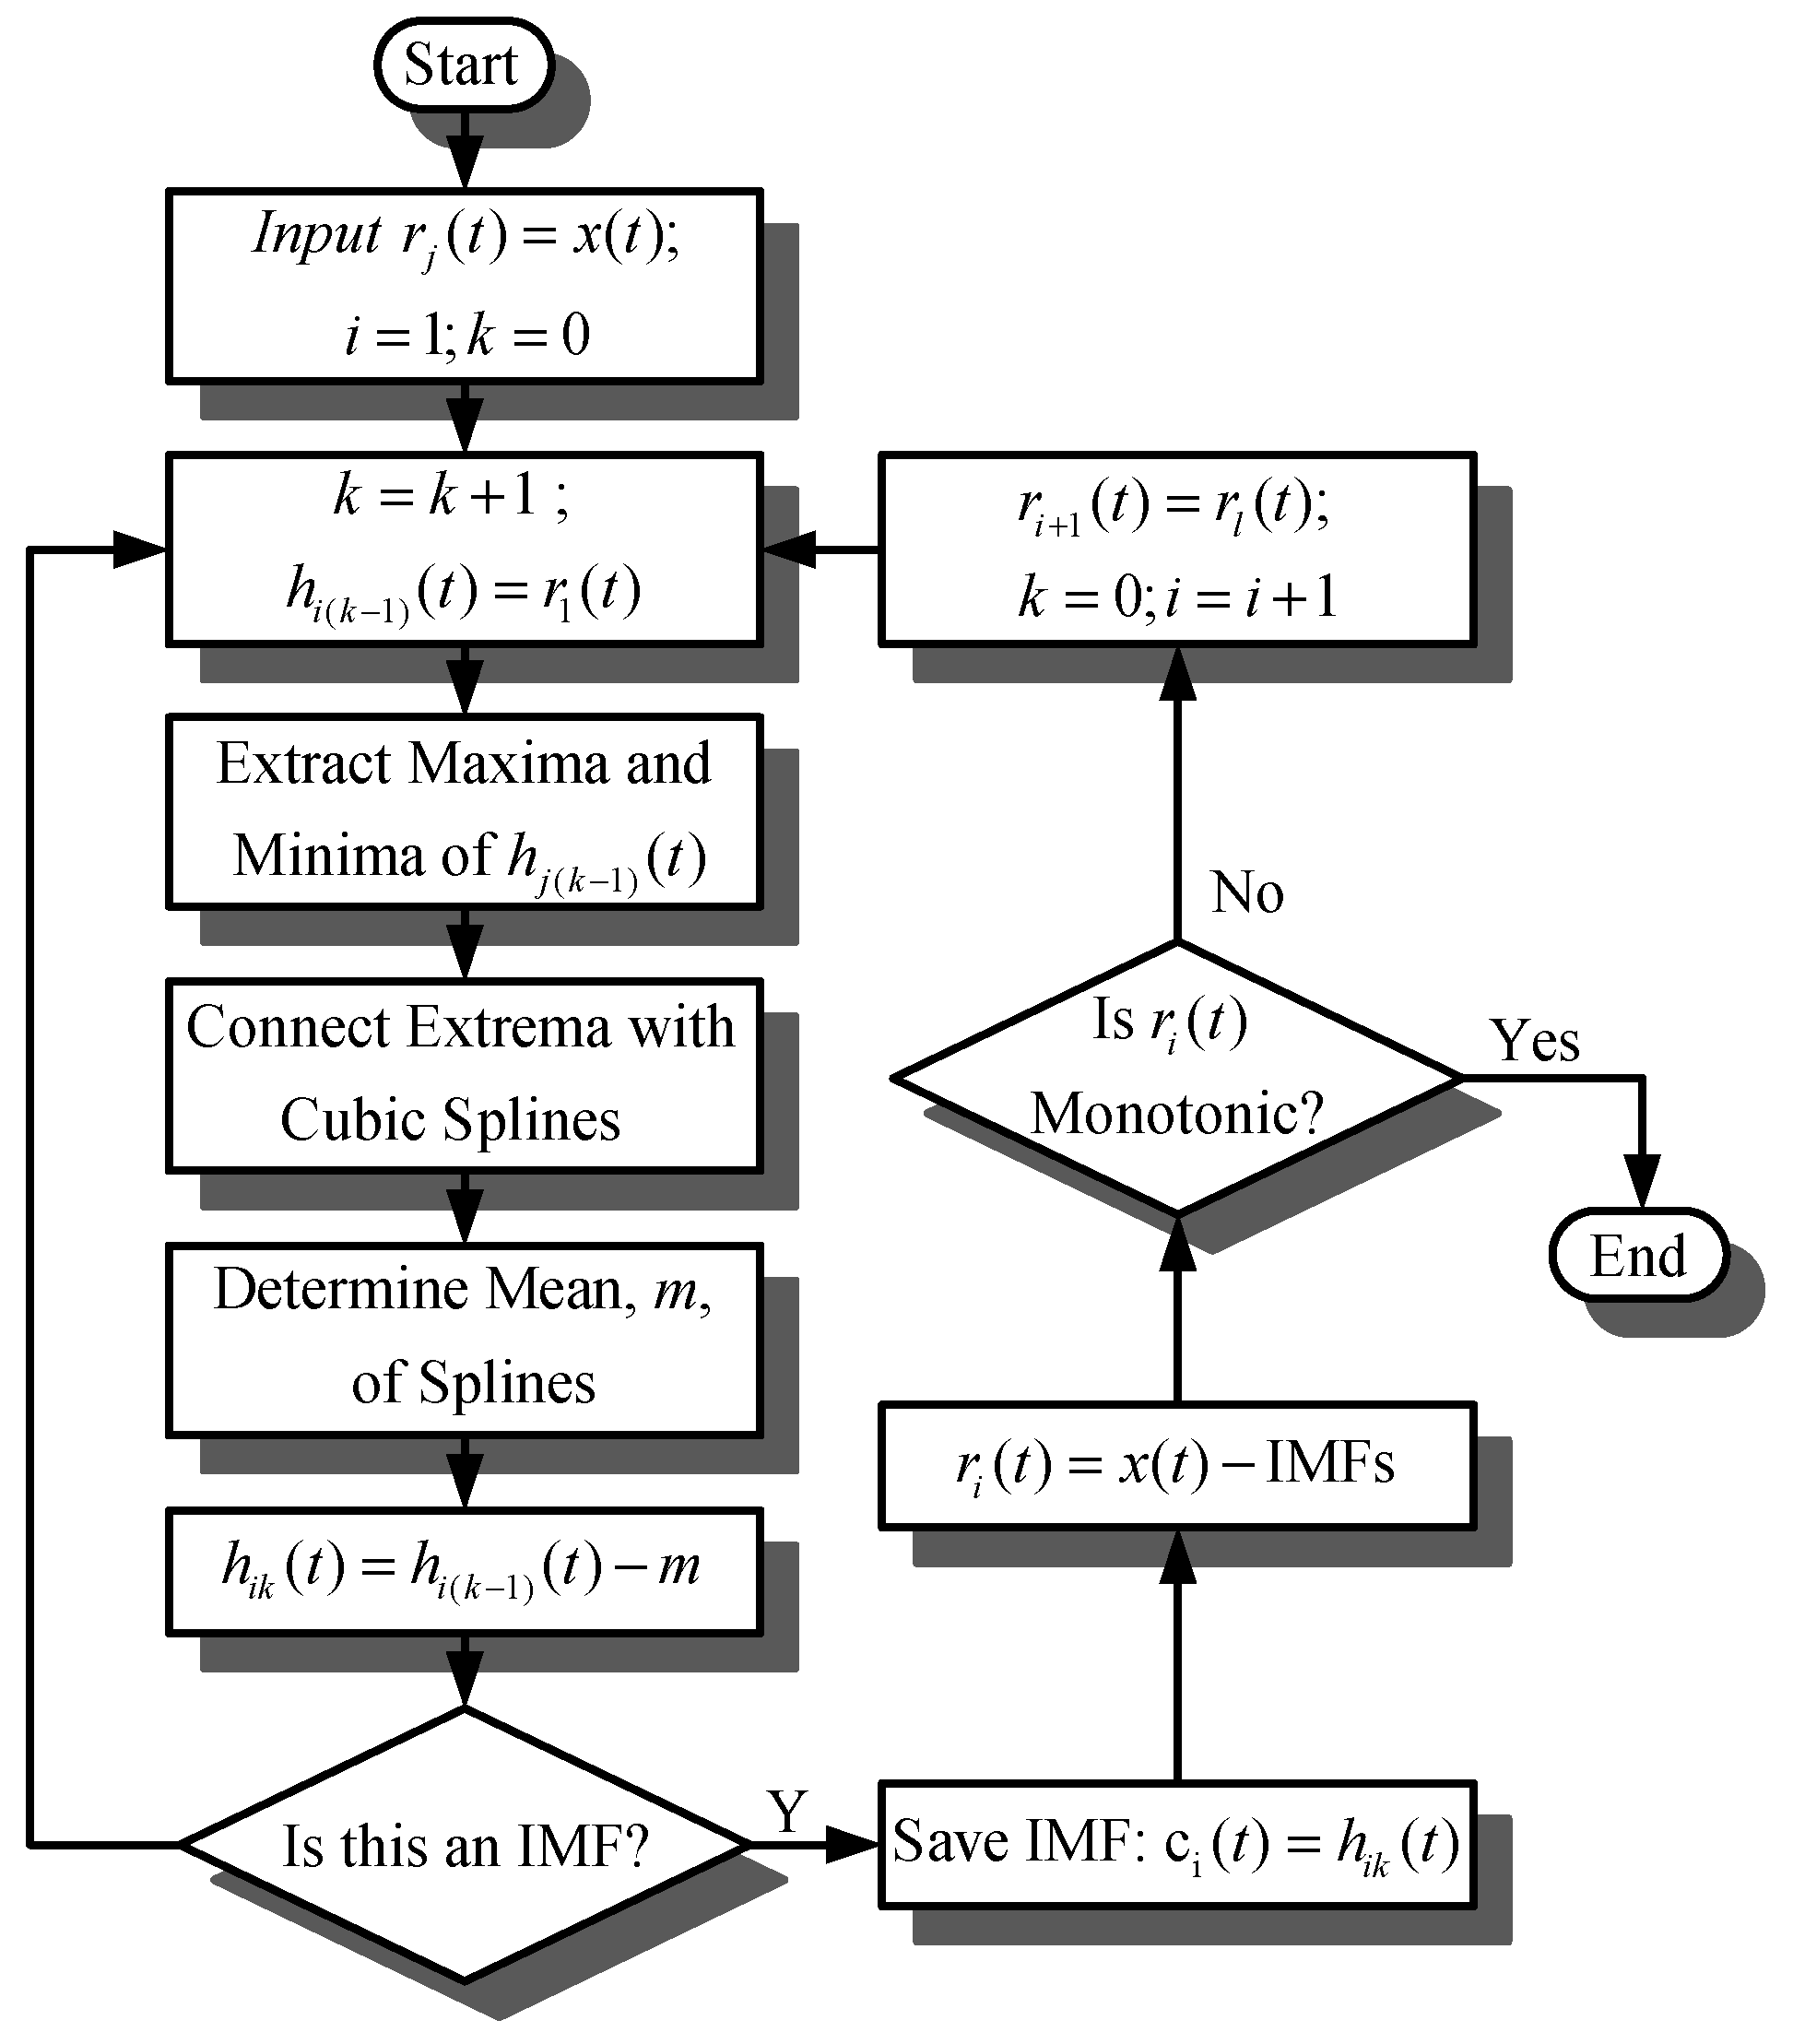
EMD decomposes the input signal to many IMFs, which help to eliminate noise and simplify the whole detection of bearing damage. The method profits by removing noise to make the bearing damage detection easier. The decompose process of IMFs is as follows, and the flowchart of EMD is shown in Figure 2 [30].
- Step 1.
- Identify all the local maxima and minima of .
- Step 2.
- Obtain mean envelope by connecting upper and lower envelopes.
- Step 3.
- subtracts to obtain a new signal .
- Step 4.
- Determine whether the IMF, such as the establishment of its deposit in the IMFs , otherwise repeat Step 1 to Step 4.
- Step 5.
- Calculate the tendency by .
- Step 6.
- Complete decomposition if the tendency is a monotonic function or constant. Otherwise, repeat Step 1 to Step 6.
The decomposition will be complete if the tendency is a monotonic function or constant. Thus, the signal consists of the IMFs and tendency, as shown in Equation (1).
2.2. Hilbert Transform (HT)
Hilbert transform 31 mends the previous problems on nonlinear and non-stationary signal analysis. The conventional HT of a continuous signal is computed, as shown in Equation (2).
Coupling the complex conjugate pair and , we can get the analytic signal , as shown in Equation (3).
where and are the instantaneous amplitude and instantaneous phase respectively, as shown in Equations (4) and (5).
The instantaneous frequency is defined as the time derivative of the instantaneous phase, as shown in Equation (6).
3. Greedy Algorithm Based on Empirical Mode Decomposition Selector
This study proposes the GEMD model to select the optimal IMFs and to make HHT spectrum easier in the detection system.
3.1. Energy Distribution Model
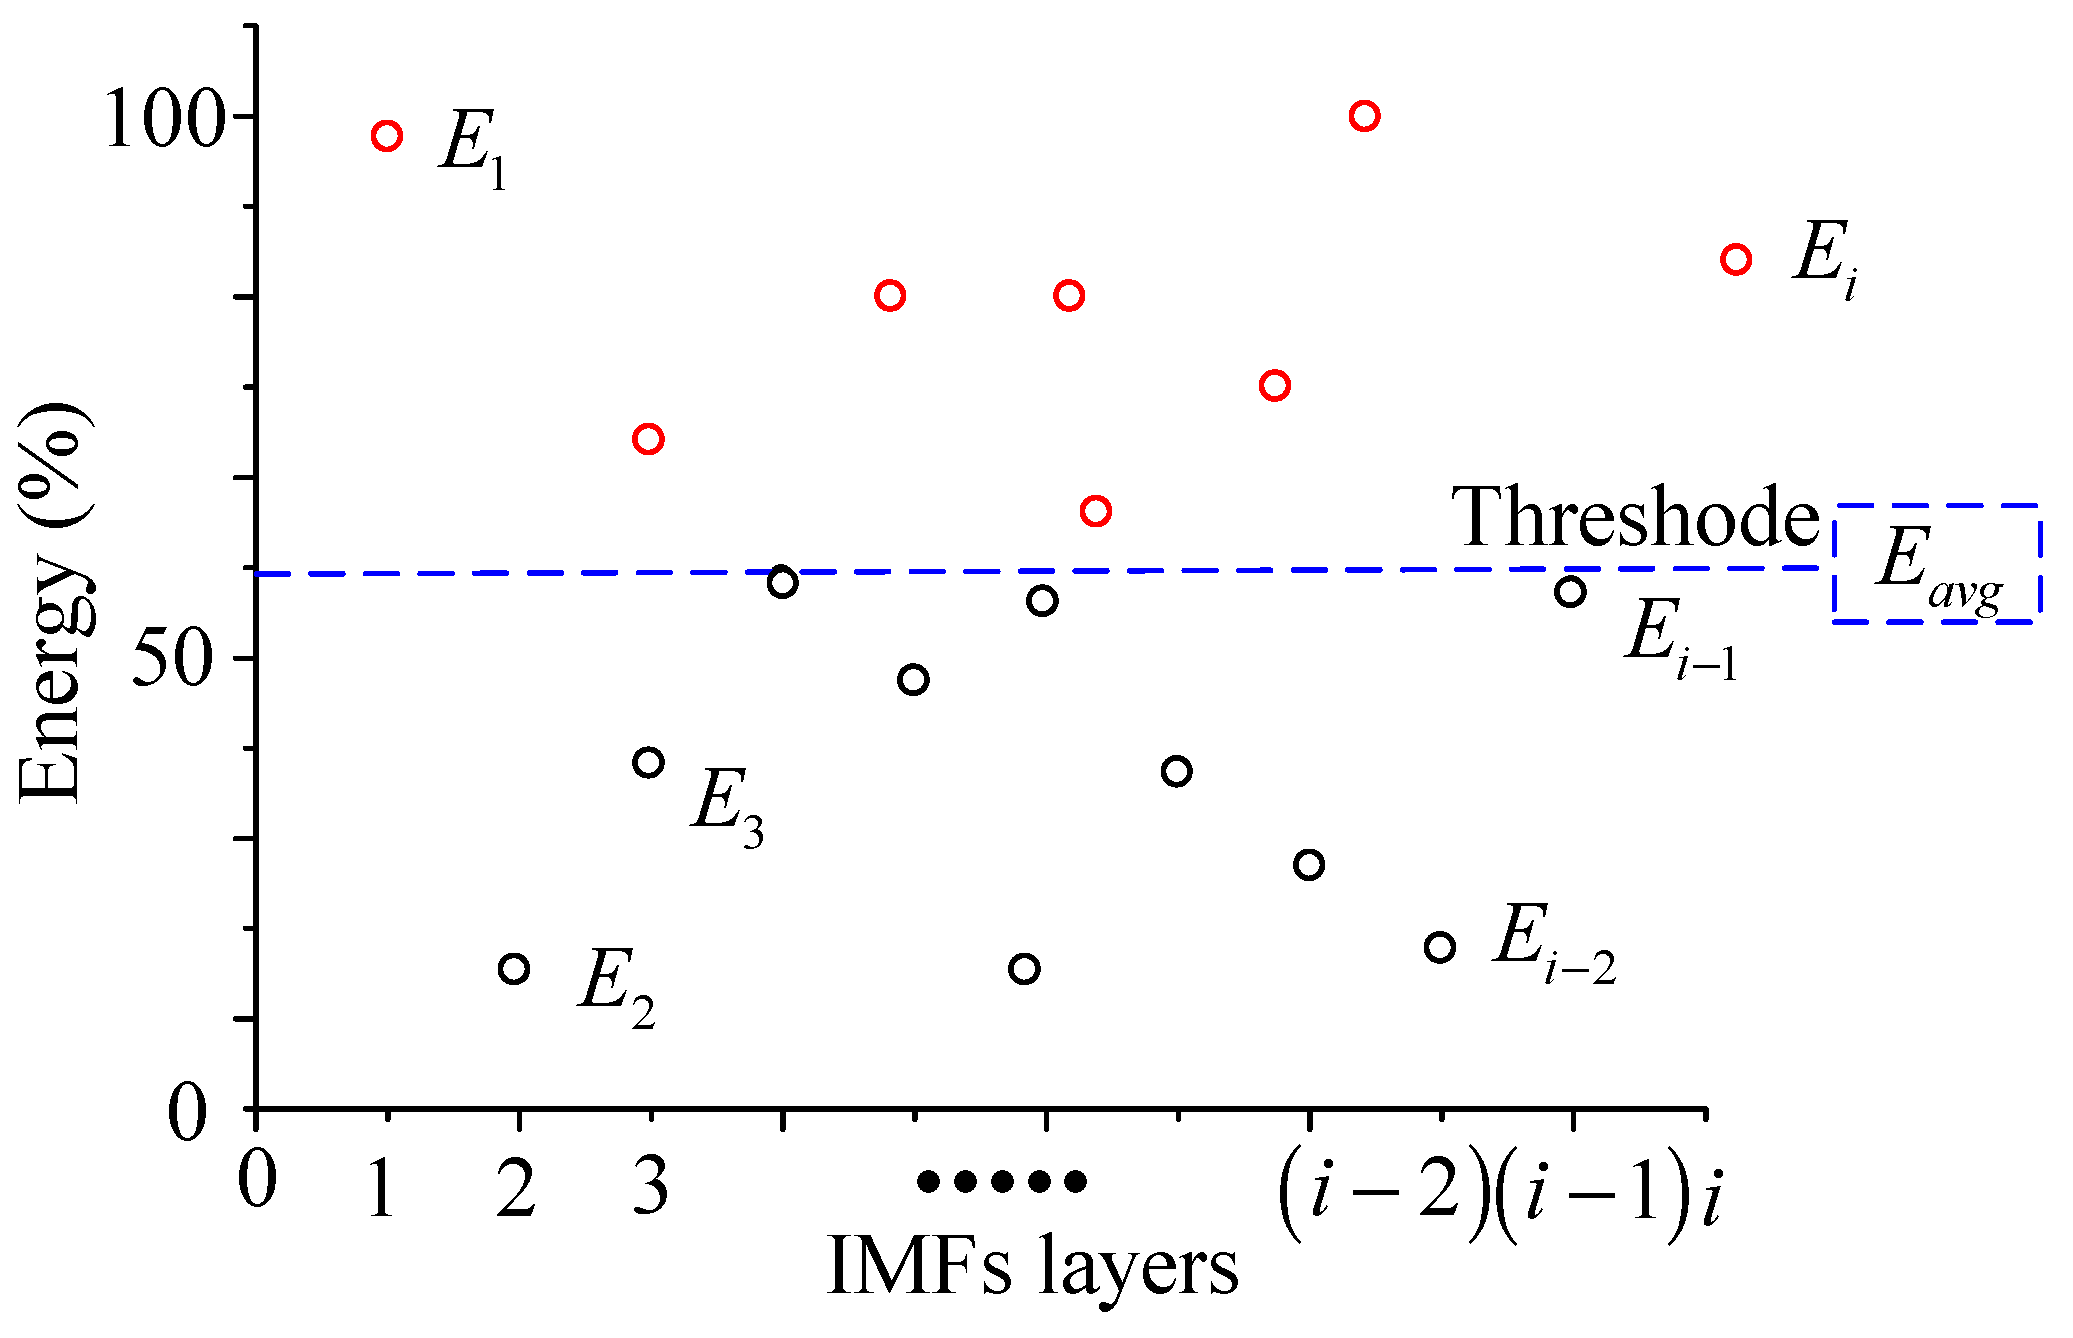
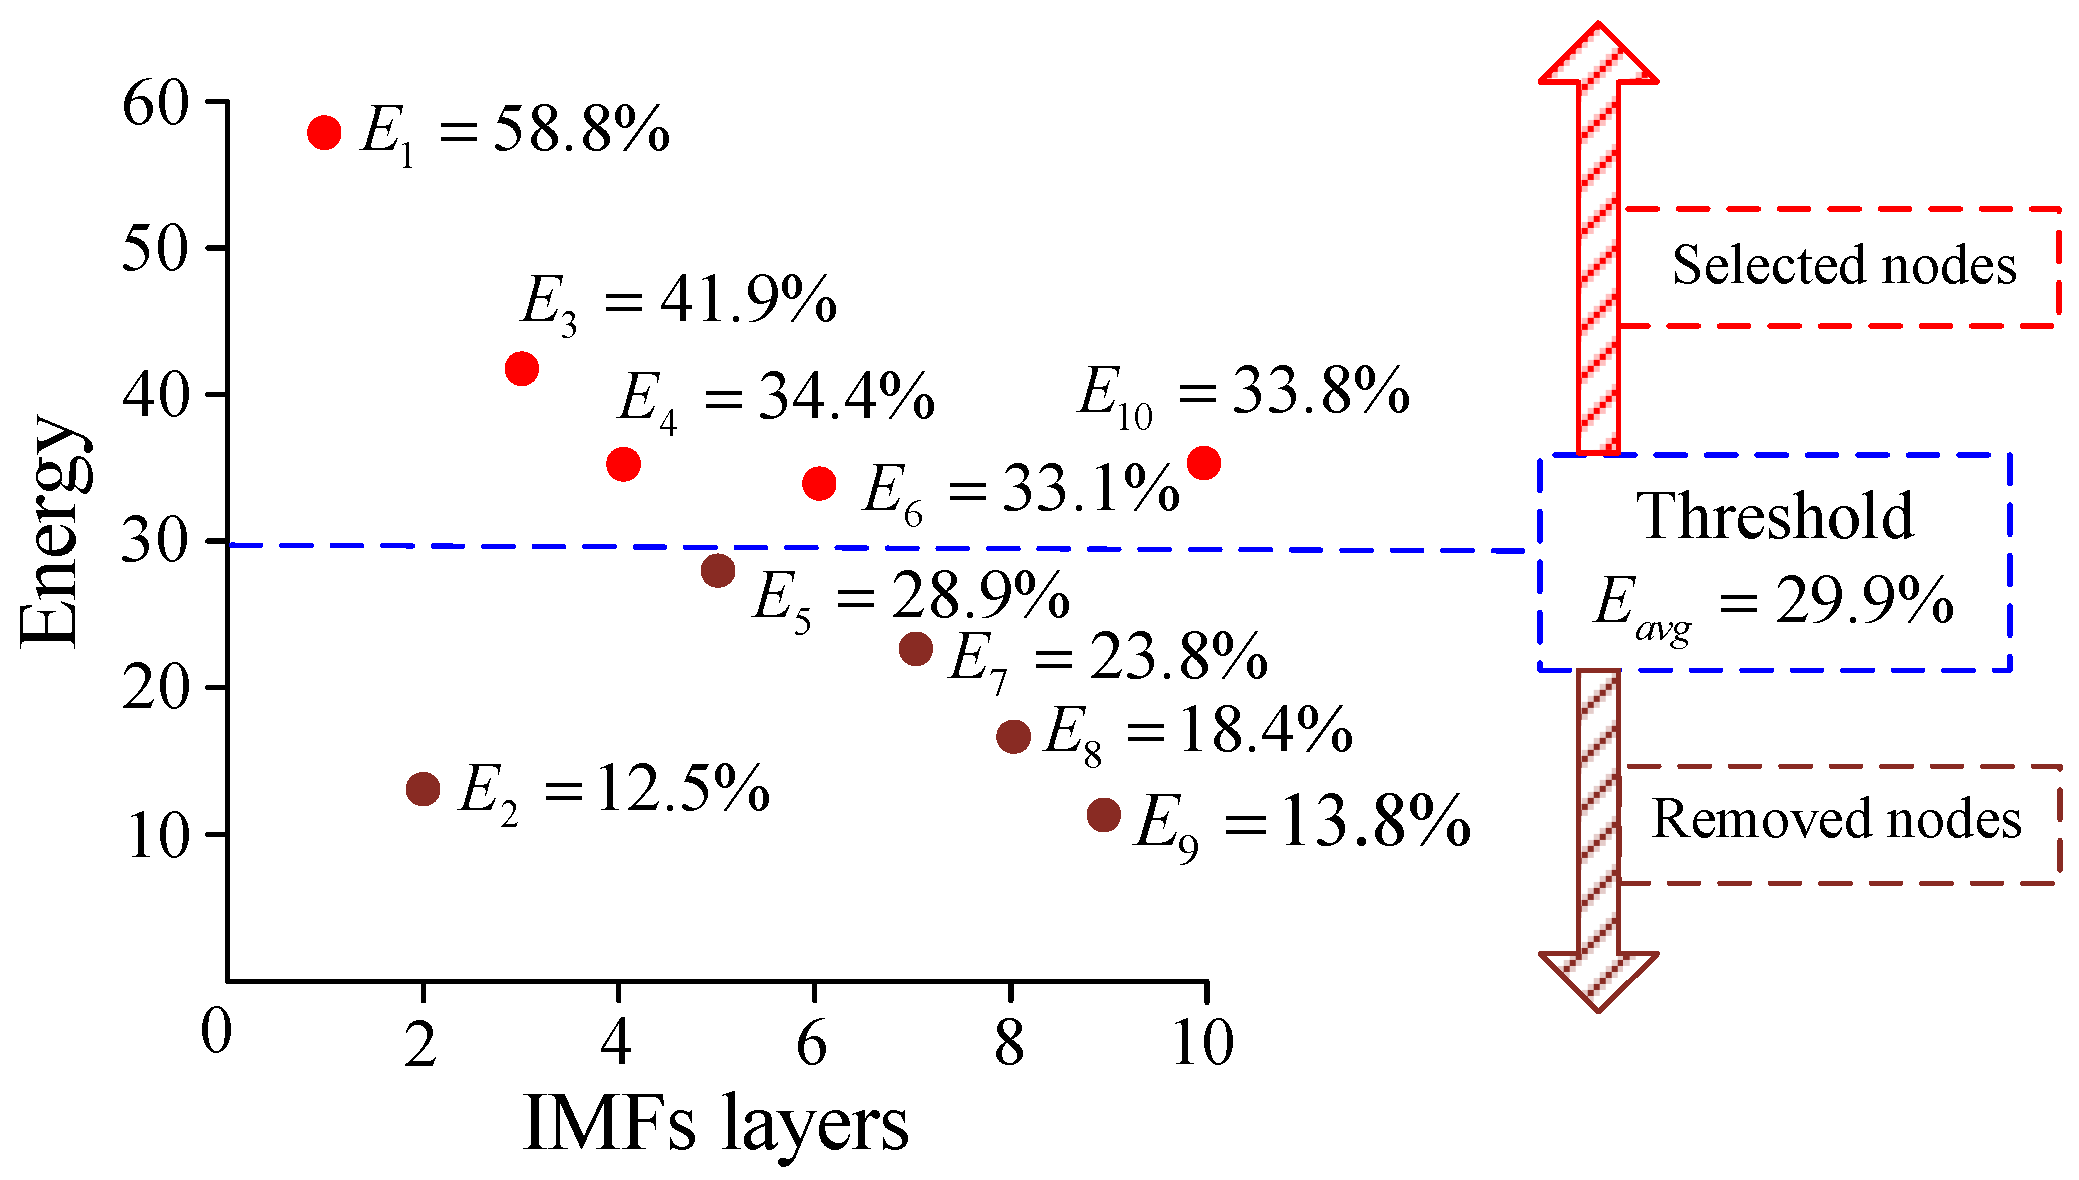
The energy of the i-th layer of IMFs comes from a recognition accuracy estimated by the BPNN, as shown in Figure 3. Average energy is calculated when it has each IMF energy of recognition, as shown in Equation (7), where is the number of IMF layers. Average energy is applied as the threshold to calculate the energy difference , as shown in Equation (8). When the of IMF is lower than of IMFs, which means is negative, those have to be removed to avoid fuzzy the HHT spectrum.
3.2. Shortest Path Cost
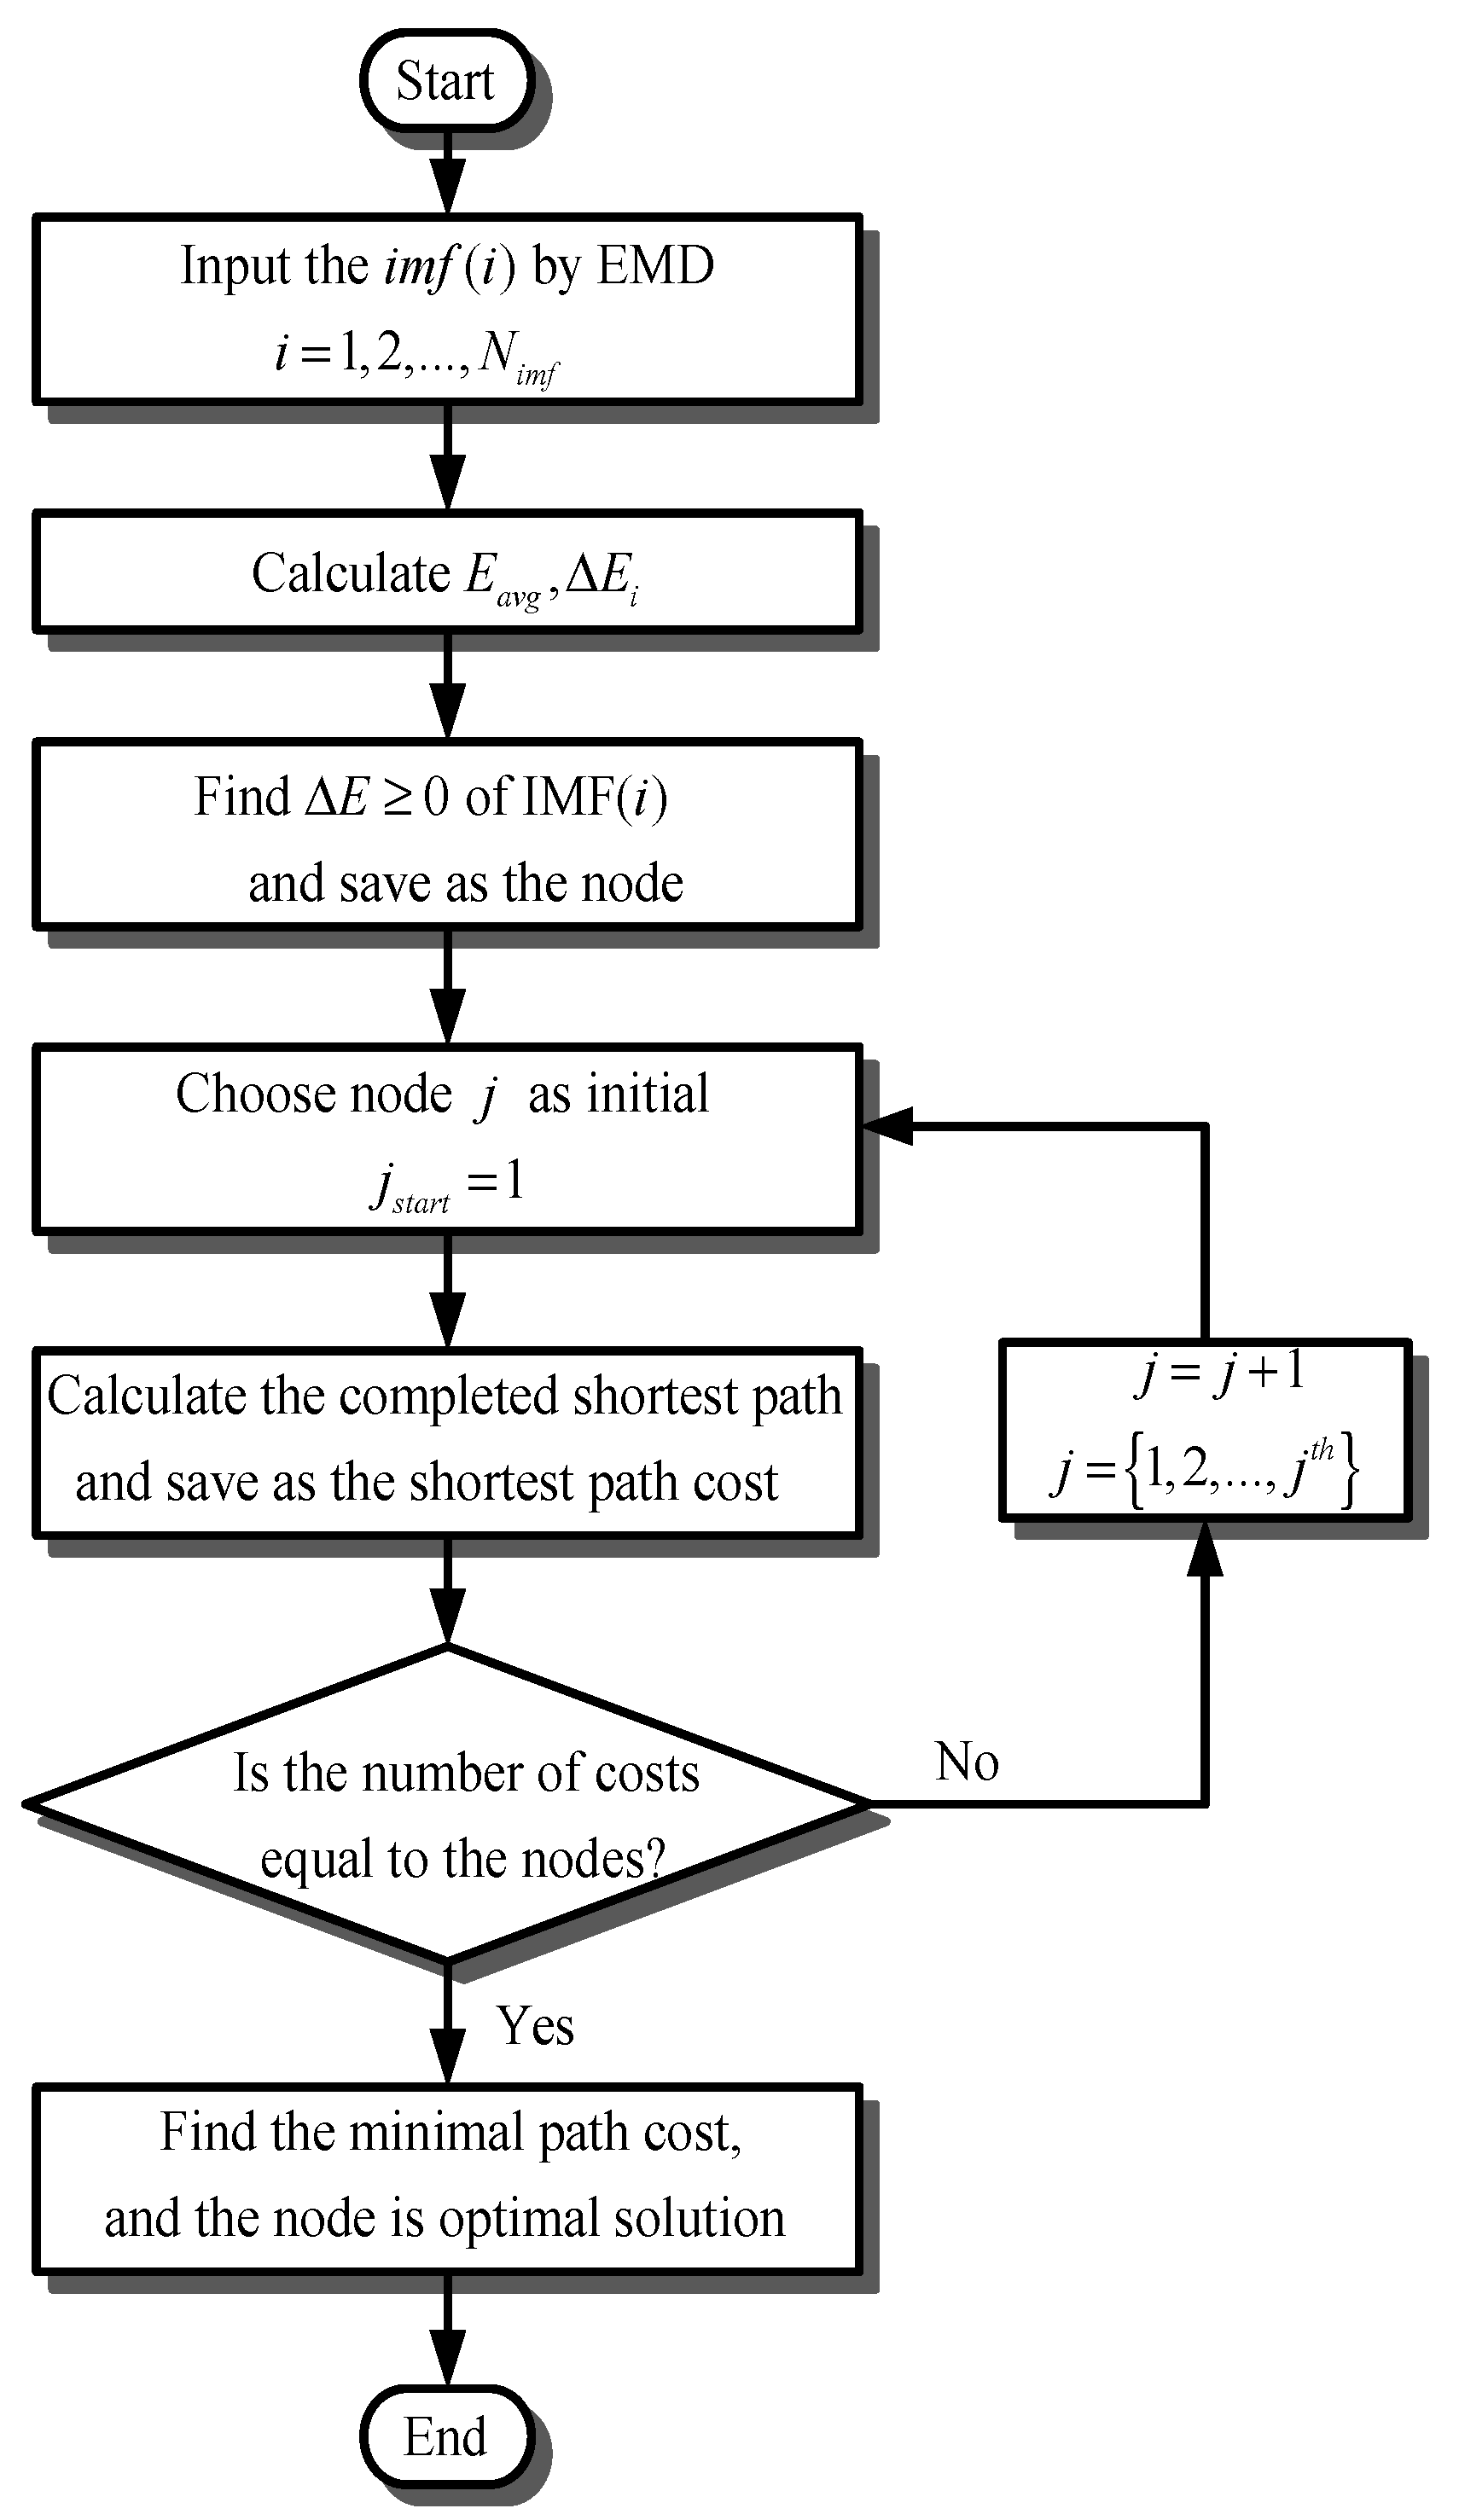
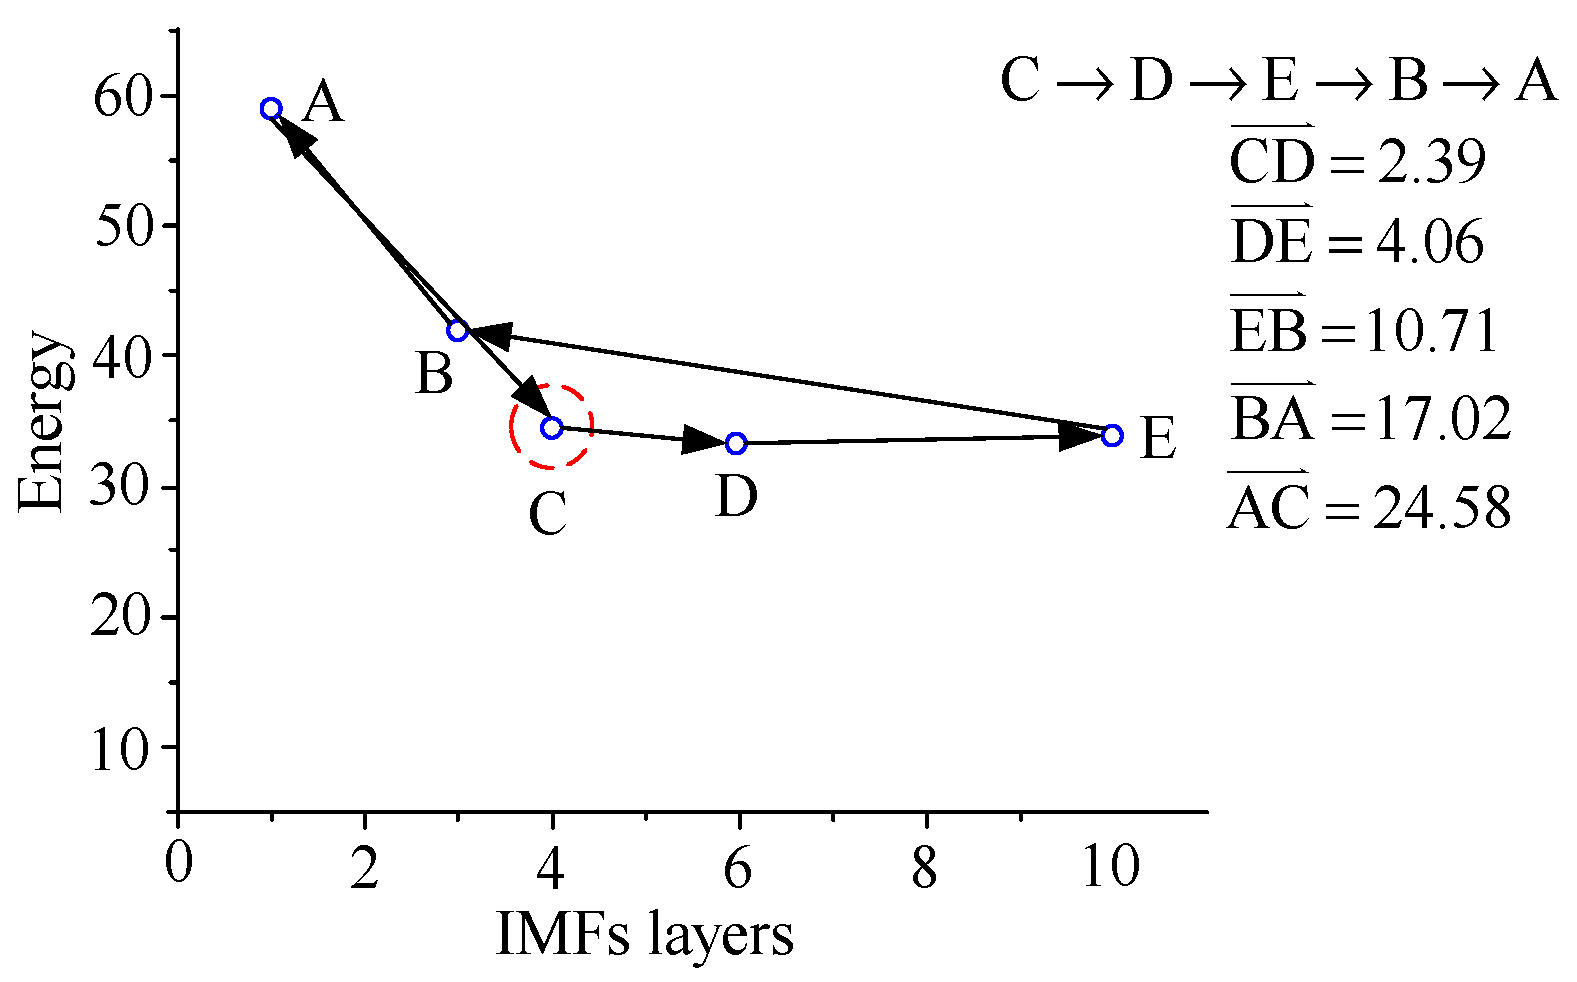
The j-th node in which each node is are selected in the i-th layer of IMFs. Each initial j-th node produces different shortest path costs, as shown in Figure 4. A first node is chosen to connect the other nodes to form its shortest path, and the corresponding/relative shortest path cost can be calculated. Every shortest path and its shortest path cost can be calculated to each first node. Consequently, the optimal first node can be obtained which is the minimal cost in the shortest path costs. The optimal first node is the best IMF layer to sufficiently represent characteristics of the signals. The flowchart of the GEMD model is shown as Figure 5.
4. Measurement and Analysis
4.1. Experimental Measurements
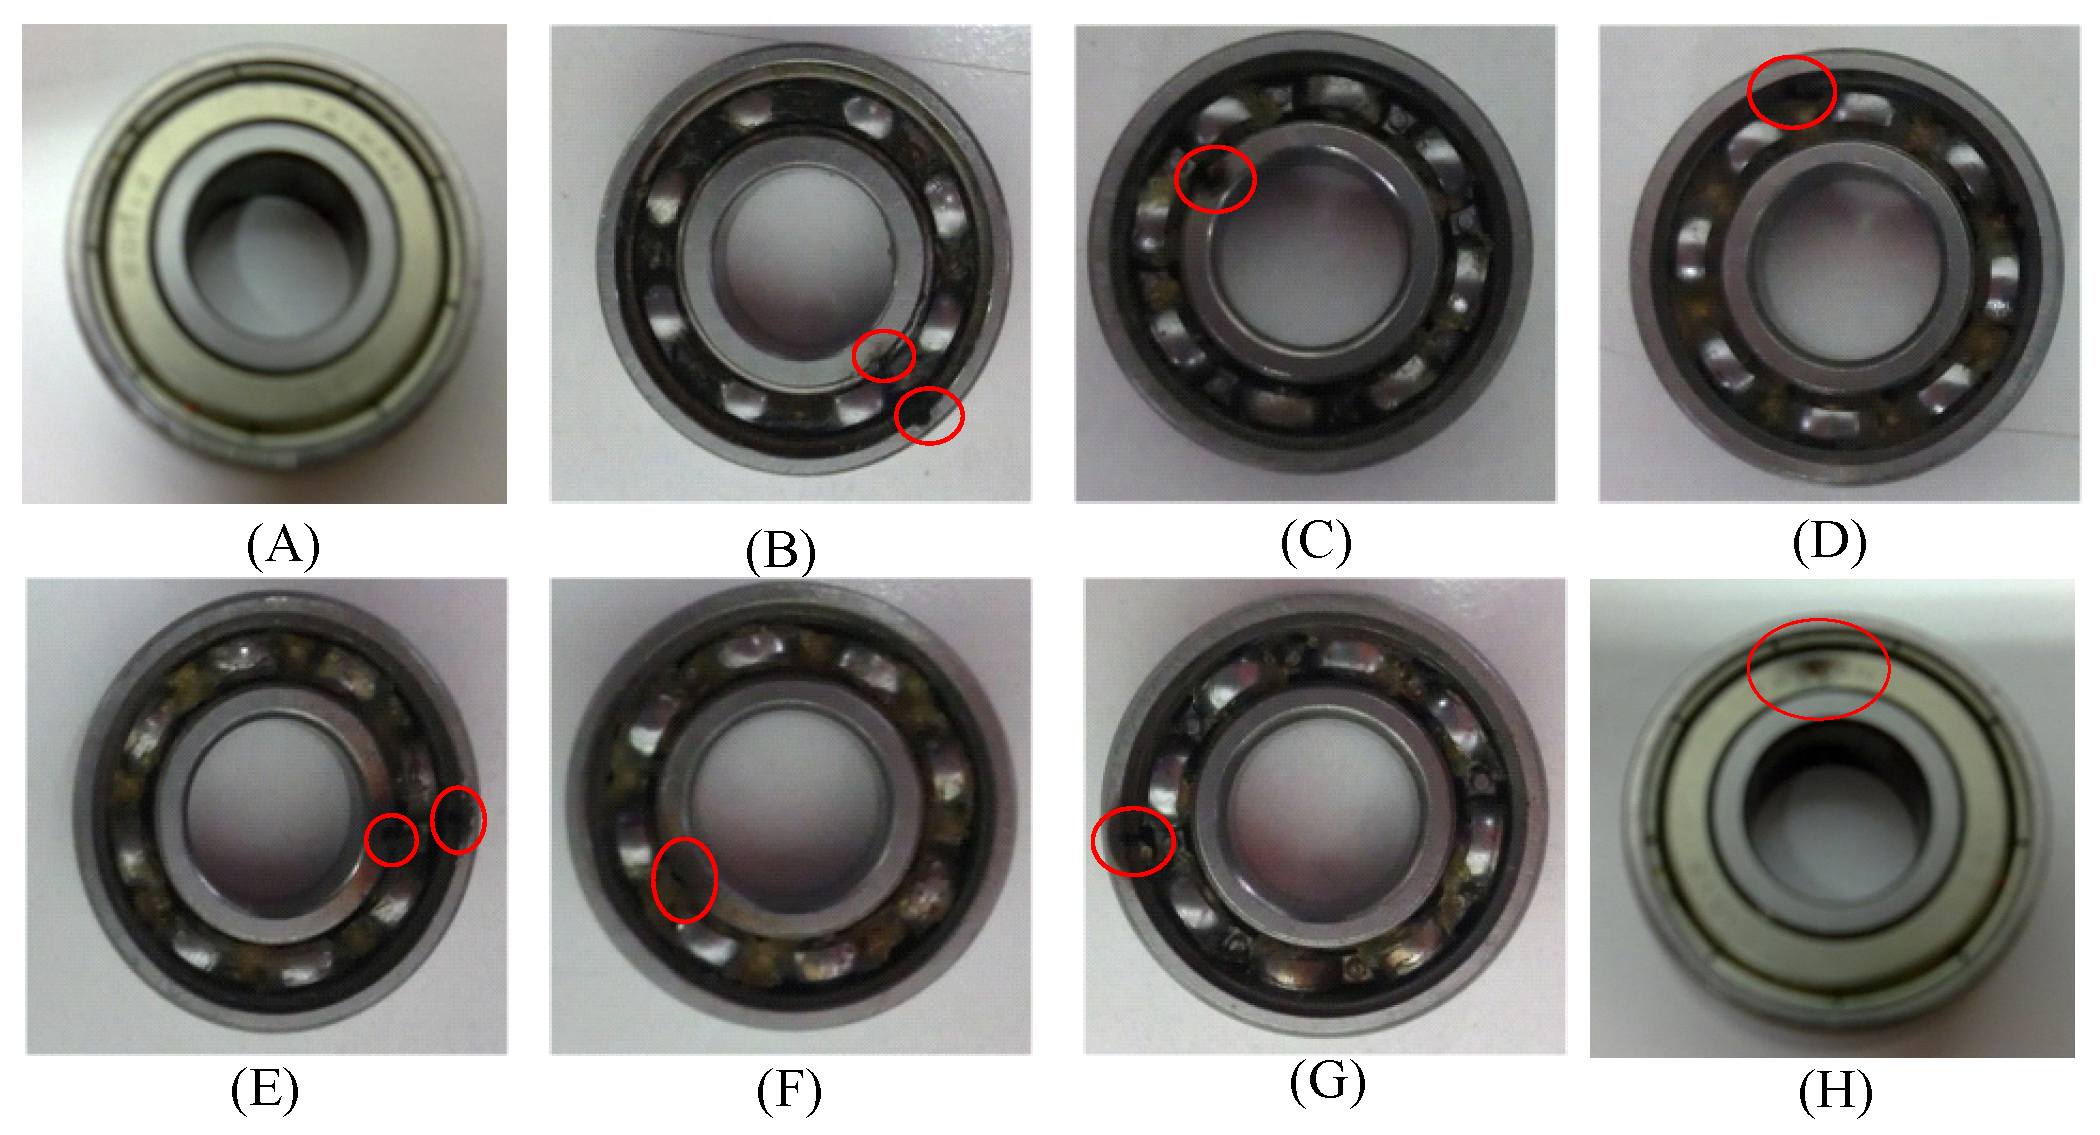
The study subjects are the bearing damages of a motor (BLDC 24VDC, 150W, 3000 rpm, Taiwan), and the bearing specification is shown in Table 1. To analyze the bearing damages, eight bearing types, including seven damage types, were tailor-made from the electrical discharge machining (EDM) technique. The eight types are shown in Figure 6: (A) healthy bearing, (B) 1.0 mm holes on both inner and outer race, (C) one 1.0 mm hole on inner race, (D) one 1.0 mm hole on outer race, (E) 0.5 mm holes on both inner and outer race, (F) one 0.5 mm hole on inner race, (G) one 0.5 mm hole on outer race, and (H) seal damage.
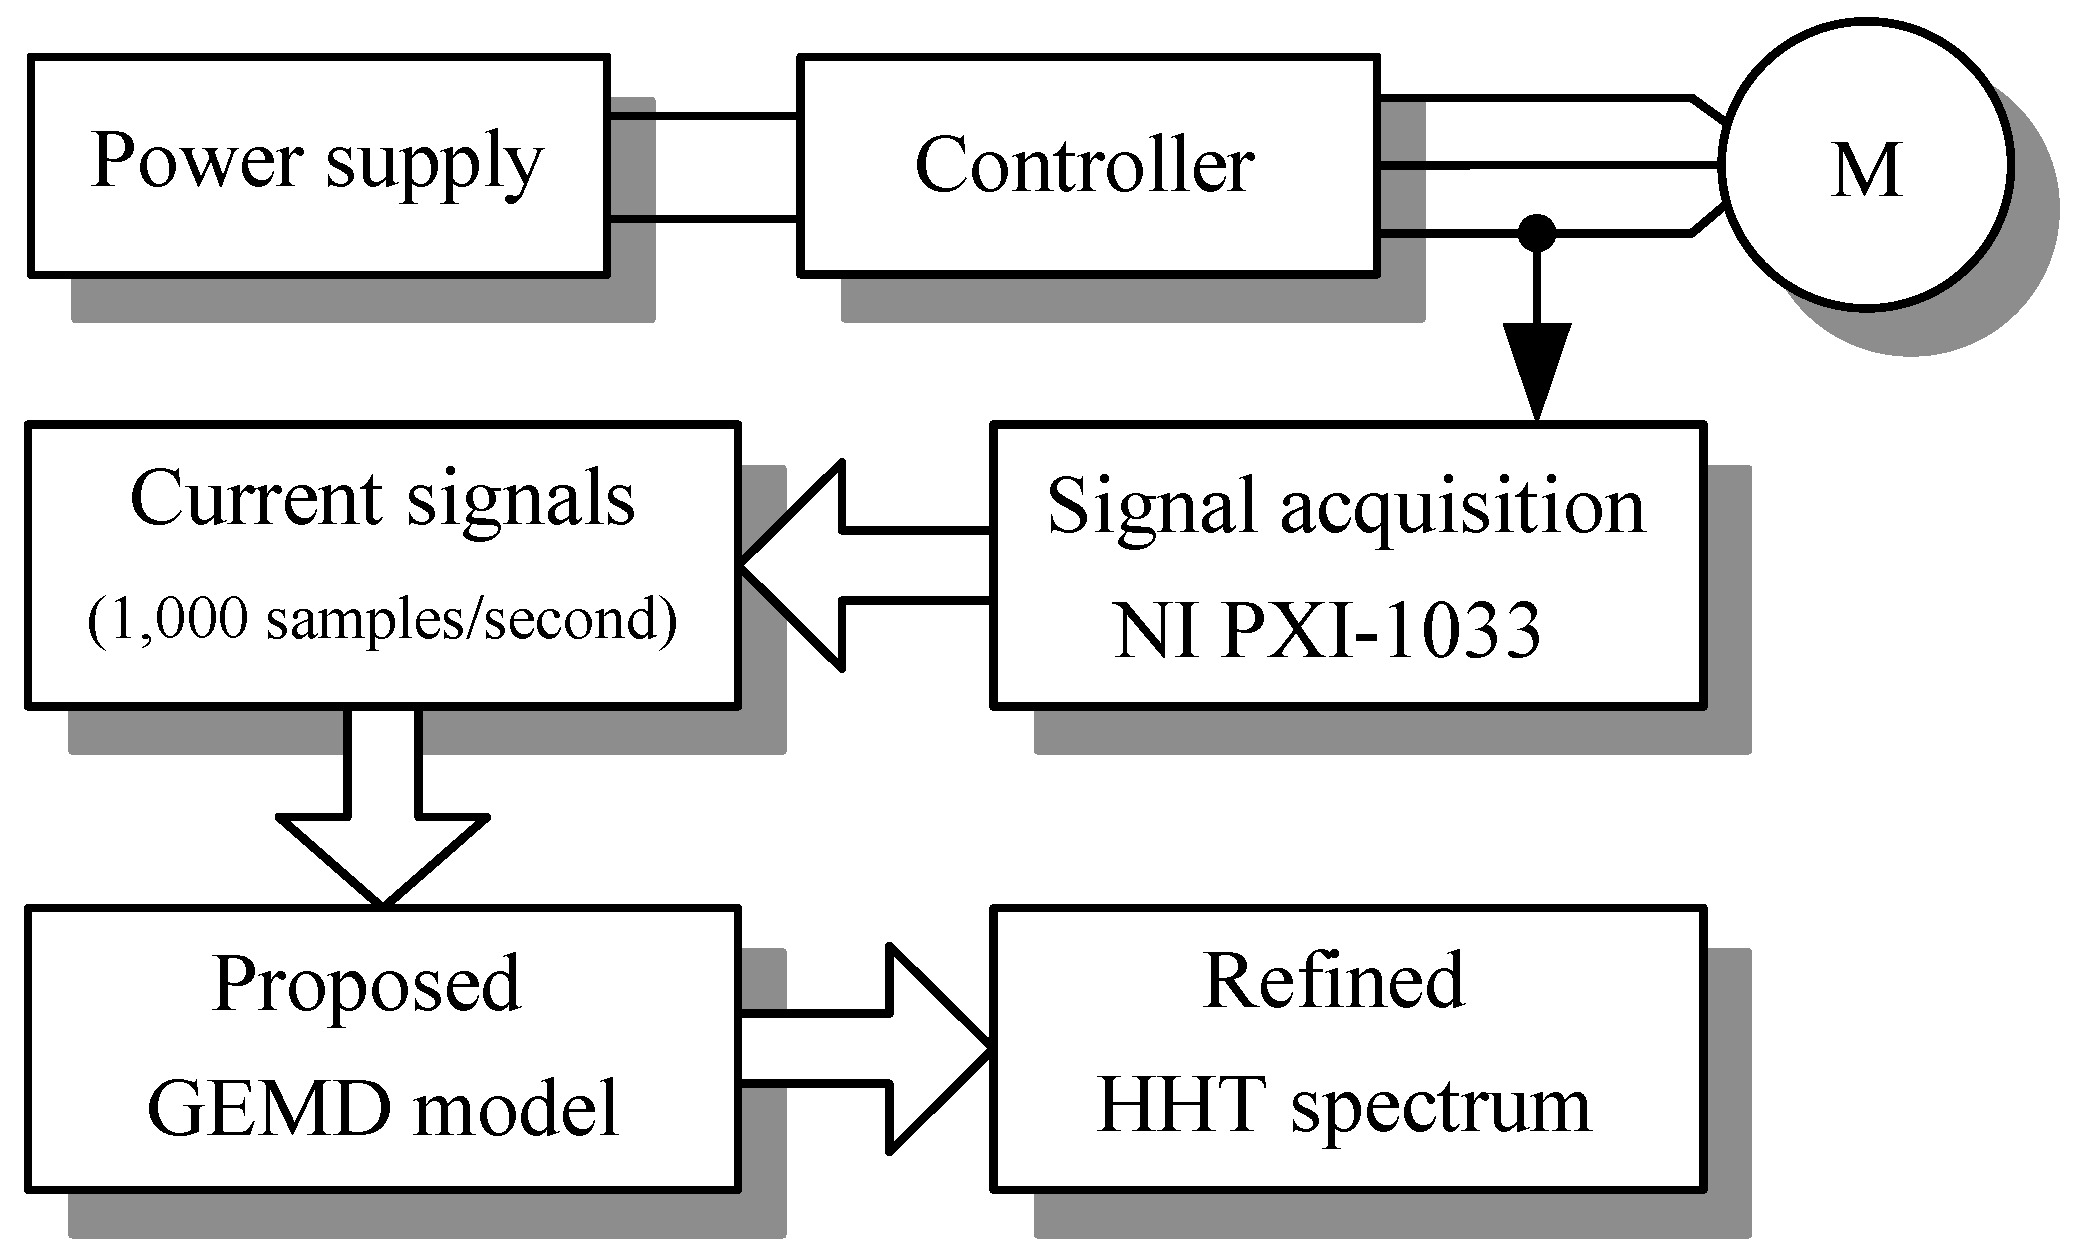
These current signals were recorded using National Instruments PXI-1033 data acquisition (sample rate 1,000 Hz, National Instruments, Austin, TX, USA.). The current signals were decomposed to layers of IMFs by EMD. Then the optimal IMFs, which were selected using the proposed GEMD model, were transformed by the HHT spectrum to observe the bearing damage condition. The detection system diagram is shown in Figure 7.
4.2. Signal Analysis
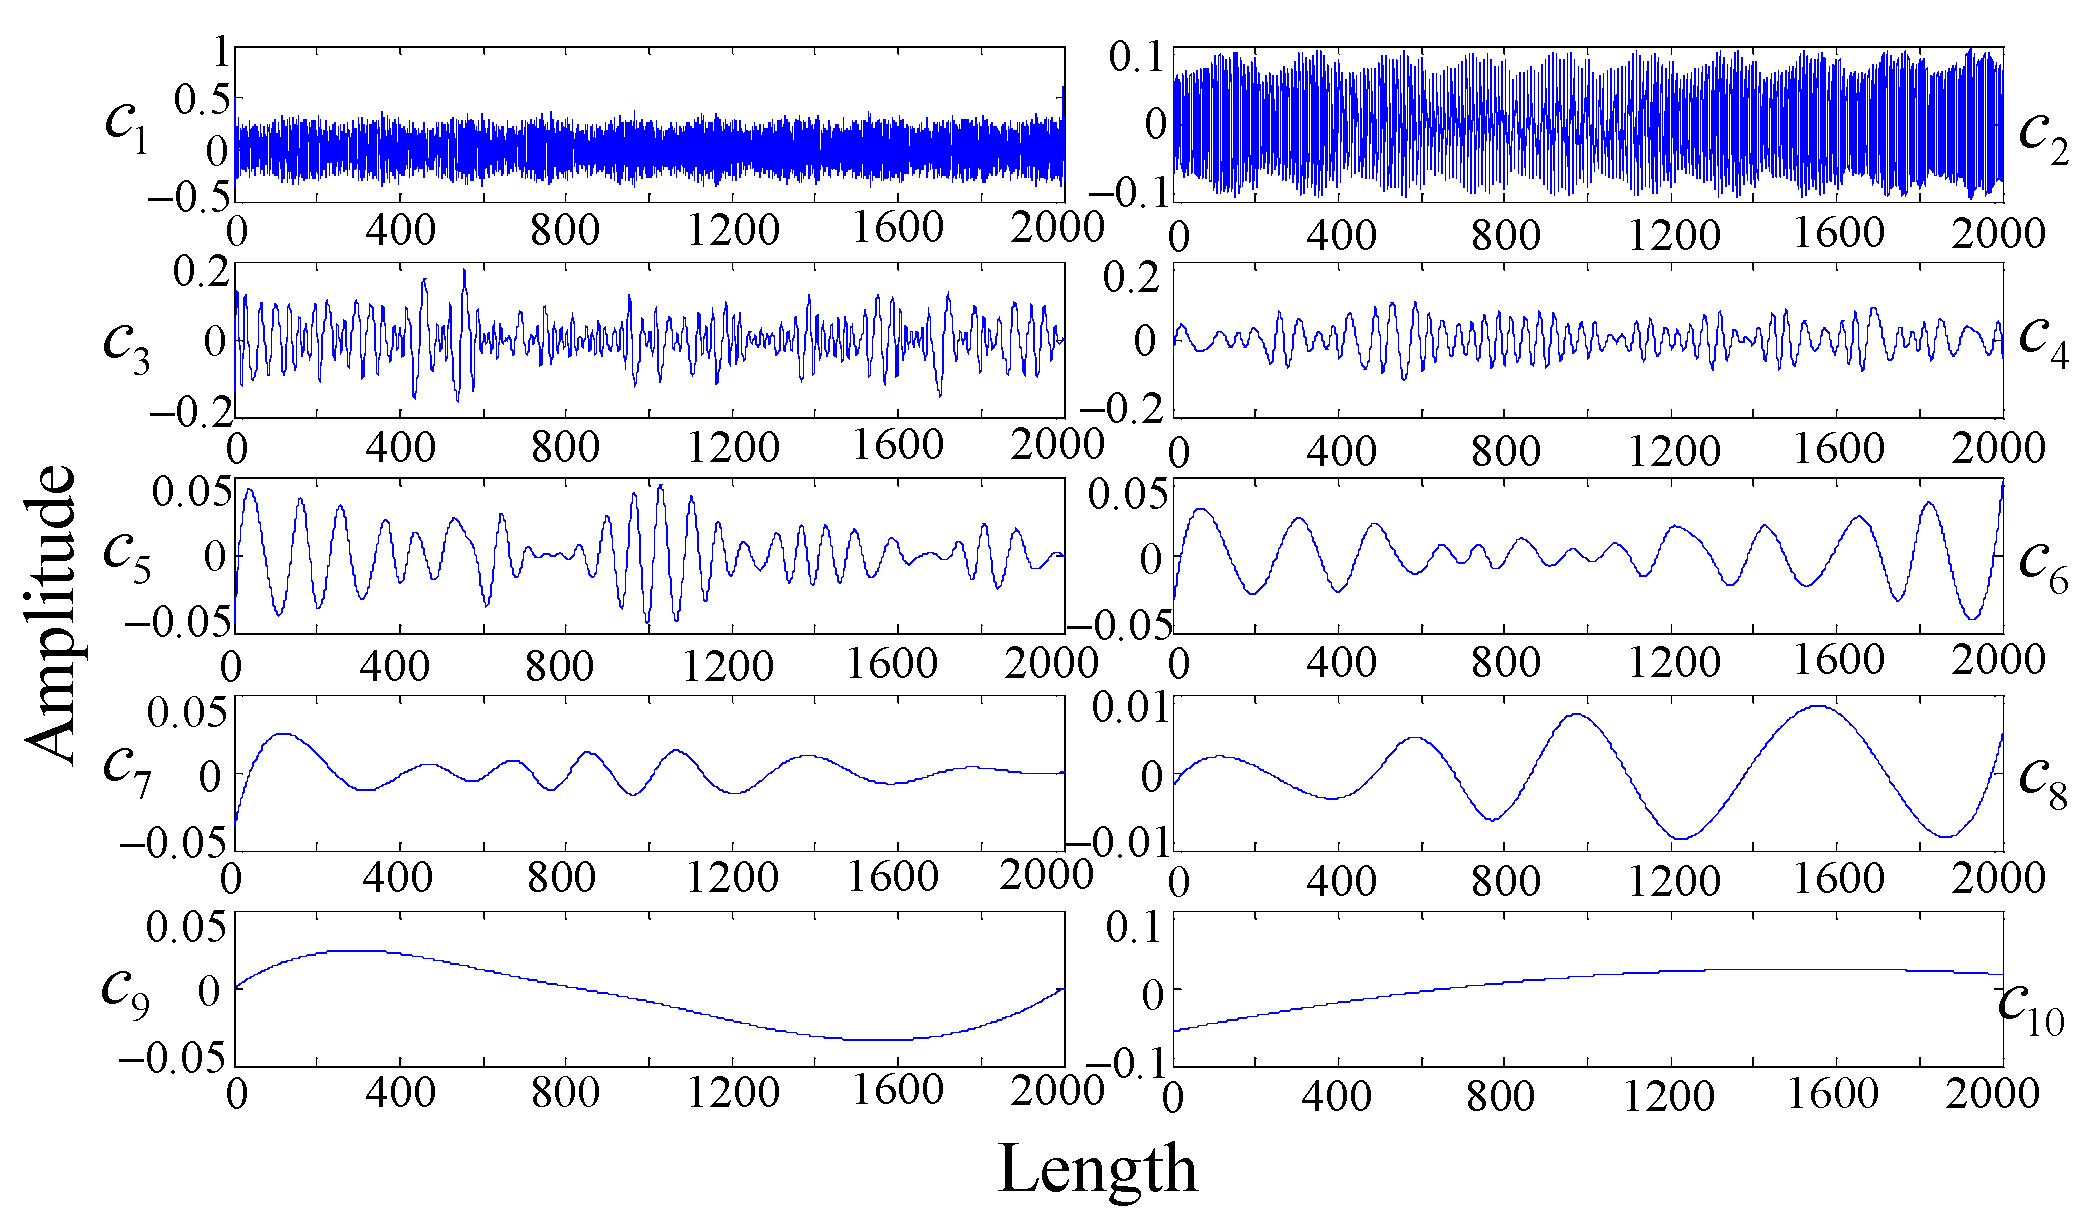
EMD decomposes the current signals to 10 layers of IMFs. Figure 8 illustrates the IMFs and the tendency function of bearing damage signal by using the classical EMD model. The layers c1 to c9 are IMFs from high frequency to low frequency, respectively, and the layer c10 shows the tendency function. The IMFs energy can be calculated to the corresponding detection accuracy by using the BPNN, as shown in Table 2. The selected nodes are , , , and , as nodes A, B, C, D, and E and the layers 1, 3, 4, 6, and 10, respectively, are shown in Figure 9. The distance between each of these nodes are shown in Table 3.
The shortest path costs are calculated for each selected node. Four rules of the GA are adopted, which are:
- (Rule 1) each node should be the start node,
- (Rule 2) the start node connects to next nearest node,
- (Rule 3) all remaining nodes should be sequentially connected by Rule 2,
- (Rule 4) compare all costs of the shortest close paths formed by each start node in Rule 1.
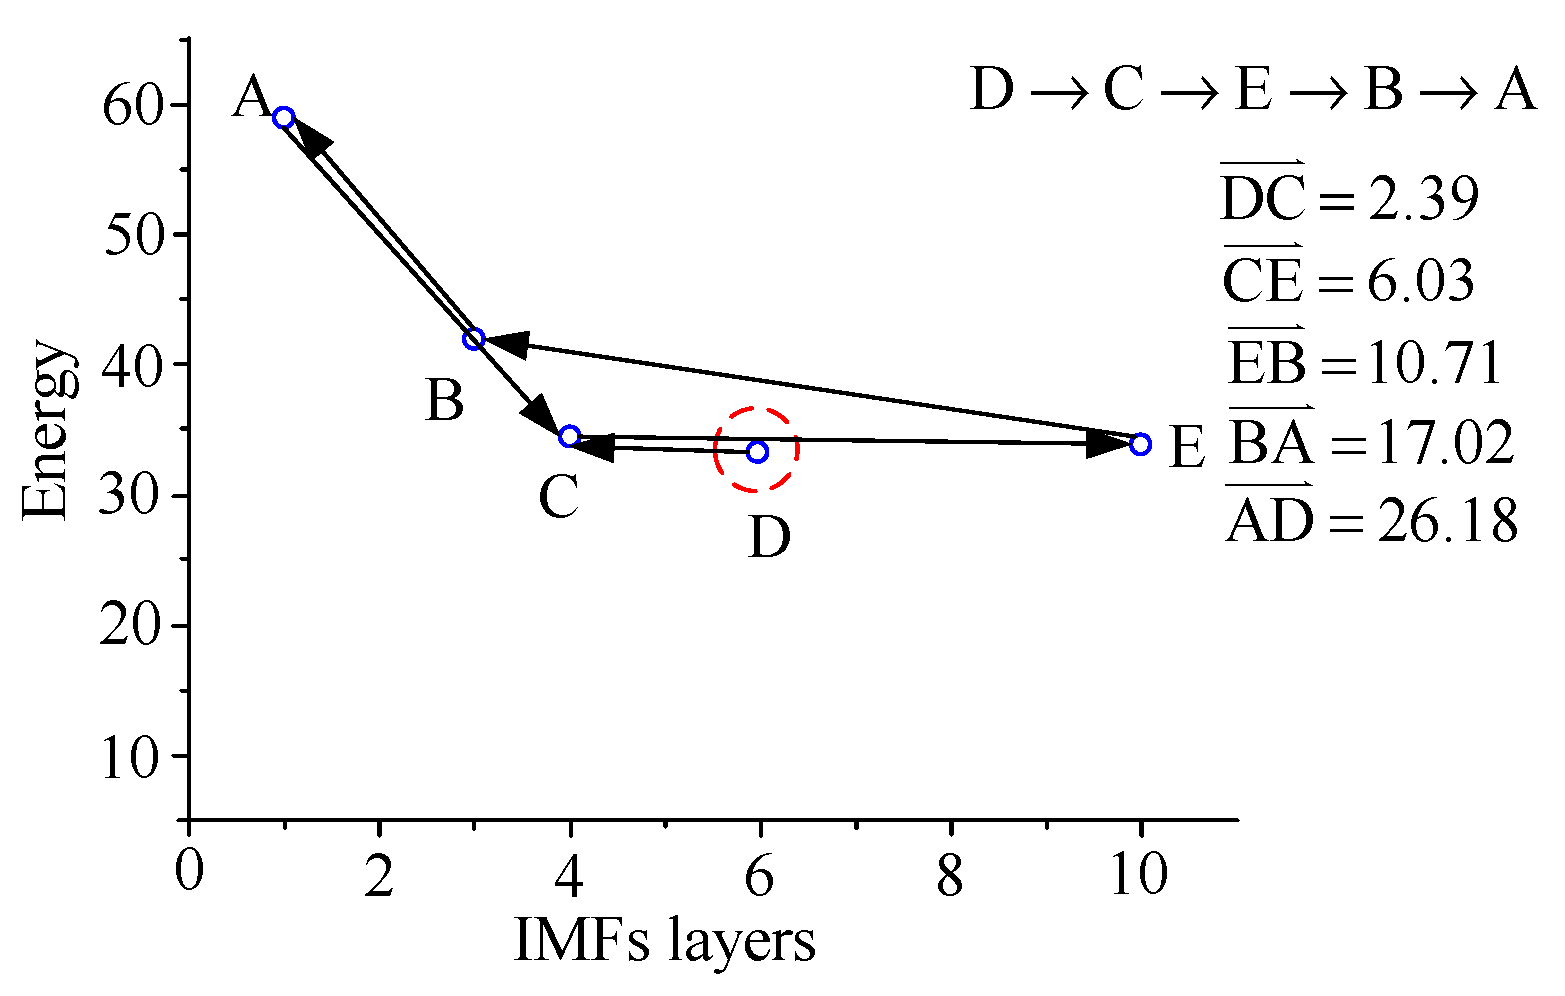
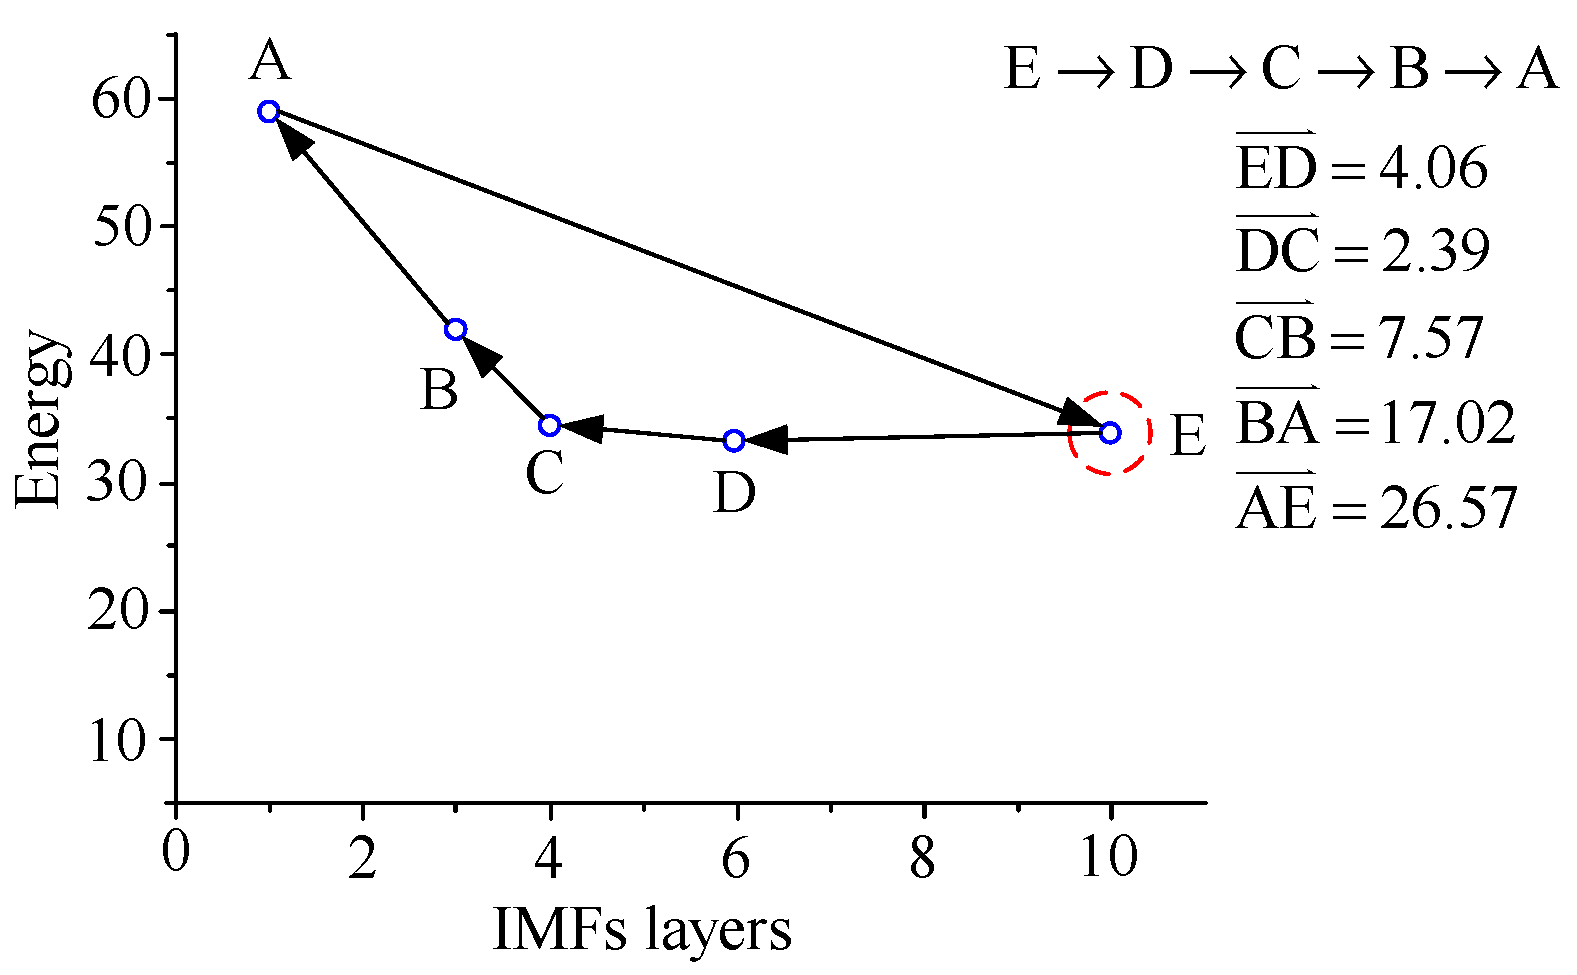
For example, assuming node A is the start node, the nearest node will be connected with node A, and the nearest node should be node B; the node distances are shown in Table 3. Then all remaining nodes should be sequentially connected to form a shortest close path, as shown in Figure 10. All the paths of the start nodes B, C, D, and E can be illustrated by repeating the aforementioned way, as shown in Figure 11, Figure 12, Figure 13 and Figure 14.
The costs of the all paths with A, B, C, D, and E as start nodes are shown in Equation (9), in which the lowest costs of the paths formed by the start nodes A, B, and E are obtained. That means the optimal IMF layers 1, 3, and 10 can adequately illustrate the HHT spectrum of the damage type.
5. Results and Discussion
5.1. HHT Spectrum and GEMD-HHT Spectrum
This research proposes the GEMD model to select the optimal IMFs. The HHT spectrum becomes easier to observe the damage types by the proposed GEMD model, namely GEMD-HHT spectrum. The HHT and GEMD-HHT spectrums of the various types of bearings are illustrated as follows.
5.1.1. Healthy
The classical HHT spectrum of the healthy bearing is shown in Figure 15a, in which the spectrum contents all the IMFs layers of the original signal and is not significant to observe the characteristics of the bearing. Therefore, we use the proposed GEMD model to obtain the optimal IMFs layers 1, 3, and 10. The refined spectrum is clearer, as shown in Figure 15b.
5.1.2. Seal Damage
The type of damage is seal damage. The HHT and GEMD-HHT spectrums of the damage are shown in Figure 16a,b, respectively, in which the main frequency bands of both types are almost the same, around 340–350 Hz. Observing the GEMD-HHT spectrum of the damage type, two specific damage characteristics are found: (1) the sub-frequency band is around 25–75 Hz, (2) the frequency in 1.7-th s is changed from 0 Hz to 5 Hz.
5.1.3. Race Surface Damages
(1) Two 0.5 mm holes on both inner and outer race:
The type of damage is with two 0.5 mm holes on both the inner and outer race. The HHT and GEMD-HHT spectrums of the damage are shown in Figure 17a,b, respectively, in which the main frequency bands are around 240–250 Hz. Observing the GEMD-HHT spectrums of the damage type, two specific damage characteristics are found: (1) the sub-frequency band is around 30–80 Hz, (2) the frequency of 1.8-th s is changed from 0 Hz to 5 Hz.
(2) One 0.5 mm hole on inner race:
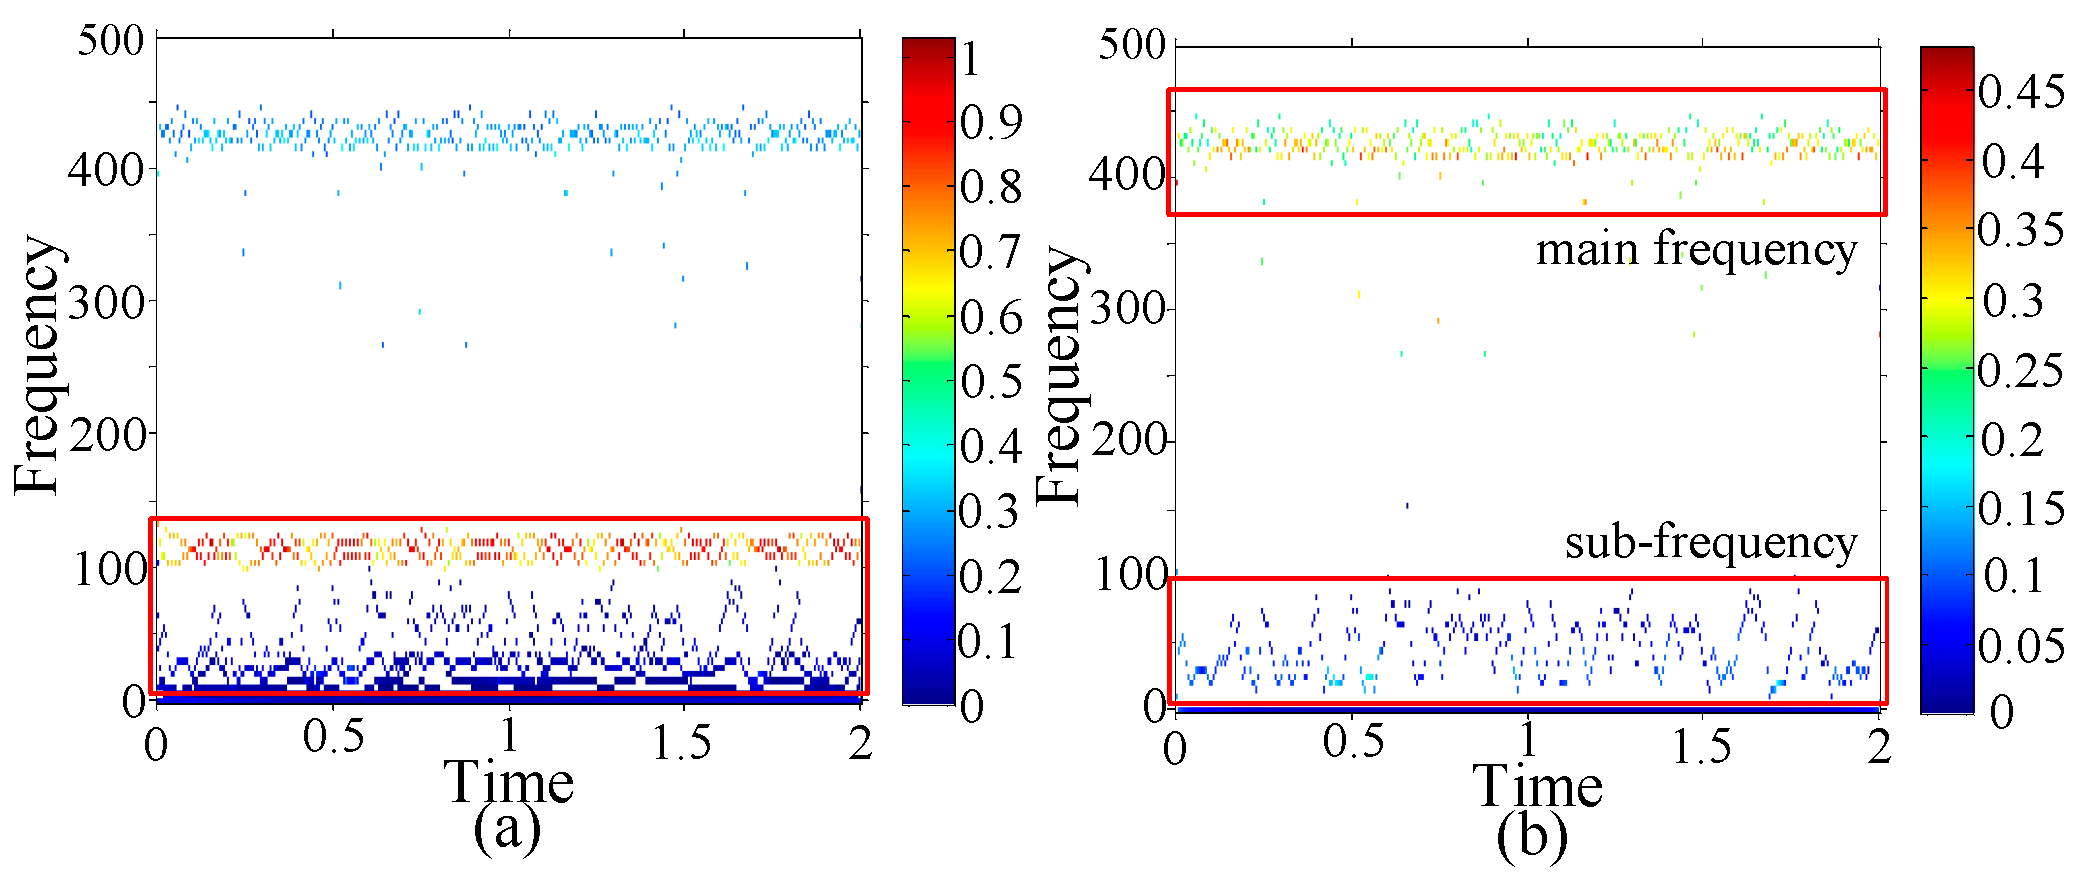
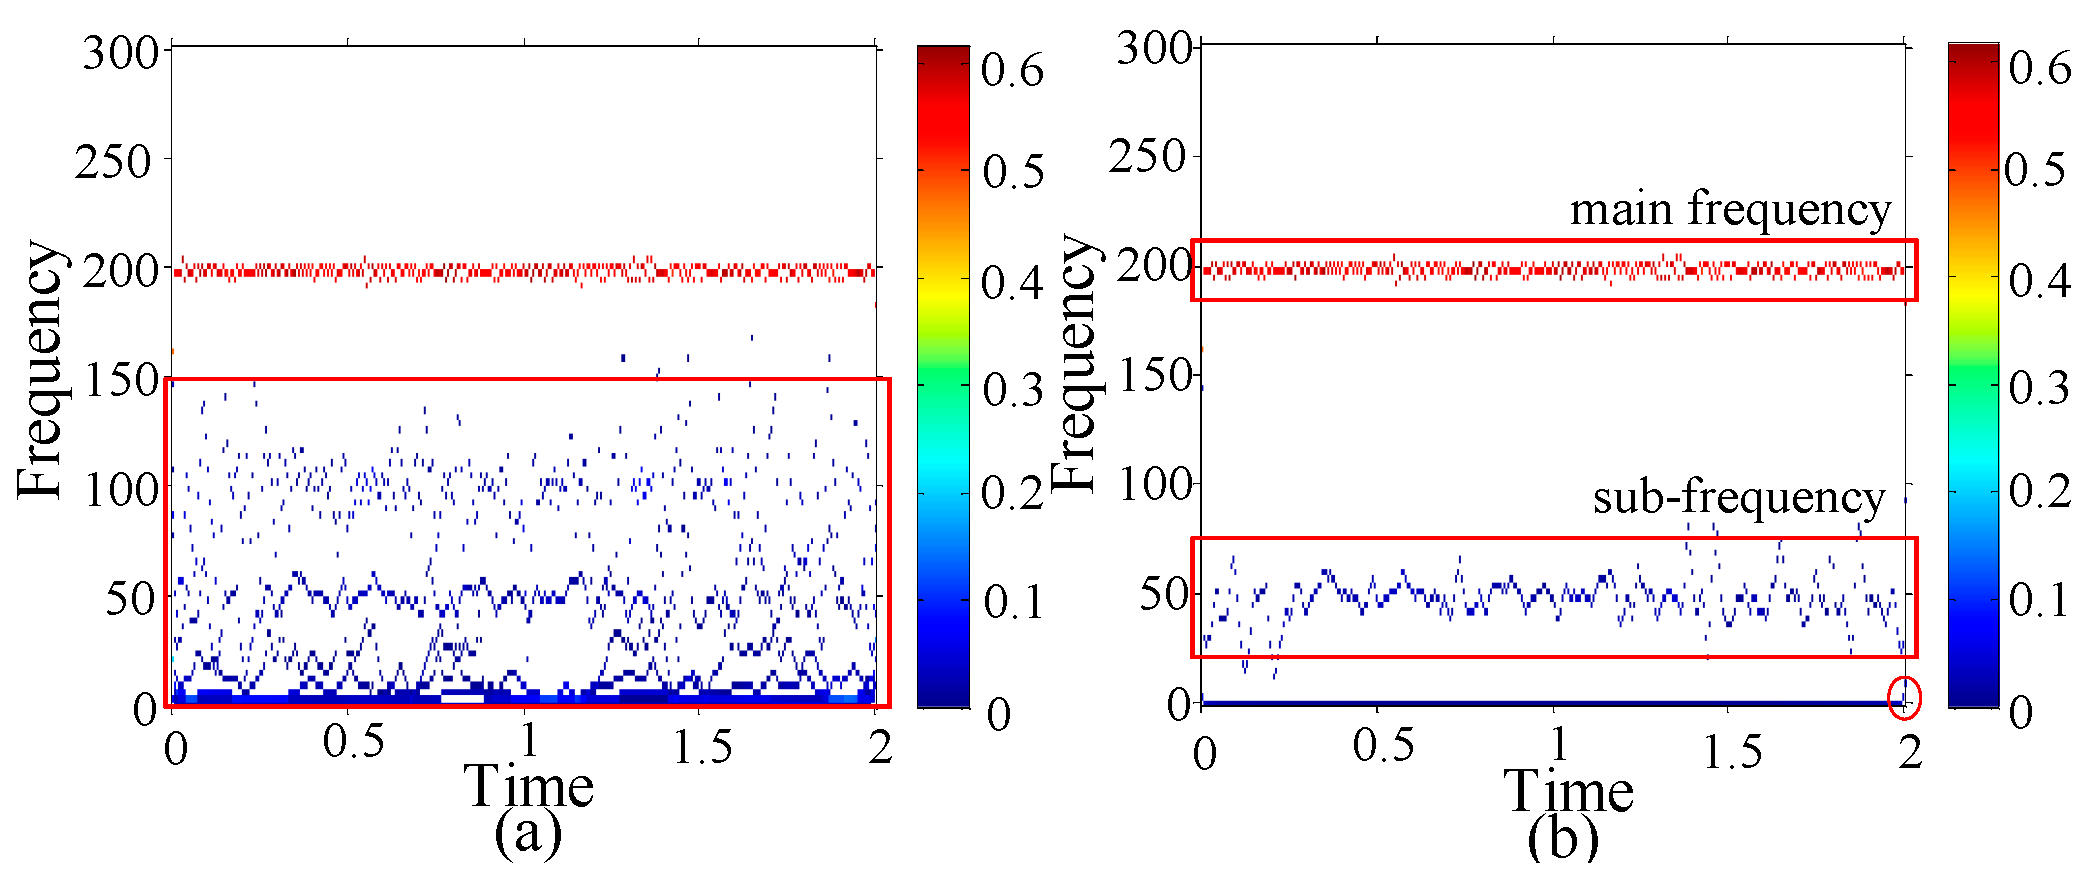
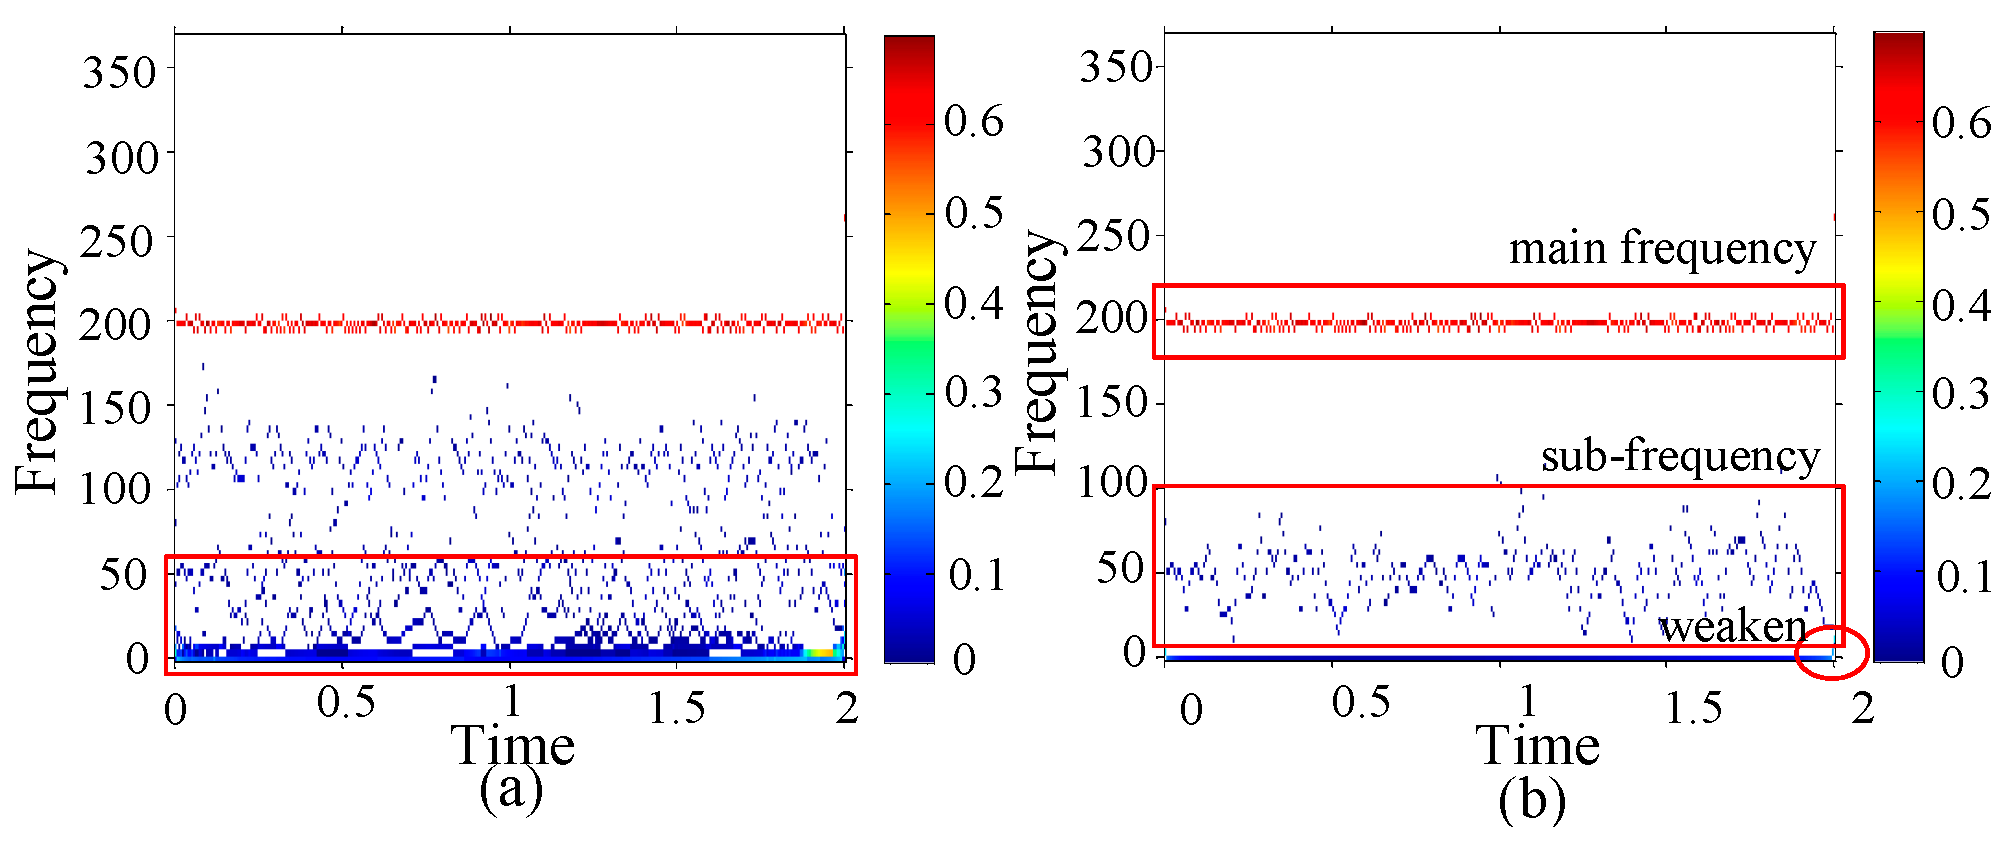
The type of damage is with one 0.5 mm hole on inner race. The HHT and GEMD-HHT spectrums of the damage are shown in Figure 18a,b, respectively, in which the main frequency bands are around 190–200 Hz. Observing the GEMD-HHT spectrums of the damage type, two specific damage characteristics are found: (1) the sub-frequency band is around 25–75 Hz, (2) the frequency of 2nd s is changed from 0 Hz to 5 Hz.
(3) One 0.5 mm hole on outer race:
The type of damage is with one 0.5 mm hole on outer race. The HHT and GEMD-HHT spectrums of the damage are shown in Figure 19a,b, respectively, in which the main frequency bands are around 190–200 Hz. Observing the GEMD-HHT spectrum of the damage type, two specific damage characteristics are found: (1) the sub-frequency band is around 10–100 Hz, (2) the frequency of 2nd s is changed from 0 Hz to 5 Hz, and its amplitude is weakened.
(4) Two 1.0 mm hole on both inner and outer Race
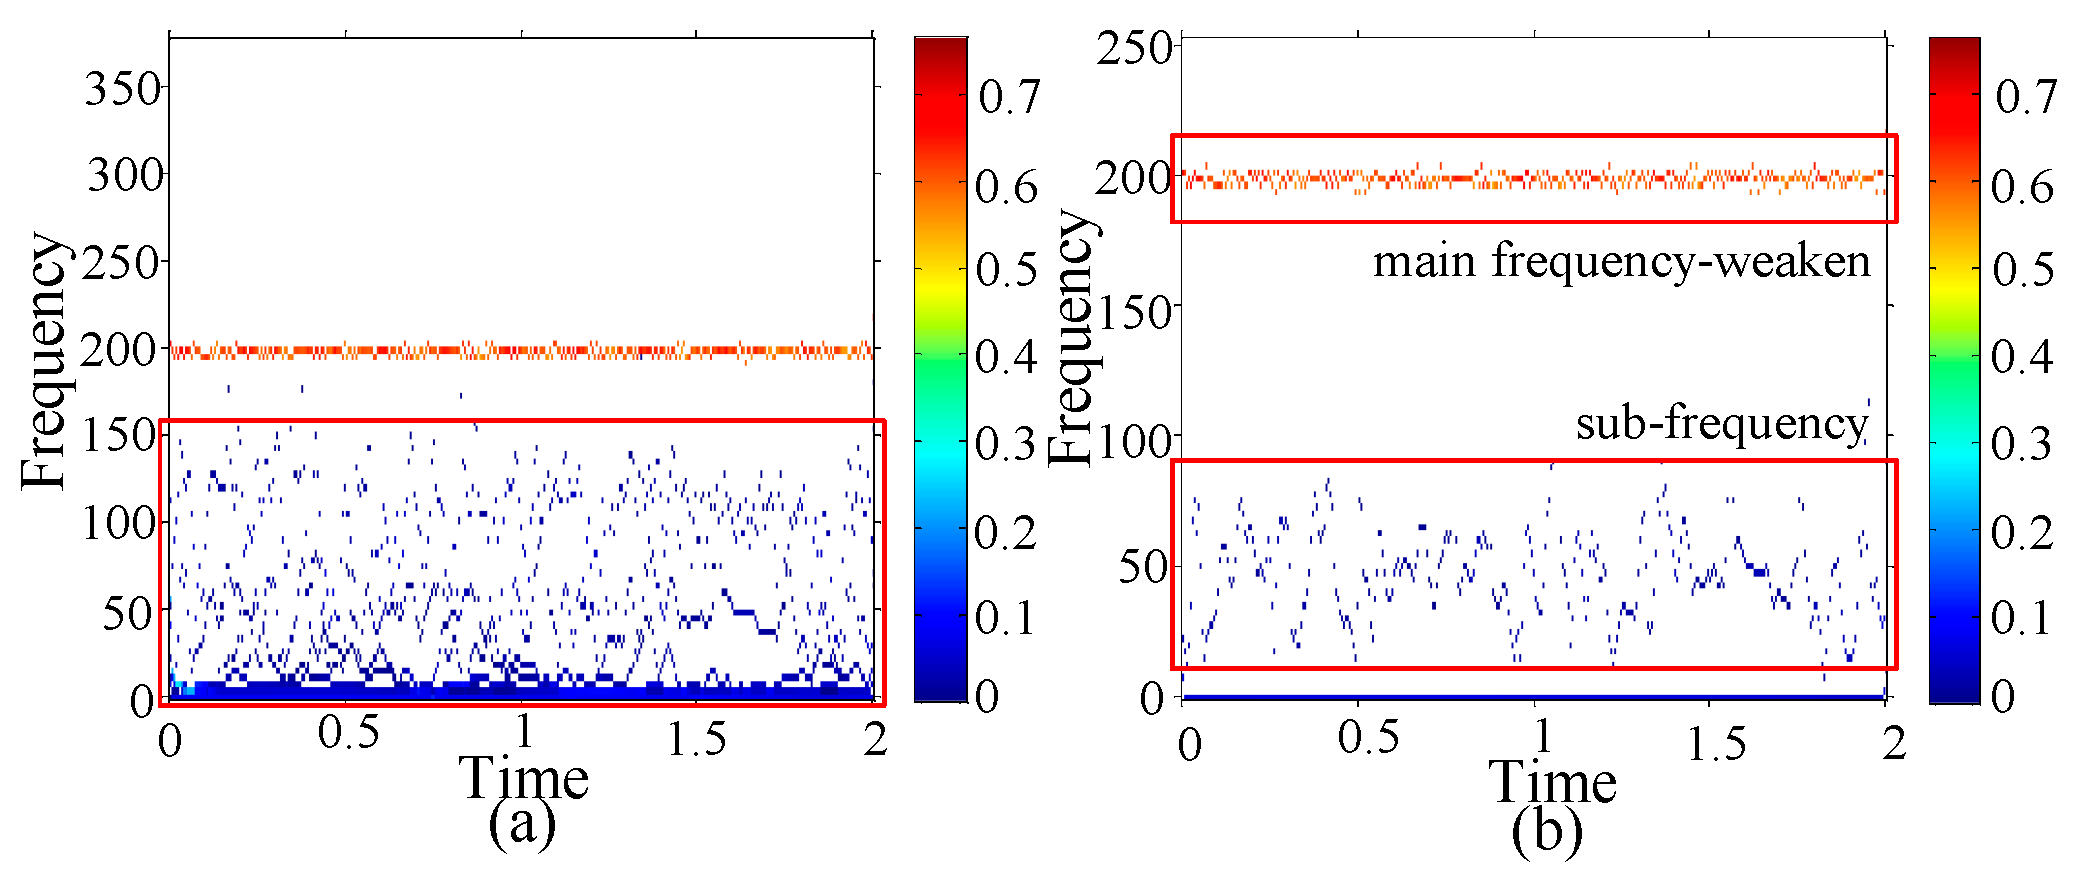
The type of damage is with two 1.0 mm holes on both inner and outer race. The HHT and GEMD-HHT spectrums of the damage are shown in Figure 20a,b, respectively, in which the main frequency bands are around 190–200 Hz. Observing the GEMD-HHT spectrum of the damage type, two specific damage characteristics are found: (1) the sub-frequency band is around 10–90 Hz, (2) the amplitude of the main frequency is weakened.
(5) One 1.0 mm hole on inner race
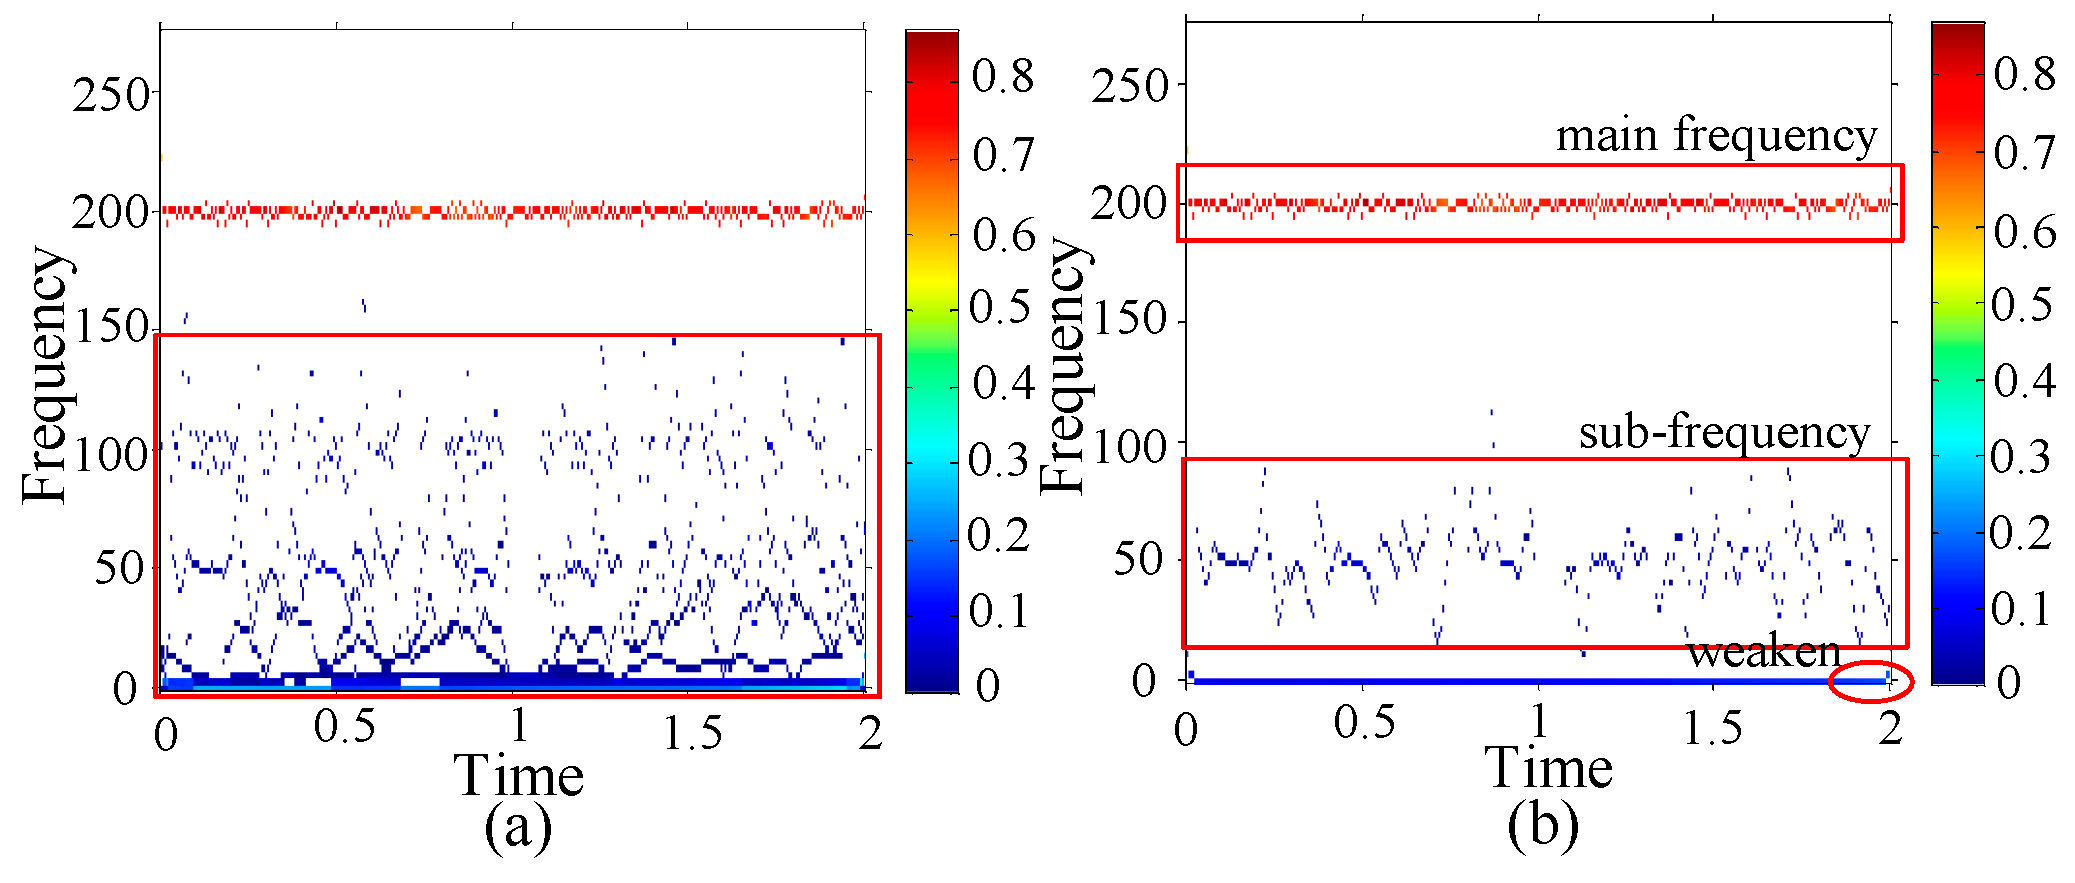
The type of damage is with one 1.0 mm hole on inner race. The HHT and GEMD-HHT spectrums of the damage are shown in Figure 21a,b, respectively, in which the main frequency bands are around 190–200 Hz. Observing the GEMD-HHT spectrum of the damage type, two specific damage characteristics are found: (1) the sub-frequency band is around 15–90 Hz, (2) the frequency of 2nd s changed from 0 Hz to 5 Hz, and its amplitude is weakened.
(6) One 1.0 mm hole on outer race
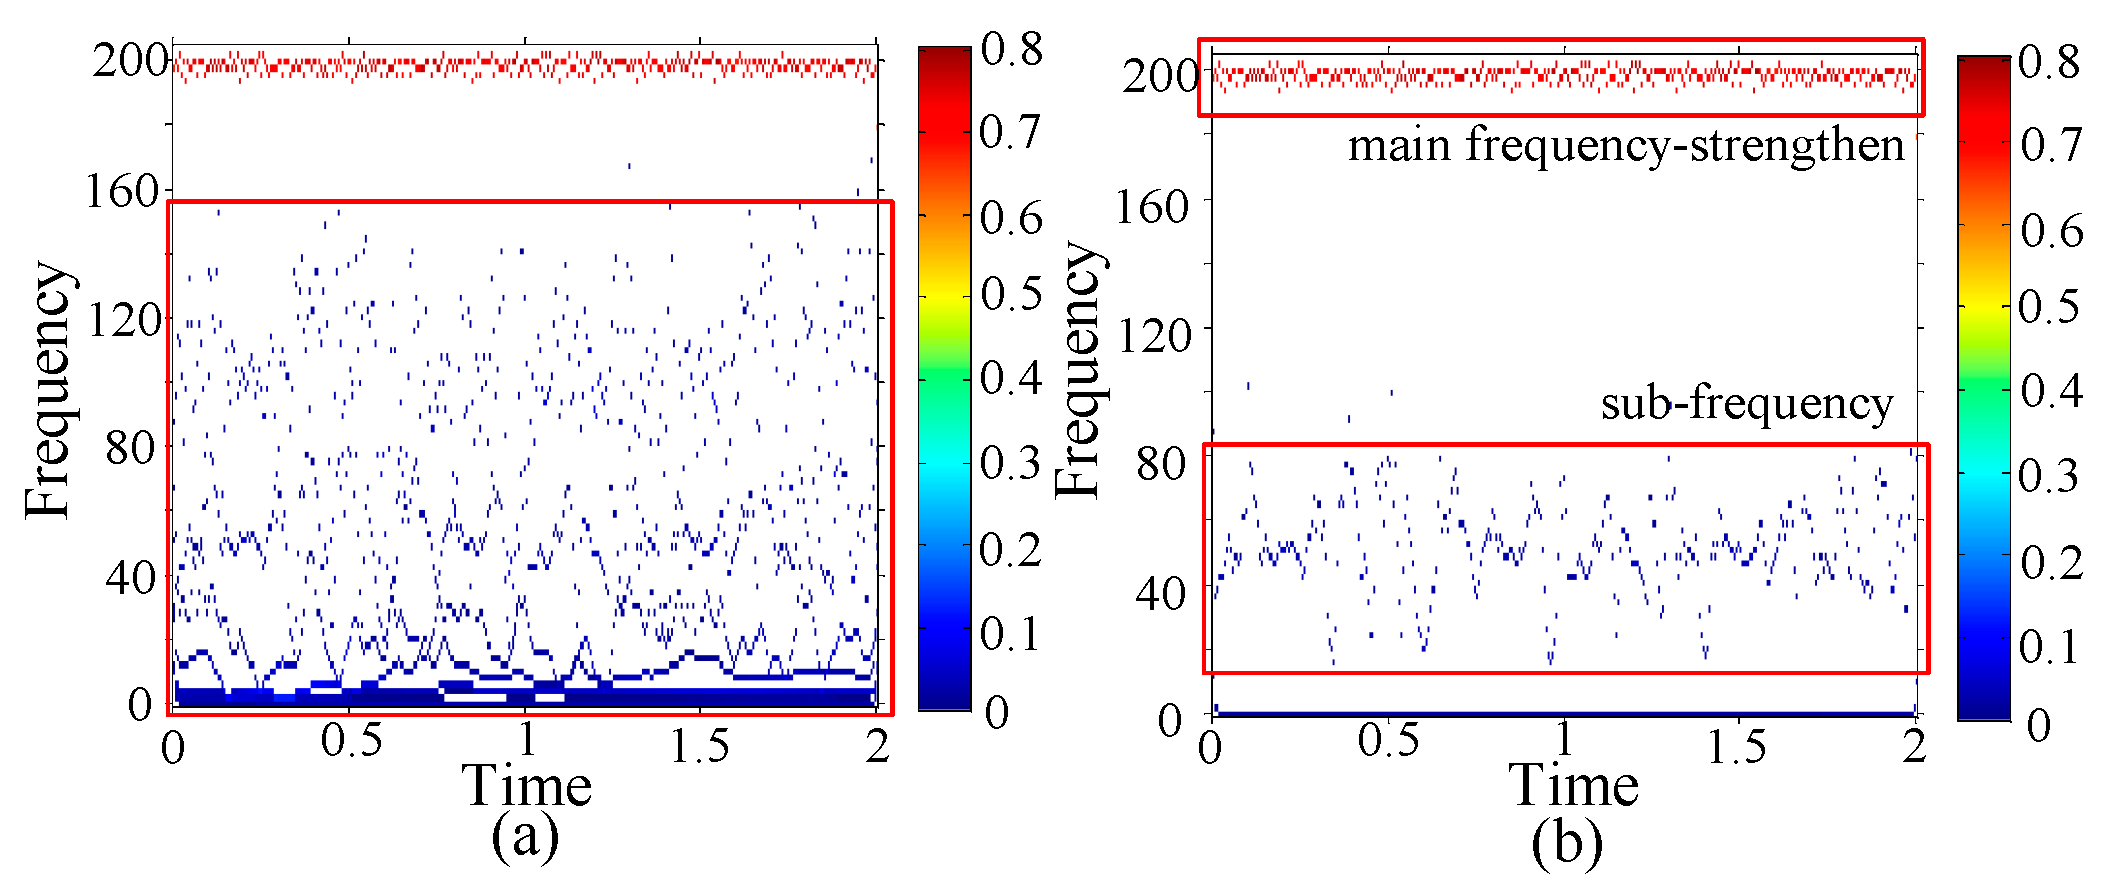
The type of damage is with one 1.0 mm hole on outer race. The HHT and GEMD-HHT spectrums of the damage are shown in Figure 22a,b, respectively, in which the main frequency bands are 190–200 Hz. Observing the GEMD-HHT spectrum of the damage type, two specific damage characteristics are found: (1) the sub-frequency band is around 10–85 Hz, (2) the amplitude of the main frequency is strengthened.
5.2. Discussion
- Classify damage types: The paper focuses on three types of gearing which are healthy, seal damage, and race surface damage. The main frequency of GEMD-HHT spectrums of the healthy, seal damage, and race surface damage types are 400, 350, and 200 Hz, respectively. The specific damage type can be detected easily by using the proposed GEMD model.
- Realize damage range/size: The proposed GEMD model can realize the size of the race surface damage. We found that the sub-frequency bands of the 0.5 mm and 1.0 mm damage types are at 25–75 Hz and 20–100 Hz, respectively, no matter whether the damages are located on the inner, outer, or both, of the race surface. Thus, by using the proposed GEMD model, the severity of the damaged bearing can be realized by observing the sub-frequency signals.
5.3. Damage Detection
Based on the BPNN model, the average detection accuracy increased from 97.9% to 98.2% by using the features extracted from the GEMD-HHT spectrum. The results show that the average detection accuracy improved by using the proposed GEMD model. Furthermore, the average detection accuracy improved from 69.5% to 74.6% by using the features extracted from the GEMD-HHT spectrum even in a noise interference 10 dB, as shown in Table 4.
6. Conclusions
This paper proposes the GEMD model to select the optimal IMFs, which can observe easily the HHT spectrum in the detection damage system. The model not only improves the classical HHT spectrum but also increases the detection damage accuracy based on the BPNN. Even in noise interferences, the availability and superiority of the proposed GEMD model can be validated in the damage detection system.
Author Contributions
Conceptualization and methodology, C.-Y.L. and Y.-H.H.; software, K.-Y.H.; writing—original draft preparation, C.-Y.L. and Y.-H.H.; review and editing, P.-H.C.
Funding
This research received no external funding.
Conflicts of Interest
The authors declare no conflict of interest.
References
- Hori, Y. Future vehicle driven by electricity and control—Research on four-wheel-motored UOT Electric March II. IEEE Trans. Ind. Electron. 2004, 51, 954–962. [Google Scholar] [CrossRef]
- Kolokolov, Y.V.; Koschinsky, S.L.; Adjallah, K.H. Data acquisition aspects in experimental research of electromechanical systems dynamics. IEEE Trans. Instrum. Meas. 2002, 51, 107–114. [Google Scholar] [CrossRef]
- O’Donnell, P. Report of large motor reliability survey of industrial and commercial installations, part I. IEEE Trans. Ind. Appl. 1985, 21, 853–864. [Google Scholar]
- O’Donnell, P. Report of large motor reliability survey of industrial and commercial installations, part II. IEEE Trans. Ind. Appl. 1985, 21, 865–872. [Google Scholar]
- Eren, L.; Devaney, M.M. Bearing damage detection via wavelet packet decomposition of the stator current. IEEE Trans. Instrum. Meas. 2004, 53, 431–436. [Google Scholar] [CrossRef]
- Das, S.; Purkait, P.; Dey, D.; Chakravorti, S. Monitoring of inter-turn insulation failure in induction motor using advanced signal and data processing tools. IEEE Trans. Dielectr. Electr. Insul. 2011, 18, 1599–1608. [Google Scholar] [CrossRef]
- Culbert, I.M.; Rhodes, W. Using current signature analysis technology to reliably detect cage winding defects in squirrel-cage induction motors. IEEE Trans. Ind. Appl. 2007, 43, 422–428. [Google Scholar] [CrossRef]
- Rajamani, P.; Dey, D.; Chakravorti, S. Cross-correlation aided wavelet network for classification of dynamic insulation failures in transformer winding during impulse test. IEEE Trans. Dielectr. Electr. Insul. 2011, 18, 521–532. [Google Scholar] [CrossRef]
- Antonino-Daviu, J.A.; Riera-Guasp, M.; Folch, J.J. Validation of a new method for the detection of rotor bar failures via wavelet transform in industrial induction machines. IEEE Trans. Ind. Appl. 2006, 42, 990–996. [Google Scholar] [CrossRef]
- Borras, D.; Castilla, M.; Moreno, N. Wavelet and neural structure: A new tool for diagnostic of power system disturbances. IEEE Trans. Ind. Appl. 2001, 37, 184–190. [Google Scholar] [CrossRef]
- Lau, E.C.C.; Ngan, H.H. Detection of motor bearing outer raceway defect by wavelet packet transformed motor current signature analysis. IEEE Trans. Instrum. Meas. 2010, 59, 2683–2690. [Google Scholar] [CrossRef]
- Kijewski-Correa, T.; Kareem, A. Efficacy of Hilbert and wavelet transforms for time-frequency analysis. J. Eng. Mech. 2006, 132, 1037–1049. [Google Scholar] [CrossRef]
- Liu, J.B.; Wang, X.W.; Yuan, S.S. On Hilbert-Huang transform approach for structural health monitoring. J. Intell. Mater. Syst. Struct. 2006, 17, 721–728. [Google Scholar] [CrossRef]
- Qin, S.R.; Zhong, Y.Y. A new envelope algorithm of Hilbert-Huang transform. Mech. Syst. Signal Process. 2006, 20, 1941–1952. [Google Scholar] [CrossRef]
- Goharrizi, A.Y.; Sepehri, N. Internal leakage detection in hydraulic actuators using empirical mode decomposition and Hilbert spectrum. IEEE Trans. Instrum. Meas. 2012, 61, 368–378. [Google Scholar] [CrossRef]
- Li, R.; He, D. Rotational machine health monitoring and fault detection using EMD-based acoustic emission feature quantification. IEEE Trans. Instrum. Meas. 2012, 61, 990–1001. [Google Scholar] [CrossRef]
- Hao, P.; Wang, Z.; Chen, J. A measuring method of the single-phase AC frequency, phase, and reactive power based on the Hilbert filtering. IEEE Trans. Instrum. Meas. 2007, 56, 918–923. [Google Scholar] [CrossRef]
- Yan, R.; Gao, R.R. Hilbert-Huang transform-based vibration signal analysis for machine health monitoring. IEEE Trans. Instrum. Meas. 2006, 55, 2320–2329. [Google Scholar] [CrossRef]
- Tang, W.H.; Goulermas, J.Y.; Wu, Q.H.; Richardson, Z.J.; Fitch, J. A probabilistic classifier for transformer dissolved gas analysis with a particle swarm optimizer. IEEE Trans. Power Deliv. 2008, 23, 751–759. [Google Scholar]
- Juang, C.F.; Lu, C.M.; Lo, C.; Wang, C.C. Ant colony optimization algorithm for fuzzy controller design and its FPGA implementation. IEEE Trans. Ind. Electron. 2008, 55, 1453–1462. [Google Scholar] [CrossRef]
- Abu-Mouti, F.S.; El-Hawary, M.M. Optimal distributed generation allocation and sizing in distribution systems via artificial bee colony algorithm. IEEE Trans. Power Deliv. 2011, 26, 2090–2101. [Google Scholar] [CrossRef]
- Huggins, P.S.; Zucker, S.S. Greedy basis pursuit. IEEE Trans. Signal Process. 2007, 55, 3760–3772. [Google Scholar] [CrossRef]
- Jia, Y.W.; Yang, E.H.; He, D.K.; Chan, S. A greedy renormalization method for arithmetic coding. IEEE Trans. Commun. 2007, 55, 1494–1503. [Google Scholar] [CrossRef]
- Tamura, S.; Tateishi, M. Capabilities of a four-layered feedforward neural network: Four layers versus three. IEEE Trans. Neural Netw. 1997, 8, 251–255. [Google Scholar] [CrossRef] [PubMed]
- Huang, G.B.; Chen, L.; Siew, C.C. Universal approximation using incremental constructive feedforward networks with random hidden nodes. IEEE Trans. Neural Netw. 2006, 17, 879–892. [Google Scholar] [CrossRef] [PubMed]
- Tripathy, M.; Maheshwari, R.P.; Verma, H.H. Power transformer differential protection based on optimal probabilistic neural network. IEEE Trans. Power Deliv. 2010, 25, 102–112. [Google Scholar] [CrossRef]
- Perera, N.; Rajapakse, A.A. Recognition of fault transients using a probabilistic neural-network classifier. IEEE Trans. Power Deliv. 2011, 26, 410–419. [Google Scholar] [CrossRef]
- Wu, W.; Feng, G.R.; Li, Z.Z. Deterministic convergence of an online gradient method for BP neural networks. IEEE Trans. Neural Netw. 2005, 16, 533–540. [Google Scholar] [CrossRef]
- Shukla, S.; Mishra, S.; Singh, B. Empirical-mode decomposition with Hilbert transform for power-quality assessment. IEEE Trans. Power Deliv. 2009, 24, 2159–2165. [Google Scholar] [CrossRef]
- Lee, C.; Hsieh, Y.H. Bearing damage detection of BLDC motors based on current envelope analysis. Meas. Sci. Rev. 2012, 12, 290–295. [Google Scholar] [CrossRef]
Figure 1.
Structure of bearing damage detection using the proposed greedy empirical mode decomposition (GEMD).
Figure 1.
Structure of bearing damage detection using the proposed greedy empirical mode decomposition (GEMD).

Figure 2.
Flowchart of empirical mode decomposition (EMD) decomposition.

Figure 3.
Energy distribution model.

Figure 4.
Shortest path cost.

Figure 5.
Optimization of intrinsic mode functions (IMFs) by using the proposed GEMD model.

Figure 6.
(A) Healthy bearing, (B) 1.0 mm holes on both inner and outer race, (C) one 1.0 mm hole on inner race, (D) one 1.0 mm hole on outer race, (E) 0.5 mm holes on both inner and outer race, (F) one 0.5 mm hole on inner race, (G) one 0.5 mm hole on outer race, and (H) seal damage.
Figure 6.
(A) Healthy bearing, (B) 1.0 mm holes on both inner and outer race, (C) one 1.0 mm hole on inner race, (D) one 1.0 mm hole on outer race, (E) 0.5 mm holes on both inner and outer race, (F) one 0.5 mm hole on inner race, (G) one 0.5 mm hole on outer race, and (H) seal damage.

Figure 7.
System diagram.

Figure 8.
IMFs and the tendency function of bearing damage signal.

Figure 9.
Selected nodes of .

Figure 10.
Shortest path of start node A.

Figure 11.
Shortest path of start node B.

Figure 12.
Shortest path of start node C.

Figure 13.
Shortest path of start node D.

Figure 14.
Shortest path of start node E.

Figure 15.
Healthy bearing (a) Hilbert–Huang transform (HHT) spectrum (b) GEMD-HHT spectrum.

Figure 16.
Seal damage (a) HHT spectrum (b) GEMD-HHT spectrum.

Figure 17.
Holes of 0.5 mm on both inner and outer race (a) HHT spectrum (b) GEMD-HHT spectrum.

Figure 18.
One 0.5 mm hole on inner race (a) HHT spectrum (b) GEMD-HHT spectrum.

Figure 19.
One 0.5mm hole on outer race (a) HHT (b) GEMD-HHT spectrum.

Figure 20.
Holes of 1.0 mm on both inner and outer race (a) HHT spectrum (b) GEMD-HHT spectrum.

Figure 21.
One 1.0 mm hole on inner race (a) HHT (b) GEMD-HHT spectrum.

Figure 22.
One 0.5 mm hole on outer race (a) HHT (b) GEMD-HHT spectrum.


Table 1.
The bearing specification.
| Bearing Model | Bearing Size (mm) | ||
|---|---|---|---|
| Inner | Outer | Thickness | |
| 6001 | 12 | 28 | 8 |
Table 2.
The energy of each IMF of current signals.
| IMF (i) | 1 | 2 | 3 | 4 | 5 |
| Energy (%) | 58.8 | 12.5 | 41.9 | 34.4 | 28.9 |
| IMF (i) | 6 | 7 | 8 | 9 | 10 |
| Energy (%) | 33.1 | 23.8 | 18.4 | 13.8 | 33.88 |
Table 3.
The distance between each of the nodes.
| Node Number | A | B | C | D | E |
|---|---|---|---|---|---|
| IMF Layer | 1 | 3 | 4 | 6 | 10 |
| Axis (X,Y) | (1, 58.8) | (3, 41.9) | (4, 34.4) | (6, 33.1) | (10, 33.8) |
| A | 0 | 17.02 | 24.58 | 26.18 | 26.57 |
| B | 17.02 | 0 | 7.57 | 9.30 | 10.71 |
| C | 24.58 | 7.57 | 0 | 2.39 | 6.03 |
| D | 26.18 | 9.30 | 2.39 | 0 | 4.06 |
| E | 26.57 | 10.71 | 6.03 | 4.06 | 0 |
Table 4.
The classification accuracy of bearing damages.
| Model | Accuracy % | ||
|---|---|---|---|
| SNR | HHT | GEMD-HHT | |
| dB | 97.9 | 98.2% | |
| 30 dB | 97.4% | 97.6% | |
| 20 dB | 93.1% | 93.9% | |
| 10 dB | 69.5% | 74.6% | |
© 2019 by the authors. Licensee MDPI, Basel, Switzerland. This article is an open access article distributed under the terms and conditions of the Creative Commons Attribution (CC BY) license (http://creativecommons.org/licenses/by/4.0/).
Share and Cite
MDPI and ACS Style
Lee, C.-Y.; Huang, K.-Y.; Hsieh, Y.-H.; Chen, P.-H. Optimal Intrinsic Mode Function Based Detection of Motor Bearing Damages. Appl. Sci. 2019, 9, 2587. https://doi.org/10.3390/app9132587
AMA Style
Lee C-Y, Huang K-Y, Hsieh Y-H, Chen P-H. Optimal Intrinsic Mode Function Based Detection of Motor Bearing Damages. Applied Sciences. 2019; 9(13):2587. https://doi.org/10.3390/app9132587
Chicago/Turabian StyleLee, Chun-Yao, Kuan-Yu Huang, Yu-Hua Hsieh, and Po-Hung Chen. 2019. "Optimal Intrinsic Mode Function Based Detection of Motor Bearing Damages" Applied Sciences 9, no. 13: 2587. https://doi.org/10.3390/app9132587
Note that from the first issue of 2016, this journal uses article numbers instead of page numbers. See further details here.