1. Introduction
Advanced polymeric composites are playing a major role in designing high-performance and lightweight aircraft structures. However, a major challenge delaying the implementation of the advanced composites is the lack of accurate methods for material characterization [
1]. Accurate measurement of three-dimensional mechanical properties of composites, stress–strain response, strength, fatigue, and toughness properties, is essential in the development of validated analysis techniques accelerating design and certification of composite structures [
2,
3,
4]. In particular, accurate measurement of interlaminar tensile (ILT) strength is needed to capture delamination failure, which is one of the primary failure modes in composite aircraft structures.
A major technical challenge to accurate measurement of ILT properties is their extreme sensitivity to manufacturing defects, including porosity, which could lead to unacceptable scatter in the test results. Unacceptable failure mode in standard test methods that use transverse tension specimens is another challenge to accurate measurement of the ILT properties. Currently, American Society for Testing and Materials (ASTM) D 6415 curved-beam (CB) method is a standard practice for measurement of the ILT strength [
5]. However, large scatter typically found in ASTM D 6415 ILT strength raises doubts concerning the adequacy of the curved-beam test as a coupon independent test for measuring ILT material strength. Large scatter in the ILT strength test results may indeed reflect the manufacturing quality as much as materials properties. In particular, the ASTM D6415 CB strength is extremely sensitive to porosity/voids in the radius area. In [
6], Jackson and Martin observed a drastic (up to a factor of four) CB strength reduction in low-quality CB specimens due to large (macroscopic) voids detected based on a cross-section cut using a diamond saw. In [
7], the authors of this work measured the ASTM D 6415 CB strength using high-quality 6.6 mm (0.26 inch) thick CB coupons manufactured from Hexcel IM7/8552 unidirectional tape and cured per manufacturer’s specifications. ASTM D 6415 ILT strength values ranging between 37.7 MPa (5.5 ksi) and 94.6 MPa (13.7 ksi) were reported with a coefficient of variation higher than 26%. Similarly, typical high-quality IM7/8552 ASTM D 6415 CB specimens were tested in fatigue in [
8] and showed large variation in fatigue life and correlated poorly with the power-law least-squares fit commonly used for description of the
S–N curves of carbon-epoxy materials. CT scans of the CB specimens tested in [
7,
8] revealed the presence of individual critical voids at ply interfaces that were correlated with the knockdown and large scatter found in the ASTM D 6415 CB strength and ILT CB fatigue life. It is worth noting that a test method that relies on extensive CT measurement may not be suitable for efficient characterization.
Another method relevant to the assessment of the ILT strength is ASTM D 7291 [
9], which applies a tensile force normal to the plane of the composite laminate using adhesively bonded thick metal end-tabs. It was noted in the ASTM Standard D 7291 that through-thickness strength results using this method will, in general, not be comparable to ASTM D 6415 since ASTM D 7291 subjects a relatively large volume of material to an almost uniform stress field, while ASTM D 6415 subjects a small volume of material to a non-uniform stress field. Also, characterization of ILT strength using ASTM D 7291 is perhaps even more challenging than ASTM D 6415 as the failure could occur not in the composite material but at the bond lines between the composite and the metal end-tabs used to transfer the load to the composite.
Many of the challenges in standard testing of composite materials, including the difficulties mentioned previously in measurement of the ILT strength, stem from their inherent anisotropy and heterogeneous nature. Historically, standard practices for assessment of material stress–strain constitutive relations and strength properties have been based on resistance strain gauge measurements [
10]. As a strain gauge measures the average strain over the gauge area, the requirement to achieve uniform strain distribution within the gauge area imposes constraints on the test configuration and test specimen design. Furthermore, standard test methods typically rely on the assumption of uniform stress distribution over the entire specimen cross-section for derivation of simple closed-form expressions used in stress and strength calculation. In the case of anisotropic composite materials, such simplifying assumptions may not be valid nor easy to satisfy. Similarly, material heterogeneities, including manufacturing defects common to composites, might act as stress raisers and lead to inaccurate and non-conservative strength calculation using standard closed-form approximations, which are only applicable to homogenous and pristine material.
In contrast, non-standard characterization methods using non-contact full-field measurement methods, such as the digital image correlation (DIC) techniques, do not require uniform and homogeneous strain fields, which enables additional flexibility compared to conventional strain gauge methods [
11]. In particular, inverse methods based on full-field deformation measurement have emerged as attractive alternative methods for accurate characterization of composites using non-standard test setups, enabling measurement of matrix-dominated non-linear properties and extraction of multiple material parameters from a single experiment [
12,
13,
14,
15]. Among strategies developed to solve the inverse problem of determining the material constitutive parameters using the full field information, the finite element model updating (FEMU) method has been the most common approach [
15,
16,
17,
18], and the virtual fields method (VFM) the most notable alternative [
19,
20,
21,
22,
23]. Improvement in digital camera resolution has also led to a recent interest in using the DIC technique for observation and characterization of interlaminar bond line failures. For example, a consumer digital camera was used in [
24] for full-field measurement of deformation within the thin epoxy bond lines in single lap joints with thick aluminum adherends. Researchers have shown that high-resolution DIC measurement of crack tip separation in bonded joints can be used for direct characterization of the cohesive laws in thin adhesive layers [
25,
26,
27].
Taking advantage of the added flexibility from high-resolution full-field DIC measurements, a methodology using unidirectional open-hole compression (OHC) specimens is proposed in this work and investigated as an alternative to assessing interlaminar tensile strength and fatigue properties, with the potential to alleviate the challenges previously mentioned using ASTM D6415 and ASTM D7291 standard tests. Under compression loading, transverse tensile stress concentrations aligned with the loading direction develop around the hole in OHC coupons away from test fixture grips, as opposed to stress concentrations typically located at specimen tabs in ASTM D7291. OHC test specimens used in this work were sliced from flat thick unidirectional panels, allowing development of through-thickness tensile stress concentration. Porosity is much easier to control in flat panels, as opposed to strong susceptibility to porosity defects in the radius area of the curved panels typically used for machining ASTM D6415 coupons. Upon further compressive loading in OHC coupons, consistent delamination failure under interlaminar transverse tension was observed, provided that holes were free of drilling damage. Full-field DIC strain data were used in combination with a finite element model updating (FEMU) method for inverse identification of the four elastic constants characterizing the orthotropic composite material under plane stress conditions, allowing simultaneous assessment of stress–strain and strength properties. The method was used for characterization of generic carbon/epoxy tape and fabric materials and validated by comparing with results from standard test methods and previously validated non-standard test methods. The method was also extended to fatigue loading for assessment of ILT S–N curves.
2. Open-Hole Compression Testing
OHC specimens used in this work are machined from thick unidirectional panels, as illustrated in
Figure 1. Unidirectional panels made from carbon/epoxy IM7/8552 tape prepreg material, a generic carbon/epoxy tape prepreg material, and a generic carbon/epoxy fabric prepreg material were considered in this work. All panels were cured per manufacturer’s specifications. IM7/8552 unidirectional panels were fabricated from a stack of 72 prepreg plies with a cured ply thickness of 178 μm (0.007 in) resulting in a total panel thickness of approximately 12.8 mm (0.5 in). The coupon dimensions for the IM7/8552 specimens are 80.8 × 12.8 × 1.02 mm (3.18 × 0.5 × 0.04 in), in the fiber, out-of-plane, and transverse directions, respectively. After machining the specimens, a 6.35 mm (0.25 in) diameter hole is drilled at the center on the test specimens, as illustrated in
Figure 1. In order to minimize drilling damage, the holes were machined using high-quality diamond dust-coated drill bits and a Plexiglas backing plate. A smaller diameter drill was employed first, and the pre-hole was then enlarged to its final diameter using a 6.35 mm (0.25 in) diameter drill bit.
The specimens are placed in a modified SACMA SRM/Boeing ASTM D695 test fixture, which uses a Plexiglas plate to provide lateral support and prevent buckling while allowing for digital image correlation (DIC)-based measurement of the surface deformation. The test setup is illustrated in
Figure 2 showing a unidirectional OHC test specimen installed in the test fixture including the anti-buckling Plexiglas plates. One of the two cameras used for DIC monitoring of surface deformation is also visible in the foreground in
Figure 2. A servohydraulic load frame was used for quasi-static loading of the test specimen at a 0.021 mm/s (0.05 in/min) crosshead displacement rate until specimen failure.
The DIC strain assessment is based on quantifying locations of a random texture on specimen surface [
28].
Figure 3 shows such an example of random texture, also referred to as speckle pattern, created on the surface of an OHC test specimen using black and white spray paints.
A 16-megapixel stereo camera system is used to generate a sequence of images while the specimen is subject to loading. A sequence of about 20 DIC images taken throughout specimen loading was used for FEMU characterization. The angle between the two cameras was 20 degrees, and two LED-based illumination sources were used. The light sources were placed such that light reflection on the Plexiglas plate was as limited as possible.
Figure 3 shows an example of DIC speckle image with no visible light reflection. Correlated solution image acquisition software VIC-Snap [
29] was used for DIC data acquisition and synchronization with load data from the testing machine. The VIC-3D software [
29] was used to determine the 3D positions during deformation by tracking the gray value pattern in small subsets throughout the acquired stereo image sequence. Further, 45 × 45 pixel subsets were used for DIC analysis of the OHC specimens over an approximately 38 mm × 10 mm (1.5 × 0.4 in) rectangular region of interest, as illustrated in
Figure 3. The displacement data were obtained on 9-pixel centers, resulting in about 15,000 data points per load cases. The displacement fields obtained in this manner were then numerically differentiated using the strain computation algorithm in the VIC-3D software [
28,
29] to compute the Lagrangian surface strain tensor components. Quality of the subset patterns, as well as proper selection of the analysis parameters, were verified similarly to details provided in Reference [
30].
It is worth noting that 3D DIC measurements were used in this work, despite using only in-plane strain components for inverse characterization in the FEMU approach. One of the most prominent reason for using 3D DIC measurement instead of 2D DIC was verification that the anti-buckling Plexiglas plates were working as intended.
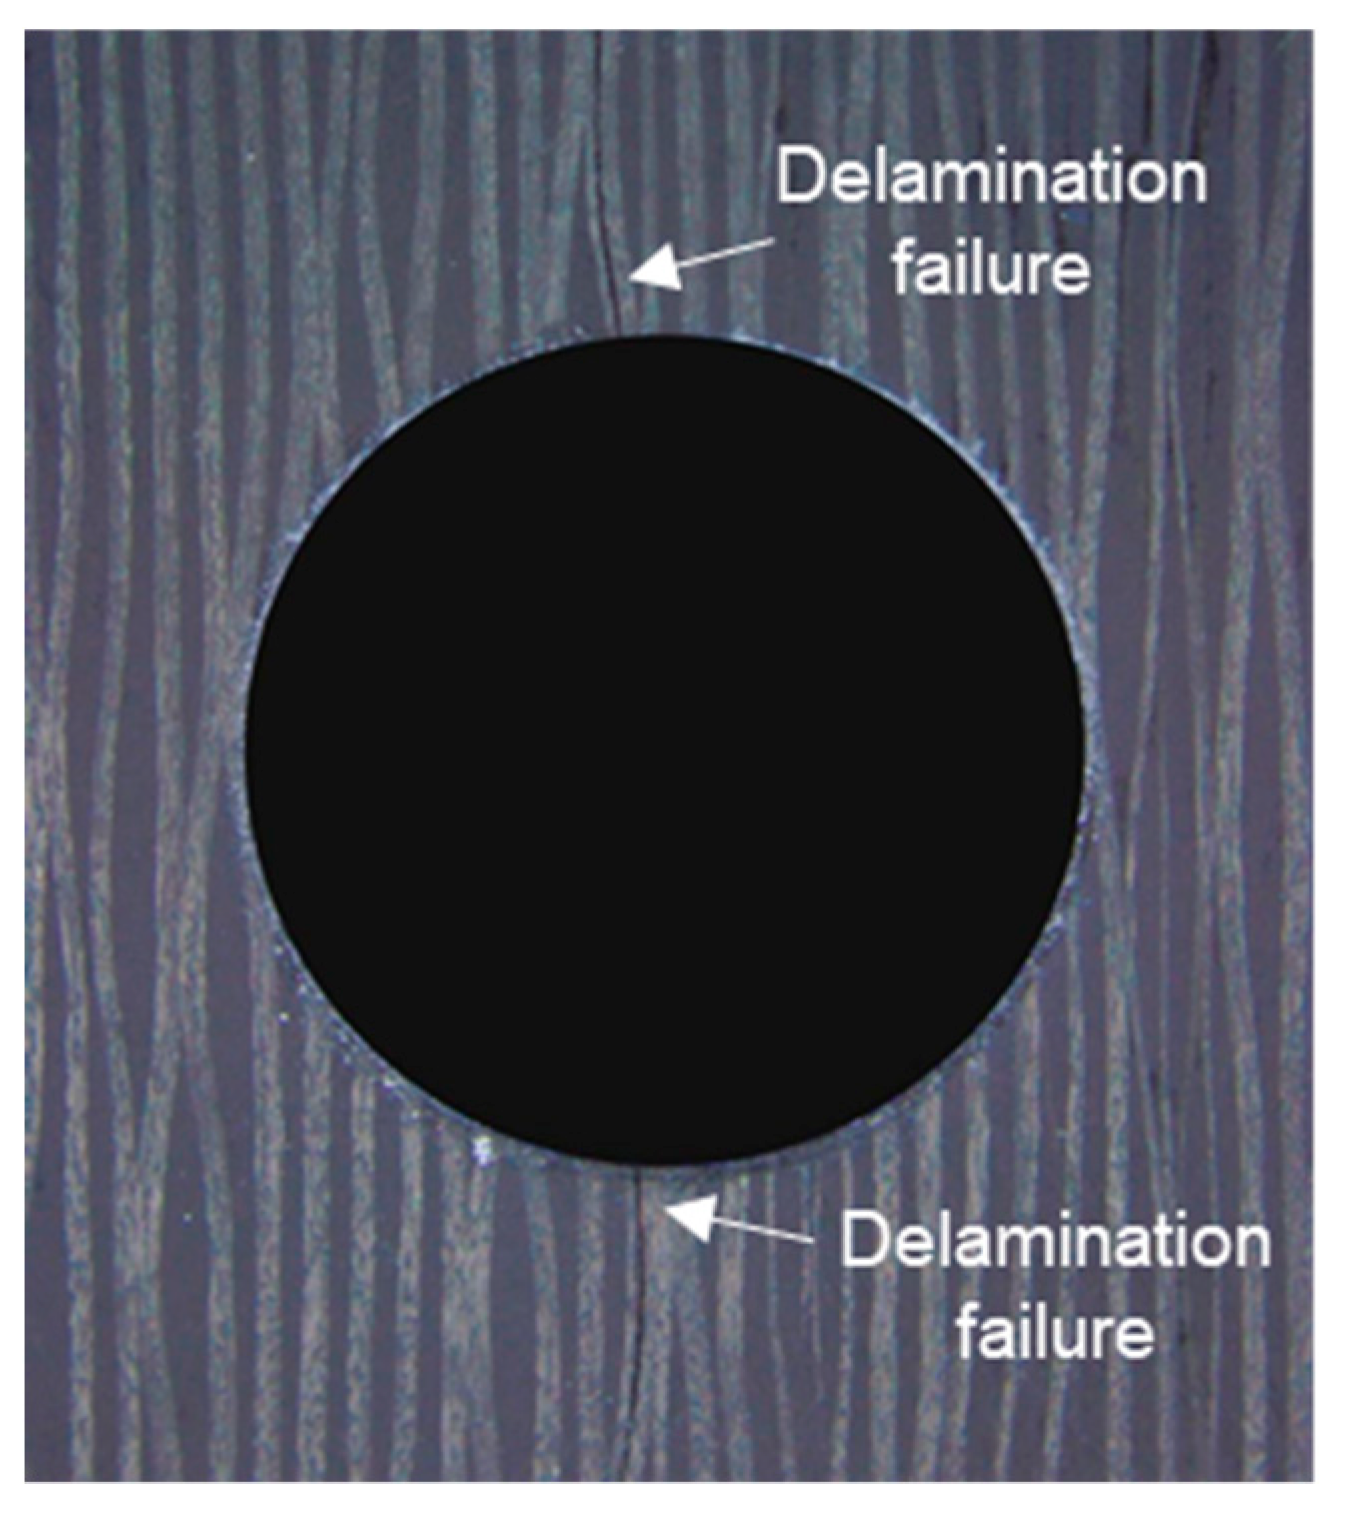
Under compression loading, ILT stresses develop at the 12 and 6 o’clock locations around the hole and initiate delamination failure. After initiation, delamination progresses unstably towards the specimen extremities. The OHC coupon is oriented along the vertical loading direction, as shown in
Figure 2.
Figure 4a shows an example of interlaminar normal strain distribution on the surface of a unidirectional IM7/8552 OHC specimen measured prior to failure using the DIC technique and showing ILT strain concentrations around the hole.
Figure 4b shows the delamination failure that initiates upon further loading at the 12 and 6 o’clock locations due to interlaminar tension.
Figure 5 shows the full-field DIC strain data measured in a generic composite fabric OHC specimen considered in this work, with contour plots for the interlaminar normal
ε33, fiber-direction normal
ε11, and interlaminar shear strain
γ13 fields, respectively. Due to small specimen thickness compared to the other dimensions and relative out-of-plane compliance of the anti-buckling device, deformation of the OHC coupons can be considered under a plane-stress approximation.
As shown in
Figure 5, the longitudinal and shear strains at the 12 and 6 o’clock locations are several orders of magnitude lower than the maximum through-thickness tensile (ILT) strains, validating the assumption of ILT delamination failure under pure mode I conditions. It is worth noting that a concentration of longitudinal fiber-direction compressive stresses also develops at the three and nine o’clock locations, as well as interlaminar shear stresses. Alternate failure modes, including fiber-direction compressive failure and interlaminar shear failure, could occur depending on the combination of material constitutive anisotropy, material strength properties, and coupon geometry. However, both for the IM7/8552 tape, generic carbon/epoxy tape, and carbon/epoxy fabric materials considered in this work, delamination failure at the 12 and 6 o’clock locations always occurred before any other failure mode was observed (except in presence of drill damage, as discussed later in
Section 5).
3. Methodology
3.1. Measurement of ILT Strength
A relationship between the peak load measured at failure using the testing machine load cell and the maximum ILT stress in the specimen is needed for assessment of the material ILT strength. In standard testing, the common design constraint of uniform stress distribution over the specimen cross-section allows using convenient closed-form relations for recovery of the maximum stress at failure.
It is worth noting that the maximum stress concentration factor
for a circular hole in an infinite anisotropic plate subjected to normal far-field compressive stress can be derived analytically as [
31]:
where
E11 and
E33 are the composite material Young’s moduli in the fiber and thickness direction, respectively.
As shown in Equation (1), the maximum stress concentration factor for a circular hole in an infinite anisotropic plate depends on material properties.
In the OHC unidirectional specimens considered in this work, the width-to-hole-diameter ratio is equal to two (R = 2) and the effect of finite specimen’s width, in addition to the effects of material anisotropy, must be included for evaluation of the stress concentration factor at the hole. To the best of the author’s knowledge, there is no evident analytical closed-form solution for such a problem. However, when material constitutive stress–strain properties are known, the maximum ILT stress at failure can be easily determined from a simple 2D plane stress FE analysis. The stress concentration around the hole occurs far from the test fixture tabs, and it was verified that it was relatively insensitive to specimen boundary conditions for the test coupon geometry considered.
An illustration of the 2D FE mesh used in this work for stress analysis and FEMU inverse characterization is shown in
Figure 6. The FE model is generated for Abaqus FEM analysis and includes about 5000 four-node bilinear 2D plane stress elements CPS4 from Abaqus element library. The total number of nodes is about 5300 and the total number of degrees of freedom is approximately 11,000. A linear elastic homogenized orthotropic material model is used for implicit static stress/displacement analysis using Abaqus standard solver. Mesh refinements are assigned to ensure proper convergence of the stress field around the hole. A mesh sensitivity study showing convergence of the ILT stress field around the hole with mesh refinement is provided in
Appendix A.
Figure 7 shows FE contour plots of the normalized interlaminar normal stress component in the carbon/epoxy tape (
Figure 7a) and carbon/epoxy fabric (
Figure 7b) OHC coupons used in this work. The interlaminar stress is normalized by the far-field longitudinal normal compression stress, which is equal to the applied force divided by the specimen rectangular cross-section area. The two materials have different homogenized orthotropic properties, which result in different values for
calculated using Equation (1), as shown in
Figure 7.
OHC coupons ILT stress concentration factors differ from for an infinite plate since they account for the effect of finite width, for which there is no obvious closed-form solution for anisotropic materials as previously mentioned. In these examples, a maximum ILT stress concentration factor of 0.365 is obtained for the tape material, versus 0.595 for the fabric material. These values can be compared to = 0.24 and = 0.37 for an infinite plate with a circular hole for the tape material and fabric material, respectively.
3.2. Inverse Characterization of Elastic Constants
This work considers a self-sufficient methodology based on DIC strain measurements and finite element model updating (FEMU) allowing simultaneous measurement of the material interlaminar constitutive properties (
E11,
E33,
ν13,
G13) along with the ILT strength. The idea is to take advantage of the full heterogeneous strain field measured on the surface of the OHC specimens, as illustrated in
Figure 5, and evaluate if such data can be used in inverse characterization. At the end of the FEMU procedure, optimized material parameters can be used in an additional FE analysis at failure load for assessment of the ILT strength properties. Such advancement would eliminate reliance on additional tests to determine material constitutive properties, which could be unknown prior to the ILT testing. This DIC data-driven OHC ILT test method does not require prior knowledge of any other additional material properties.
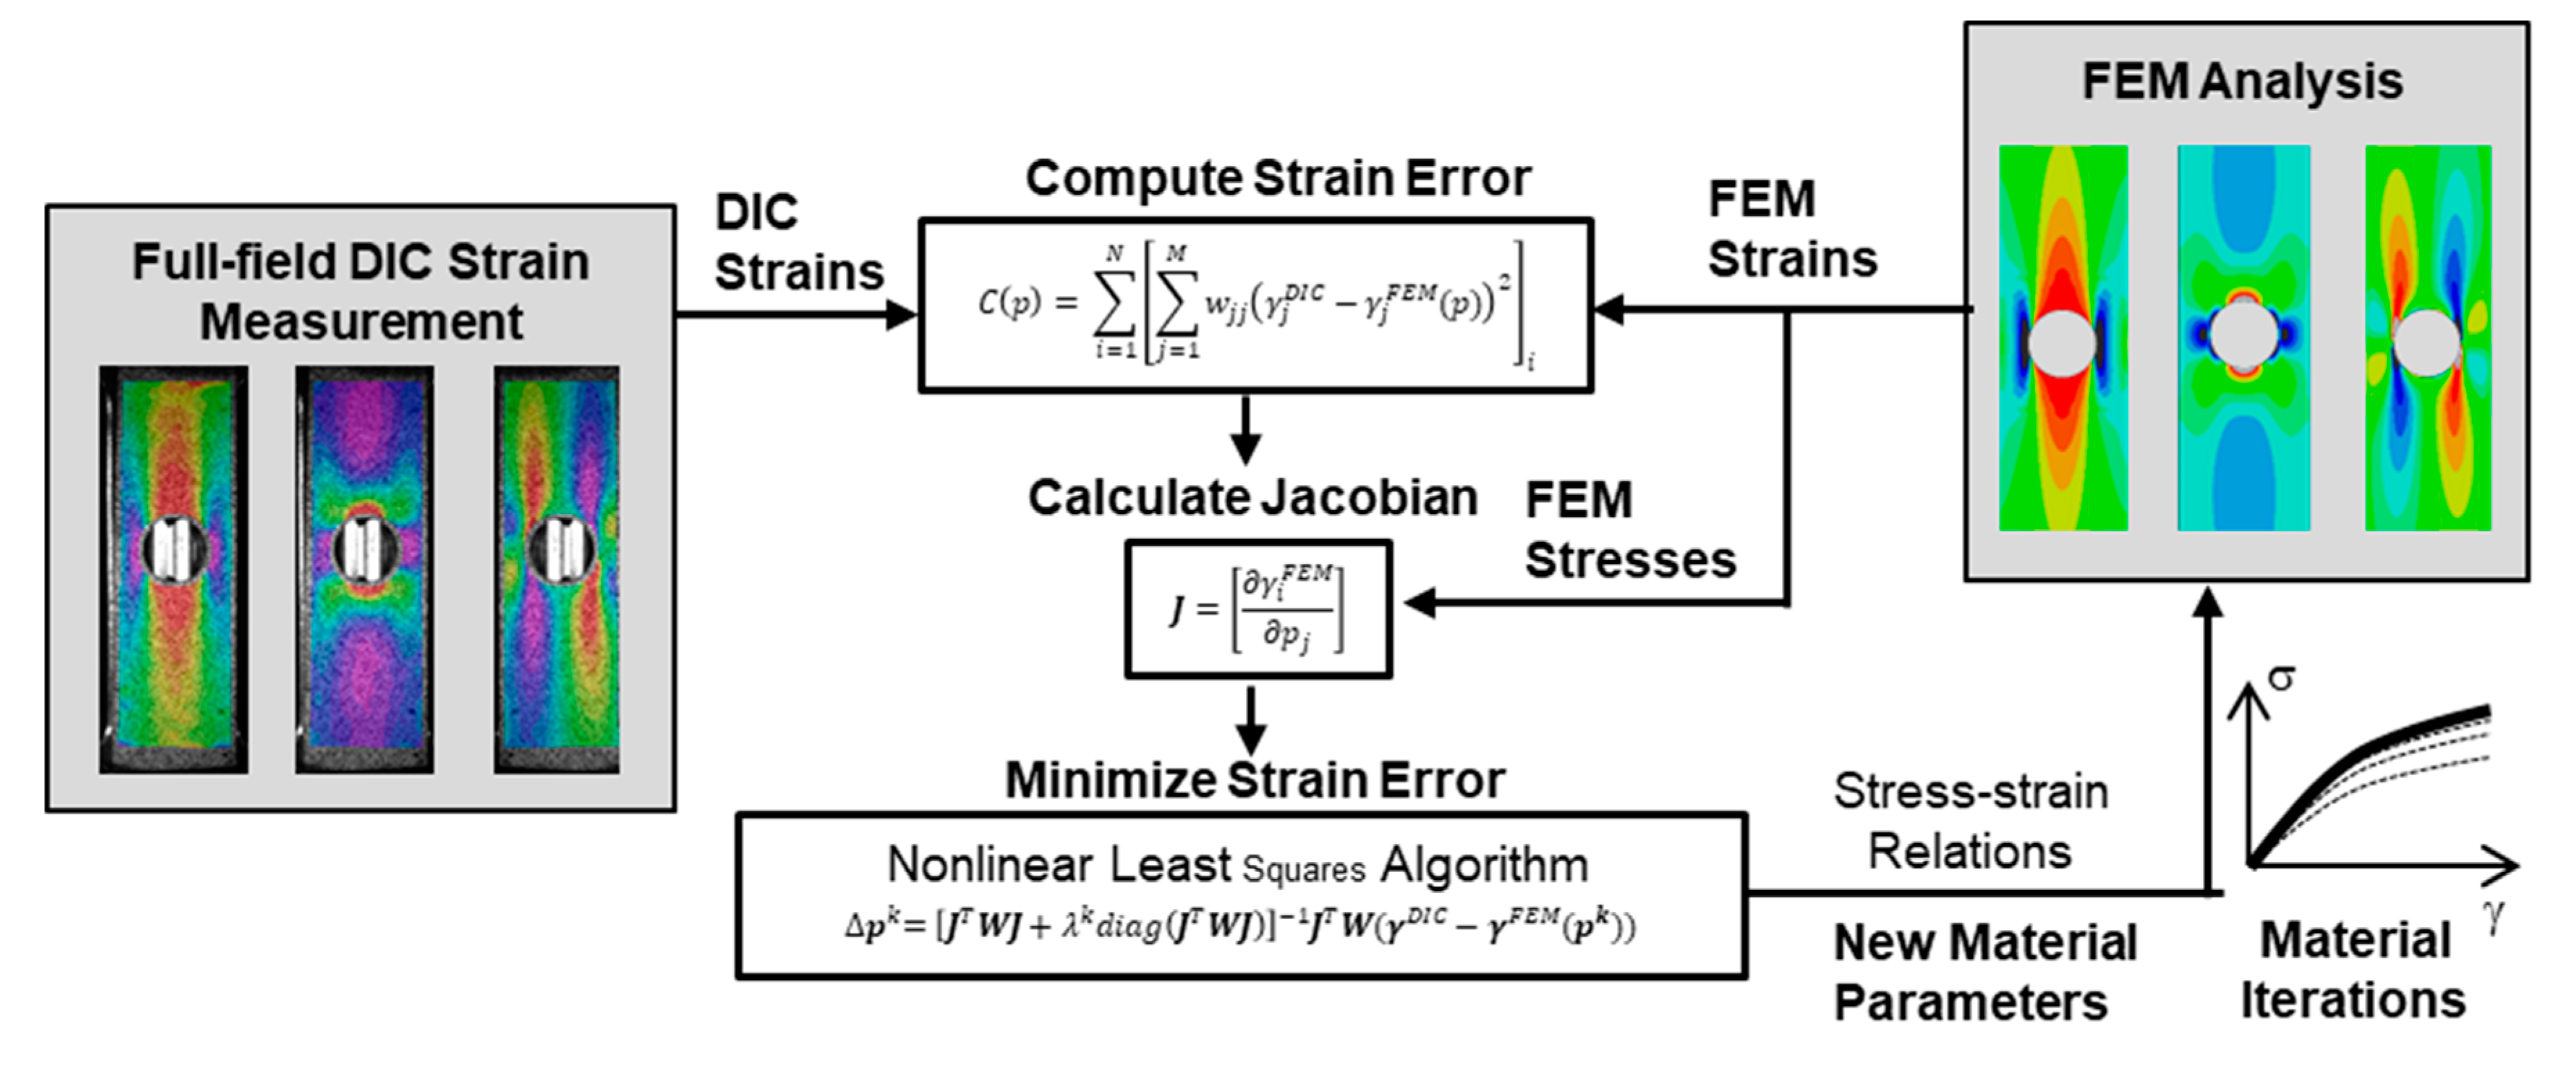
The DIC data-driven FEMU method is based on the nonlinear minimization of the least square error between DIC-measured strain field and FEM-predicted strains by fine-tuning the parameters of the material constitutive model. The concept of the FEMU algorithm using DIC data from unidirectional OHC specimens is shown in
Figure 8.
The FEMU methodology uses a weighted Levenberg–Marquardt optimization algorithm [
32] where the cost function is defined as the weighted root mean square (RMS) error between FEM-computed and DIC-measured surface strains. The reader is referred to Reference [
15] for more details on the optimization methodology, including iterative update of the material parameters using the Levenberg–Marquardt algorithm with smooth damping parameter variation [
33]. Strain field optimization is carried out for about 20 DIC images taken throughout the loading history and up to ultimate failure. The two normal strain components
ε11 and
ε33 and the interlaminar shear strain component
γ13 are considered in the optimization algorithm. The weights used in the cost function are defined at each node as a function of the local and maximum strain quantities:
As shown in Equation (2), the weights are selected, such as more weight is given to data points with large strain values. For longitudinal fiber-direction strains, which are typically very small due to anisotropy of the composite material, a minimum threshold of 25% of the absolute maximum strain value is also used. This definition of weighted residuals is one way of reducing the sensitivity of the optimization algorithm to measurement noise.
Four optimization parameters (E11, E33, ν13, G13) are considered, which are the longitudinal and interlaminar Young’s Moduli, the Poisson’s ratio, and the shear modulus, respectively. A finite difference method is used to compute the sensitivity matrix used in the optimization algorithm. It is worth noting that using finite difference provides an accurate approximation of the sensitivity matrix, which can be also updated at each FEMU iterations, and results in optimum convergence. However, the finite difference approach can also be very costly in terms of computation times since multiple FE analyses are required at each iterations to compute the coefficients of the sensitivity matrix. In this work, 2D FEM is used and the runtime is limited to a few seconds, allowing for efficient use of the finite difference method for computation of the sensitivity matrix.
3.3. Verification and Robustness
The FEMU procedure is first validated using “virtual test” strain field data generated from FE simulation with a set of target material parameters (
,
,
,
). An initial approximation of the material parameters is needed to initiate the non-linear least-squares optimization algorithm. For example,
Figure 9 shows convergence of the parameters to their target values and the reduction of the weighted strain error with the number of iterations starting from an initial approximation of the material parameters is shown in
Figure 10. Results in
Figure 9 have been normalized to one by the respective target parameter. The following initial approximation of the material parameters was used, which corresponds to ± 40% of relative error compared to the target parameters.
Similar convergence for different initial parameters up to 50% of initial relative error was verified.
The FEMU updating procedure is stopped when the relative change in the RMS average of the parameters between two iterations is less than 0.3%. As shown in
Figure 9 and
Figure 10, convergence is quickly achieved and all parameters converge to their desired and expected target value.
Figure 11 shows an example of convergence of the material parameters for the FEMU procedure using experimental DIC strain data from OHC testing of a generic carbon-epoxy unidirectional specimen. The threshold for convergence is reached after nine iterations, however effective convergence is pretty much achieved after two or three iterations, as illustrated. In this example, convergence is illustrated for a 50% maximum relative error in the initial approximation of the interlaminar Young’s Modulus
E33[0] compared to its final converged value after nine iterations
E33[9]. Initial relative error for the other parameters is between 37% and 43%.
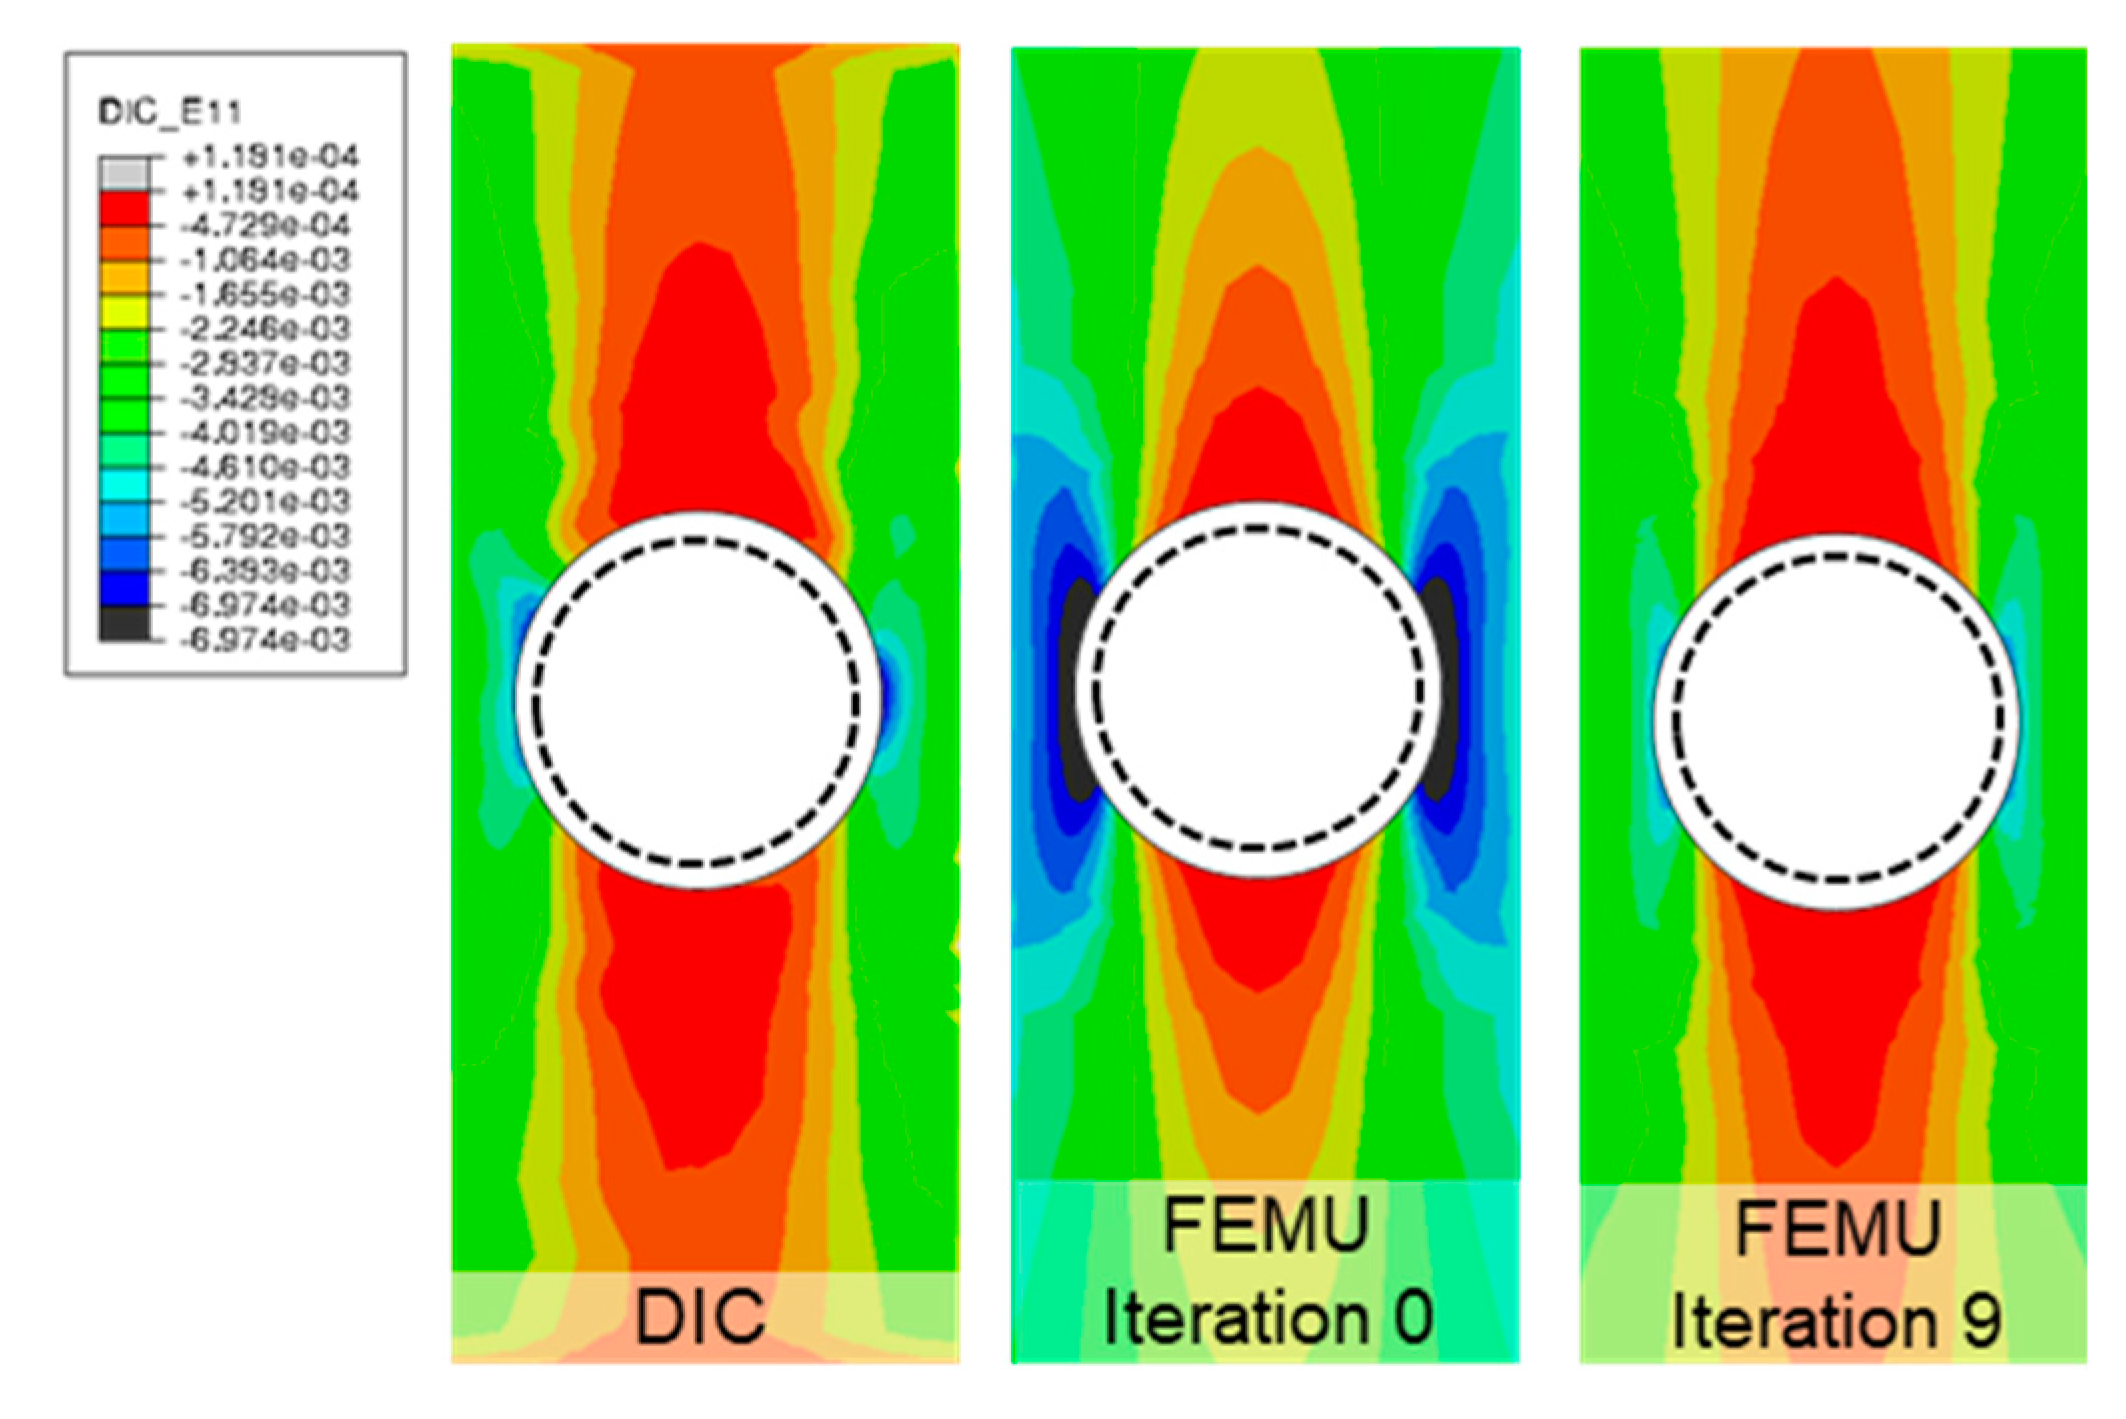
Figure 12 and
Figure 13 compare the DIC-measured longitudinal normal and shear strain fields, respectively, with FEM results at the beginning and end of the updating process. It is worth noting that the DIC strain data have been mapped on the FEM node grid, as part of the FEMU methodology [
15]. Interpolation of the DIC strains on the FEM nodes is realized at the beginning of the FEMU procedure using Abaqus Python scripting interface and the natural neighbor interpolation method implemented in Python function
griddata of module
SciPy.
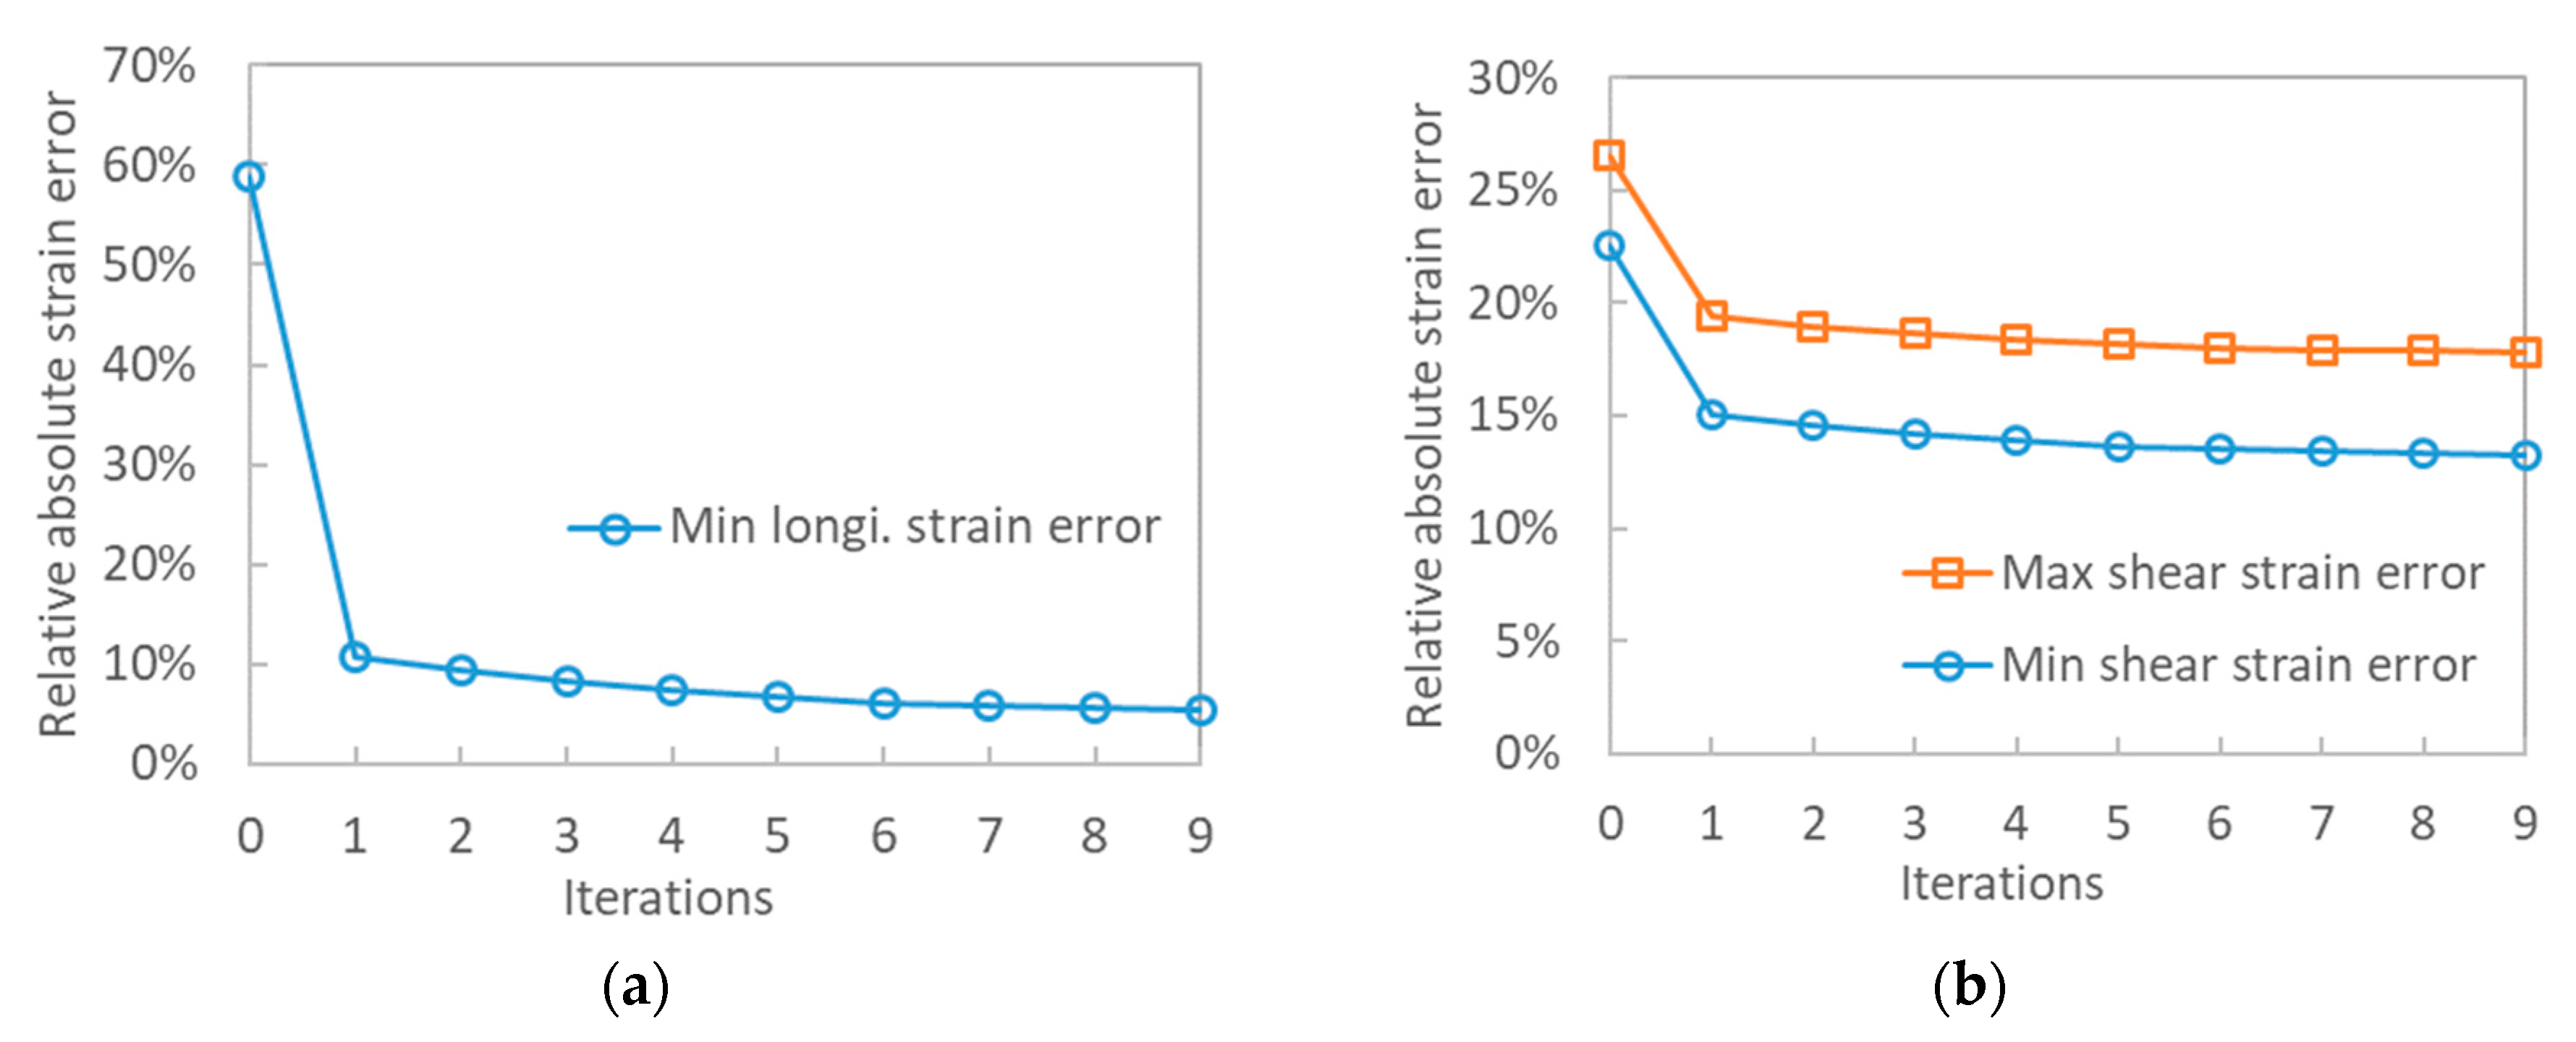
Figure 14a shows the evolution of relative absolute strain error between FEM and DIC during the FEMU iterative procedure for the minimum longitudinal strain value in the contour plots shown in
Figure 12.
Figure 14b shows the relative absolute strain error for both the minimum and maximum shear strain value for the shear strain contour plots shown in
Figure 13.
As shown in
Figure 14, an overall reduction of the point-local strain error is documented for both the longitudinal and shear strains. In particular, a significant reduction of the minimum longitudinal strain error is shown in
Figure 14a.
Figure 14b shows that the converged point-local relative error for both the maximum and minimum shear value is still relatively high at the end of the FEMU process (respectively 17.8% and 13.3%). However, this point-local error should be compared to the total weighted strain error, which takes into account the full-field strain data for all DIC images taken throughout the loading. The weights for calculation of the RMS strain error are defined in Equation (2). The evolution of the total weighted RMS during FEMU iterations is shown in
Figure 15 for the strain data presented in
Figure 12 and
Figure 13. As shown in
Figure 15, the total RMS strain error is reduced from 32% to about 6%. Among the reasons for the difference in error reduction between the point-local strain error and the overall total weighted RMS strain error, small misalignments from the mapping of the DIC data on the FEM grid and local material heterogeneities are worth mentioning. This highlights the importance of A) careful DIC strain mapping and B) using full-field data for FEMU characterization, rather than point-local strain data.
After the FEMU procedure has converged, the material parameters (E11, E33, ν13, G13) are used in a 2D plane stress static FE analysis run at failure load to obtain the maximum interlaminar tensile strength at the 12 and 6 o’clock locations, which corresponds to the ILT strength. For fatigue analysis, the maximum amplitude of the fatigue load is applied and the maximum ILT stress is used to generate the fatigue ILT S–N curves.
5. Discussion
As mentioned previously, hole quality had an impact on failure mode and accuracy of the ILT strength and fatigue measurement, especially in the carbon/epoxy tape specimens tested. It was observed that if the hole is free of drilling damage, OHC specimens exhibit a consistent failure mode that is a crack at 6 and 12 o’clock locations. For example,
Figure 18a shows a cross-sectional CT slice of a specimen with acceptable failure mode obtained from non-destructive CT inspection prior to testing. As illustrated, a clean hole free of significant drilling damage is documented. In such specimens, a symmetrical ILT strain distribution and a consistent ILT failure was observed as shown in
Figure 18b,c.
On the other hand, CT data in
Figure 19a show a specimen with significant drilling damage detected prior to testing.
Figure 19c shows that delamination failure in this specimen initiated at the location of the initial flaw, instead of initiating at the 12 and 6 o’clock location for pristine specimens. In some specimens, surface strain distribution was visibly affected by the drilling damage, as suggested by the asymmetry of ILT strain field shown in
Figure 19b.
The ILT failure mode in the fabric specimens seemed to be less affected by the hole quality, which might be attributed to the micro-structure of the fabric material. ILT failure mode occurred in all fabric OHC coupons despite the drilling damage. Prior to testing, all OHC ILT samples were CT scanned to identify as-manufactured state. Specimens showing significant drilling damage, and inconstant failure modes were discarded. It is worth noting that drilling process can be much improved after this preliminary testing to allow for clean holes.
As indicated in the results listed in
Table 2 and
Table 3, scatter in the extracted ILTS was higher for the fabric material compared to ILTS results for the unidirectional tape material, despite constituent failure mode. In particular, an 18.2% CV in average ILT strength was obtained for the fabric, compared to 7.6% CV tape material. It is worth noting that the sample size for the fabric specimens was four coupons versus five coupons for the tape material, which might contribute to the higher coefficient of variation. The larger scatter might also be attributed to the out-of-plane irregularity inherent to the woven prepreg fabric material. For example,
Figure 20 shows a cross-section image of a fabric OHC specimen after delamination failure under interlaminar tension. As shown in
Figure 16, delamination failure did not initiate exactly at the 6 o’clock and 12 o’clock location and the locus for failure initiation and delamination path seem to be correlated with the out-of-plane waviness of the fabric material. The FE model used in the FEMU procedure assumes a perfectly homogenized orthotropic material for the fabric material. Material heterogeneity and small variations of failure locus due to random out-of-plane irregularities are therefore likely to be the source of larger scatter in ILTS for the fabric material.
6. Conclusions
A new methodology for measurement of interlaminar stress–strain, ILT strength, and ILT fatigue properties of composites based on a unidirectional open-hole compression specimen and DIC-based inverse characterization was proposed and investigated. The method was successfully used for measurement of elastic properties, ILT strength and fatigue, ILT S–N curves of a carbon/epoxy unidirectional tape material, and a carbon/epoxy fabric material. It was found that consistent ILT properties can be measured using the OHC-ILT method although significant effect of the hole drilling damage has been found in tape specimens. ILT failure mode occurred in all fabric OHC coupons despite the drilling damage.
In the authors’ experience, controlling hole quality in unidirectional OHC specimens is easier than controlling porosity in ASTM D 6415 curved-beam specimens or early tab failure in ASTM D7291 testing for ILT properties that typically result in large scatter and underestimated ILT strength properties. Therefore, the OHC-ILT method is a viable alternative methodology for accurate measurement of ILT properties.
The OHC-ILT test does require FE analysis and prior knowledge of material for calculation of the maximum ILT stress at failure, since a closed-form solution is not available and the stress concentration factor depends on material properties. This work showed that the OHC-ILT test can be combined with DIC measurement of surface deformation and finite element model updating (FEMU) for simultaneous assessment of the elastic material constitutive properties and ILT strength properties. Such self-sufficient methodology was validated using independent measurements of the elastic constitutive properties obtained through other existing test methods. Simultaneous measurement of multiple properties could significantly accelerate material characterization, which currently suffers from the lack of efficient and cost-effective qualification.
Another advantage from simultaneous measurement of strength and elastic properties is that potential variability in constitutive properties between individual coupons is taken into account in an “average” sense and decoupled from other sources of variability in stress measurement, which might lead to more accurate assessment of strength properties. Furthermore, there is a practical interest in using an open-hole test specimen for material characterization, since open-hole laminate coupons are typically used for verification of failure criteria and failure models used in progressive damage and failure analysis. Constitutive properties of composites measured using standard tests might be coupon or test configuration dependent. Such dependency is oftentimes overlooked, which might delay the development and implementation of most advanced failure models for composites that rely on accurate material characterization.


