Digital Image Correlation Applications in Composite Automated Manufacturing, Inspection, and Testing


Department of Mechanical, Industrial & Aerospace Engineering, Concordia Center for Composites (CONCOM), Concordia University, Research Center for High Performance Polymer and Composite Systems (CREPEC), Montreal, QC H3G 1M8, Canada
*
Authors to whom correspondence should be addressed.
Appl. Sci. 2019, 9(13), 2719; https://doi.org/10.3390/app9132719
Submission received: 15 March 2019
/
Revised: 20 June 2019
/
Accepted: 26 June 2019
/
Published: 5 July 2019
(This article belongs to the Special Issue Advances in Digital Image Correlation (DIC))
Abstract
:Since its advent in the 1970s, digital image correlation (DIC) applications have been rapidly growing in different engineering fields including composite material testing and analysis. DIC combined with a stereo camera system offers full-field measurements of three-dimensional shapes, deformations (i.e., in-plane and out-of-plane deformations), and surface strains, which are of most interest in many structural testing applications. DIC systems have been used in many conventional structural testing applications in composite structures. However, DIC applications in automated composite manufacturing and inspection are scarce. There are challenges in inspection of a composite ply during automated manufacturing of composites and in measuring transient strain during in-situ manufacturing of thermoplastic composites. This article presents methodologies using DIC techniques to address these challenges. First, a few case studies where DIC was used in composite structural testing are presented, followed by development of new applications for DIC in composite manufacturing and inspection.
1. Introduction
First conceived in the early 1970s, digital image correlation (DIC) is a technique that captures images of an object of interest and delivers full-field measurements on the object of interest using image analysis. Formerly, DIC was used for measuring deformations and strains on a planar object subjected mainly to in-plane loadings. This was referred to as two-dimensional (2D) DIC, which to date remains an important technique for 2D deformations and strain measurements in material testing [1,2,3,4,5,6,7,8,9,10]. However, nonplanar objects subjected to out-of-plane loading and deformations are mostly unavoidable in practice. In the 1990s, 2D DIC was extended to three-dimensional (3D) measurements through stereovision systems [11,12,13]. Referred to as 3D DIC, the system consists of two or more cameras to capture digital images of the object of interest from two or more perspectives.
Using a stereoscopic sensor setup, the position of each point in the area of interest is focused on a specific pixel in the camera plane. If the orientation of the sensors with respect to each other (extrinsic parameters) and the magnifications of the lenses and all imaging parameters (intrinsic parameters) are known, the 3D position of any point in the area of interest can be calculated by applying image correlation algorithms. This process determines the shift and/or rotation and distortion of little facet elements in the reference image [14].
DIC offers full-field and noncontact measurements and has seen significant growth in recent years in different fields including aerospace, microscale measurements, bio materials, etc. The focus of this article is on the application of DIC in manufacturing and inspection of composite materials and structures. First, a few case studies where 3D DIC was used in testing composite structures at Concordia Center for Composites (CONCOM) labs are presented in the “Conventional DIC Applications” section. Subsequently, the development of two new DIC applications in manufacturing and inspecting of composites made by an automated fiber placement (AFP) process is discussed in the “Development of New Applications for DIC” section. One of the challenges for in situ manufacturing of thermoplastic composites using AFP is the formation of residual strain and distortion during manufacturing. However, because of the high temperature and pressure involved in in situ manufacturing of thermoplastic composites, strain gages cannot be used to monitor and measure strain and deformation during manufacturing. In Section 3.1, it is discussed how DIC can be employed to overcome this challenge. Another main challenge in automated manufacturing of composites using AFP is the inspection of the ply during manufacturing. Conventional manual inspection techniques are tedious, time consuming, and operator-dependent. In Section 3.2, methodology and preliminary results are presented for the first time that show how DIC can be used for inspection purposes during AFP.
2. Conventional Digital Image Correlation (DIC) Applications
2.1. DIC- and Gage-Measured Strain Comparisons
Two experiments were designed with the main goal of evaluating the accuracy of DIC strain measurements in composite structures. In both experiments, strain gages were used as a reference to evaluate the strain measurements obtained by DIC.
In the first experiment, buckling under an axial compression test on a composite cylinder was performed, and a stereo DIC system (from LaVision Company, Ypsilanti, MI, USA called “StrainMaster”) was used to measure strains. The composite cylinder was made of graphite/epoxy prepreg using hand layup and autoclave processes. Preparation of the composite cylinder included applying some random speckles on the cylinder’s surface using a spray paint technique (speckle size 3–5 pixels in the area of interest, density about 50%). The test setup is shown in Figure 1. Before the start of the test, calibration of the cameras was performed by moving a standard calibration panel in front of the cameras.
The composite cylinder was loaded through the aluminum end plates at a rate of 1 mm/min, and buckling occurred after 2 min from the start. The axial strain measured by a strain gage installed at the middle of the cylinder and the DIC system before and after buckling occurred is plotted in Figure 2a,b, respectively. As can be seen from Figure 2, before buckling, the measured axial strains by strain gage and the DIC system were in good agreement. However, after buckling occurred (around T = 120 s), the results from two techniques (i.e., strain age vs. DIC) did not agree quantitatively, although they had a similar trend. This could be attributed to the fact that after buckling, due to large local deformation, debonding between the strain gage and composite surface may have occurred. Accuracy for a specific test setup depends on many factors including speckle pattern size and quality, resolution of the camera used, lighting, stereo angle, lens selection, etc. For the setup used in this experiment (5 Megapixel camera system from LaVision, Ypsilanti, MI, USA), the accuracy for measuring the local strain could be expected to be around 200 microstrains [15].
In the second experiment, with the goal of comparing DIC strain measurements with strain gage measurements, an L-shape composite angle was tested under tension using a universal testing machine. The experiment involved large deformations of the composite angle under tension. A unidirectional strain gauge was installed on the outer surface of the composite angle, and a random pattern was created on the composite angle surface using permanent marker (Figure 3).
A stereo DIC system (from Correlated Solutions Company, Irmo, SC, USA called “VIC-3D”) was used to measure strains. The strains measured by both strain gage and DIC are compared in Figure 4. As can be seen, DIC results show an overall good agreement with strain gage results. The deviation between DIC and the strain gage measurements was between 50 to 200 s of the test, which may be due to the large out-of-plane deformation of the composite angle as it was flattened. During the large out-of-plane deformation, the motion of the points was perpendicular to the image plane, which may cause error in DIC results. However, after 200 s of the test, as the L-shape angle flattened, an excellent agreement between DIC results and strain gage results was observed [16].
2.2. Bending and Buckling Analyses of Composite Conical Shells for Helicopter Tail-Boom Applications
2.2.1. Synopsis
In this case study, bucking and bending behaviors of composite conical shells were studied experimentally and theoretically. In the theoretical approach, a first-order shear deformation shell theory was proposed to study buckling and bending behaviors of composite conical shells, and a semi-analytical solution was developed to study buckling under bending of composite conical shells. In the experimental approach, a pure bending test setup was designed and developed to study buckling under bending of composite shells. The setup was equipped with a 3D DIC system to measure three-dimensional deformation and surface strain of the test article. A thermoplastic composite cone, a full-scale section of a helicopter tail-boom, was tested using this setup in pure bending, and the experimental buckling moment was measured, which agreed well with the theoretical one [15].
2.2.2. Experimental Work
Sample manufacturing and preparation: The test article, a composite conical shell, which was a full-scale section of a helicopter tail-boom, was made out of advanced thermoplastic composite material (carbon fiber and poly-ether-ether-ketone (PEEK) with the commercial name of AS4/APC-2 from Cytec Engineered Materials, Anaheim, CA, USA). It was manufactured at National Research Council Canada’s facility in Montreal using an automated fiber placement (AFP) machine on a steel mandrel with an internal heating system (Figure 5).
Preparation of the composite cone for bending tests included applying the end tabs, creating a random pattern (Figure 6a) on the surface of the cone (for strain and deformation measurements using DIC), installing strain gages, and potting the composite cone inside the installation rings (Figure 6c) using low melting temperature point alloy (LMPA) (Figure 6b). The surface of the thermoplastic composite cone was fairly black after manufacturing, and, to have maximum contrast, a white random pattern was applied on the surface of the composite cone using permanent markers by hand. The size of speckles ranged between 3 to 7 pixels with approximately 50% area of interest covered by white speckles. A 3D DIC system from Correlated Solutions, Irmo, SC, USA equipped with two 5 Megapixel cameras (monochrome charge-coupled device (CCD) with 2/3-inch sensor from Point Grey) attached to Schneider 17 mm lenses were used in this experiment, and results were obtained using VIC-3D software.
Test setup: Despite the bending load being the dominant load on conical shells in many applications (e.g., helicopter tail-boom), experimental setups to study bending and buckling behaviors of cylindrical and conical shells under pure bending loads are scarce. In order to study bending and buckling behaviors of conical shells, a pure bending test setup was developed at Concordia Centre for Composites (CONCOM) laboratory (Figure 7). The test setup was equipped with a 3D DIC system that consisted of four cameras to cover the top and front sections of the test article for full-field deformation and strain measurements.
2.2.3. DIC Measurements
The contour plot of the axial strain obtained by the camera pair, looking down at the top surface of the composite cone, just prior to and after buckling is shown in Figure 8a,b, respectively. As can be seen, prior to bucking, while the whole top surface of the cone was under compression, the strain concentration occurred near the small end of the composite cone with the maximum value of 7100 microstrains. This nonuniform strain distribution can be expected because the small end had less stiffness in comparison with the large end of the thermoplastic composite cone. Moreover, from Figure 8a, which shows the strain distribution prior to buckling, one can forecast the possible location of the failure based on the strain accumulation near the small end.
The contour plot of the axial strain obtained by the camera pair, looking to the front side of the composite cone, just prior to the buckling is shown in Figure 9. The purple color shows negative strain (compression) at the top, and the red color represents positive strain (tension) at the bottom of the composite cone. Once more, an axial strain concentration can be seen near the small end (left side of Figure 9) where the failure occurred [15].
2.3. Bending Behavior of Thick-Walled Composite Tubes
2.3.1. Synopsis
In this case study, the bending behavior of thick-walled composite tubes was investigated with focus on the bending stiffness property of tubes. Both theoretical and experimental approaches were considered. The theoretical formulation was developed based on a 3D elasticity theory, and the bending stiffness calculation was validated by pure bending tests performed on thick-walled composite tubes. The pure bending test was shown to be a better alternative test, compared to the conventional three-point and four-point bending tests, to compare the theoretical result with the experiment for validation purposes. This was mainly because the effect of stress concentration at the loading point was less compared to three-point and four-point bending tests, and also the effect of shear was not present in the pure bending test. A 3D DIC system was used during the test of composite tubes to capture deformations and strains of the tubes until failure occurred [16].
2.3.2. Experimental Work
Two thick-walled thermoplastic composite tubes made of Carbon/PEEK material were manufactured using an automated fiber placement (AFP) process and were tested using a homemade pure bending test setup.
Sample manufacturing and preparation: The test articles were made of 0.25-inch wide unidirectional tows supplied by TenCate Advanced Composites Company, Nijverdal, Netherlands (commercial name “Cetex TC1200 PEEK AS4”). The tows were made of a semicrystalline poly-ether-ether-ketone thermoplastic resin with unidirectional carbon fibers. The tows were fed into a robotic-type AFP machine available at CONCOM for manufacturing two thick-walled composite tubes (Figure 10). The first tube was made with a laminate stacking sequence of (i.e., the inner layer and out layer are oriented at and degrees with respect to the tube axis), while the second tube had a laminate stacking sequence of , which means it was made of layers alternatively arranged. Both tubes had the same dimensions (outer diameter, inner diameter, thickness, and length ).
For preparation of the tubes for measuring deformations and strains using DIC, the surface of the tubes should have a random pattern with good contrast to be recognized by the cameras. The surface of the thermoplastic tubes were quite black, and, therefore, a white random pattern was applied on the specimens’ surface by hand using permanent markers (Figure 11). According to the recommendation of the DIC system’s manufacturer (Correlated Solutions, Irmo, SC, USA), the size of the speckles was kept between 3 to 5 pixels with about 50% density. Two 5 Megapixel CCD cameras (from Point Grey with 2/3-inch sensor) attached with Schneider 17 mm lenses were used in this experiment.
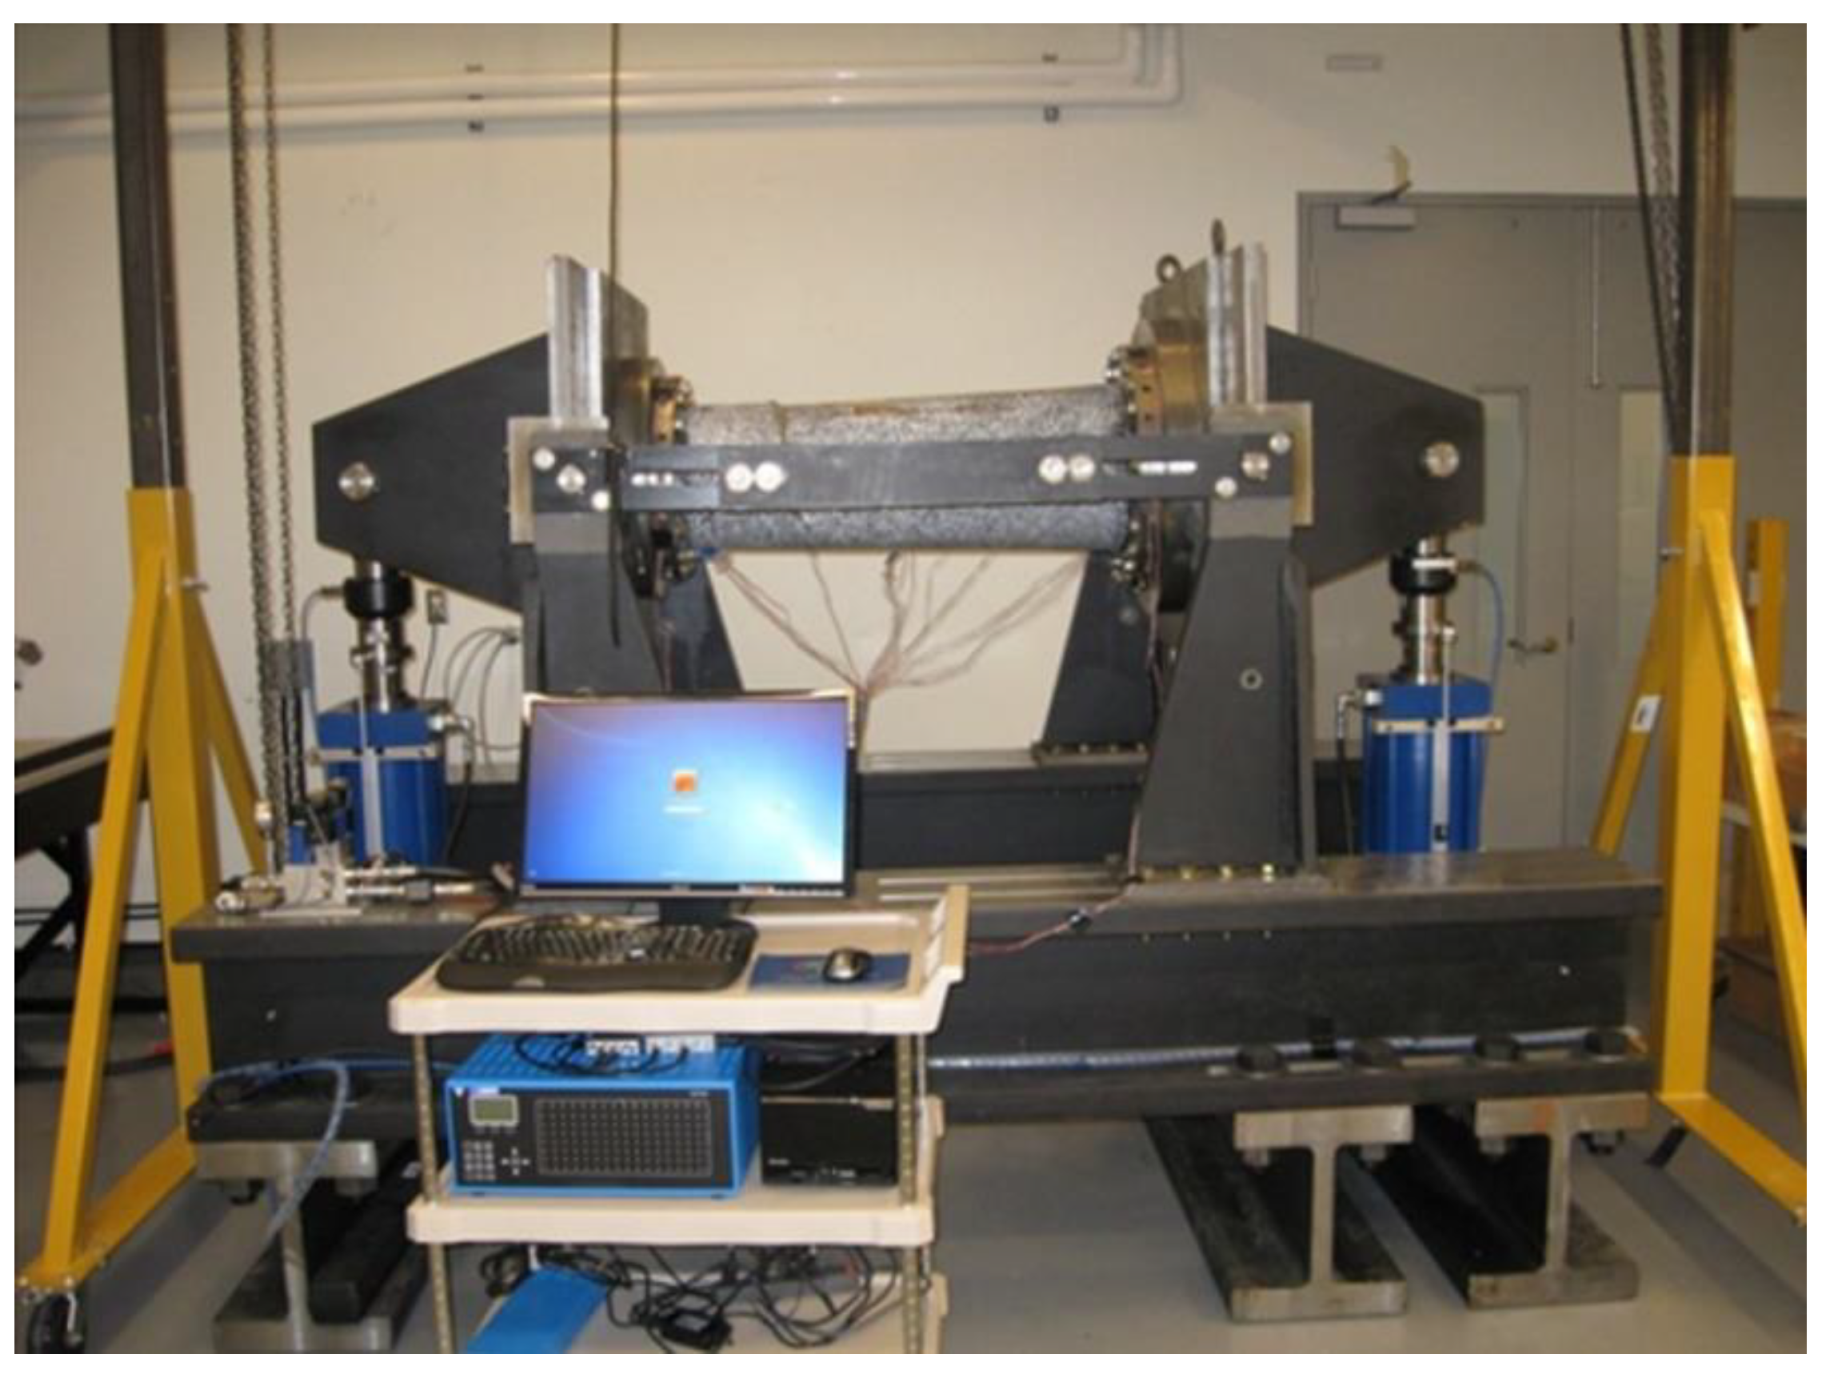
Test setup: The bending test was carried out using a homemade pure bending test setup as shown in Figure 12. The DIC system used for the test consisted of two pairs of cameras; one pair was placed in front of the tube, and the other pair was mounted above the test setup. After calibrating the cameras and connecting all the gages to the data acquisition system, the test was started. End forces applied by two hydraulic cylinders were converted to the bending moment using two moment arms at two ends of the setup. The bending moments were transferred to the tube ends through a set of inner and outer rings filled with low melting temperature point alloy (LMPA) for smooth transition of the load to the tube. In order to prevent tube failure inside the rings, tabs were added at the tube ends.
2.3.3. DIC Measurements
Deformation results: Axial and hoop deformations captured by the first camera pair located in front of the tube is shown in Figure 13 just before failure. Axial deformation results (Figure 13a) showed that in the upper part of the tube, due to compression, both sides were moved towards each other, while in the lower part, due to tension, they were moved away from each other. This indicates the smooth transition of the load to the test article. The tube deformation in the hoop direction (Figure 13b) revealed that maximum deflection happened at the mid length of the tube, closer to the neutral axis than the lower part. This is an interesting finding and can be explained due to ovalization of the tube cross section.
Axial and out-of-plane deformations captured by the second pair of cameras looking to the top of the tube is shown in Figure 14 just before and after failure. Figure 14a shows that both sides of the tube deformed toward each other, and the axial deformation was zero at the middle of the tube. Maximum out-of-plane deflection before failure occurred at the mid length of the tube as expected (Figure 14c). After failure, the location of the maximum deformation moved below the failure zone (Figure 14d).
Strain results:Figure 15 shows the contour plot of the axial strain just before and after failure measured by the first camera pair located in front of the tube. While it shows a negative axial strain in the upper part and a positive axial strain in the lower part, the absolute strain values at the top and the bottom side of the tube were nearly the same as expected in a typical pure bending case (Figure 15a). After failure (Figure 15b), the maximum axial strain was accumulated at the failure location on the upper right side of the tube.
Axial strain measured by the second camera pair located above the tube, just before and after failure, is shown in Figure 15. Just before failure (Figure 15c), the maximum compressive strain was measured at the top position in the tube, and one could expect the failure location by observing the accumulation of the axial strain at the right side of the tube (purple color pattern). After failure (Figure 15d), the maximum compressive strain accumulated around the crack that propagated parallel to the fiber directions of the outer layer [16]. The failure mechanism can be explained by a kink band mechanism [17,18]. Kink bands develop under compression stress due to plastic microbuckling induced by nonlinear matrix deformation. It is a complex phenomenon affected by many factors like fiber failure, matrix failure, fiber–matrix interface strength, etc. For the tube under bending (Figure 15c), delamination started under the outer layers (i.e., layer) at the top right side of the tube accompanied with matrix cracking causing the delaminated layers to slide parallel to the fiber direction (i.e., 25 degrees) towards the neutral axis of the tube. This sliding motion removes the constraint on the fibers in the layer below (i.e., −25 degrees) causing microbuckling [16].
3. Development of New Applications for DIC
3.1. Strain and Deformation Measurements for In-situ Manufacturing of Thermoplastic Composites Using Automated Fiber Placement (AFP)
3.1.1. Synopsis
Advanced thermoplastic composites are of special interest because of their superior properties, such as unlimited shelf life, high-fracture toughness, high-temperature resistance, high-fatigue performance, etc., in comparison to thermoset composites. They have a unique possibility to be manufactured in-situ using the automated fiber placement (AFP) process, which eliminates the need for a secondary process leading to significant savings in cost and energy. In AFP processing of thermoplastic composites, heat and pressure are applied simultaneously to a composite tow to achieve in-situ consolidation of the part. The composite tow consisting of fiber and a matrix is passed by a high-temperature heat source that melts the matrix and is placed by a pressure roller on the tool. High processing temperature and pressure combined with fast layup speed involved in AFP cause transient strain development, which in turn leads to residual stresses in the thermoplastic composites.
Conventional strain gages cannot be used to measure transient strain during AFP of thermoplastic composites because they are processed at a high temperature and pressure. In this case study, 3D DIC was proposed to measure full-field transient strain and deformation of the thermoplastic composite tow during manufacturing [19].
3.1.2. Experimental Work
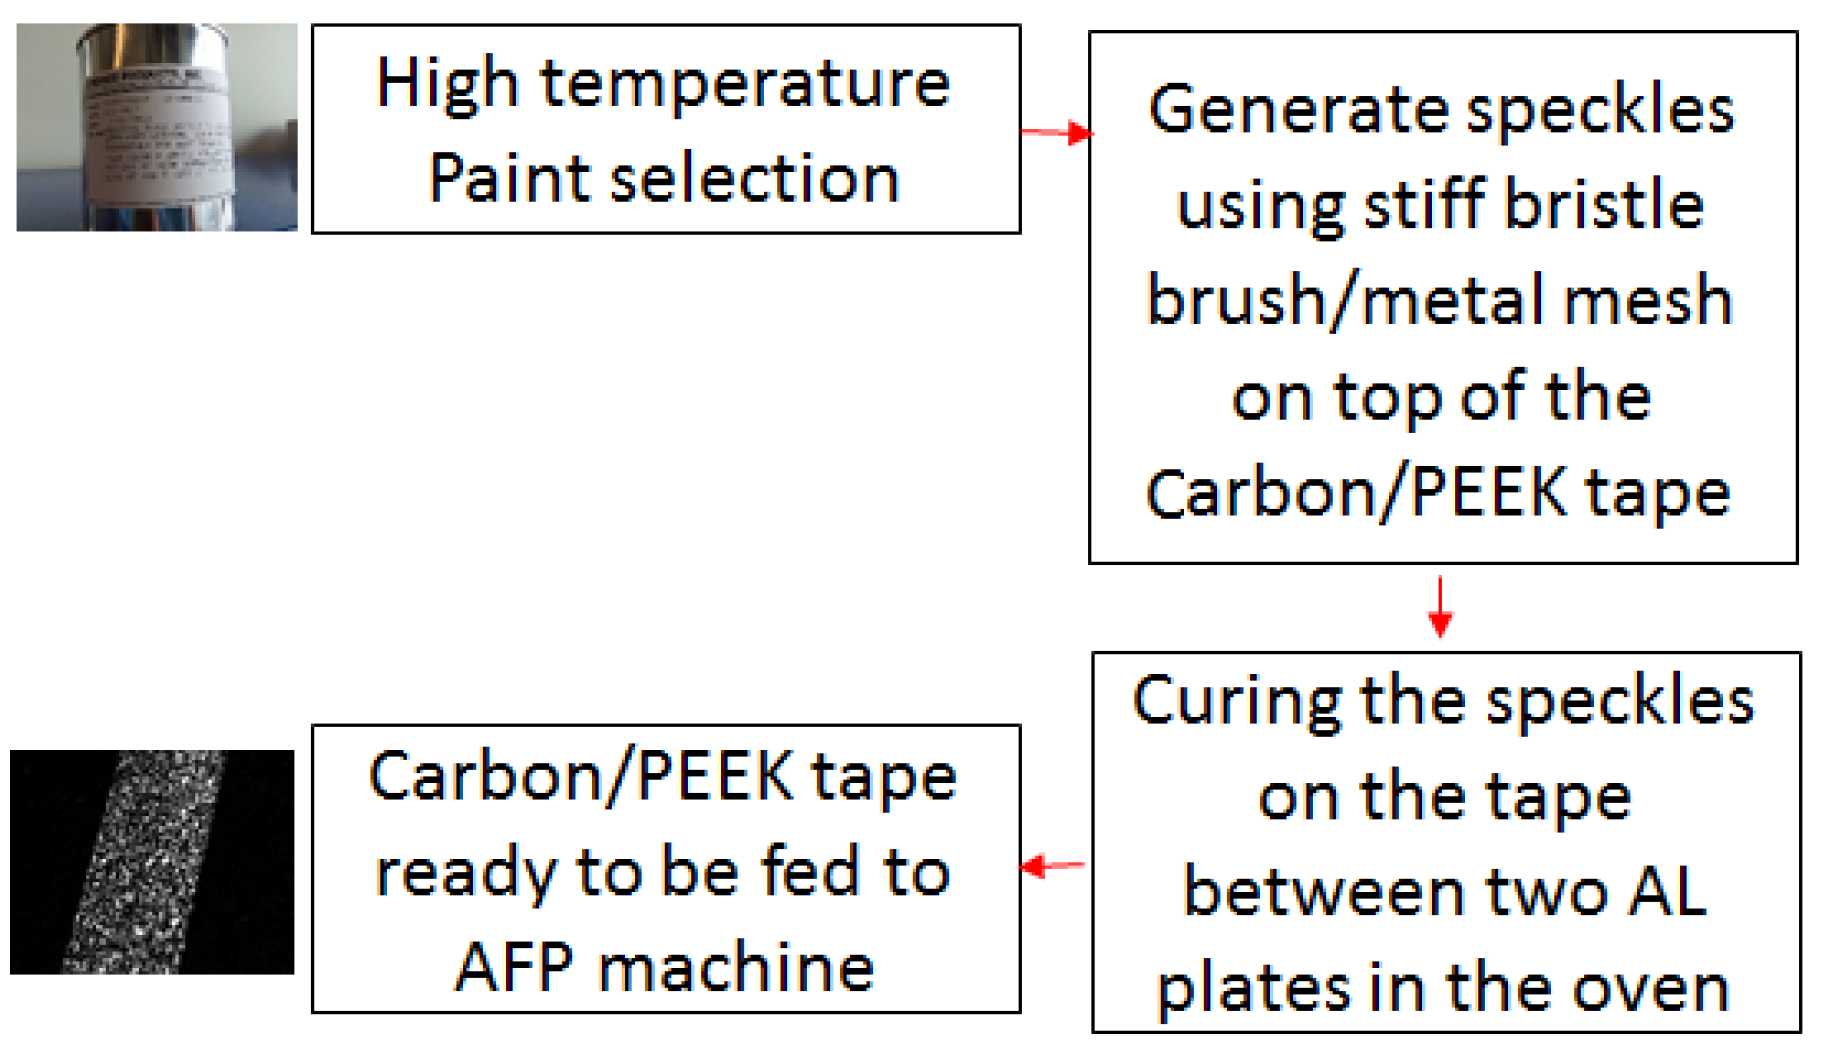
To employ DIC it is necessary to have a random pattern with correctly sized speckles and good density on the composite tow surface. The main challenge in using DIC for strain measurement in this application was to make a fine speckle pattern that can survive high temperatures and pressures, as the composite tow would pass the heat source and would go under the compaction roller during AFP. Furthermore, due to the small width of the tow (one quarter of an inch), creating a correctly sized random pattern was a challenging task. In order to overcome these challenges, a high-temperature, abrasion-resistant paint with the commercial name of CP4040-S1 of Aremco Products, Valley Cottage, NY, USA was used. The random pattern was generated using a stiff bristle brush and a mesh metal sheet. The paint particles were thrown to the composite tow from a distance of 8 inches using the bristle brush, while a fine metal mesh was used to make sure only small paint particles could reach the tow surface. The size of speckles ranged from 0.1 mm (5 pixels) to 0.4 mm. The pattern density was about 50% (i.e., overall area covered by paint was about 50%). The random pattern was created on a composite tow made of carbon fiber and a poly-ether-ether-ketone (PEEK) matrix (commercial name TenCate Cetex TC1200). After applying the pattern on the tow, the paint was cured in an oven between two aluminum sheets for 45 min (Figure 16).
The test setup including the AFP head and the DIC system is shown in Figure 17. The cameras were distanced 8 inches apart and were positioned at about a 40-degree stereo angle. The light source was placed between the cameras to create proper lighting conditions without creating reflections in the pictures. As AFP laid the composite tows, a series of photos were taken at a rate of 10 pictures per second, providing the opportunity to measure transient strain from the initial layup moment until it was cooled down to about room temperature.
3.1.3. DIC Measurements
Strain measurement: To measure strain build-up after AFP layup, it was assumed that, at the moment in which the tow passed under the roller and came out, there was no strain along the width and length of the tow. For DIC calculations, VIC-3D software from Correlated Solutions, Irmo, SC, USA was used, and a subset size of 35 pixels (i.e., spatial resolution 35 × 35 of pixels) with a step size (i.e., the spacing of the points that are analyzed during correlation) of 3 pixels was selected. A default value of 0.05 for the pixel confidence margin was set for the matching process using the covariance matrix of the correlation equation in VIC-3D software. Two 5 Megapixel cameras (monochrome CCD with 2/3-inch sensor from Point Grey) attached to Schneider 28 mm lenses were used in this experiment. Figure 18a shows this moment; three virtual strain gages were located right after the roller within a distance of 0.5 inches from one another along the length of the tow. Just after passing the roller, strains started building up, as it is shown in Figure 18b, due to heat dissipation to the environment and the substrate. As one can expect, the highest lateral strain build up was measured at Gage 1 (about 10,000 microstrains) since the temperature drop (ΔT) would be higher than other two gages (i.e., Gage 2 and 3) after 60 s of layup. Fast strain build up can be seen in all three gages during the first 10 s after layup, which emphasizes the significance of the first few seconds just after the AFP head laid down the composite tow. It should be mentioned that in Figure 18b, photos that were taken between 5–7 s after layup were removed from the strain analysis because during this interval the AFP head moved up after finishing the layup, causing tool vibration and consequently creating errors in the photos [19].
Deformation measurement: To measure lateral deformation after AFP layup, the initial condition (T = 0 s) was assumed to be at the moment the tow came out under the roller (i.e., all deformations were zero at this time). The distribution of lateral deformation across the width and along the length of the tow is shown in Figure 19a after 60 s of layup. As it can be seen, due to cooling of the composite tow, contraction happened across the width of the tow (i.e., positive deformation (red color) on the left side and negative deformation (purple color) on the right side of the tow). Along the length of the tow, the lateral deformation gradient was higher at the top side of the tow because it was closer to the AFP head, considering the layup direction, and consequently had higher temperature drop out (ΔT). The variation of lateral deformation during the first 60 s after layup across the width of the tow in Section 1 (see Figure 19a) is plotted in Figure 19b. As can be seen, lateral deformation increased rapidly during the first 10 s after layup and stabilized after about 60 s [19].
3.2. Inspection of the Automated Fiber Placement (AFP) Process
3.2.1. Synopsis
Automated fiber placement (AFP) is a composite manufacturing technique in which narrow composite tows consisting of fiber and matrix are pushed against the tool surface. While the head of the AFP machine is laying the composite tows, heat and pressure are applied simultaneously to consolidate the laminate [20]. AFP is a relatively new manufacturing technique, and development of inspection techniques to assure the quality of the composite part during the layup process is the topic of ongoing research and development activities in the aerospace industry. Possible defects needed to be inspected are gaps and overlaps between tows, deviation in fiber orientation and tow location, etc. [21]. Gaps and overlaps are common defects during AFP, and several studies [22,23,24] have shown that they reduce structural performance of composite laminates. Figure 20 shows a typical gap between two composite tows. The gaps between tows make resin-rich areas and cause failure initiation points, while overlaps create thickness build-up and cause out-of-plane waviness in adjacent plies and stress concentration. In this study, the possibility of using DIC for inspecting gaps and overlaps was considered, and proof of concept was demonstrated.
3.2.2. Proof of Concept
In order to use DIC to measure the three-dimensional shape of composite tows and consequently extract any gaps and/or overlaps between them, there should be enough random textures with contrast on the tows and the substrate layer. However, composite tows made of carbon fiber and epoxy are usually black, and they are laid on a black substrate as well (previous layer), which makes it difficult, if not impossible, for DIC to capture the features of interest (i.e., gaps and overlaps). Applying a random pattern using a marker or spray paint is not a viable option during inspection, as it takes time to apply the pattern and it might introduce unwanted materials (i.e., marker ink) between composite layers. In order to overcome this difficulty, a random pattern was projected by a digital projector to a set of tows laid on a composite substrate. A regular digital projector (i.e., a computer data projector) with full High-definition (1920 × 1080 pixels) capability was placed at the correct distance from the sample under inspection and projected a pattern to the area of interest. Since only the shape measurement was of interest in this application, and not strain measurement, there was no need for a pattern to be actually applied on the surface, and only projection served this purpose. After a regular calibration procedure, stereo DIC was used to evaluate the possibility of detecting the tows’ locations and the gap between them.
Figure 21a shows a flat panel consisting of a substrate layer and two tows, in which a random pattern was projected on them. As it can be seen from Figure 21c, DIC was able to detect both tows’ locations and the gap between the ends of the tows. However, the shape measurement results were relatively noisy for inspection purposes; the main reason for this was due to the quality of the projected pattern on the composite layer. Since a digital projector was used, not only were the white dots projected, but the black background of the pattern was also projected, which made the pattern look noisy on the composite layer. It was suggested that an optical projector should be used instead of a digital projector to avoid this issue.
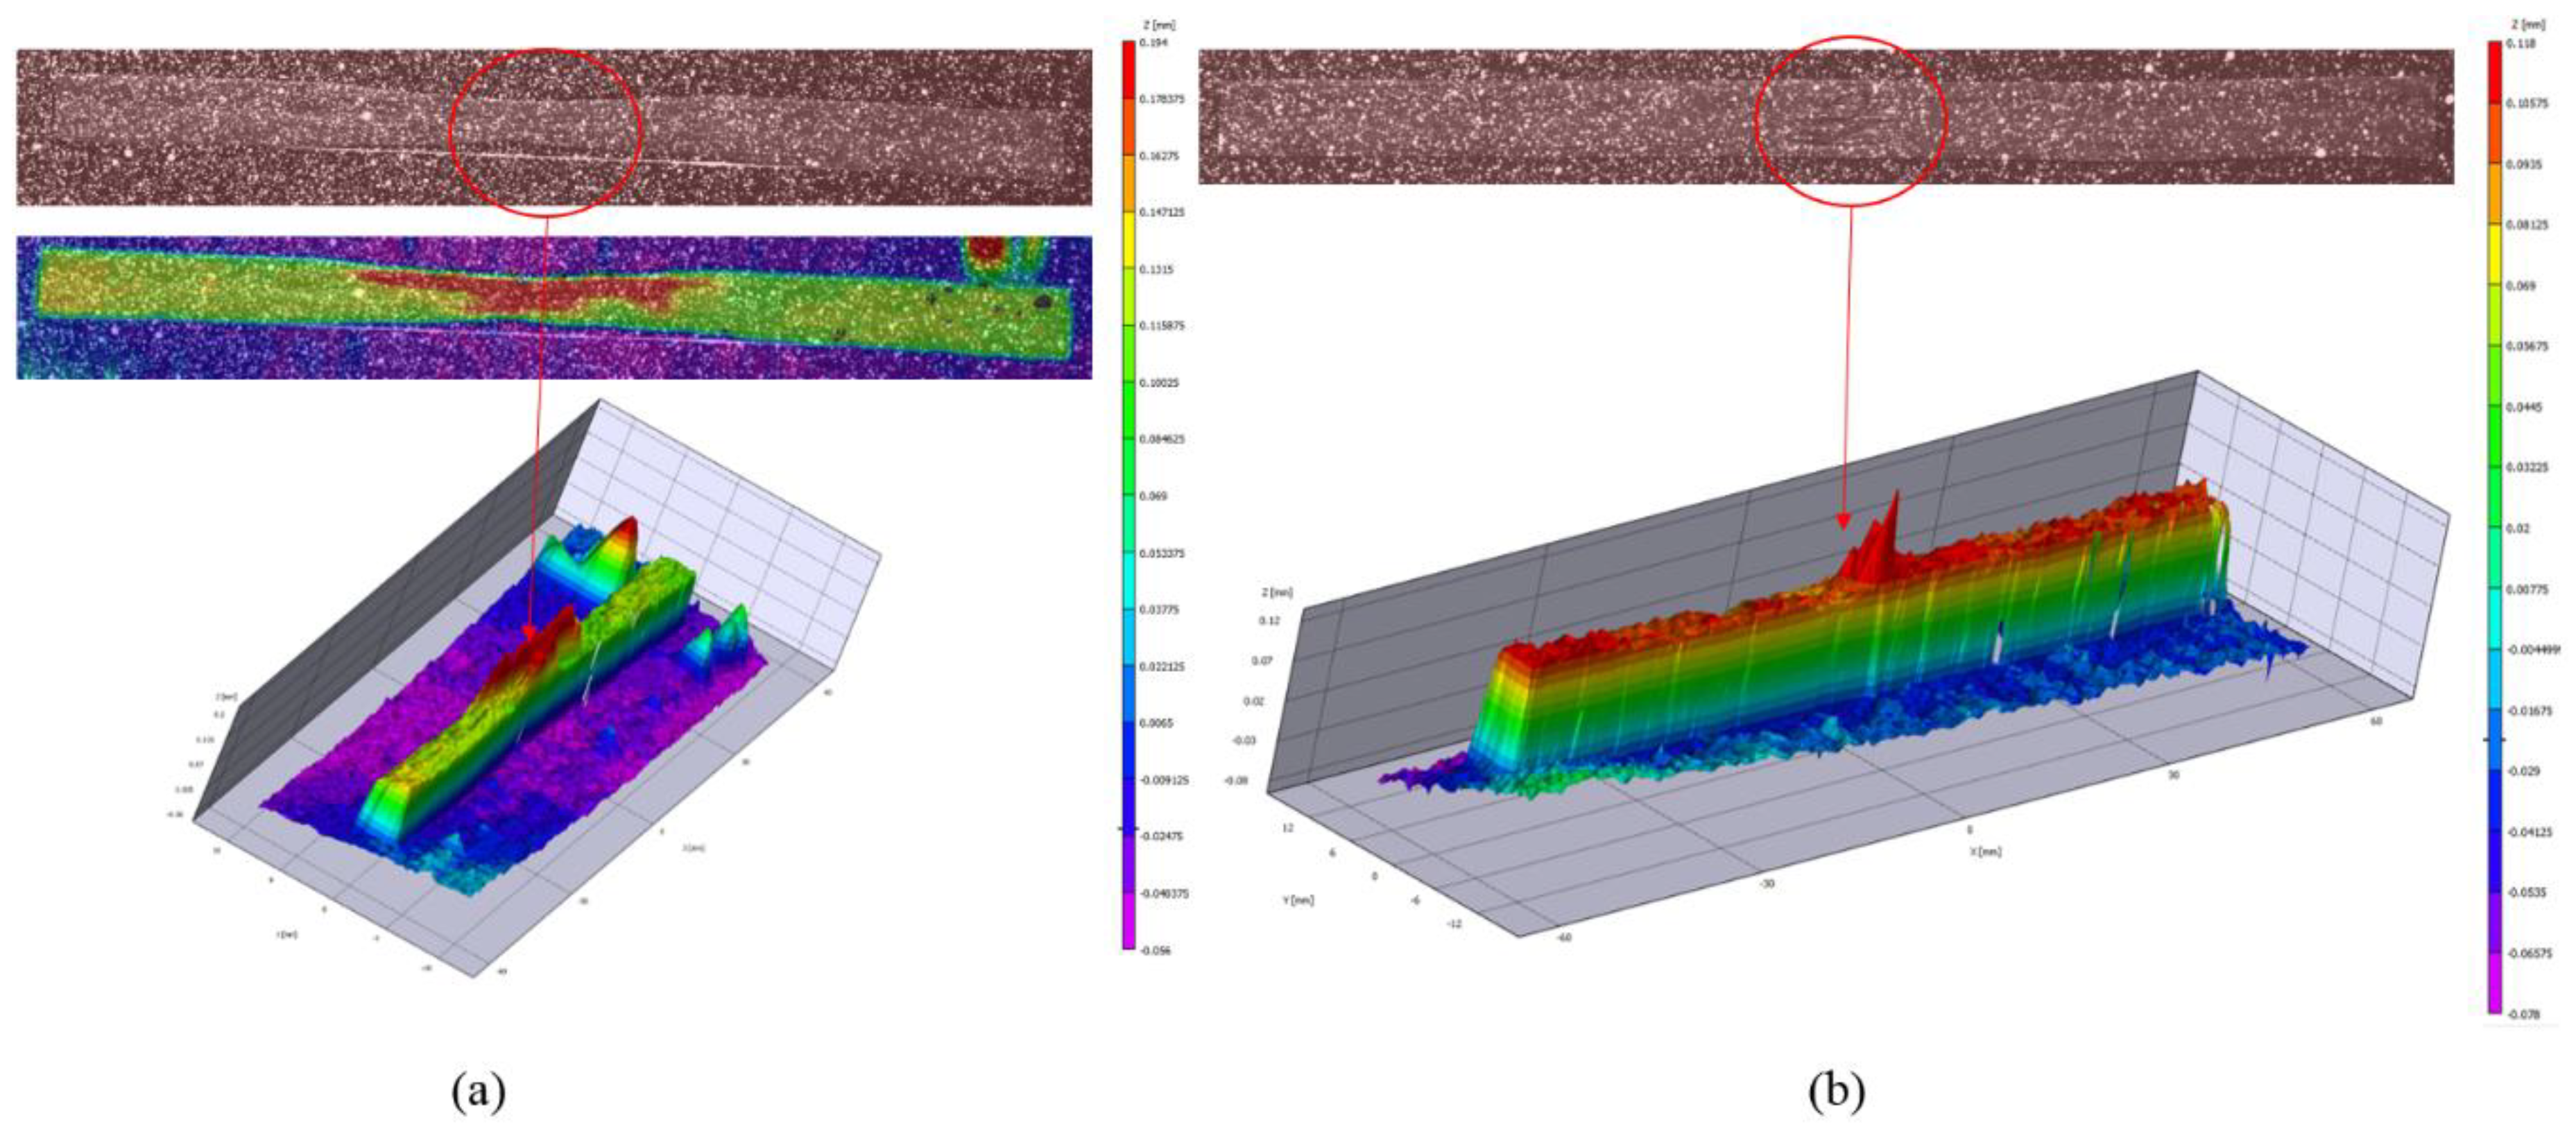
In order to evaluate the potential of DIC to measure gaps and overlaps, assumed to be of good quality and have a random pattern, a spray technique was used to generate white dots randomly on a gap and overlap features between two tows, as shown in Figure 22. For evaluation purposes, two tows were placed in such a way to create a continuously decreasing gap, and the other two tows were placed to simulate continuously decreasing overlap. It was found that, if a good random pattern quality is used, gaps and overlaps as small as about 0.4 mm could be detected.
Furthermore, other types of defects beside gaps and overlap that might occur during AFP can be detected and inspected by DIC. Two examples of such defects are twisted tow and damaged tow. During AFP and when the AFP head places composite tows on the substrate, the placed tows might get twisted, which is referred to as a twisted tow defect, or the fibers might be pulled out by the compaction roller creating a damaged tow defect. Figure 23 shows the capability of DIC to detect such defects.
4. Discussion
Application of 3D DIC in composite structural testing is presented using a few case studies performed at CONCOM over the years. It was found that the accuracy of the technique in strain measurements of composites was limited to about 200 microstrains; therefore, it may not be an appropriate measurement technique in structural testing in which few strains are expected.
Furthermore, two new applications for DIC in manufacturing and inspecting of thermoplastic composites developed at CONCOM are presented, and proof of concepts are demonstrated. It was demonstrated that 3D DIC can be used for composite ply inspection during manufacturing using AFP. However, an optical random pattern projector needs to be developed for this purpose.
Author Contributions
F.S.: conceptualization, methodology, investigation, analysis, writing—original draft preparation, and editing. S.V.H.: conceptualization, methodology, writing—review and editing, supervision, project administration, and funding acquisition.
Funding
The financial contributions from the Natural Sciences and Engineering Research Council of Canada (NSERC), industrial chair on Automated Composites, Center for Research in Polymers and Composites (CREPEC), Bell Helicopter Textron Canada Ltd., Bombardier Aerospace, and Concordia University are appreciated.
Conflicts of Interest
The authors declare no conflict of interest. The funders had no role in the design of the study; in the collection, analyses, or interpretation of data; in the writing of the manuscript, or in the decision to publish the results.
References
- Anuta, P.E. Spatial registration of multispectral and multitemporal digital imagery using fast fourier transform techniques. IEEE Trans. Geosci. Electron. 1970, 8, 353–368. [Google Scholar] [CrossRef]
- Keating, T.J.; Wolf, P.R.; Scarpace, F.L. An improved method of digital image correlation. Photogramm. Eng. Remote Sens. 1975, 41, 993–1002. [Google Scholar]
- Peters, W.H.; Ranson, W.F. Digital imaging techniques in experimental stress analysis. Opt. Eng. 1982, 21, 427. [Google Scholar] [CrossRef]
- Sutton, M.A.; Wolters, W.J.; Peters, W.H.; Ranson, W.F.; McNeill, S.R. Determination of displacements using an improved digital correlation method. Image Vision Comput. 1983, 1, 133. [Google Scholar] [CrossRef]
- Sutton, M.A.; Cheng, M.; Peters, W.H.; Chao, Y.J.; McNeill, S.R. Application of an optimized digital image correlation method to planar deformation analysis. Image Vision Comput. 1986, 4, 143–150. [Google Scholar] [CrossRef]
- Schreier, H.W.; Braasch, J.; Sutton, M.A. Systematic errors in digital image correlation caused by intensity interpolation. Opt. Eng. 2000, 39, 2915. [Google Scholar] [CrossRef]
- Lu, H.; Cary, P.D. Deformation measurements by digital image correlation: Implementation of a second-order displacement gradient. Exp. Mech. 2000, 40, 393–400, 2000. [Google Scholar] [CrossRef]
- Haddadi, H.; Belhabib, S. Use of rigid-body motion for the investigation and estimation of the measurement errors related to digital image correlation technique. Opt. Lasers Eng. 2008, 46, 185–196. [Google Scholar] [CrossRef]
- Tiwari, V.; Sutton, M.; McNeill, S.R. Assessment of high speed imaging systems for 2D and 3D deformation measurements: Methodology development and validation. Exp. Mech. 2007, 47, 561–579. [Google Scholar] [CrossRef]
- Sutton, M.A.; Yan, J.H.; Tiwari, V.; Schreier, H.W.; Orteu, J.J. The effect of out-of-plane motion on 2D and 3D digital image correlation measurements. Opt. Lasers Eng. 2008, 46, 746–757. [Google Scholar] [CrossRef] [Green Version]
- Luo, P.F.; Chao, Y.J.; Sutton, M.A.; Peter III, W.H. Accurate measurement of three-dimensional deformations in deformable and rigid bodies using computer vision. Exp. Mech. 1993, 33, 23–132. [Google Scholar] [CrossRef]
- Luo, P.F.; Chao, Y.J.; Sutton, M.A. Application of stereo vision to three-dimensional deformation analyses in fracture experiments. Opt. Eng. 1994, 33, 981. [Google Scholar] [CrossRef]
- Helm, J.D.; McNeill, S.R.; Sutton, M.A. Improved three-dimensional image correlation for surface displacement measurement. Opt. Eng. 1996, 35, 1911. [Google Scholar] [CrossRef]
- Herbst, C.; Splitthof, K. Basics of 3D Digital Image Correlation; T-Q-400-Basics-3DCORR-002a-EN; Dantec Dynamics GmbH: Ulm, Germany.
- Shadmehri, F. Buckling of Laminated Composite Conical Shells; Theory and Experiment. Ph.D. Thesis, Concordia University, Montreal, QC, Canada, September 2012. [Google Scholar]
- El-Geuchy, M.I. Bending Behavior of Thick-Walled Composite Tubes. Ph.D. Thesis, Concordia University, Montreal, QC, Canada, June 2013. [Google Scholar]
- Patel, J.; Peralta, P. Mechanisms for Kink Band Evolution in Polymer Matrix Composites: A Digital Image Correlation and Finite Element Study. In Proceeding of the ASME 2016 International Mechanical Engineering Congress and Exposition, Phoenix, AZ, USA, November 11–17 2016; ASME: New York, NY, USA, 2016; Volume 9: Mechanics of Solids, Structures and Fluids; NDE, Diagnosis, and Prognosis, p. V009T12A055. [Google Scholar] [CrossRef]
- Nizolek, T.J.; Begley, M.R.; McCabe, R.J.; Avallone, J.T.; Mara, N.A.; Beyerlein, I.J.; Pollock, T.M. Strain fields induced by kink band propagation in cunb nanolaminate composites. Acta Mater. 2017, 133, 303–315. [Google Scholar] [CrossRef]
- Ghayoor, H.; Shadmehri, F.; Hoa, S.V. Development of experimental technique for measuring strain and deformation in manufacturing of thermoplastic composites using automated fiber placement (AFP). In Proceedings of the International SAMPE Technical Conference, Seattle, WA, USA, 2–5 June 2014. [Google Scholar]
- Hoa, S.V. Principles of the Manufacturing of Composite Materials, 2nd ed.; Destech Publications, Inc.: Lancaster, PA, USA, 2009. [Google Scholar]
- Shadmehri, F.; Ioachim, O.; Pahud, O.; Brunel, J.-E.; Landry, A.; Hoa, S.V.; Hojjati, M. Laser-Vision Inspection System for Automated Fiber Placement (AFP) Process. In Proceedings of the 20th International Conference on Composite Materials (ICCM20), Copenhagen, Denmark, 19–24 July 2015. [Google Scholar]
- Blom, A.W. Structural performance of fiber-placed, variable-stiffness composite conical and cylindrical shells. Ph.D. Thesis, Delft University of Technology, Delft, The Netherlands, November 2010. [Google Scholar]
- Croft, K.; Lessard, L.; Pasini, D.; Hojjati, M.; Chen, J.; Yousefpour, A. Experimental study of the effect of automated fiber placement induced defects on performance of composite laminates. Composites Part A 2011, 42, 484–491. [Google Scholar] [CrossRef] [Green Version]
- Cai, X. Determination of Process Parameters for the Manufacturing of Thermoplastic Composite Cones using Automated Fiber Placement. Master’s Thesis, Concordia University, Montreal, QC, Canada, June 2012. [Google Scholar]
Figure 1.
Axial buckling test setup for evaluating DIC [15].
Figure 1.
Axial buckling test setup for evaluating DIC [15].

Figure 2.
Comparison between strain gage and DIC (a) before and (b) after buckling [15].
Figure 2.
Comparison between strain gage and DIC (a) before and (b) after buckling [15].

Figure 3.
L-shape composite angle with a random pattern and installed strain gage [16].
Figure 3.
L-shape composite angle with a random pattern and installed strain gage [16].

Figure 4.
DIC strain measurement versus strain gage results for L-shape composite angle [16].
Figure 4.
DIC strain measurement versus strain gage results for L-shape composite angle [16].

Figure 5.
Six-axis automated fiber placement (AFP) machine with a steel mandrel (courtesy of National Research Council Canada) [15].
Figure 5.
Six-axis automated fiber placement (AFP) machine with a steel mandrel (courtesy of National Research Council Canada) [15].

Figure 6.
Test article preparation: (a) random pattern, (b) low melting temperature point alloy (LMPA), and (c) installation ring [15].
Figure 6.
Test article preparation: (a) random pattern, (b) low melting temperature point alloy (LMPA), and (c) installation ring [15].

Figure 7.
Bending test setup with a composite cone installed for the test [15].
Figure 7.
Bending test setup with a composite cone installed for the test [15].

Figure 8.
Axial strain () obtained by DIC before (a) and after (b) failure (top view) [15].
Figure 8.
Axial strain () obtained by DIC before (a) and after (b) failure (top view) [15].

Figure 9.
Before axial strain failure () obtained by DIC (side view) [15].
Figure 9.
Before axial strain failure () obtained by DIC (side view) [15].

Figure 10.
Manufacturing of the thermoplastic composite tube using AFP [16].
Figure 10.
Manufacturing of the thermoplastic composite tube using AFP [16].

Figure 11.
Random pattern on the surface of the thick composite tube [16].
Figure 11.
Random pattern on the surface of the thick composite tube [16].

Figure 12.
Bending test setup including the DIC system and thick composite tube (after failure) [16].
Figure 12.
Bending test setup including the DIC system and thick composite tube (after failure) [16].

Figure 13.
Deformation of the tube from the front view just before failure: (a) axial deformation u (mm), (b) hoop deformation v (mm) [16].
Figure 13.
Deformation of the tube from the front view just before failure: (a) axial deformation u (mm), (b) hoop deformation v (mm) [16].

Figure 14.
Axial deformation u (mm) just before (a) and after (b) failure. Out-of-plane deformation w (mm) just before (c) and after (d) failure [16].
Figure 14.
Axial deformation u (mm) just before (a) and after (b) failure. Out-of-plane deformation w (mm) just before (c) and after (d) failure [16].

Figure 15.
Axial strain () side view just before (a) and after (b) failure. Axial strain () top view just before (c) and after (d) failure [16].
Figure 15.
Axial strain () side view just before (a) and after (b) failure. Axial strain () top view just before (c) and after (d) failure [16].

Figure 16.
Preparation of carbon/poly-ether-ether-ketone (PEEK) tape with random pattern.

Figure 17.
Setup for strain measurements during AFP manufacturing: (1) AFP head mounted on a robotic arm, (2) hot gas torch, (3) compaction roller, (4) DIC camera system, and (5) halogen lamp [19].
Figure 17.
Setup for strain measurements during AFP manufacturing: (1) AFP head mounted on a robotic arm, (2) hot gas torch, (3) compaction roller, (4) DIC camera system, and (5) halogen lamp [19].

Figure 18.
(a) Virtual gage locations just after layup. (b) Lateral strain variation after layup [19].
Figure 18.
(a) Virtual gage locations just after layup. (b) Lateral strain variation after layup [19].

Figure 19.
(a) Distribution of the lateral deformation along the width and length of the composite tow one minute after layup. (b) Variation of lateral deformation along the width of the composite tow one minute after layup [19].
Figure 19.
(a) Distribution of the lateral deformation along the width and length of the composite tow one minute after layup. (b) Variation of lateral deformation along the width of the composite tow one minute after layup [19].

Figure 20.
Gap size defect.

Figure 21.
(a) Two composite tows on a composite substrate. (b) Random pattern projection. (c) DIC shape measurement results, z-axis represents thickness direction.
Figure 21.
(a) Two composite tows on a composite substrate. (b) Random pattern projection. (c) DIC shape measurement results, z-axis represents thickness direction.

Figure 22.
(a) Overlap between two tow detections. (b) Gap detection, z-axis represents thickness direction.
Figure 22.
(a) Overlap between two tow detections. (b) Gap detection, z-axis represents thickness direction.

Figure 23.
AFP defect detection by DIC: (a) twisted tow and (b) damaged tow.

© 2019 by the authors. Licensee MDPI, Basel, Switzerland. This article is an open access article distributed under the terms and conditions of the Creative Commons Attribution (CC BY) license (http://creativecommons.org/licenses/by/4.0/).
Share and Cite
MDPI and ACS Style
Shadmehri, F.; Hoa, S.V. Digital Image Correlation Applications in Composite Automated Manufacturing, Inspection, and Testing. Appl. Sci. 2019, 9, 2719. https://doi.org/10.3390/app9132719
AMA Style
Shadmehri F, Hoa SV. Digital Image Correlation Applications in Composite Automated Manufacturing, Inspection, and Testing. Applied Sciences. 2019; 9(13):2719. https://doi.org/10.3390/app9132719
Chicago/Turabian StyleShadmehri, Farjad, and Suong Van Hoa. 2019. "Digital Image Correlation Applications in Composite Automated Manufacturing, Inspection, and Testing" Applied Sciences 9, no. 13: 2719. https://doi.org/10.3390/app9132719
Note that from the first issue of 2016, this journal uses article numbers instead of page numbers. See further details here.