Application of Fuzzy Theory to the Evaluation Model of Product Assembly Design and Usability Operation Complexity

1
Department of Creative Product Design, Asia University, Taichung 41354, Taiwan
2
Department of Medical Research, China Medical University Hospital, China Medical University, Taichung 40445, Taiwan
Appl. Sci. 2019, 9(19), 4055; https://doi.org/10.3390/app9194055
Submission received: 21 August 2019
/
Revised: 21 September 2019
/
Accepted: 23 September 2019
/
Published: 27 September 2019
(This article belongs to the Special Issue Selected Papers from IEEE ICASI 2019)
Abstract
:In order to make people’s lives more convenient and enhance living standards, the composition of a product usually includes more than one component. However, a product is created by the joint endeavor of people from various territories and therefore one of the important considerations is making a product merge into consumers’ daily lives rather than simply fulfilling its functions. There might be conflicts with people’s existing life patterns or existing values, which should be taken into consideration during the manufacturing process. This study is an investigation of the process of assembly by considering the assembly operations and the assembly operating time. By determining the relationship between components, the assembly concept of most components was analyzed. A fuzzy comprehensive evaluation was carried out during the evaluation of the degree of complexity of user operations. Depending on the ranking of membership, the most appropriate assembly was determined and this serves as a reference for designers to select the optimal product assembly. By recording the consumer usage models, the optimal assembly and usage model of product design were also proposed. The goal of this study is to find the balance between assembly evaluation and user usage model by the process in order to allow designers to determine the new assembly concepts that meet consumer usage models. A case study of four bedside stereos was carried out by implementing the proposed approach in order to determine the evaluation principle of assembly. The purpose of this is to enhance the balance between assembly design and user operation complexity for making efficient decisions. A product design can comply with the spirit of concurrent engineering and the quality of a product design can be enhanced.
1. Introduction
Nowadays, consumer preferences are highly changeable, under a limited amount of resources, and it is difficult for a company to meet the demands of a variety of consumers of the stereo market. Being confronted with this condition, a company needs to consider a way of determining the most beneficial market for itself and to serve the consumers of that market in an efficient way. Due to the fact that typical design evaluation methods are not capable of correcting the evaluation of fuzzy messages from the aesthetic aspect, a new approach of assisting consumers in selecting stereo speakers by implementing the fuzzy theory has been developed. Lo et al. [1] proposed the use of the fuzzy breaking-circle method on the design of product interface operation and layout. Ko et al. [2] and Ko [3] proposed the analysis of the hot zones of users’ product operability to carry out the re-arrangement of layout design for analysis.
Quantitative approaches were proposed by scholars such as Kwahk and Han [4], Lee et al. [5], Lee et al. [6], Heo et al. [7] and Jin and Ji [8] for carrying out the principles of usability evaluation respectively. In their studies, they introduced the usability risk level evaluation during the earlier stage of conceptual designs. This is due to the fact that a design at the earlier stage might affect the usability interface. Moreover, from the aspect of product designs, the decomposition and analysis of a product by perceptions and practical operations was proposed by Chou [9], Hsiao et al. [10] and Ko et al. [2] in order to determine the optimal solution.
Therefore, the goal of this study is to determine the appropriate design case study that can demonstrate the development of this type of research method. Considering the expected product attributes, the product to be reviewed in this study should be at the mature stage of its life cycle so that the design consideration focuses on the manufacturing and assembly stages. Stereo speakers serve as a good case study as they are mostly assembled by screws or latches in a similar way to other home appliances. The main approach is to use the morphological charts to classify various components in order to simplify a problem. An experiment was also carried out by showing the participants mechanical simulation videos of a product. The design ideas were presented in the form of 3D models by excluding the consideration of color and material. The aim of this study is to achieve the following goals:
- By analyzing the theories that are relevant to this study, new concepts of stereo speakers can be generated along with 3D models that can simulate mechanical operations.
- By analyzing the theories that are relevant to this study, quantized values of the psychological perception of consumers can be obtained.
- By analyzing the theories that are relevant to this study, new design ideas can be ranked according to their assembly efficiency and assembly cost.
- By analyzing the theories that are relevant to this study, new design ideas that comply with a company’s decisions from a variety of aspects can be determined.
- By analyzing assembly approaches and evaluating the usability, design ideas that have a higher value of development can be determined.
- By analyzing assembly approaches and evaluating the usability, the application of concurrent engineering can be enhanced.
2. Materials and Methods
2.1. Introduction to Assembly Design
In this section, the literature that is relevant to the assembly process of components of a product and its evaluation is reviewed.
2.1.1. Planning of the Assembly Process
In order to carry out systematic planning and analysis of product assembly, various approaches of assembly planning and determining the ranking and principles of evaluations have been proposed by researchers. Depending on their methods or aspects, they are described respectively as follows:
- Review of direct-assembly approach: This approach deals with the serial assembly of a product starting from the first component. A product is complete after assembling the last component. This type of inference method is also called the goal driven or backward chaining approach.
- Review of reverse-assembly approach: This approach was investigated from the standpoint that if the disassembly process of a product is appropriate, the adequate assembly sequence of a product can be derived from the reverse sequence of the disassembly sequence.
In addition, there are also reviews of the approach of decomposing and depicting the structural diagram and the approach that uses matrices for analysis.
Barbosa and Carvalho [11] proposed a guidance of applying the concept of design for manufacturing and assembly (DFMA) to specific applications such as airplane design and manufacturing. Via the traditional design for assembly approach, Moultrie and Maier [12] proposed a new approach to encompass an original assessment tool and its delivery process. Their approach included custom designed post-it notes and simple check lists for scoring. Tiwari et al. [13] integrated design for manufacturing (DFM) and design for assembly (DFA) into information communication technologies (ICT) to establish a design for manufacturing and assembly/disassembly with the joint design of products and production systems in order to realize the target standard of Industry 4.0. Sossou et al. [14] proposed a process-independent, structured and systematic method for designing assembly-free mechanisms.
2.1.2. Method of Evaluating Assembly
The relationship between a product’s design and its assembly approach affects its cost. Approaches that have been used to evaluate assembly design in various industries are summarized as follows:
- Hitachi’s assembly evaluation method.
- Lucas’ method of analyzing assembly designs.
- Fujitsu’s capacity evaluation system.
- Boothroyd Dewhurst’s method of evaluating assembly designs [15].
2.2. Usability Engineering
In recent years, usability engineering has become one of the most important measurement indices of various product and interface designs. Norman [16], a cognitive psychologist, proposed the user-oriented thinking in order to see the whole picture of “human/machine/environment” and “human/product/scenario.” He proposed an approach that allowed users to accept a product in a natural way by following his/her own mental characteristics without forcing the users to build a new mental model as shown in Figure 1.
2.3. Fuzzy Theory
The fuzzy theory bridges the gap between the precise classical mathematics and the real world that is full of vagueness. When encountering a problem with a high degree of vagueness and uncertainty, the fuzzy set of membership function can be used to quantize the perception of designers and consumers, as it is known that, differentiation can be realized only by comparison. During production, scientific research and our daily life, people always compare things and evaluate their quality in order to determine the optimal way of handling them. These activities include the evaluation of a member’s quality, the quality of goods and the evaluation of how reasonable certain engineering design parameters are. Since a thing/object has various attributes and is affected by various factors, carrying out comprehensive consideration and fuzzy factors on several relevant factors during the process of evaluating things/objects is required. This process is called the fuzzy comprehensive evaluation.
2.4. Product Assembly Design Case
In order to find the suitable and applicable design cases and to describe the development of research methodology in a clearer way, the positioning of the product attributes in this study is on those products that are at the mature stage of product life cycle. The design consideration highlights the manufacturing and assembly orientation. Therefore, stereo systems that are available on the market were selected for the case study. Similar to other home appliances, a stereo system is assembled by screws or rivets and it is expected that the result can serve as a good reference for other relevant studies.
3. Research Process and Methods
In this study, the disassembly, ranking and evaluation approaches for assembly designs were applied to the target product. To start with the process, component drawings were processed to form the component matrices. After the ranking of assembly evaluation, the simulated scenarios of users can be developed by the usability engineering and the way how the participants were using the assembly was recorded. The fuzzy theory was implemented to the evaluation of product assembly and the degree of user preference was compared an analyzed. The purpose was to determine the correlation between the assembly consideration from the engineering orientation and the usability consideration from the user orientation. The flowchart and framework of this study is shown in Figure 2.
3.1. Assembly Evaluation
The Boothroyd Dewhurst (DFA) method [17] was used as the main approach of evaluating assemblies. Its function is to analyze the manual processing time and installation time for components that are affected by several parameters which include component size, component weight and component thickness. The evaluation table is shown in Table 1 as follows.
The implementation procedure includes:
- Step 1:
- Acquire the information that is related to product assembly and this information includes engineering drawings, three-dimensional exploded view drawing, existing product samples and prototypes. The information of each component is recorded in the design table.
- Step 2:
- Perform new ways of assembling product components. The table items are ranked according to the assembly codes from the highest code to the lowest one so that a new way of assembling components can be created.
- Step 3:
- Record the total operating time, the total operating cost and the minimum number of components after all items of product components are complete.
3.2. Fuzzy Theory
The fuzzy theory was proposed by L.A. Zadeh, a researcher and professor emeritus of computer science at the University of California, U.S. He proposed the concept of fuzzy sets in 1965 and fuzzy mathematics became a new branch of mathematics.
In order to consider the influence of all factors comprehensively so that a correct evaluation result can be obtained, the fuzzy comprehensive evaluation was proposed. By including the weights of corresponding factors, the comprehensive influence of all factors is reflected in a reasonable way. Therefore, the fuzzy comprehensive evaluation table is as follows.
4. Results and Analysis
4.1. Selection of the Concept Schemes
In general, there are two ways of selecting the concept schemes: (1) Using the design for functions (DFF) to build a functional structure that is based on consumer demands; and (2) Using the method of morphological chart to develop design ideas that are based on the functional structure.
4.1.1. Determining Product Functions
The verb-noun approach that was proposed by Tuttle [18] among the DFF approaches was used to convert the user demands that were collected from questionnaire on stereo systems to the functional aspect of a product.
The new functions to be developed for a stereo system can be defined by adding a verb to a noun according to this approach. The results are summarized in Table 2 as follows.
4.1.2. Developing the Product Structure Tree Diagram
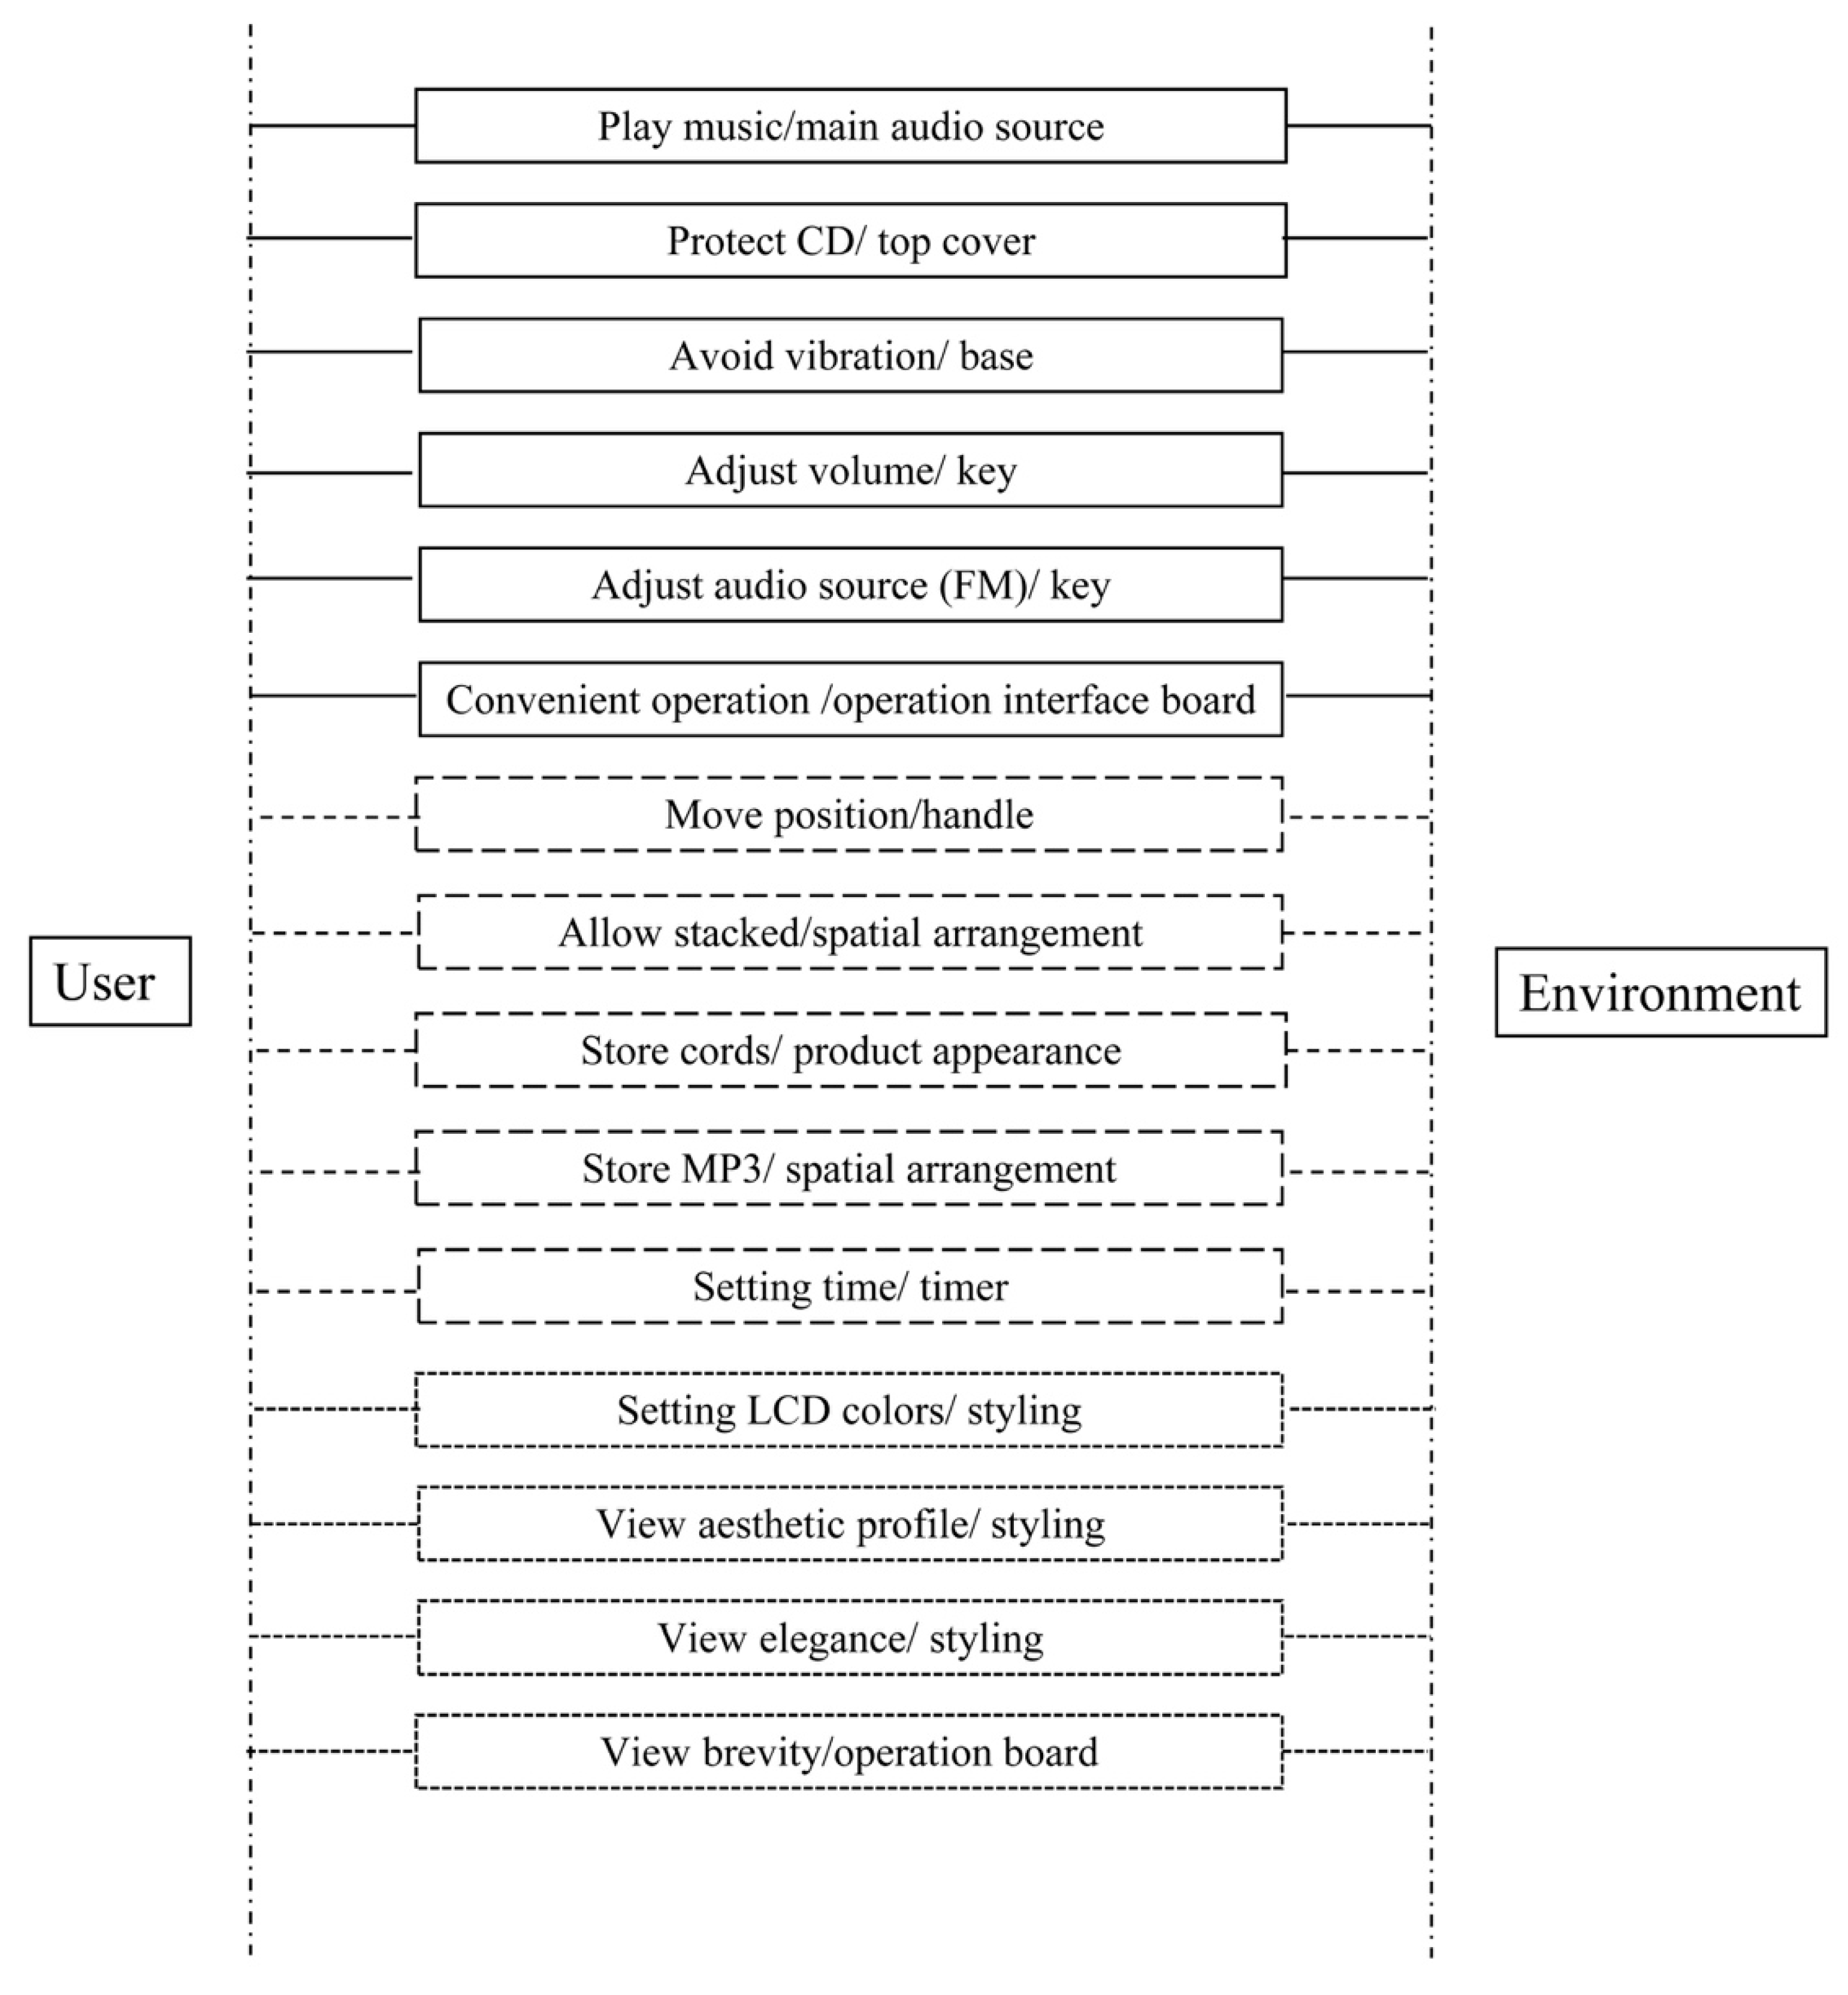
The product functions that are listed in Table 2 will be further described by a function structure diagram as follows. During the development stage of a concept, the most important goal of the FSD is to disassemble the main product into problems with which the details can be managed. In order to further understand product functions, a product can be defined by three abstract levels, which include functions of the whole product, functions of the subassembly and functions of the individual products.
In the FSD, basis functions are bounded by solid rectangles, secondary functions are bounded by dashed rectangles and aesthetic functions are bounded by dotted rectangles. Therefore, the FSD of a stereo system is shown in Figure 3 as follows.
4.1.3. Creating Concept Schemes
After the function structure diagram of a stereo system is created, a designer can further generate design ideas. The way of generating design ideas include design by analogy, brainstorming and so forth. Each approach has its own pros and cons. In this study, the design ideas were created by the morphological chart method that was proposed by Cross [19].
As shown in Table 3, after calculating the possible answer of each row, the number of all possible concepts is 4 × 4 × 4 × 4 × 4 × 2 × 2 × 2 × 2 = 16,384.
In order to simplify the problem, the subassemblies were assembled into four concept schemes:
- Idea 1. Product code: P11, P21, P32, P44, P53, P61, P72, P82, P91
- Idea 2. Product code: P14, P23, P31, P41, P51, P61, P71, P82, P91
- Idea 3. Product code: P12, P24, P32, P44, P52, P61, P72, P81, P91
- Idea 4. Product code: P13, P24, P31, P43, P51, P61, P71, P82, P91.
4.2. Process of the Usability Experiment
Parameter models of the concept schemes that were generated in the earlier stage can be created by commercial CAD software such as Solidworks. In order to make the mechanism of those concept schemes movable, the concept schemes were disassembled into components so that the mechanism patterns can be revealed. On the other hand, the assembly efficiency and assembly time of the components were also calculated from the engineering perspective.
4.2.1. Pre-Procedure
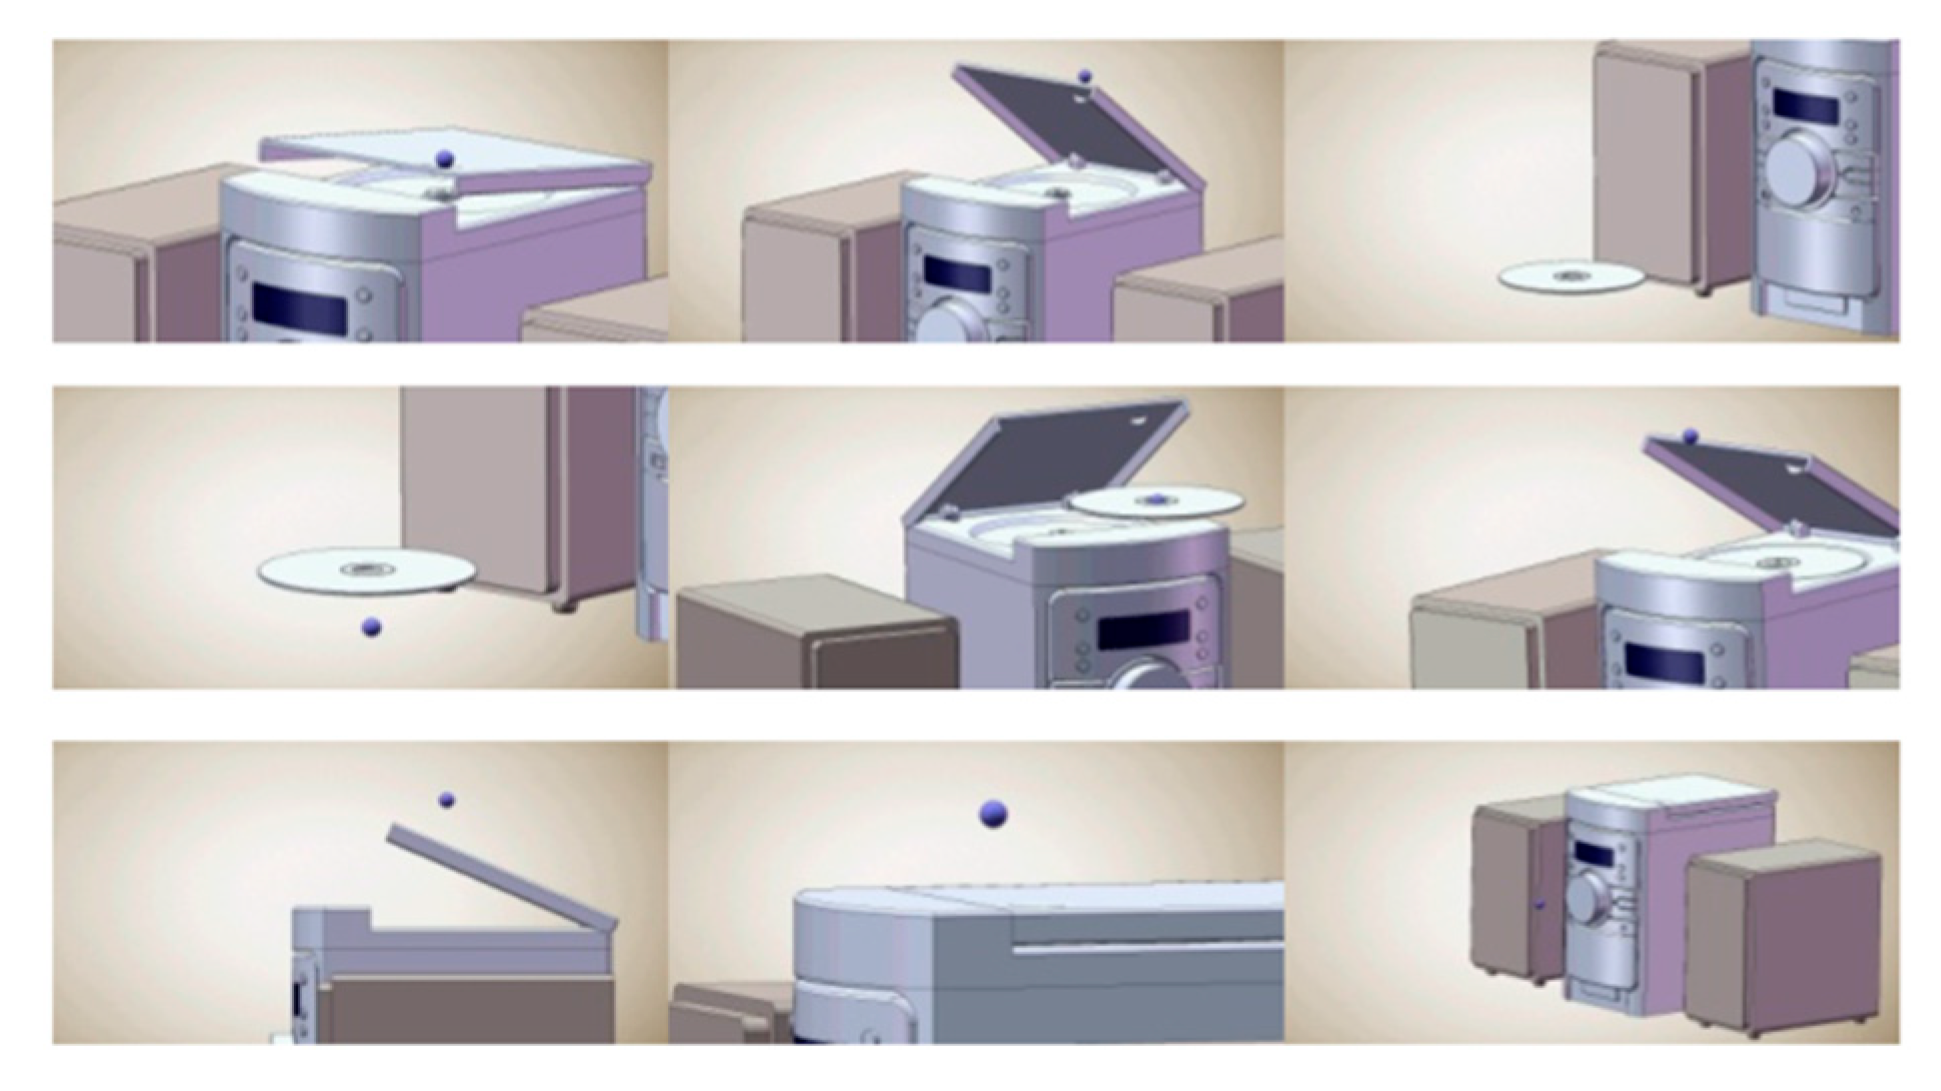
Before creating the 3D models, the factor of colors was excluded so that these four concepts were not affected by colors. Moreover, blue dots in the videos indicate the location of a participant’s hand when using the stereo systems. To distinguish the LCD monitor from a stereo system model, the area of the message interface is in dark blue colors.
The three-view drawings, specifications and the simulation of product mechanism for these four concepts are shown in Figure 4, Figure 5, Figure 6 and Figure 7 and Table 4. The simulation of product mechanism includes the actions of taking out or placing the CD, adjusting volume, external source (MP3, iPhone) and so forth. The videos allow participants to understand how a concept operates and what the human-machine interaction looks like. Three-dimensional CAD software SolidWorks and the rendering and Three-dimensional rendering animation software KeyShot were used in this study.
(a) Mechanical operation of the CD drive in a stereo system
Figure 5.
Animation screenshots of mechanical simulation for Idea 1.
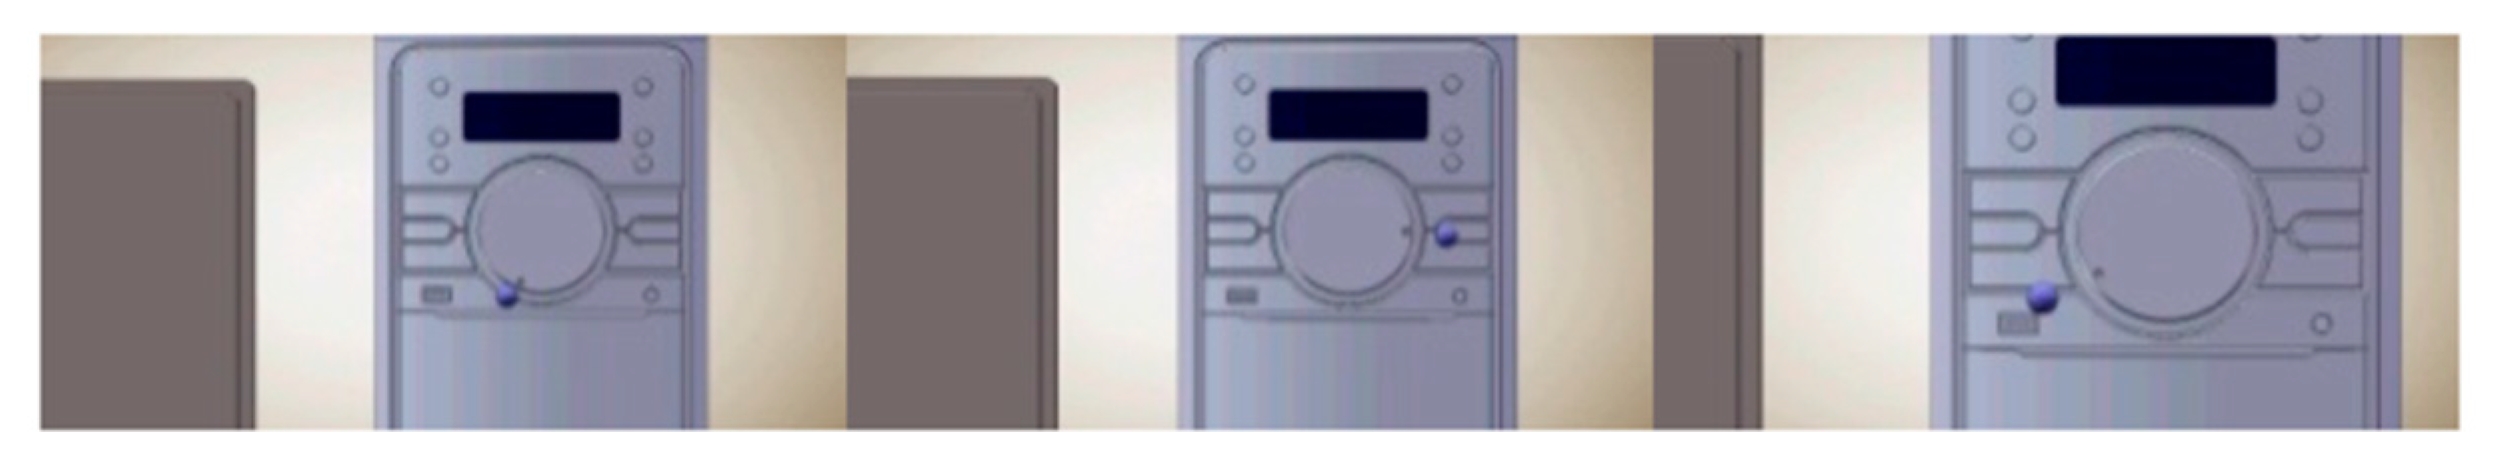
(b) Adjusting volume
Figure 6.
Animation screenshots of mechanical simulation for Idea 1.
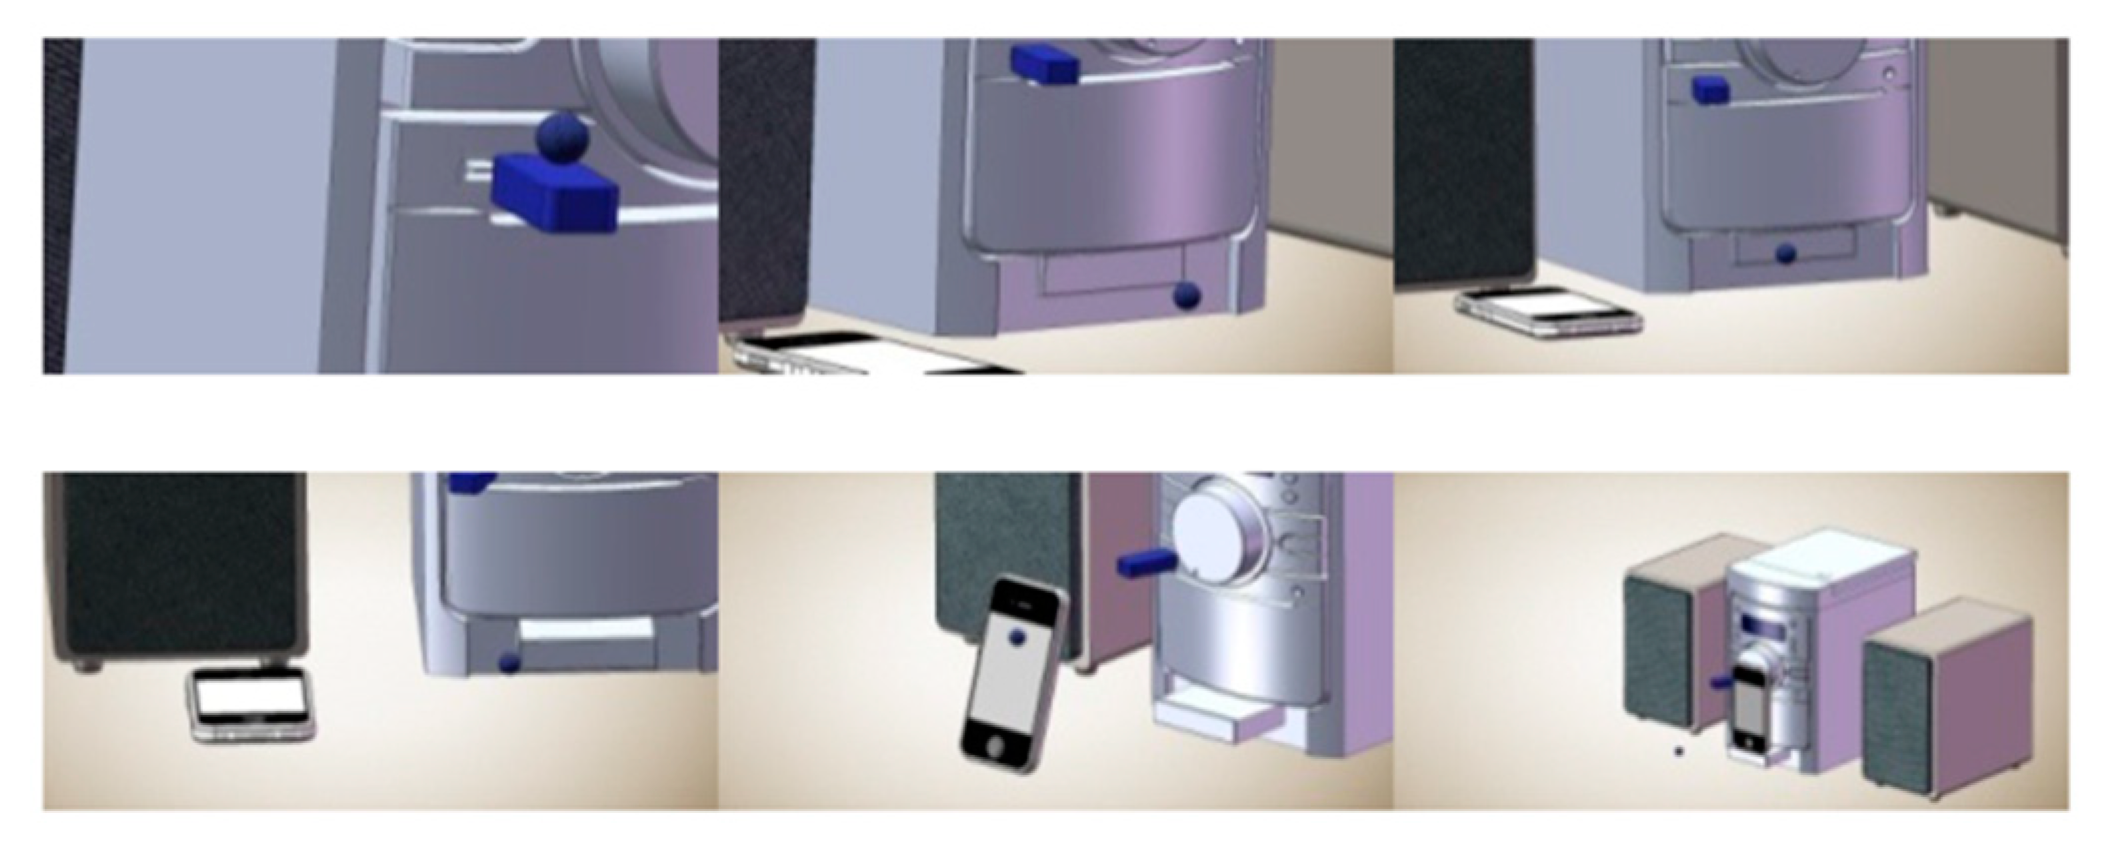
(c) External source (iPhone/USB)
Figure 7.
Animation screenshots of mechanical simulation for Idea 1.
In order to carry out the usability experiment, videos of the mechanical simulations for Idea 2, 3, 4 were also prepared. After these videos were ready, the next step was to design the questionnaire for the participants including potential customers, management and design team. The highlights of this questionnaire are as follows:
- Learnability and efficiency
- Memorability and errors
- Function
- Emotion
- Satisfaction
4.2.2. Pre-Test
After the questionnaire and the videos of concepts were ready, two students who had design related background were invited to carry out the overall experiment prior to the formal experiment in order to check whether the experimental process was smooth and whether the questionnaire was adequate.
The main problems that were determined after this pre-test are described as follows:
- 6.
- Unclear description of some questions in the questionnaire.
- 7.
- The ranking of the preference of these design ideas was carried out before playing the videos. The researchers did not check whether the ranking changed after the end of these videos.
- 8.
- The videos were played at different speeds.
- 9.
- It is recommended using the same computer to play the videos in order to control the variables including colors under the same playing environment.
4.2.3. Experimental Procedure
The procedure of the experiment is described as follows:
- 10.
- Two laptop computers were used for the experiment. One for the participants to fill in the questionnaire and the other one for playing the simulation videos of the design ideas.
- 11.
- A CD stereo system was placed in front of the desk so that the participants can use it for the vivid simulated operations during the experiment.
- 12.
- All of the prototype stereo systems have consistent colors so that participants were not affected by colors when using the prototypes. The interface which displays the music messages are in dark blue and a participant’s hand position is simulated by the blue dots.
- 13.
- After a participant viewed the three-view drawings of these four prototype products, he/she was asked to fill in his/her preference in sequence.
- 14.
- 15.
- The participant was asked to fill in his/her preference of the mechanical simulation videos.
4.3. Results and Analysis of the Usability Experiment
A total of 30 participants were invited for the experiment in this study and their background information is shown in Table 5 as follows.
4.3.1. Outline of the Usability Decision Model
The outline of the usability decision model that was used in this study includes several steps as follows:
- Determining the targets and the evaluation criteria and constructing the hierarchical tree diagram of objects.
- Determining the weights by considering the relative importance of criteria.
- After measuring the membership functions of the targets at the lowest level in the tree, building up the fuzzy relation matrix.
- Using the weight set and the fuzzy relational matrix that was obtained from Step 2 and Step 3 to determine the fuzzy comprehensive evaluation values.
- Selecting the optimal choices from the design schemes’ relative matrices that were formed by the fuzzy comprehensive evaluation values.
4.3.2. Description of Problems
A stereo system was selected as the case study. In addition to meeting the functional, physical and styling limitations, the product is required to satisfy other limitations in the specific tasks. The first step of the evaluation is to stipulate the design guidelines. The limitations could be due to the engineering, ergonomic, aesthetic, marketing, logistic, planning, design, product and economic factors.
4.3.3. Constructing the objective tree
4.3.4. Evaluation of weight function
In order to determine the influence of the lower levels on the higher levels, the weight functions should be determined by methods such as AHP [20], tabulated judgment method [21] and so forth. In this study, the tabulated judgment method was used for determining the weight functions.
The procedure is described as follows:
- (1)
- Determining the relative importance of pairwise items including the F1, F2, F3 and F4 child items.
- (2)
- List the test items into rows and columns in a table.
- (3)
- Filling in the scores of pairwise importance into the corresponding columns according to the following principles. If two child items have the same importance as the higher level, both child items were given a score of two points. For example, if F2 is more important than F1, than F2 gets 3 points and F1 gets 1 point. If F1 is much more important than F4, F1 gets 4 points and F4 has zero point. No value is filled into the diagonal columns as this is comparison to itself.
- (4)
- The summation of all child items Ki can be obtained by summing up the comparison value of each row.
- (5)
- The summation of all child items can be aggregated into the grand total of a system with n items by the following equation.
- (6)
- The weight function of each item can be expressed by Wi = Ki/, which is the weight of the nth item.
By implementing the above-mentioned method, the degree of influence of the five items and their child items can be determined as shown in Figure 13 and Table 6.
All of the weights can be calculated by the above-mentioned method and the results are summarized in Table 7.
4.3.5. Measuring the Membership Functions
In order to determine the participants’ subjective degree of satisfaction on these four design ideas, the membership values of all items need to be measured. The definition of the fuzzy evaluation set is as follows:
After that, the average membership values of each child item on the design ideas can be obtained from the values that were calculated from the questionnaire. The results are shown in Table 8.
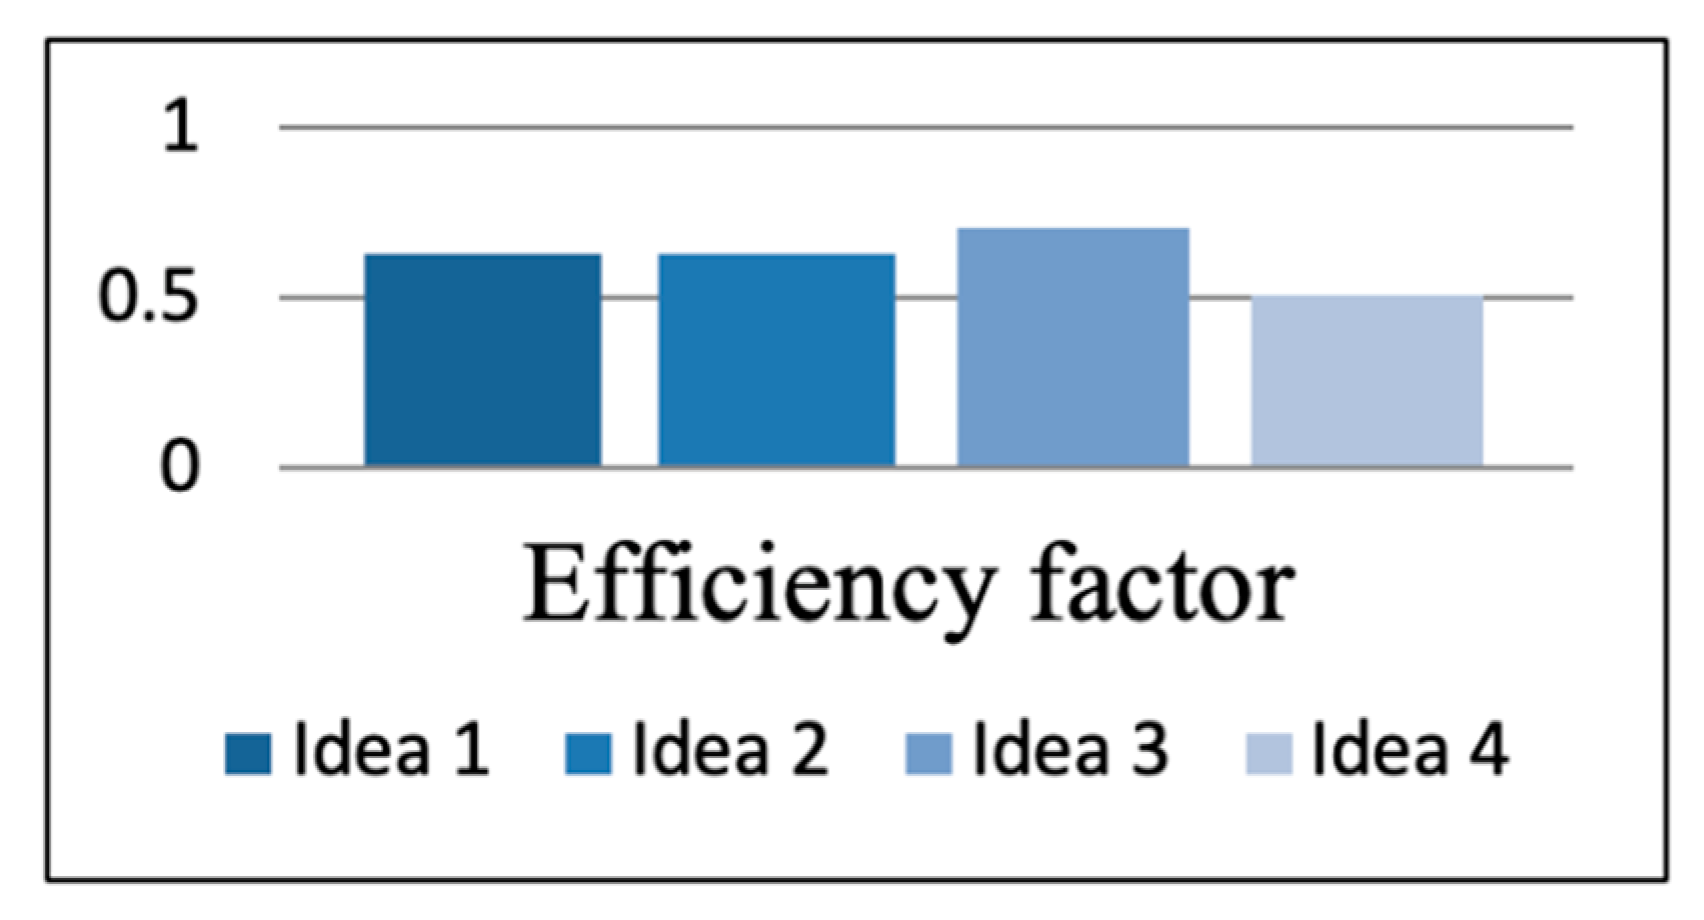
After that, the influence of the efficiency factors (accuracy of music source button, promptness of message reception, clarity of message reception, time for taking/placing CD) at the lower level on the efficiency factors at the higher levels. The influence of the four items on the four prototype stereo systems can be determined by the same approach from the lower levels up to the higher levels.
1. Efficiency factors:
The membership values of efficiency factors are shown in Figure 14. It is known from the calculation of the membership functions that, Idea 3 (0.702) had the greatest influence from the aspect of the efficiency factor, followed by Idea 1, Idea 2 and Idea 4.
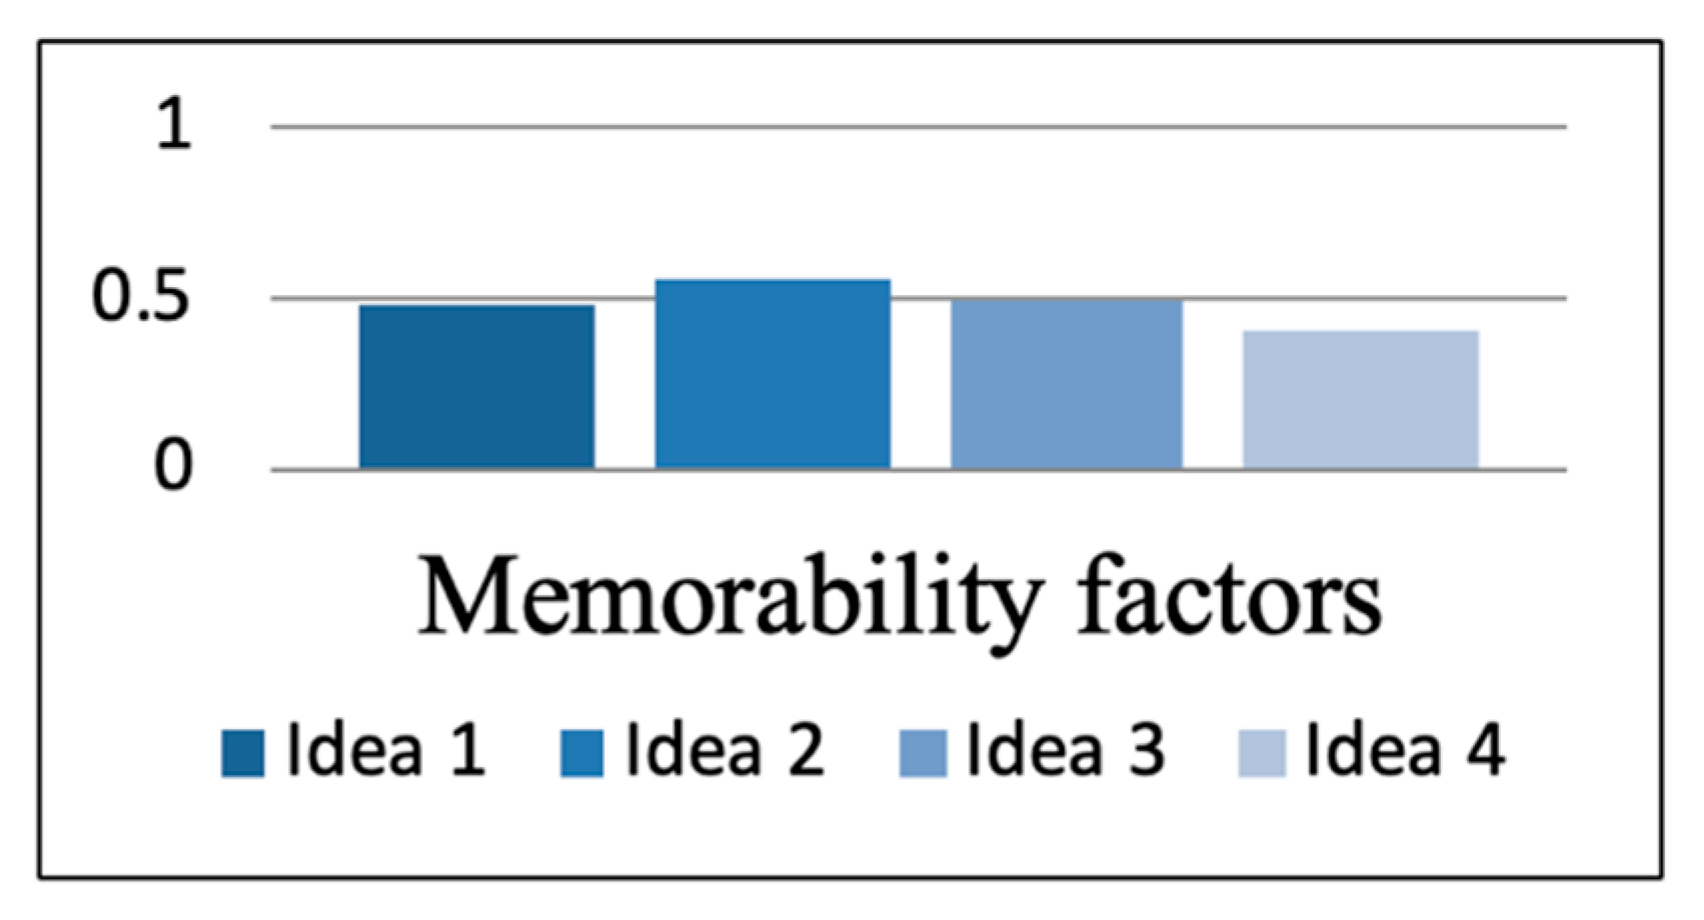
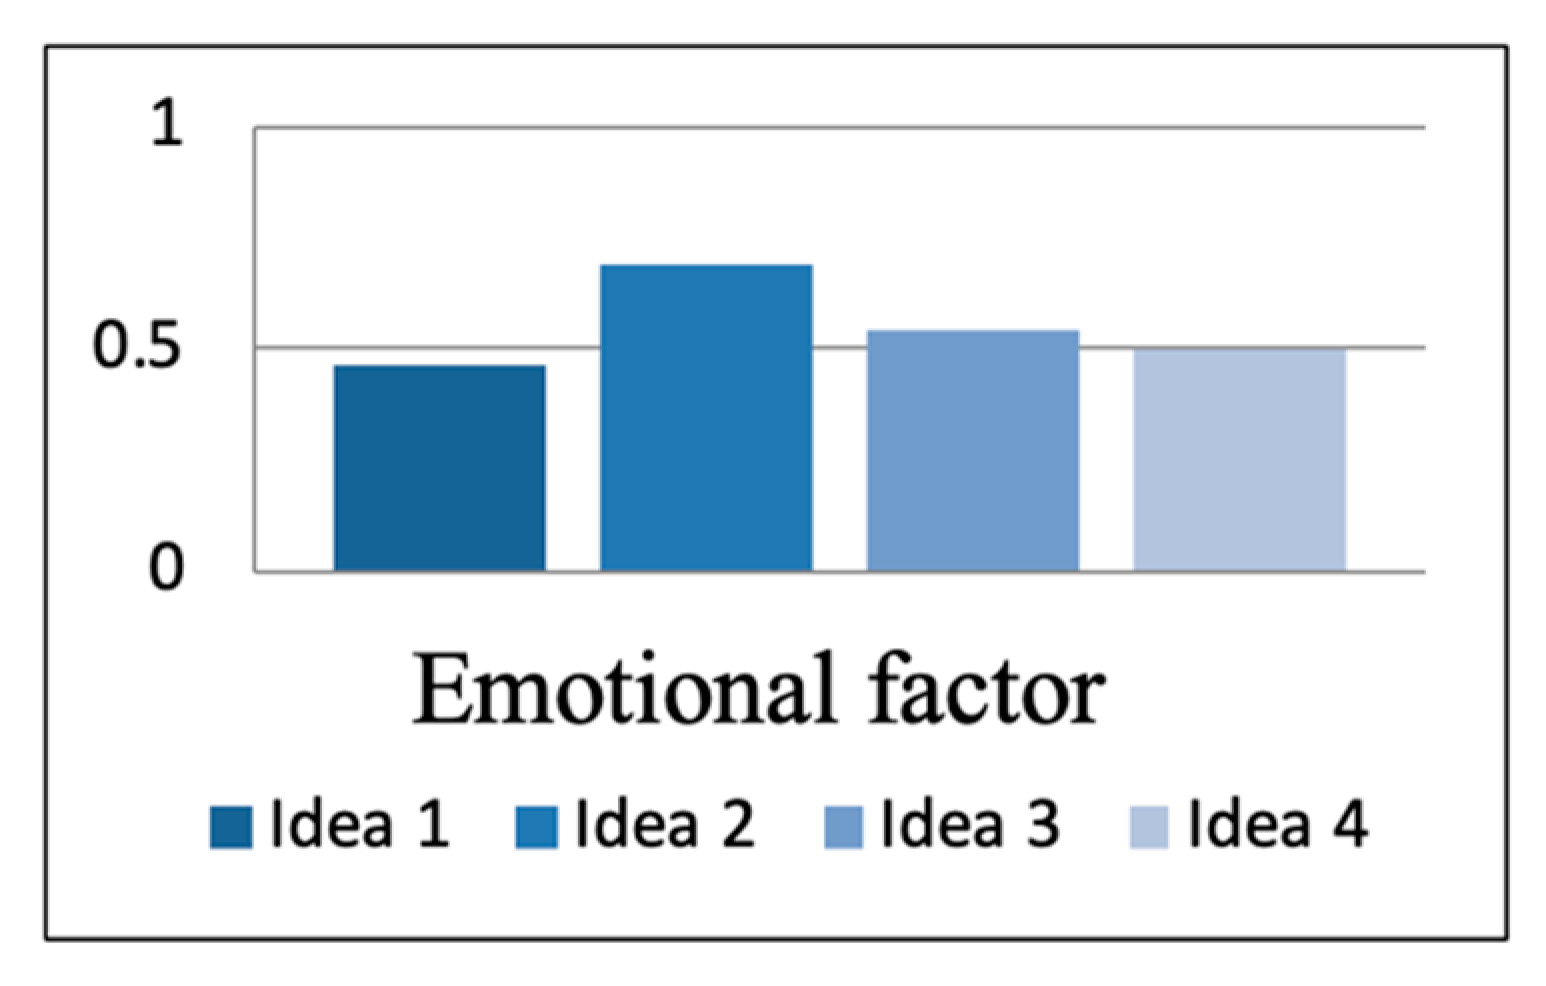
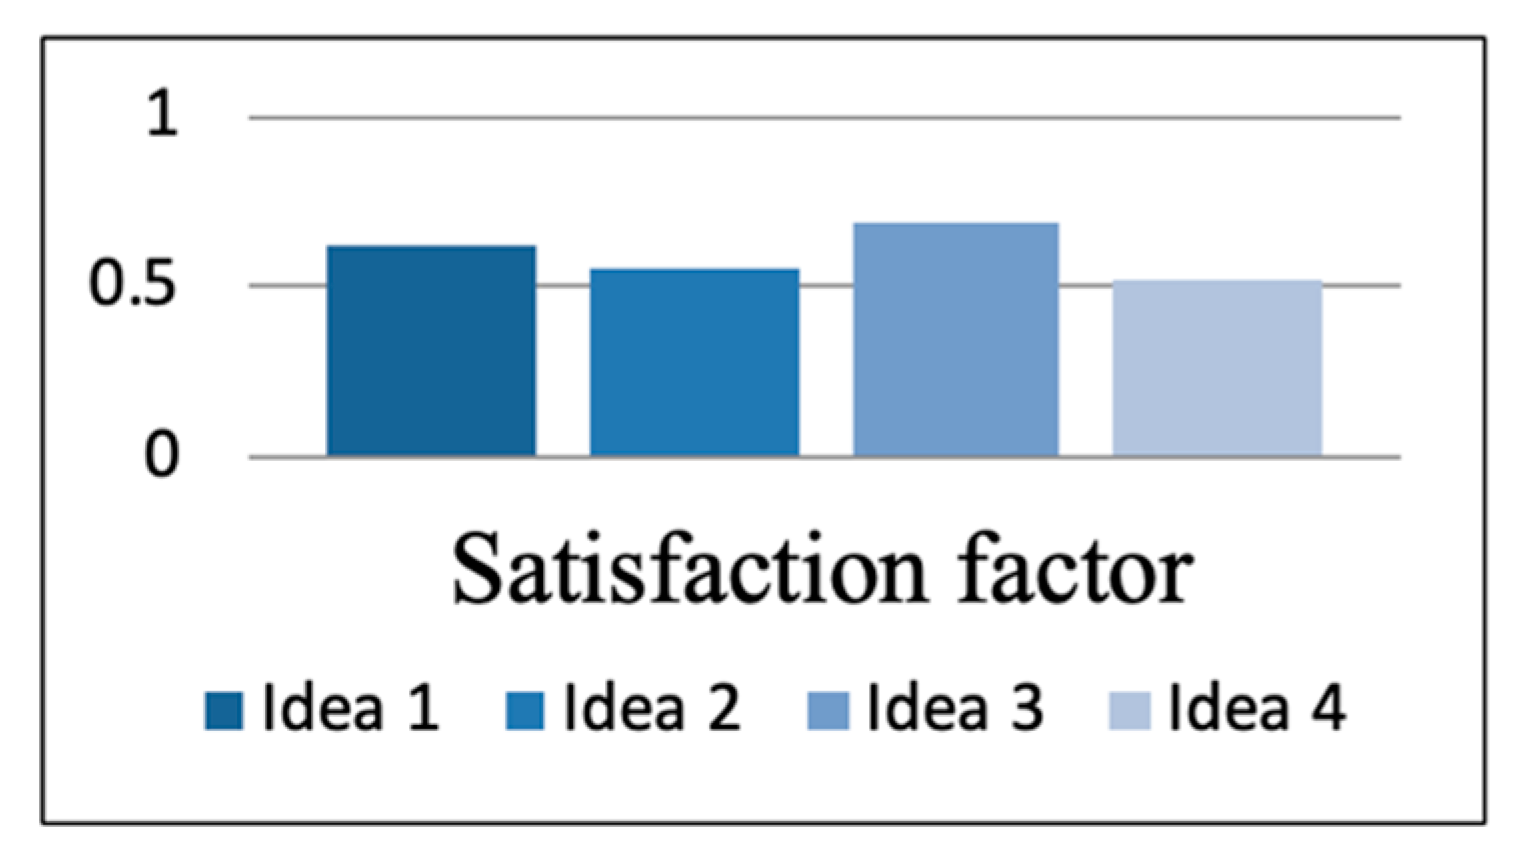
The membership values of memorability factors, functional factors, emotional factors, and satisfaction factors are respectively shown in Figure 15, Figure 16, Figure 17 and Figure 18 which indicated that in general Idea 2 had the great influence than others except from the aspect of the satisfaction factor.
2. Memorability factors:
Figure 15.
Membership values of memorability factors.
3. Functional factors:
Figure 16.
Membership values of functional factors.

4. Emotional factors:
Figure 17.
Membership values of emotional factors.
5. Satisfaction factors:
Figure 18.
Membership values of satisfaction factors.

4.4. Evaluating the ‘Assembleability’ of Design Schemes
A product design is considered not good enough if it cannot be manufactured and assembled in an efficient way. The implementation of the design for assembly (DFA) approach during product design is to improve the productivity. The application of DFA presents several advantages as follows:
- Excessive components in a product can be reduced.
- The assembly efficiency can be improved.
- The assembly time of a product can be reduced.
- Members in a design team can spend less time on communication.
- The number of components that are used in a product can be reduced after a redesign.
During the first stage, the main task is to determine the minimum number of components. The calculation of the minimum number of components is determined by considering whether the components can deliver the required functions for the product. It is advised to carry out a discussion on the four questions as follows:
- 6.
- Is the component required to take relative motion to other components during operation?
- 7.
- Is the component separate to other components that are already assembled or does it require different types of materials?
- 8.
- When assembling a component or carrying out maintenance, is it required separating a component from other components that are already assembled?
- 9.
- Is the component the only one that can deliver the desired function?
If the answer to any of the above questions is yes, the component should exist in a standalone way. During the second stage, the main task is to analyze and measure the manual handling and manual insertion of each component:
- 10.
- Manual handling: This deals with the motions including grabbing, transporting and positioning components and their direction.
- 11.
- Manual insertion: This involves the motions of placing a component and adding it to the tooling to form an assembly.
- 12.
- Aiming at manual assembly, find a two-digit manual code and a two-digit placing motion code.
- 13.
- Carrying out the evaluation according to the manual handling and manual insertion tables that were proposed by Boothroyd and Dewhurst [17] as follows.
4.4.1. Structure Tree of Design Schemes
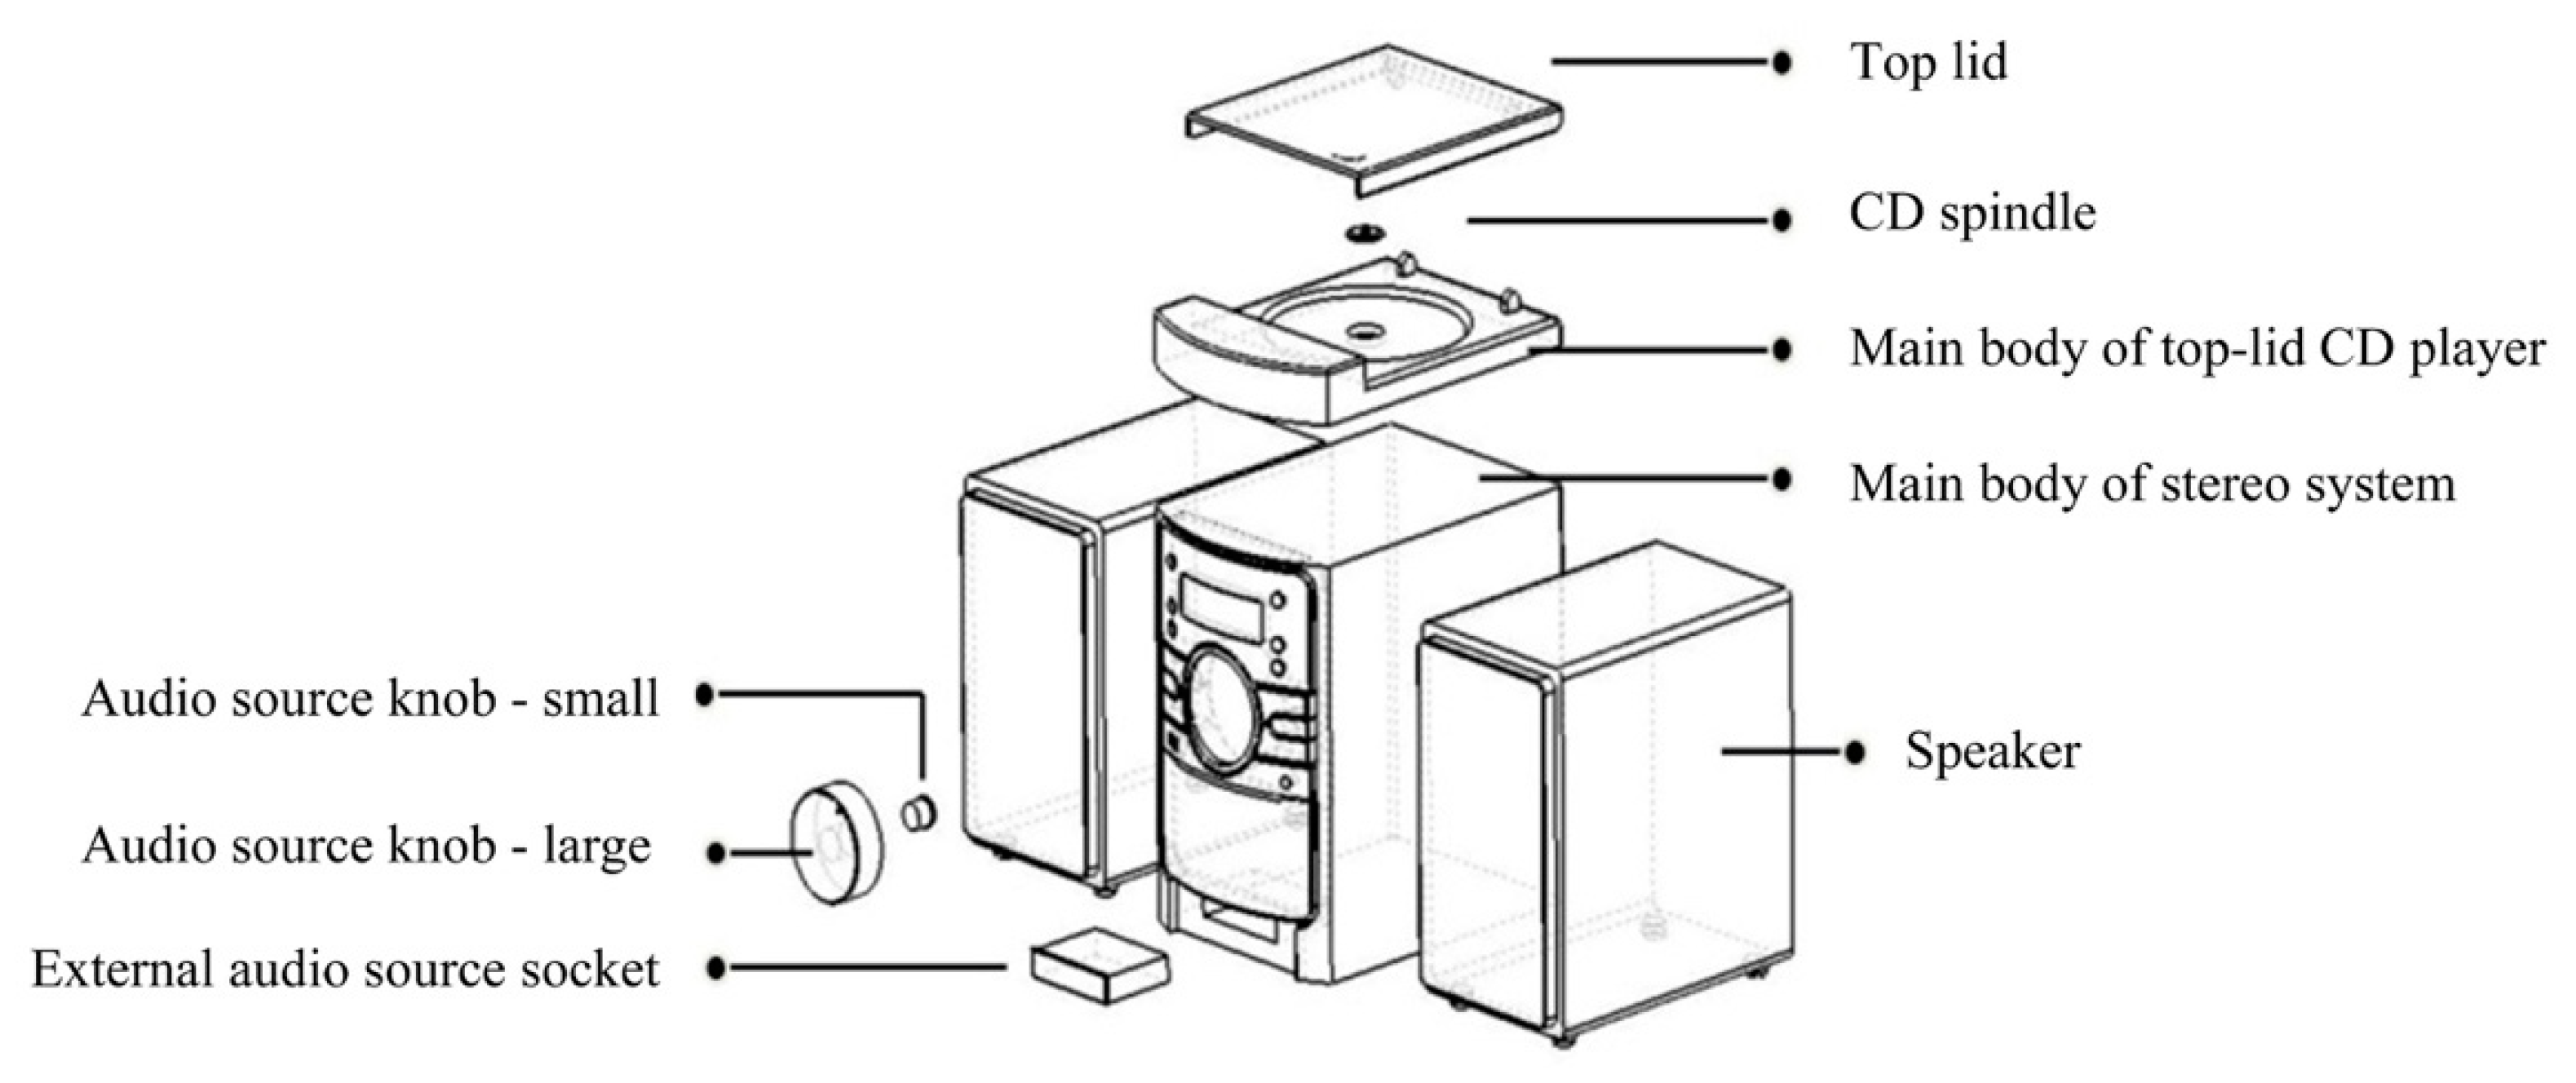
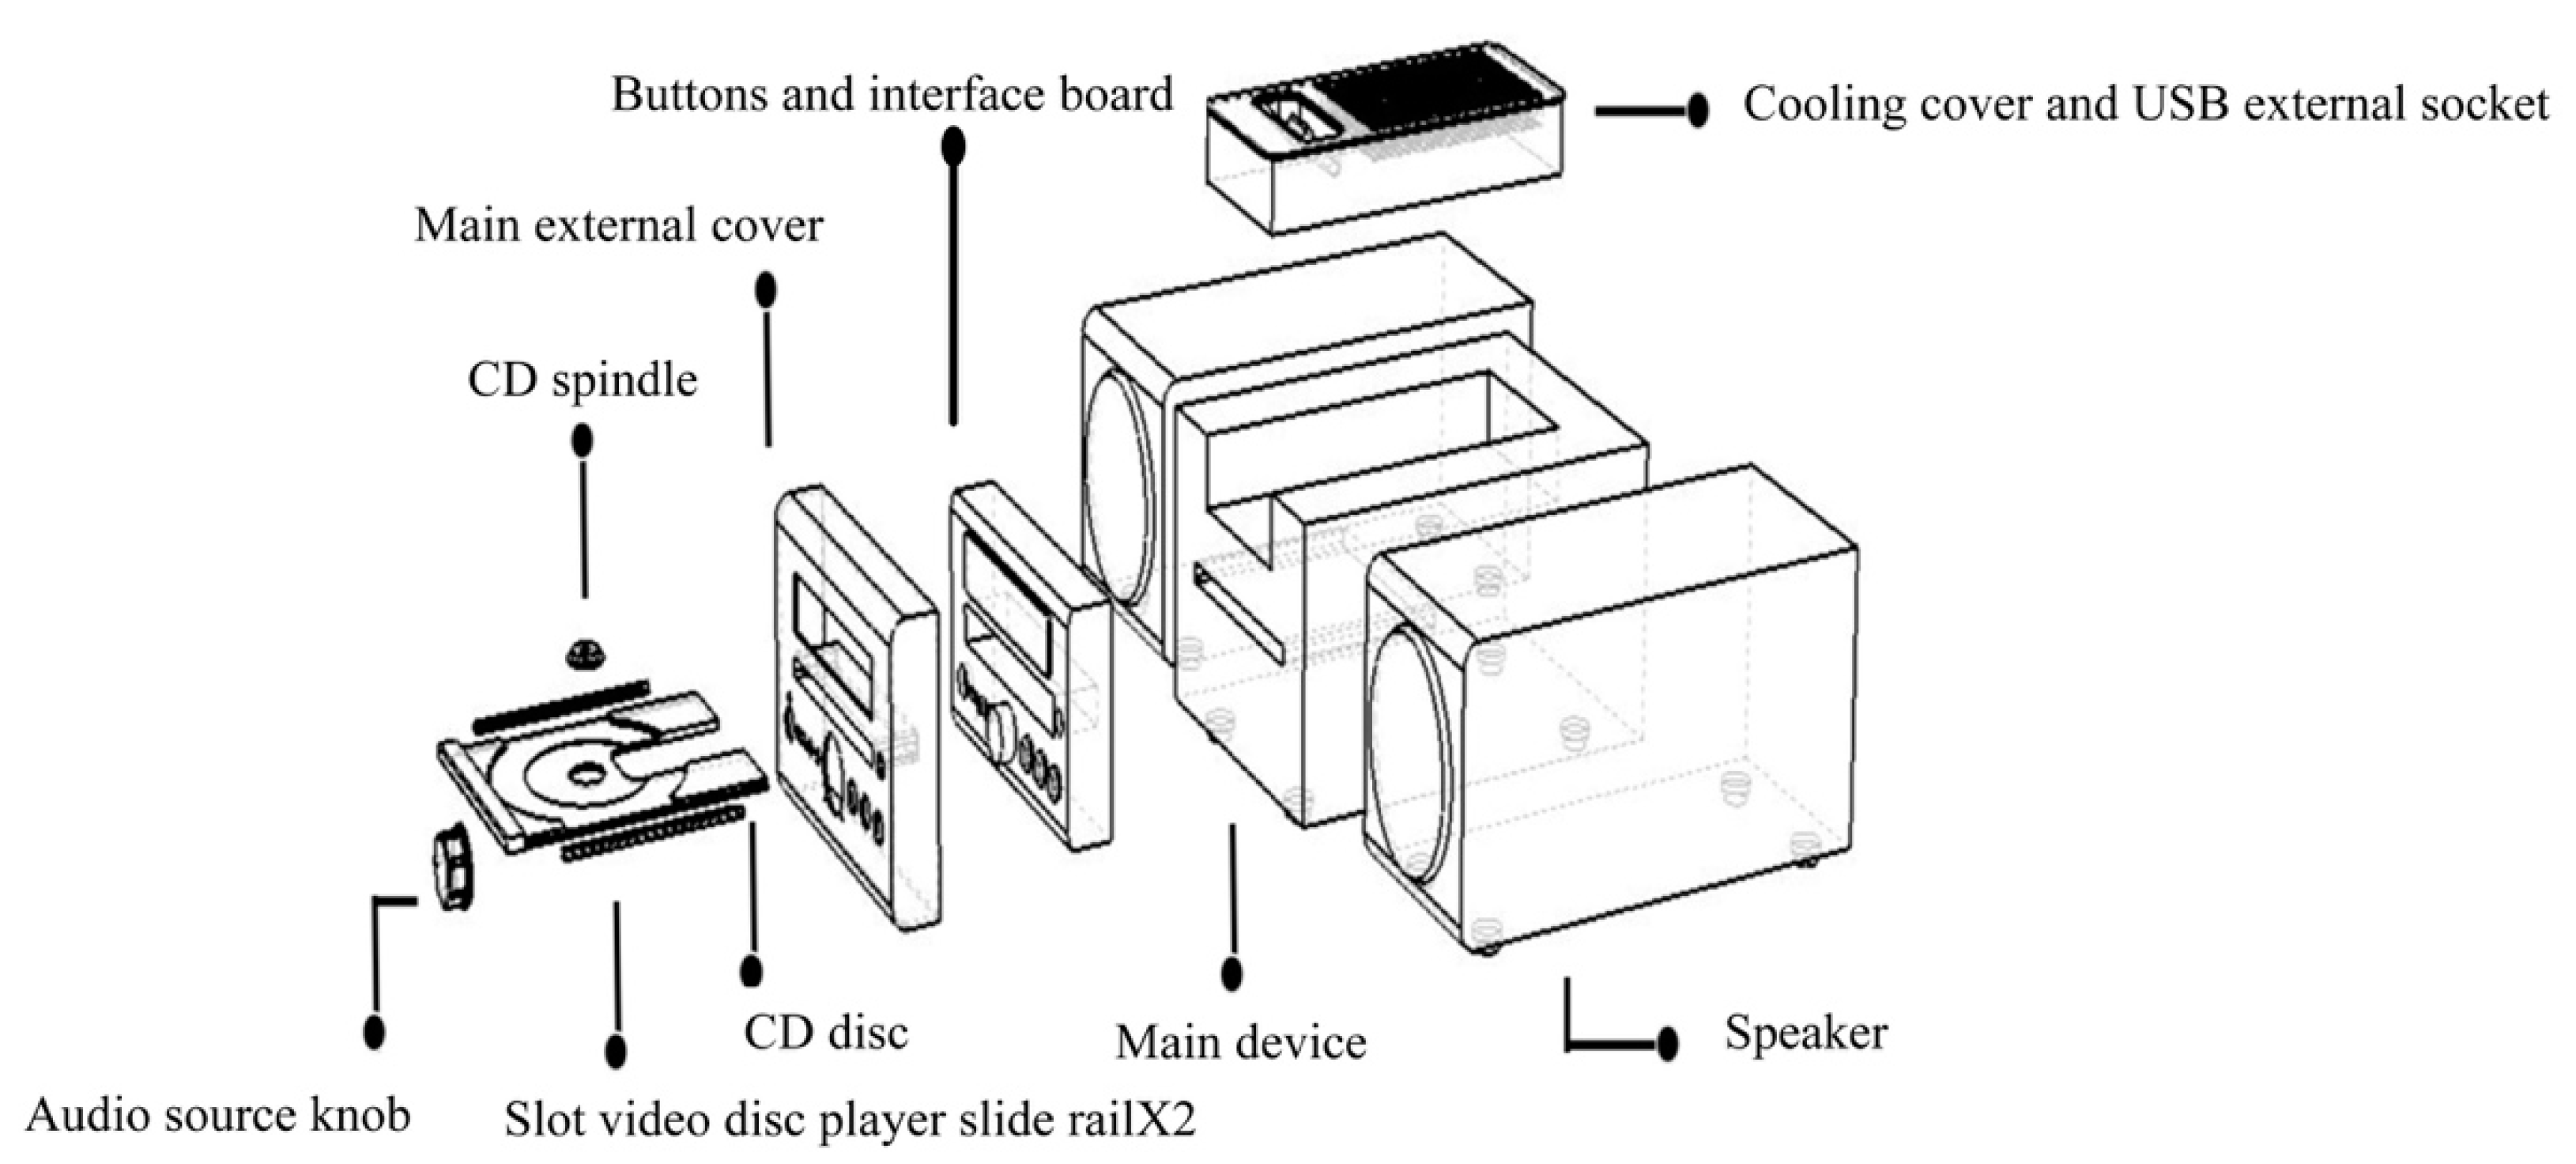
A graphical description is used to build up the assembly sequence of the assembling process. Each design idea is presented in exploded view drawing. The dimensions of each component are marked in the three-view drawing of each component. The sequence is shown in Figure 19, Figure 20, Figure 21 and Figure 22.
Idea 1:
Figure 19.
Exploded view drawing of the assembly of Idea 1.
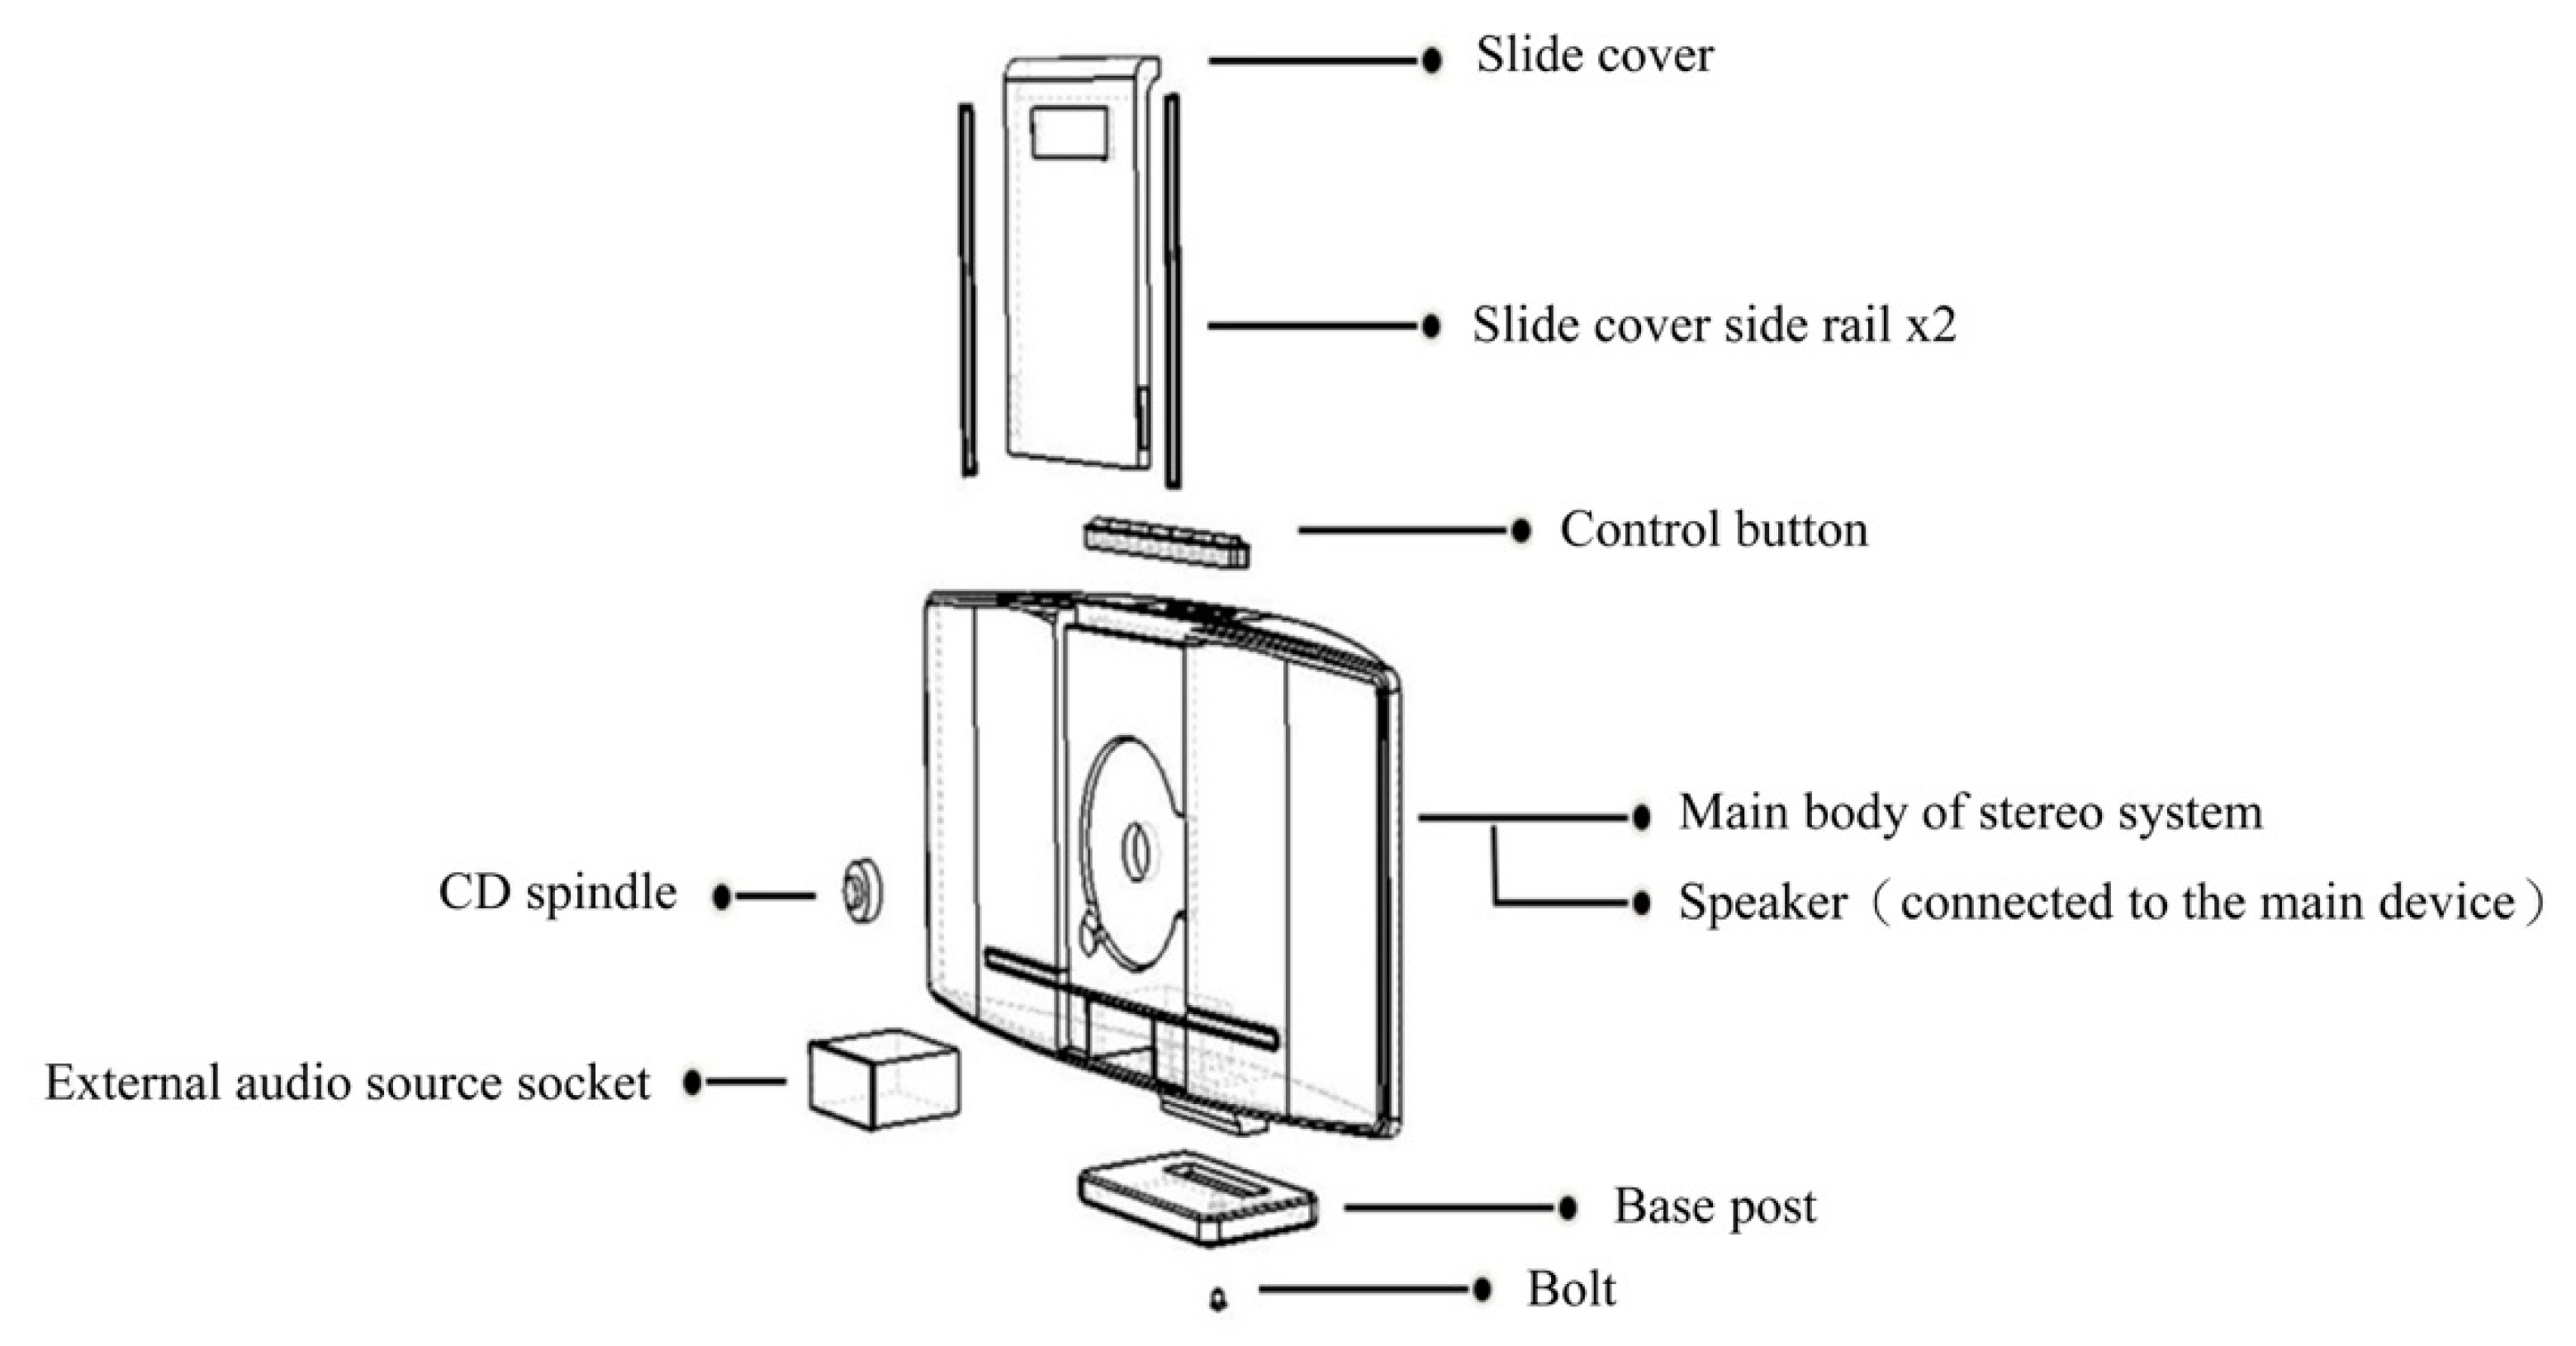
Idea 2:
Figure 20.
Exploded view drawing of the assembly of Idea 2.
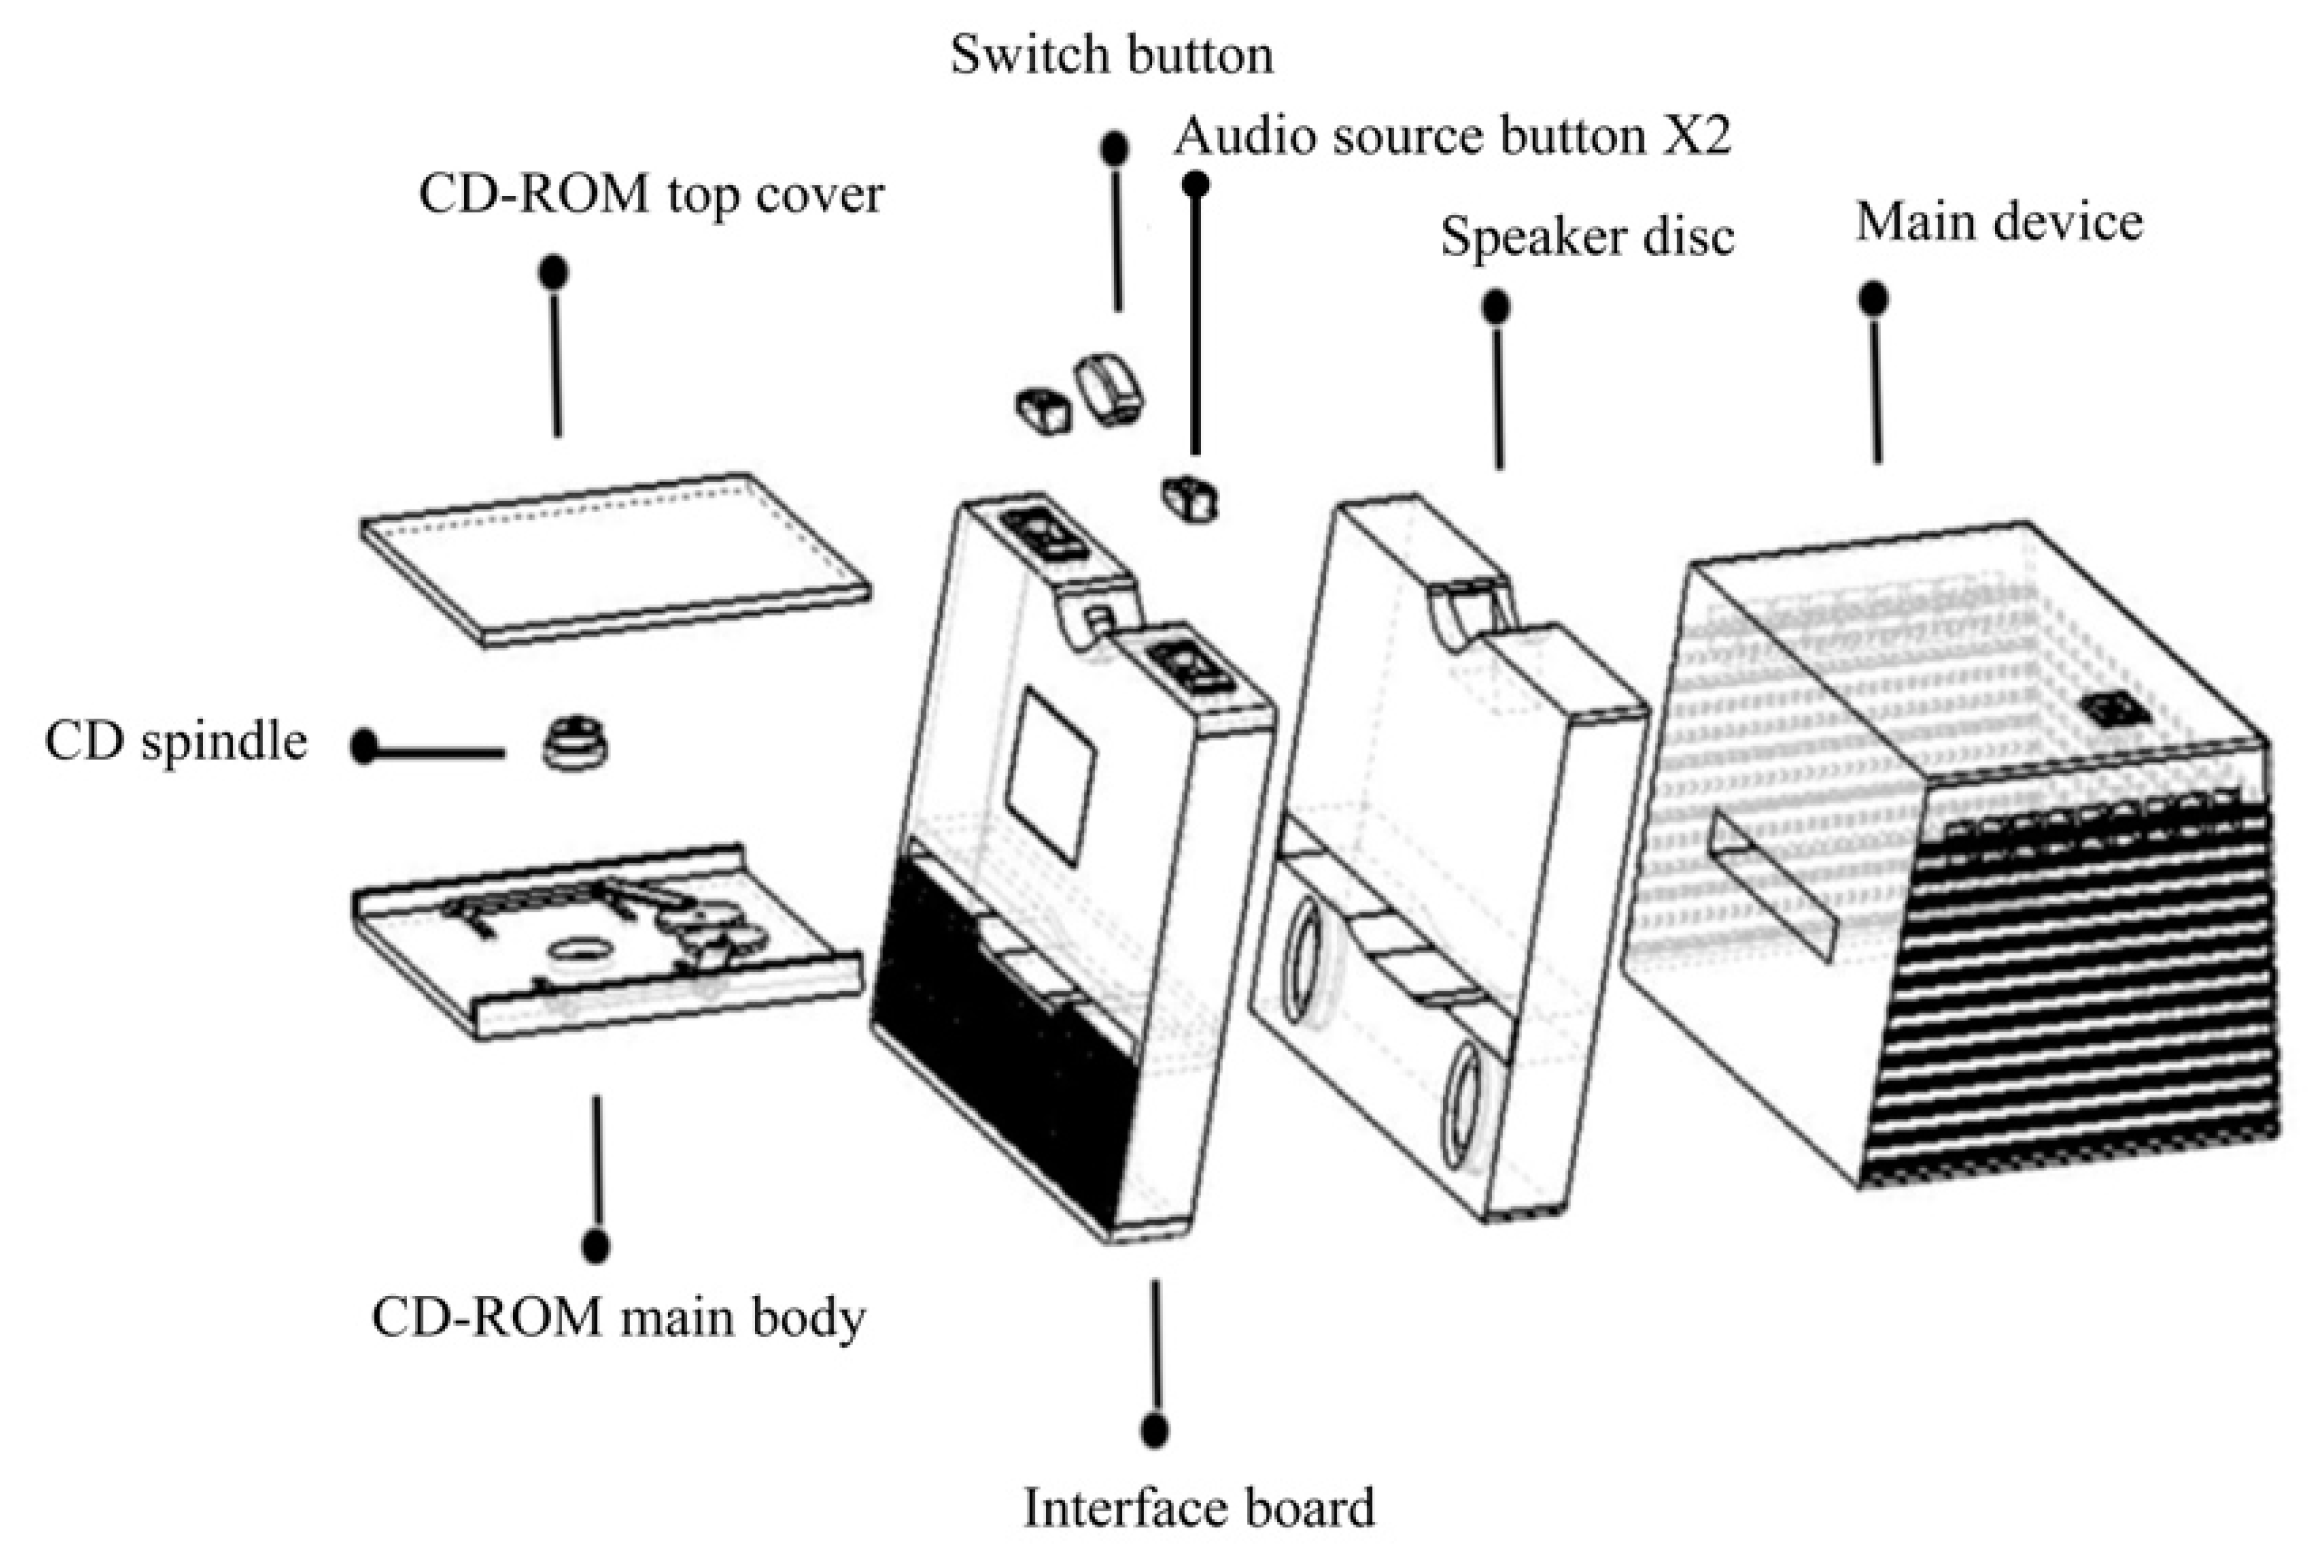
Idea 3:
Figure 21.
Exploded view drawing of the assembly of Idea 3.

Idea 4:
Figure 22.
Exploded view drawing of the assembly of Idea 4.
In order to calculate the assembly efficiency, assembly time and assembly cost according to the DFMA table, each component of these four design ideas was displayed separately and its length, width and height are marked in the drawing.
4.4.2. DFMA Analysis of the B and D of Design Ideas
After the dimensions of each component were determined in the exploded view drawing, the data was filled into the DFMA table. At the completion of this table, the total assembly time, total assembly cost and the necessity of each component of each design concept could be determined.
4.5. Analysis of the ‘Assemblability’ Evaluation Results
After the assembly time and cost of these four design ideas were determined, the change rate of the component numbers and that of the assembly time are shown in Table 9.
It is known from Table 9 that the improvement of Idea 2 is the optimal one among these four design ideas and it is more suitable for improvement from the assembly efficiency. The optimal sequence of the assembly efficiency of these four design ideas is as follows:
Idea 1 ≥ Idea4 > Idea3 > Idea 2
After that, the next section is to investigate the consideration from the usability aspect. The sequence that was obtained from the engineering aspect is included for a comprehensive investigation.
5. Correlation Between Assembly Design and Usability Operation
The influence of the items at the upper level on the child levels can be determined from the procedure in the above section. In order to make the weights at the upper level suitable for the decision of the design scheme replacement, the application of βvalue should be discussed as follows [18].
5.1. Definition of β Value
A suitable β value is affected by each item’s weighting function (Wi) and fuzzy probability (rij). Therefore, β value often varies with the weighting function (Wi) and fuzzy probability (rij).
The method of M(*,+,β) is also called the generalized weighted mean method. The definition is as follows:
An additional index β is adopted and the β value is in the range of −∞ to +∞. The β value is determined by the designers according to attribute of each problem.
Under the condition that W1 = 0.15, W2 = 0.15, W3 = 0.25, W4 = 0.175, W5 = 0.275 for the weighting functions, the variation in the membership function can be determined.
5.2. Influence of the Weighting Function
In order to test the difference between the weighting functions, the results of these five different weighting functions (W1, W2, W3, W4, W5) were reviewed as follows:
- (a)
- The efficiency factor (W1) is increased from 0.15 to 0.4 and W2 = 0.15, W3 = 0.15, W4 = 0.15, W5 = 0.15.
- (b)
- The memorability factor (W2) is increased from 0.15 to 0.4 and W1 = 0.15, W3 = 0.15, W4 = 0.15, W5 = 0.15.
- (c)
- The functional factor (W3) is increased from 0.25 to 0.4 and W1 = 0.15, W2 = 0.15, W4 = 0.15, W5 = 0.15.
- (d)
- The emotional factor (W4) is increased from 0.175 to 0.4 and W1 = 0.15, W2 = 0.15, W3 = 0.15, W5 = 0.15.
- (e)
- The satisfaction factor (W5) is increased from 0.275 to 0.4 and W1 = 0.15, W2 = 0.15, W3 = 0.15, W4 = 0.15.
5.3. Fuzzy Average Predicted Values
In order to make decisions on a single β value, the detailed fuzzy average predicted values can be determined for decision-making. They can be expressed by the following equation [19].
The β1 and β2 values are the upper and lower limits and a decision is made between these two values. ej (β) indicated the membership function of the jth design idea. The values are shown in Table 10 as follows.
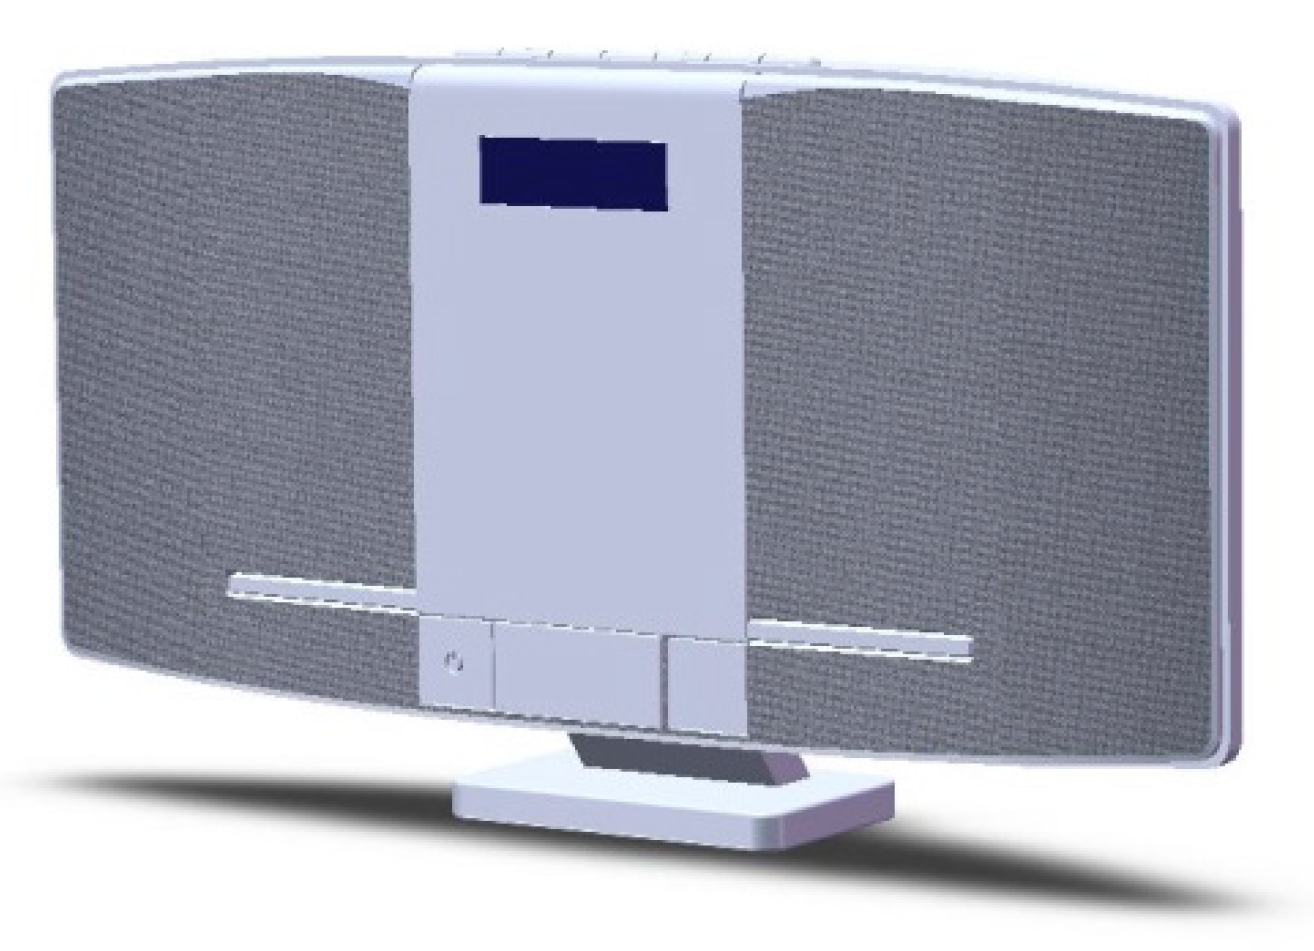
It is known from the above table that Idea 2 has the highest membership value. Therefore, by strengthening the weighting relationship between five different considerations, it can be observed that Idea 2 is the optimal and the most suitable decision. The overall product is shown in Figure 23 as follows.
5.4. Results and Analysis of the Correlation Between Assembly and Usage
Under the condition of weighting functions of W1 = 0.15, W2 = 0.15, W3 = 0.25, W4 = 0.175, W5 = 0.275, the variation in the membership functions can be determined. It is known from the consideration of usability that, the ranking of the design ideas according to the participants’ preference is as follows.
Idea 2 > Idea 1 > Idea3 > Idea4
Moreover, the comparison to the sequence of assembly design is shown in Table 11.
It is known from Table 11 that Idea 1 and Idea 3 are ranked higher from the aspect of engineering and usability. Therefore, if a company is planning to roll out new stereo systems, it is advised to extract some design elements that meet consumer demands from Idea 1 and Idea 3 for the consideration of product innovation.
6. Conclusions and Recommendation
An evaluation system for assembly design and usability operation complexity was proposed in this study. The problems that are related to product designs were handled by computers. The decision-making on the assembly sequence was assisted by the calculation of matrices according to the principles of assembly design. This approach can reduce the errors and problems due to personal factors of the operators. The potential interference problems between components of a product can also be eliminated by computer-aided analysis during the assembly process.
The fuzzy theory was applied to the decision-making from the concept development stage to sketches and finally to the product mock-ups. The participants were allowed to simulate the mechanical movements of these four different design ideas. From the scores that were given by the participants, the optimal design concept can be determined. The design ideas were ranked from the consideration of usability without considering much of the engineering aspect. Therefore, the engineering evaluation was accomplished by DFA, which can calculate the assembly efficiency, assembly time and cost of these four design ideas. From the consideration of the DFA engineering aspect, the ranking of these four design ideas can also be determined. This approach can not only improve the usability but can also enhance a product’s value from the engineering aspect for the reference of follow-up research.
The development process of each product involves the joint endeavor of many departments. Therefore, when constructing the decision model of a product, it is required to correlate the design logics prior to and after each process. The considerations include the development basis of sketches, the parametric configuration of modeling, the simulation of mechanisms of the assembly and the questionnaire design. The correlation between weighting functions and the transformation of the questionnaire into engineering parameters for further application are also important and should follow the strict rule.
In order to respond to the rapid changes in market demands, a product designer needs to develop a design and production approach that can adapt to the rapid changes in product styles. Therefore, a product designer is required to create designs that present different ways of using or different appearances in order to satisfy various consumer demands such as various types of coffee machines and speaker systems. Meanwhile, in order to broaden the usage range for consumers, a product design approach is expected to allow designers to increase or decrease the number of functional components while the product appearance remains the same. Alternatively, a different product style can be created by altering the pattern of one of the internal components such as various types of desktop computers. Under the market mechanism, a product designer needs to carry out the development of product variability in order to enhance a product’s competitiveness on the market, by satisfying different consumer usage models or different preferences.
This study aims to connect the manufacturing end to the user end so that a simple and basic assembly planning can be realized during the earlier design stage. Via the concurrent engineering concept, the product design quality and efficiency can be enhanced. Moreover, via the engineering-oriented assembly consideration and the user-oriented consideration, a designer is allowed to consider design feasibility during the earlier design stage so that the final product can be accepted and recognized by general users.
Funding
This work was supported by the Ministry of Science and Technology of the Republic of China under grant MOST 107-2635-E-468-001.
Conflicts of Interest
The authors declare no conflict of interest.
References
- Lo, C.H.; Ko, Y.C.; Hsiao, S.W. A methodology for high-performance operating interface design. Concurr. Eng. Res. Appl. 2015, 23, 110–123. [Google Scholar] [CrossRef]
- Ko, Y.C. A Study of the Hand Operating Thresholds during the Usage of an Electric Steam Iron by College Students. Eurasia J. Math. Sci. Technol. Educ. 2017, 13, 6325–6335. [Google Scholar] [CrossRef] [Green Version]
- Ko, Y.C.; Lo, C.H.; Hsiao, S.W. Interface Design Optimization by an Improved Operating Model for College Students. Eurasia J. Math. Sci. Technol. Educ. 2017, 13, 2601–2625. [Google Scholar] [CrossRef] [Green Version]
- Kwahk, J.; Han, S.H. A methodology for evaluating the usability of audiovisual consumer electronic products. Appl. Ergon. 2002, 33, 419–431. [Google Scholar] [CrossRef]
- Lee, S.; Heo, G.; Chang, S.H. Prediction of the human response time with the similarity and quantity of information. Reliab. Eng. Syst. Saf. 2006, 91, 728–734. [Google Scholar] [CrossRef]
- Lee, Y.S.; Hong, S.W.; Smith-Jackson, T.L.; Nussbaum, M.A.; Tomioka, K. Systematic evaluation methodology for cell phone user interfaces. Interact. Comput. 2006, 18, 304–325. [Google Scholar] [CrossRef]
- Heo, J.; Ham, D.H.; Park, S.; Song, C.; Yoon, W.C. A framework for evaluating the usability of mobile phones based on multi-level, hierarchical model of usability factors. Interact. Comput. 2009, 21, 263–275. [Google Scholar] [CrossRef]
- Jin, B.S.; Ji, Y.G. Usability risk level evaluation for physical user interface of mobile phone. Comput. Ind. 2010, 61, 350–363. [Google Scholar] [CrossRef]
- Chou, J.R. An Empirical Study of User Experience on Touch Mice. Eurasia J. Math. Sci. Technol. Educ. 2016, 12, 2875–2885. [Google Scholar] [CrossRef]
- Hsiao, S.W. Fuzzy set theory on car-color design Color. Res. Appl. 1994, 19, 202–213. [Google Scholar] [CrossRef]
- Barbosa, G.F.; Carvalho, J. Design for Manufacturing and Assembly methodology applied to aircrafts design and manufacturing. IFAC Proc. Vol. 2013, 46, 116–121. [Google Scholar]
- Moultrie, J.; Maier, A.M. A simplified approach to design for assembly. J. Eng. Des. 2014, 25, 44–63. [Google Scholar] [CrossRef] [Green Version]
- Tiwari, M.K.; Battaïa, O.; Dolgui, A.; Heragu, S.; Meerkov, S. Design for manufacturing and assembly/disassembly: Joint design of products and production systems. Int. J. Prod. Res. 2017, 56, 7181–7189. [Google Scholar]
- Sossou, G.; Demoly, F.; Montavon, G.; Gomes, S. An additive manufacturing oriented design approach to mechanical assemblies. J. Comput. Des. Eng. 2018, 5, 3–18. [Google Scholar] [CrossRef]
- Boothroyd, G.; Dewhurst, P. Design for Assembly: A Designer’s Handbook; Departement of Mechanical Engineering, University of Massachusetts: Wakerfield, RI, USA, 1983. [Google Scholar]
- Norman, D.A. The Design of Every Things; MIT Press, Massachusetts Institute of Technology: Cambridge, MA, USA, 1988. [Google Scholar]
- Boothroyd, G.; Dewhurst, P.; Knight, W. Product Design for Manufacture and Assembly. Comput. Aided Des. 1994, 26, 505–520. [Google Scholar] [CrossRef]
- Tuttle, B.L. Design for function: A Cornerstone for DFMA. In Proceedings of the International Forum on Product Design for Manufacture and Assembly, Newport, RI, USA, 10–11 June 1991. [Google Scholar]
- Cross, N. Engineering Design Methods; Wiley: New York, NY, USA, 1994. [Google Scholar]
- Saaty, T.L. How to Make a Decision: The Analytic Hierarchy Process; Joseph, M., Ed.; McGraw-Hill: New York, NY, USA, 1980. [Google Scholar]
- Chien, C.C.; Feng, M.; Chu, C.M. Methodology in Industrial Design; Beijing University Press: Beijing, China, 1993. [Google Scholar]
Figure 1.
Mental model of a stereo system (adapted from Norman [16]).
Figure 1.
Mental model of a stereo system (adapted from Norman [16]).
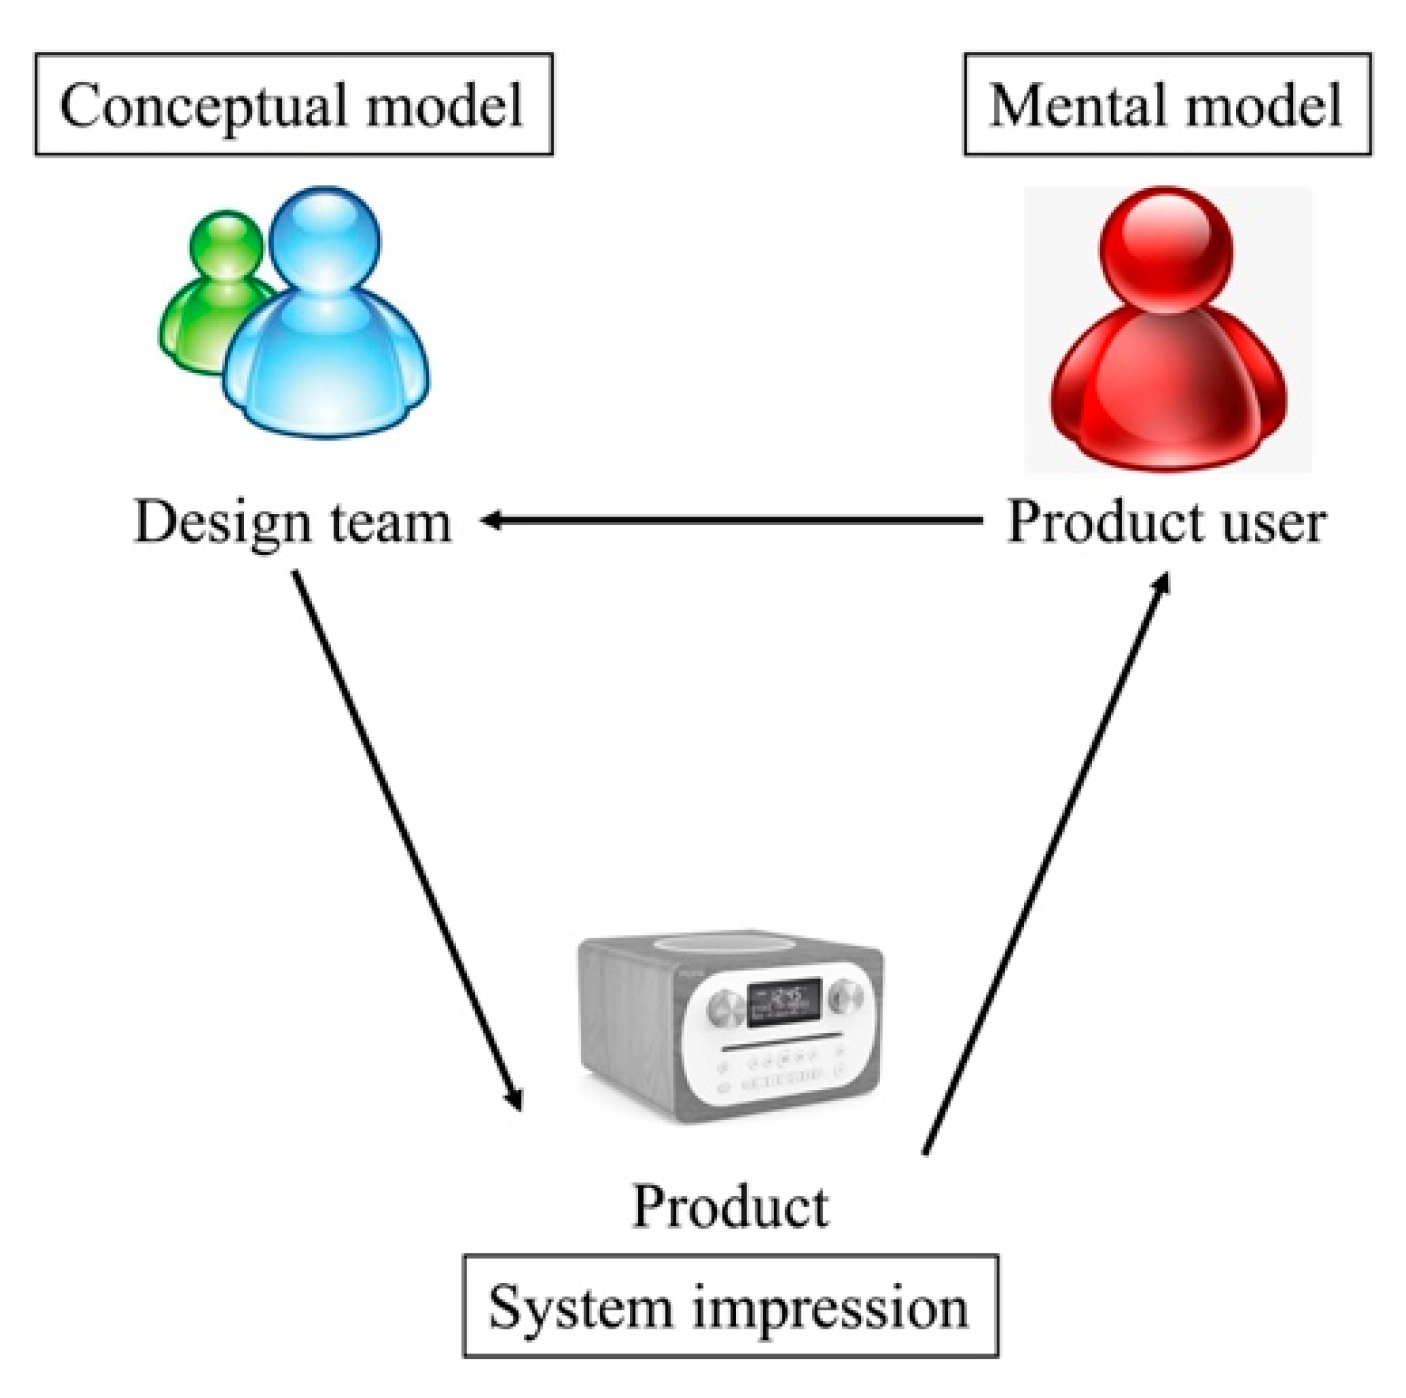
Figure 2.
Flowchart and framework of this study.
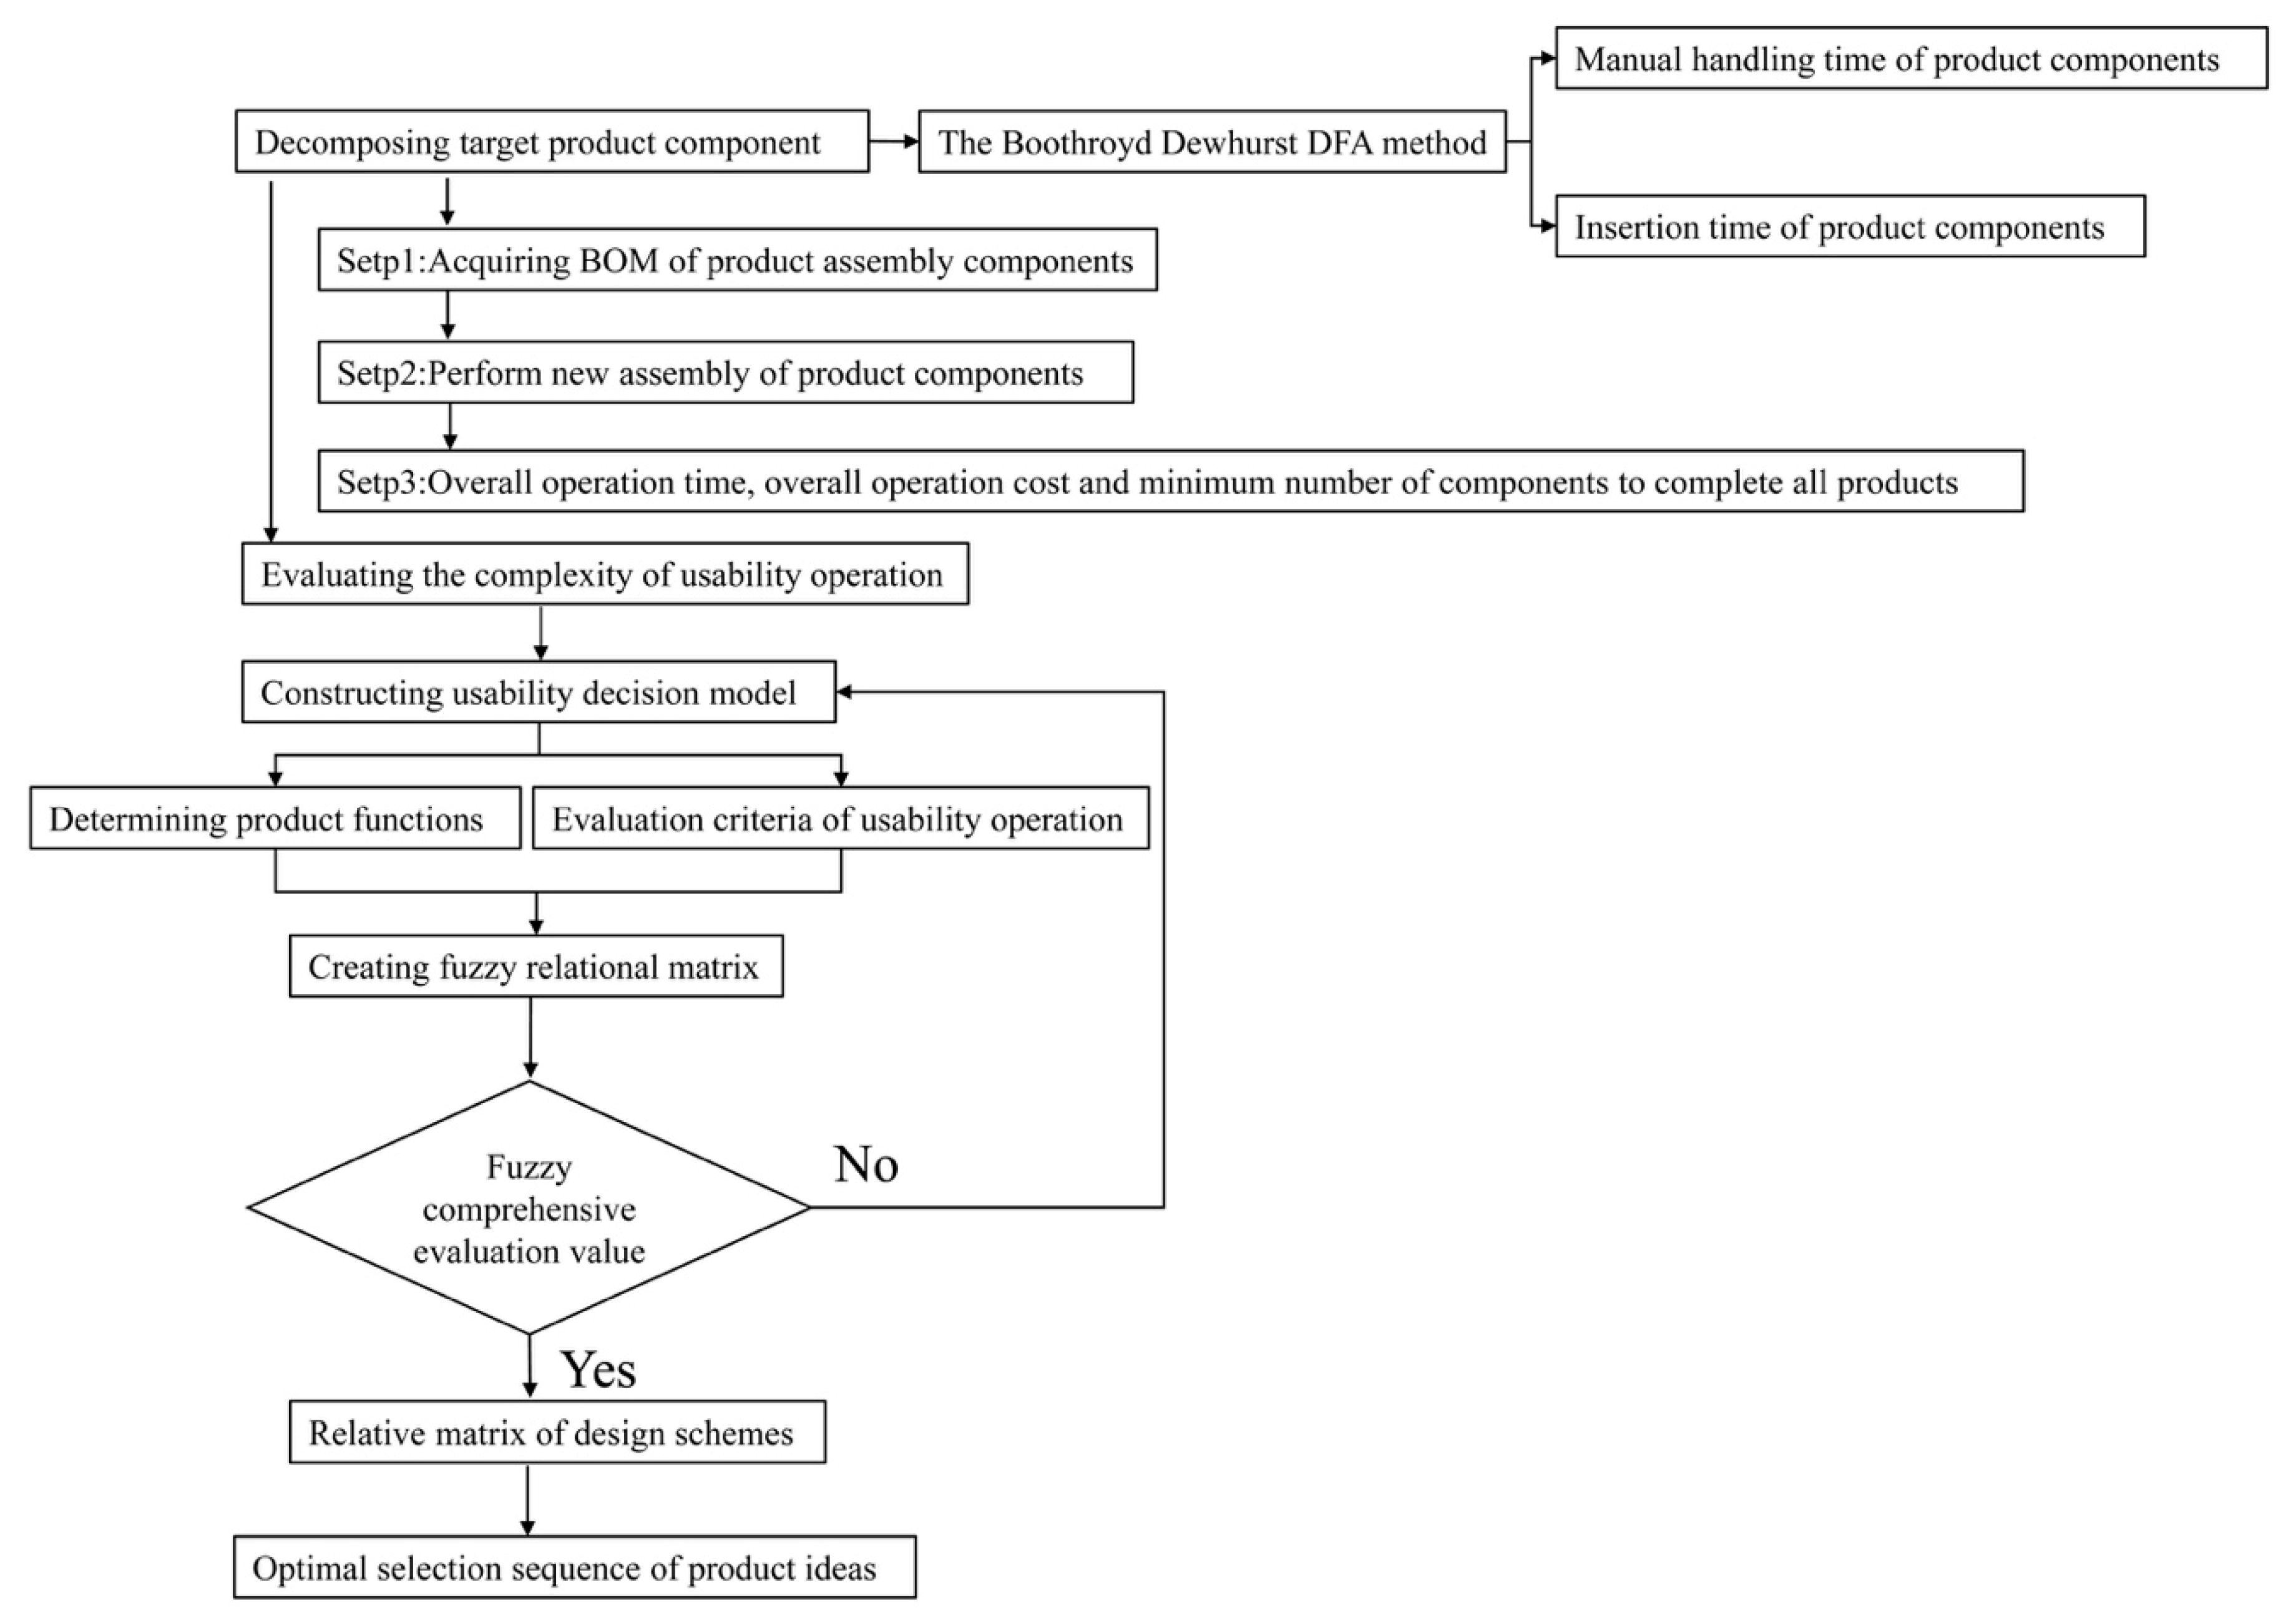
Figure 3.
Function structure diagram of a stereo system.

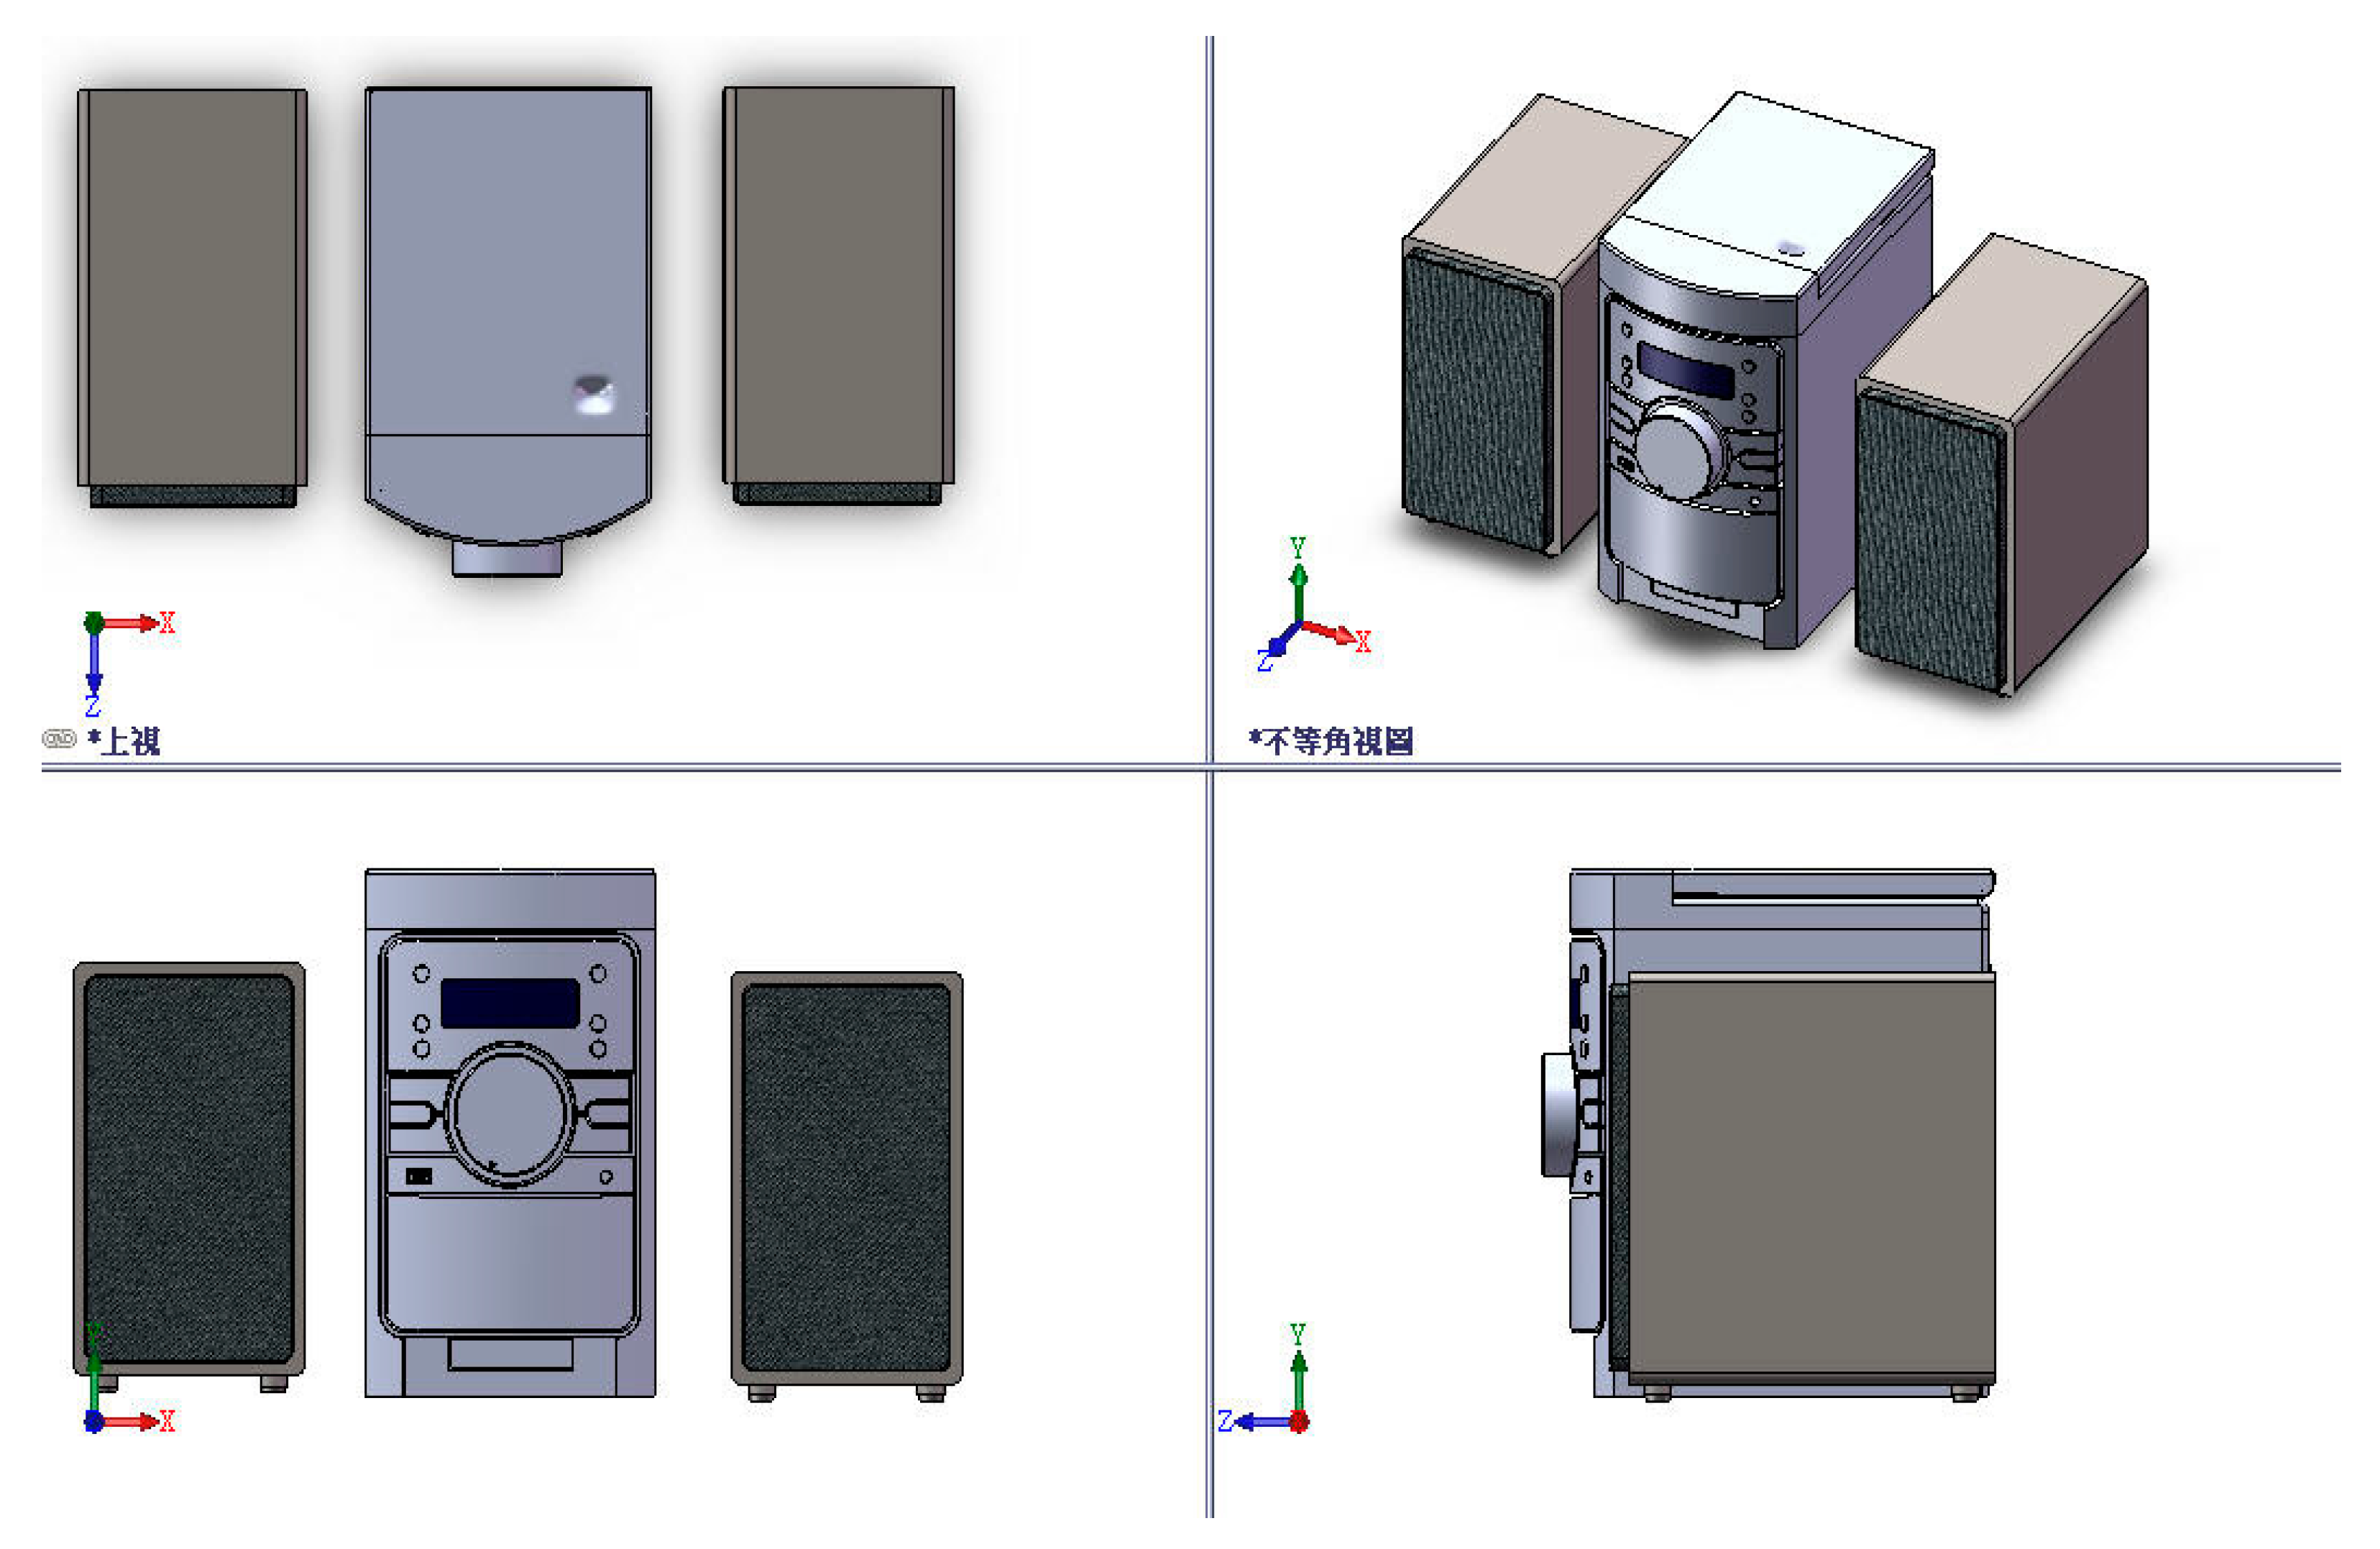
Figure 4.
Three-view drawing of Idea 1.

Figure 8.
Experimental environment.

Figure 9.
Simulation videos.
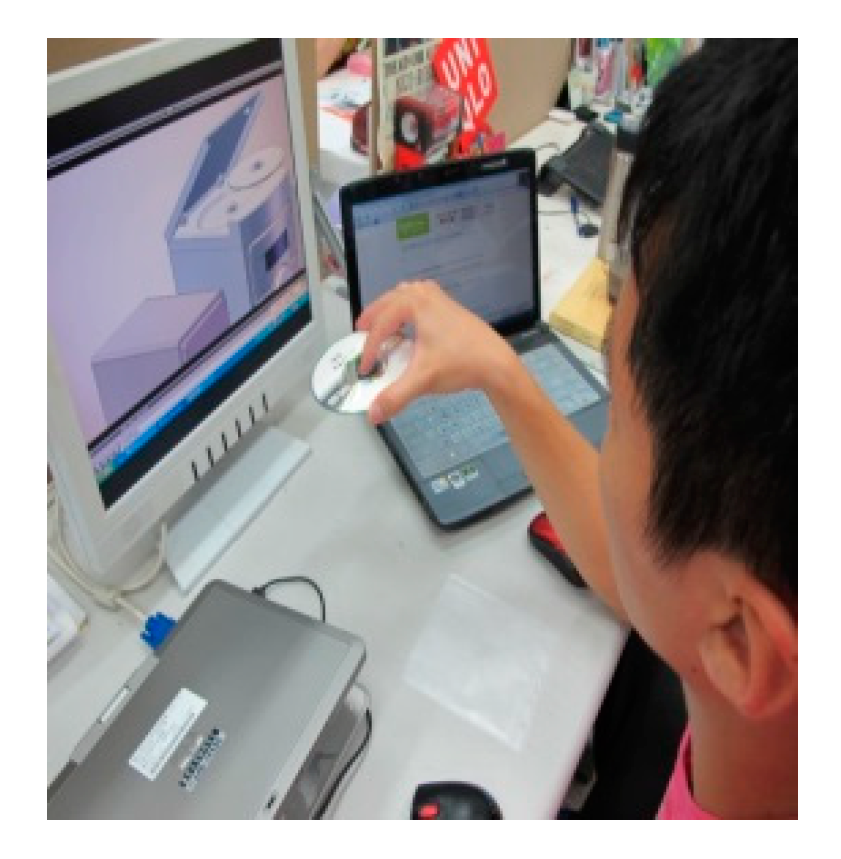
Figure 10.
Simulation videos.
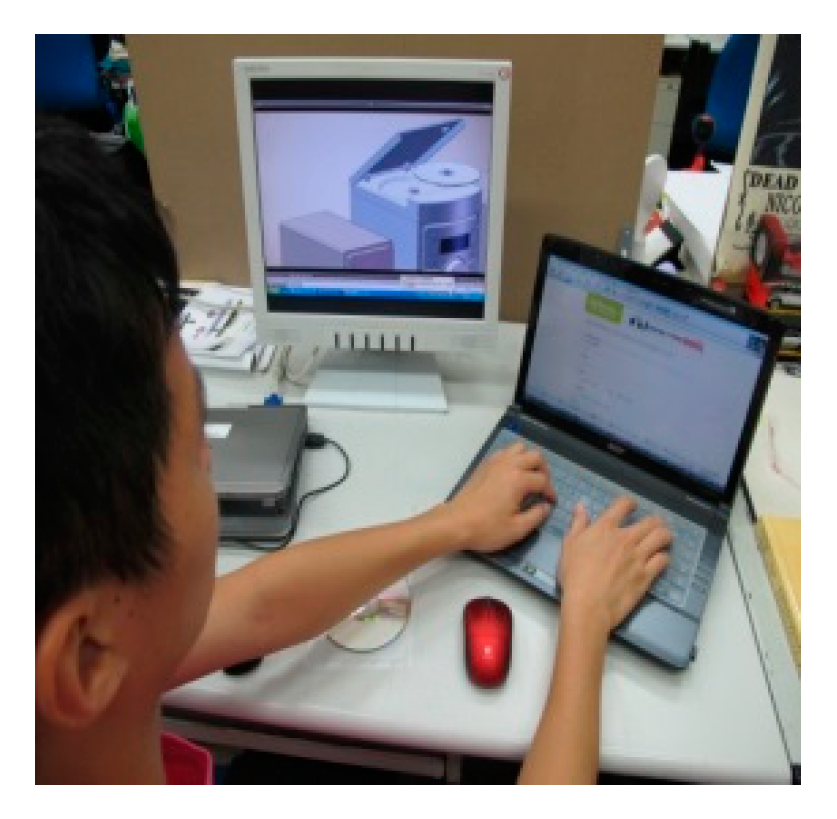
Figure 11.
Simulation videos.

Figure 12.
The objective tree of a stereo system.

Figure 13.
Hierarchy of five items of a stereo system.
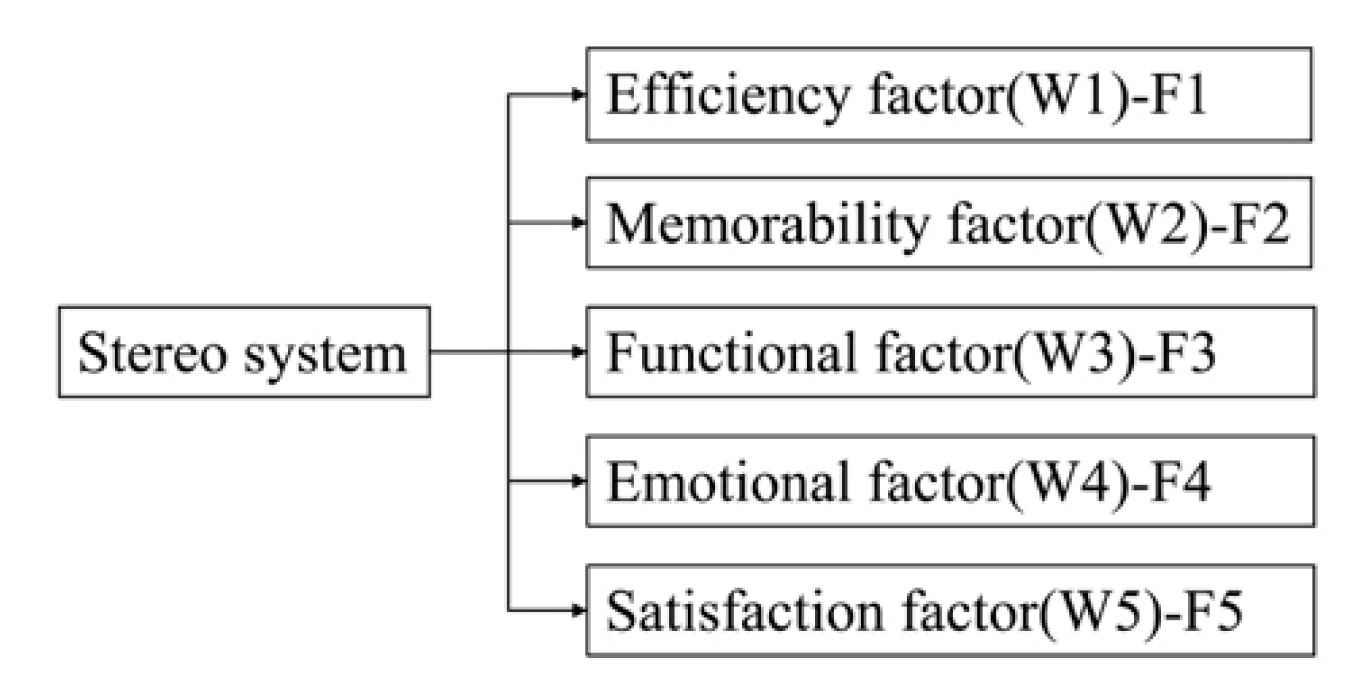
Figure 14.
Membership values of efficiency factors.

Figure 23.
Idea 2 as the optimal idea.

Table 1.
DFA evaluation table.
| A | B | C | D | E | F | G | H | I | Name of Assembly |
|---|---|---|---|---|---|---|---|---|---|
| Component code | Number of continuous operations | Manual gripping code | Estimated processing time of individual gripping of component | Manual insertion code | Manual insertion time of individual component | Overall operating time (BD+F) | Operation cost | Investigating component necessity from four problems | |
| Totals: | Tm= | Cm= | Nm= | ||||||
Table 2.
Definition of functions of a stereo system.
| Verb | Noun | B.F. (Basic Function) | S.F. (Secondary Function) | A.F. (Aesthetic Function) | U.F. (Useless Function) |
|---|---|---|---|---|---|
| Play | Music | V | |||
| Protect | Disc | V | |||
| Avoid | Vibration | V | |||
| Adjust | Volume | V | |||
| Adjust | Audio source (FM) | V | |||
| Move | Position | V | |||
| Operating | Convenience | V | |||
| Allow | Stack | V | |||
| Collect | Power cord | V | |||
| Collect | MP3 | V | |||
| Observe | Aesthetic appearance | V | |||
| Configure | Time | V | |||
| Configure | LCD color | V | |||
| Reduce | Cost | V | |||
| Reduce | Component count | V | |||
| Assemble | High efficiency | V | |||
| Assemble | Short time | V | |||
| Reduce | Noise | V | |||
| Avoid | Wrap | V | |||
| Disassemble | Convenience | V | |||
| Observe | Brief | V | |||
| Observe | Elegance | V | |||
| Observe | Brightness | V | |||
| Perceive | Comfort | V | |||
| Configure | Sound field | V | |||
| Support | Different media source | V | |||
| Position | CD player | V | |||
| Operate | Interface | V | |||
| Merge | Speaker | V | |||
| Avoid | Moisture | V |
Table 3.
Morphological chart method.
| Necessary Function | Sub-Function | |||
|---|---|---|---|---|
| P1 Way of placing the CD | P11 Open-lid Type | P12 Slot type | P13 Suction type | P14 Slide type |
| P2 CD-ROM location | P21 Top | P22 Bottom | P23 Front | P24 Middle |
| P3 Control button style | P31 Square | P32 Round | P33 Triangular | P34 Oval |
| P4 LCD dimensions and size | P41 Overall | P42 3/4 area | P43 1/2 area | P44 1/4 area |
| P5 Control button location | P51 Top | P52 Bottom | P53 Front | P54 Edge |
| P6 Mp3/iPhone device | P61 Yes | P62 No | ||
| P7 Speaker | P71 Integrated | P72 Separated | ||
| P8 Stacked design | P81 Allowed | P82 Not allowed | ||
| P9 Remote control | P91 Yes | P92 No | ||
Table 4.
Product specifications of Idea 1.
| Main Dimensions (mm) | 140 (Width) | 230 (Height) | 216 (Depth) |
|---|---|---|---|
| Speaker dimensions (mm) | 130 | 230 | 150 |
| Product weight in package (kg) | 4.75 | ||
| LCD dimensions (mm) | 70 | 22 | R = 2 |
| Input interface | USB socket | Headset audio source input | iPhone |
| Output interface | Speaker output socket | ||
Table 5.
Background information of the participants.
| Variable | Count | Percentage (%) | |
|---|---|---|---|
| Gender | Male | 16 | 53.3% |
| Female | 14 | 46.7% | |
| Age | 20~30 years old | 30 | 100% |
| More than 30 years old | 0 | 0% | |
| Educational background | Design related | 15 | 50% |
| Not design related | 15 | 50% |
Table 6.
Weights of five items.
| Item | F1 | F2 | F3 | F4 | F5 | |||
|---|---|---|---|---|---|---|---|---|
| F1 | 2 | 1 | 2 | 1 | 6 | 40 | 0.15 | |
| F2 | 2 | 1 | 2 | 1 | 6 | 40 | 0.15 | |
| F3 | 3 | 3 | 3 | 1 | 10 | 40 | 0.25 | |
| F4 | 2 | 2 | 1 | 2 | 7 | 40 | 0.175 | |
| F5 | 3 | 3 | 3 | 2 | 11 | 40 | 0.275 |
Table 7.
Weights of all items.
| Efficiency Factor (W1) 0.15 | Precision of the audio source button (W11) | 0.375 |
| Message reception promptness (W12) | 0.25 | |
| Message reception clarity (W13) | 0.25 | |
| Fast taking/placing CD (W14) | 0.125 | |
| Memorability Factor (W2) 0.15 | Visibility of button design (W21) | 0.375 |
| Complexity of interface design (W22) | 0.125 | |
| CD-ROM’s location and external style and dimensions (W23) | 0.29 | |
| CD-ROM’s way of mechanical operation (W24) | 0.21 | |
| Functional Factor (W3) 0.25 | Other ways of placement (W31) | 0.29 |
| Adequacy of the product’s spatial arrangement (W32) | 0.29 | |
| Angle of product’s speakers and the consistency of sound (W33) | 0.17 | |
| Easy moving (W34) | 0.25 | |
| Emotional Factor (W4) 0.175 | Novelty of style (W41) | 0.25 |
| Preference of style design (W42) | 0.25 | |
| Audible added value of the style (W43) | 0.17 | |
| Enhanced overall atmosphere when listening to music (W44) | 0.33 | |
| Satisfaction Factor (W5) 0.275 | Proportion and arrangement of the product’s screen and speakers (W51) | 0.33 |
| The frequency of using other functions in addition to CD (W52) | 0.25 | |
| Durability (W53) | 0.25 | |
| Cleanness (W54) | 0.17 |
Table 8.
Average measured values from the 30 questionnaire copies.
| Idea 1 | Idea 2 | Idea 3 | Idea 4 | |
|---|---|---|---|---|
| Precision of the audio source button (W11) | 0.650 | 0.517 | 0.783 | 0.333 |
| Message reception promptness (W12) | 0.692 | 0.683 | 0.658 | 0.625 |
| Message reception clarity (W13) | 0.583 | 0.525 | 0.708 | 0.525 |
| Fast taking/placing CD (W14) | 0.525 | 0.358 | 0.533 | 0.842 |
| Visibility of button design (W21) | 0.683 | 0.425 | 0.733 | 0.500 |
| Complexity of interface design (W22) | 0.183 | 0.450 | 0.350 | 0.492 |
| CD-ROM’s location and external style and dimensions (W23) | 0.333 | 0.608 | 0.308 | 0.267 |
| CD-ROM’s way of mechanical operation (W24) | 0.517 | 0.758 | 0.383 | 0.383 |
| Other ways of placement (W31) | 0.517 | 0.588 | 0.677 | 0.333 |
| Adequacy of the product’s spatial arrangement (W32) | 0.300 | 0.642 | 0.783 | 0.475 |
| Angle of product’s speakers and the consistency of sound (W33) | 0.483 | 0.792 | 0.567 | 0.525 |
| Easy moving (W34) | 0.242 | 0.567 | 0.525 | 0.467 |
| Novelty of style (W41) | 0.300 | 0.842 | 0.417 | 0.508 |
| Preference of style design (W42) | 0.533 | 0.755 | 0.617 | 0.422 |
| Audible added value of the style (W43) | 0.300 | 0.383 | 0.333 | 0.442 |
| Enhanced overall atmosphere when listening to music (W44) | 0.608 | 0.667 | 0.683 | 0.533 |
| Proportion and arrangement of the product’s screen and speakers (W51) | 0.642 | 0.583 | 0.667 | 0.408 |
| The frequency of using other functions in addition to CD (W52) | 0.533 | 0.658 | 0.700 | 0.492 |
| Durability (W53) | 0.700 | 0.400 | 0.733 | 0.683 |
| Cleanness (W54) | 0.617 | 0.567 | 0.658 | 0.525 |
Table 9.
Comparison of assembly efficiency of each component.
| Idea 1 | Idea 2 | Idea 3 | Idea 4 | |
|---|---|---|---|---|
| Percentage of change in the component numbers (%) | Reduced by 12% | Reduced by 33% | Reduced by 22% | Reduced by 9% |
| Percentage of change in the assembly time (%) | Reduced by 10% | Reduced by 24% | Reduced by 17% | Reduced by 14% |
Table 10.
Fuzzy average predicted values of four design ideas.
| Weight | Mean Fuzzy Probability | |||
|---|---|---|---|---|
| Idea 1 | Idea 2 | Idea 3 | Idea 4 | |
| W1 = 0.4 | 0.612 | 0.66 * | 0.63 | 0.48 |
| W2 = 0.15 | ||||
| W3 = 0.15 | ||||
| W4 = 0.15 | ||||
| sW5 = 0.15 | ||||
| W1 = 0.15 | 0.594 | 0.646 * | 0.573 | 0.589 |
| W2 = 0.4 | ||||
| W3 =0.15 | ||||
| W4 = 0.15 | ||||
| W5 = 0.15 | ||||
| W1 = 0.15 | 0.592 | 0.687 * | 0.555 | 0.581 |
| W2 = 0.15 | ||||
| W3 = 0.4 | ||||
| W4 = 0.15 | ||||
| W5 = 0.15 | ||||
| W1 = 0.15 | 0.632 | 0.699 * | 0.596 | 0.531 |
| W2 = 0.15 | ||||
| W3 = 0.15 | ||||
| W4 = 0.4 | ||||
| W5 = 0.15 | ||||
| W1 = 0.15 | 0.631 | 0.682 * | 0.586 | 0.491 |
| W2 = 0.15 | ||||
| W3 = 0.15 | ||||
| W4 = 0.15 | ||||
| W5 = 0.4 | ||||
(* indicated the highest value of correlation).
Table 11.
Comparison of the correlation between assembly design and usability.
| Ranking | ||||
|---|---|---|---|---|
| Complexity of usability operation | Idea 2 | Idea 1 | Idea3 | Idea4 |
| Assembly design | Idea 1 | Idea4 | Idea3 | Idea 2 |
© 2019 by the author. Licensee MDPI, Basel, Switzerland. This article is an open access article distributed under the terms and conditions of the Creative Commons Attribution (CC BY) license (http://creativecommons.org/licenses/by/4.0/).
Share and Cite
MDPI and ACS Style
Ko, Y.-C. Application of Fuzzy Theory to the Evaluation Model of Product Assembly Design and Usability Operation Complexity. Appl. Sci. 2019, 9, 4055. https://doi.org/10.3390/app9194055
AMA Style
Ko Y-C. Application of Fuzzy Theory to the Evaluation Model of Product Assembly Design and Usability Operation Complexity. Applied Sciences. 2019; 9(19):4055. https://doi.org/10.3390/app9194055
Chicago/Turabian StyleKo, Ya-Chuan. 2019. "Application of Fuzzy Theory to the Evaluation Model of Product Assembly Design and Usability Operation Complexity" Applied Sciences 9, no. 19: 4055. https://doi.org/10.3390/app9194055
Note that from the first issue of 2016, this journal uses article numbers instead of page numbers. See further details here.