The Improvement of an Islanding Detection Method Based on the Perturbation Signal in Case of a Multi-Photovoltaic Operation


1
Graduate School of Engineering and Science, Shibaura Institute of Technology, Tokyo 135-8548, Japan
2
Department of Power System, Hanoi University of Science and Technology, Hanoi 11615, Vietnam
3
Department of Electrical Engineering, Shibaura Institute of Technology, Tokyo 135-8548, Japan
*
Author to whom correspondence should be addressed.
Appl. Sci. 2019, 9(19), 4054; https://doi.org/10.3390/app9194054
Submission received: 22 August 2019
/
Revised: 24 September 2019
/
Accepted: 24 September 2019
/
Published: 27 September 2019
(This article belongs to the Special Issue DC & Hybrid Micro-Grids)
Abstract
:Islanding phenomenon is one of the consequences of the emergence and development of microgrids in the power system. Injected signal cancellation is a common problem in a multi- distributed generation that has a significant influence on active islanding detection methods. In this study, this issue was analyzed by injecting a perturbation signal in the multi-photovoltaic system. Furthermore, the promising solution to eliminate injected signal cancellation was proposed in this paper. The solution was validated through mathematical explanations and simulation results.
1. Introduction
In recent years, the penetration of dispersed generations (DGs) such as photovoltaic and wind energy in electricity systems has significantly increased. Some of the distributed generations are natively DC. The developments of DC loads and storage technologies have also considerably increased [1]. The DC grid has much more advantages such as higher system efficiency, easier integration and lower losses due to reduced conversion devices than the AC grid [2,3,4,5]. Therefore, the DC grid has been rapidly increasing in the power system. One of the major challenges with DC grid-connected DG is the detection of the unintentional islanding phenomenon. According to the IEEE 929-2000 standard [6], islanding problem occurs when the distributed network isolated from the main utility and the loads are supplied by DGs only. Based on this standard, the islanding phenomenon must be detected within 2 s to prevent damage to electrical devices and ensure the safety of maintenances. Nowadays, islanding detection has received considerable attention through recent studies.
In [7], a novel islanding detection method based on two additional compensators and positive feedback of active and reactive power control loops. The method does not have a non-detection zone, no affect on power quality and normal operation of synchronous DG. Because of it need additional compensators, it may cause the method to complicate and costly.
A novel islanding detection method for micro-grid was proposed in [8]. The method can detect islanding phenomenon in hardest condition (low active and reactive power mismatches) by using a differential morphological filter (a dilation–erosion differential filter (DED)) of the RMS signal (DEDFOR) at the point of common coupling. The method has a small non-detection zone (NDZ), fast detection time, and high accuracy. However, the method is used for double-fed induction generators (DFIGs) system.
A new passive islanding detection includes in Smart Islanding Detector (SmartID) was proposed in [9]. It combines with classical voltage and frequency relays to make a better anti-islanding protection system. The method is used to backup in case of the classical method fail. However, the combination of SmartID and classical relays also complicated.
In [10], a new islanding detection strategy for low-voltage inverter-interfaced microgrids was presented. This strategy was based on adaptive neuro-fuzzy inference system (ANFIS). The ANFIS method monitors seven inputs measured at the point of common coupling (PCC) such as root-mean square of voltage and current (RMSU and RMSI), total harmonic distortion of voltage and current (THDU and THDI), frequency, and active and reactive powers based on practical measurement in a real microgrid. The ANFIS method detects islanding condition by using its pattern recognition capability and nonlinear mapping of relation between input signals.
A novel hybrid islanding detection method for grid-connected microgrids in the case of multiple inverter-based distributed generators was proposed in [11]. This method was based on the slope of linear reactive power disturbance (RPD) and four passive criteria, namely, voltage variation, voltage unbalance, rate of change of frequency and correlation factor between the RPD and frequency variation. Islanding is detected when the frequency exceeds its thresholds. However, the cancellation issue in the case of multiple inverter-based distributed generators was ignored in this study.
In [12], a new method used the transient response of voltage waveform to detect the islanding condition. This method was based on two new criteria, namely, the peak of the transient index value (TIV) and the positive sequence superimposed phase angle at the point of common coupling.
In [13], a method based on Kalman filter (KF) was proposed to extract and filter the harmonic components of the measured voltage signal at distributed generation terminals. The islanding detected by the selected harmonic distortion (SHD) was calculated by the KF after the different changes in the power system. This changes was detected by a residual signal.
An unintentional islanding detection method based on the combination of the main criterion of switch status and the auxiliary criterion based on the no-current and difference-voltage criteria was proposed for “hand-in-hand” DC distribution network in [14]. However, the power supply reliability of the DC distribution network must be considered.
A novel islanding detection approach based on the relationship between the angular frequency and the derivative of the equivalent resistance observed from the small-scale synchronous generators in microgrids, including small-scale synchronous generators, was proposed in [15]. The derivative of the equivalent resistance observed from the small-scale synchronous generators approaches to zero when the islanding occurs in small-scale synchronous generator side.
In [16], we proposed an active islanding detection method by injecting perturbation signal to make the power imbalance and voltage fluctuation exceed the thresholds faster and easier in the islanding condition. This method can rapidly and efficiently detect the islanding condition. Howerver, the cancellation problem when using this method in multi-PV operation has not been considered.
Many converters are connected in parallel because of their capacity limitation in a large-scale solar system. Therefore, the cancellation issue can occur in a multi-PV operation.
On basis of the literature, no research has been conducted on the cancellation issue in multi-DG operation when using active islanding detection method. In this study, the cancellation issue when using the active Islanding Detection Method (IDM) in [16] is analyzed. Moreover, the solution improves the islanding detection method in [16] to eliminate the injected signal cancellation is proposed and verified by Matlab/Simulink. The system in this paper is the DC grid connected-photovoltaic system. The rest of this paper is organized as follows: The system description and cancellation problem are presented in Section 2. The simulation results of the cancellation problem is analyzed in Section 3. The solution for this problem is shown in Section 4. The conclusions are presented in Section 5.
2. System Description and Cancellation Problem
The injected signal cancellation in the DC grid-connected photovoltaic system is analyzed in this section.
2.1. System Description
As mentioned in the previous chapter, the cancellation signal occurs in multi-PV operation. To simplify, an operation system with two PVs is used for analysis, as shown in Figure 1.
Figure 2 shows the diagram of the system under analysis. This system consists of a 100 kW PV array, output capacitor C, DC/DC converter with maximum power point tracking (MPPT), and islanding detection program. The DC load is shown as an equivalent resistance and the DC bus is modeled as a constant voltage source. The specifications of the PV module are listed in Table 1. The inverter is used to connect the AC and DC grids. A VSC controller is modeled as a voltage source converter (VSC-detail model) to regulate the DC bus voltage (keep stable at 500 V).
The sampling time is = 5 × 10. The simulation time is 2 s and the simulation is performed with the two following steps:
- Step 1: Start the injection of perturbation signal at 0.4 s after system startup.
- Step 2: The islanding event is activated at 1.2 s after system startup by disconnecting the AC grid.
2.2. Injected Signal Cancellation
By using the proposed IDM in [16] in the multi-PV system, cancellation can occur when the perturbation signals of PV1 and PV2 are in the opposite positions, as shown in Figure 3.
- The perturbation signal factors at normal condition in normal case are n = 0.9–1.1.
- The perturbation signal factors at normal condition in the cancellation case are n = 1.1–0.9 for PV1 and n = 0.9–1.1 for PV2.
Figure 4 describes in detail on how the injected signal cancellation can occur.
The cancellation problem is explained below:
Based on the equation in [16], after islanding, the DC-link voltage is shown in Equation (1):
and
where:
- is the DC-link voltage at time t.
- is the initial DC-link voltage.
- is the photovoltaic current at time t.
- is the output DC/DC converter current perturbation signal.
- is the perturbation factor generated by the islanding program.
- D is the duty cycle.
- R is the DC load (resistor).
- C is the capacitor.
The DC-link voltage at perturbation from PV1 is as follows:
where: is the DC-link voltage at time t when perturbation signal 1 is injected and, is the perturbation signal of PV1.
The DC-link voltage at perturbation from PV2 is shown in Equation (4):
where: is the DC-link voltage at time t when perturbation signal 2 is injected.
The DC-link voltage without injecting the perturbation signal is as follows:
where: is the DC-link voltage without perturbation signal at time t after islanding occurs.
The fluctuation of DC-link voltage caused by the perturbation signal from PV1 is shown in Equation (6):
The Equation (6) is simplified
The fluctuation of DC-link voltage caused by the perturbation signal from PV2 is shown in Equation (10):
The Equation (10) is simplified
If = 1 (without perturbation signal), = 1.1, and = 0.9, then Equation (15) is satisfied. Consequently, the fluctuation of DC-link voltage is cancelled because the perturbation signals from PV1 and PV2 have the same value but opposite directions. Thus, the DC-link voltage fluctuations have been cancelled.
The simulation result verifies the problem.
3. Simulation Testing Scenarios and Results
The system is tested under the balance case between the DC load and PV in Table 2, and the procedure is as follows:
- The perturbation signal is injected at t = 0.4 s after the system startup.
- The islanding condition occurs at t = 1.2 s after the system startup.
The model parameters are as follows:
- The maximum power (each PV) is = 50 kW.
- Switching frequency of the converter is = 10 kHz.
- The DC bus voltage is = 500 V.
- The under voltage threshold is = 450 V.
- The islanding threshold is 0.2346 [16].
- The perturbation duration is T = 8 ms.
- The perturbation signal factors at normal condition in the normal case are n = 0.9–1.1.
- The perturbation signal factors at normal condition in the cancellation case are n = 1.1–0.9 for PV1 and n = 0.9–1.1 for PV2.
For the first test, the IDM will test two scenarios: normal and cancellation. The results are shown in the Figure 5 and Figure 6.
The result in the normal scenario is shown in Figure 5, and the cancellation scenario result is shown in Figure 6. Figure 5 shows that the islanding condition is detected after 56(ms). The IDM cannot detect the islanding condition when the cancellation problem occurs. In closing, injecting two perturbation signals in the opposite directions can make the cancellation occur completely.
The impact of the injected signal cancellation on the islanding detection method is significant based on the results. The islanding detection method cannot detect the islanding phenomenon in the cancellation scenario.
4. Improved Islanding Detection Method Based on the Proposed Solution
According to the previous section, the cancellation problem occurs by using two perturbations in the opposite directions. The main meaning of the solution is how to prevent the occurrence of cancellation.
First, the beginning of the proposed IDM uses the perturbation signal in the range n = 0–1.1. As the range of perturbation signal includes values over and below the normal value (n = 1), the injected signal cancellation caused by the perturbation signals in opposite directions can occur.
Second, to prevent the occurrence of cancellation, the perturbation signal value is changed so that the opposite signals cannot occur.
Therefore, the solution for the cancellation problem is to change the perturbation signal values in the range n = 0–1.1 to n = 0–1, and in the normal condition from n = 0.9–1.1 to n = 0.9–1. By changing this value, the injected signal cancellation is eliminated. Similar to the Equations (3)–(15), the solution is explained below:
The injected signal cancellation occurs when:
By using the new perturbation signal ( = 1, = 1, and = 0.9), Equation (16) becomes
Based on Equation (17), the fluctuation of DC-link voltage caused by the perturbation signals from PV1 and PV2 cannot cancel each other. Thus, the proposed solution can solve the injected signal cancellation.
By generalizing this solution with perturbation signals (), the injected signal cancellation occurs when:
or
Finally,
As = 1 (without perturbation signal) and , Equation (20) is correct when all perturbation signal values are 1 (without perturbation signal case).
With other values of the perturbation signals (with perturbation signal), Equation (20) becomes
For this reason, the injected signal cancellation is eliminated by using the proposed solution.
The flowchart in Figure 7 explains the detailed procedure of the proposed solution. The solution is verified by a step-by-step simulation.
The testing scenarios in Table 3 are the worst case (the power of DGs and the load are balance), and the procedure is similar to the previous testing procedure.
The model parameters are almost similar to the previous testing, only the new perturbation factors are different. The perturbation factors at normal condition in cancellation case are n = 1–0.9 for PV1 and n = 0.9–1 for PV2.
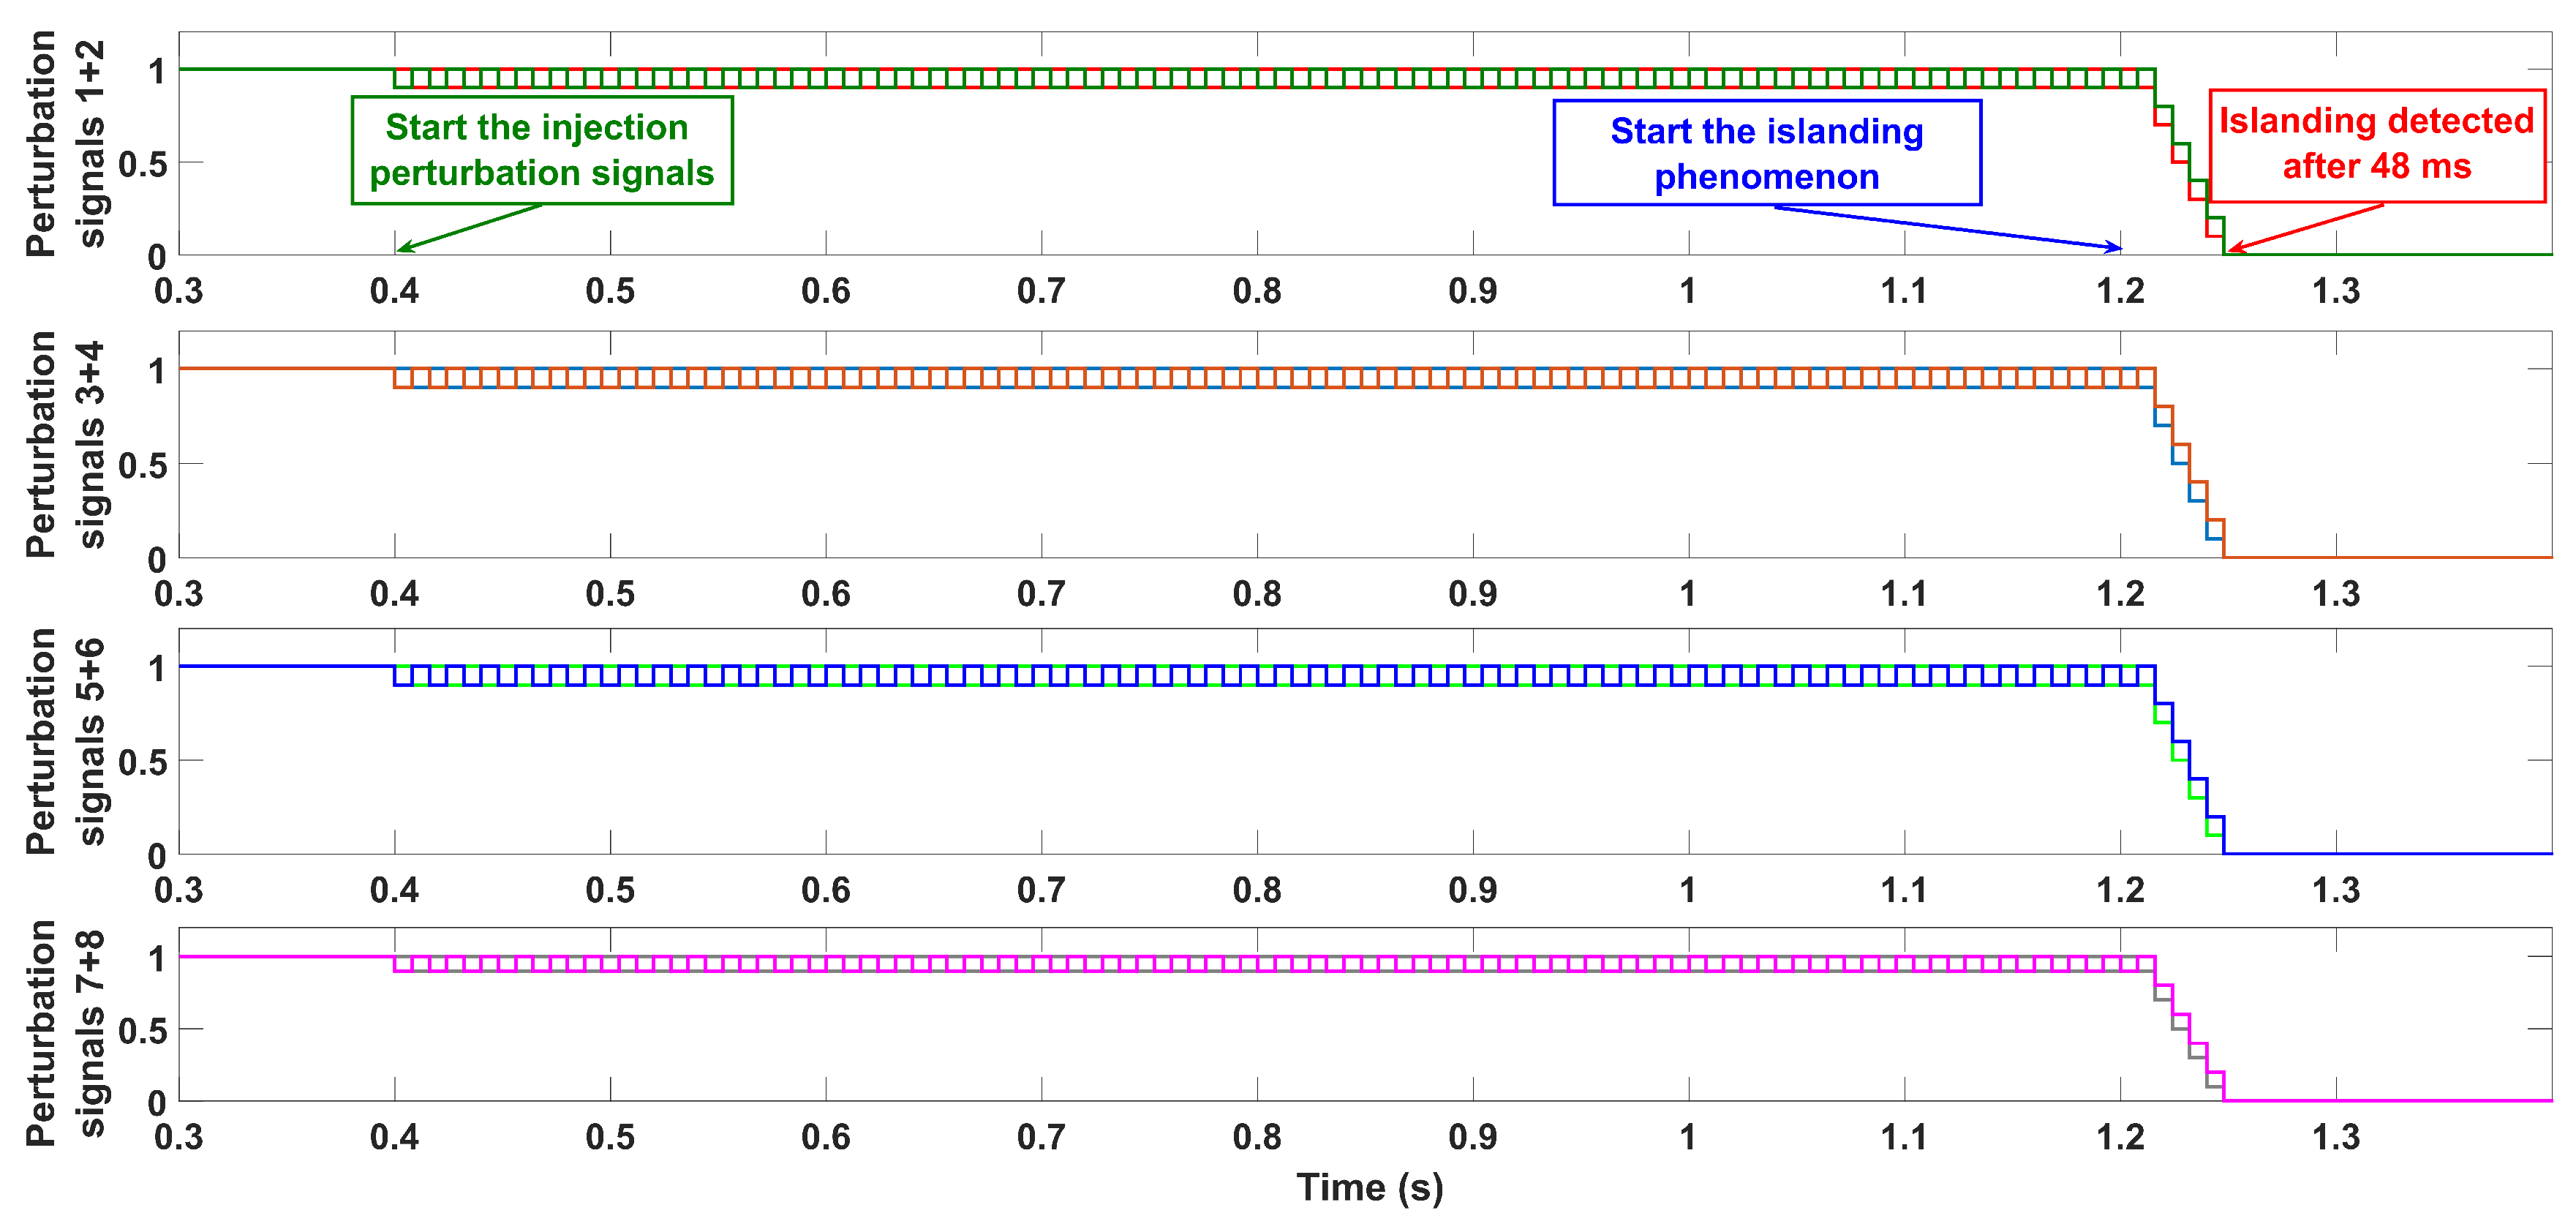
In addition, the eight-PV scenario also tests to verify the effect of the improved IDM. The parameters of the eight-PV scenario are as below:
- Each PV module power is 50 kW.
- Total PV power is 400 kW.
- Load power is 400 kW.
- DC bus voltage is 500 V.
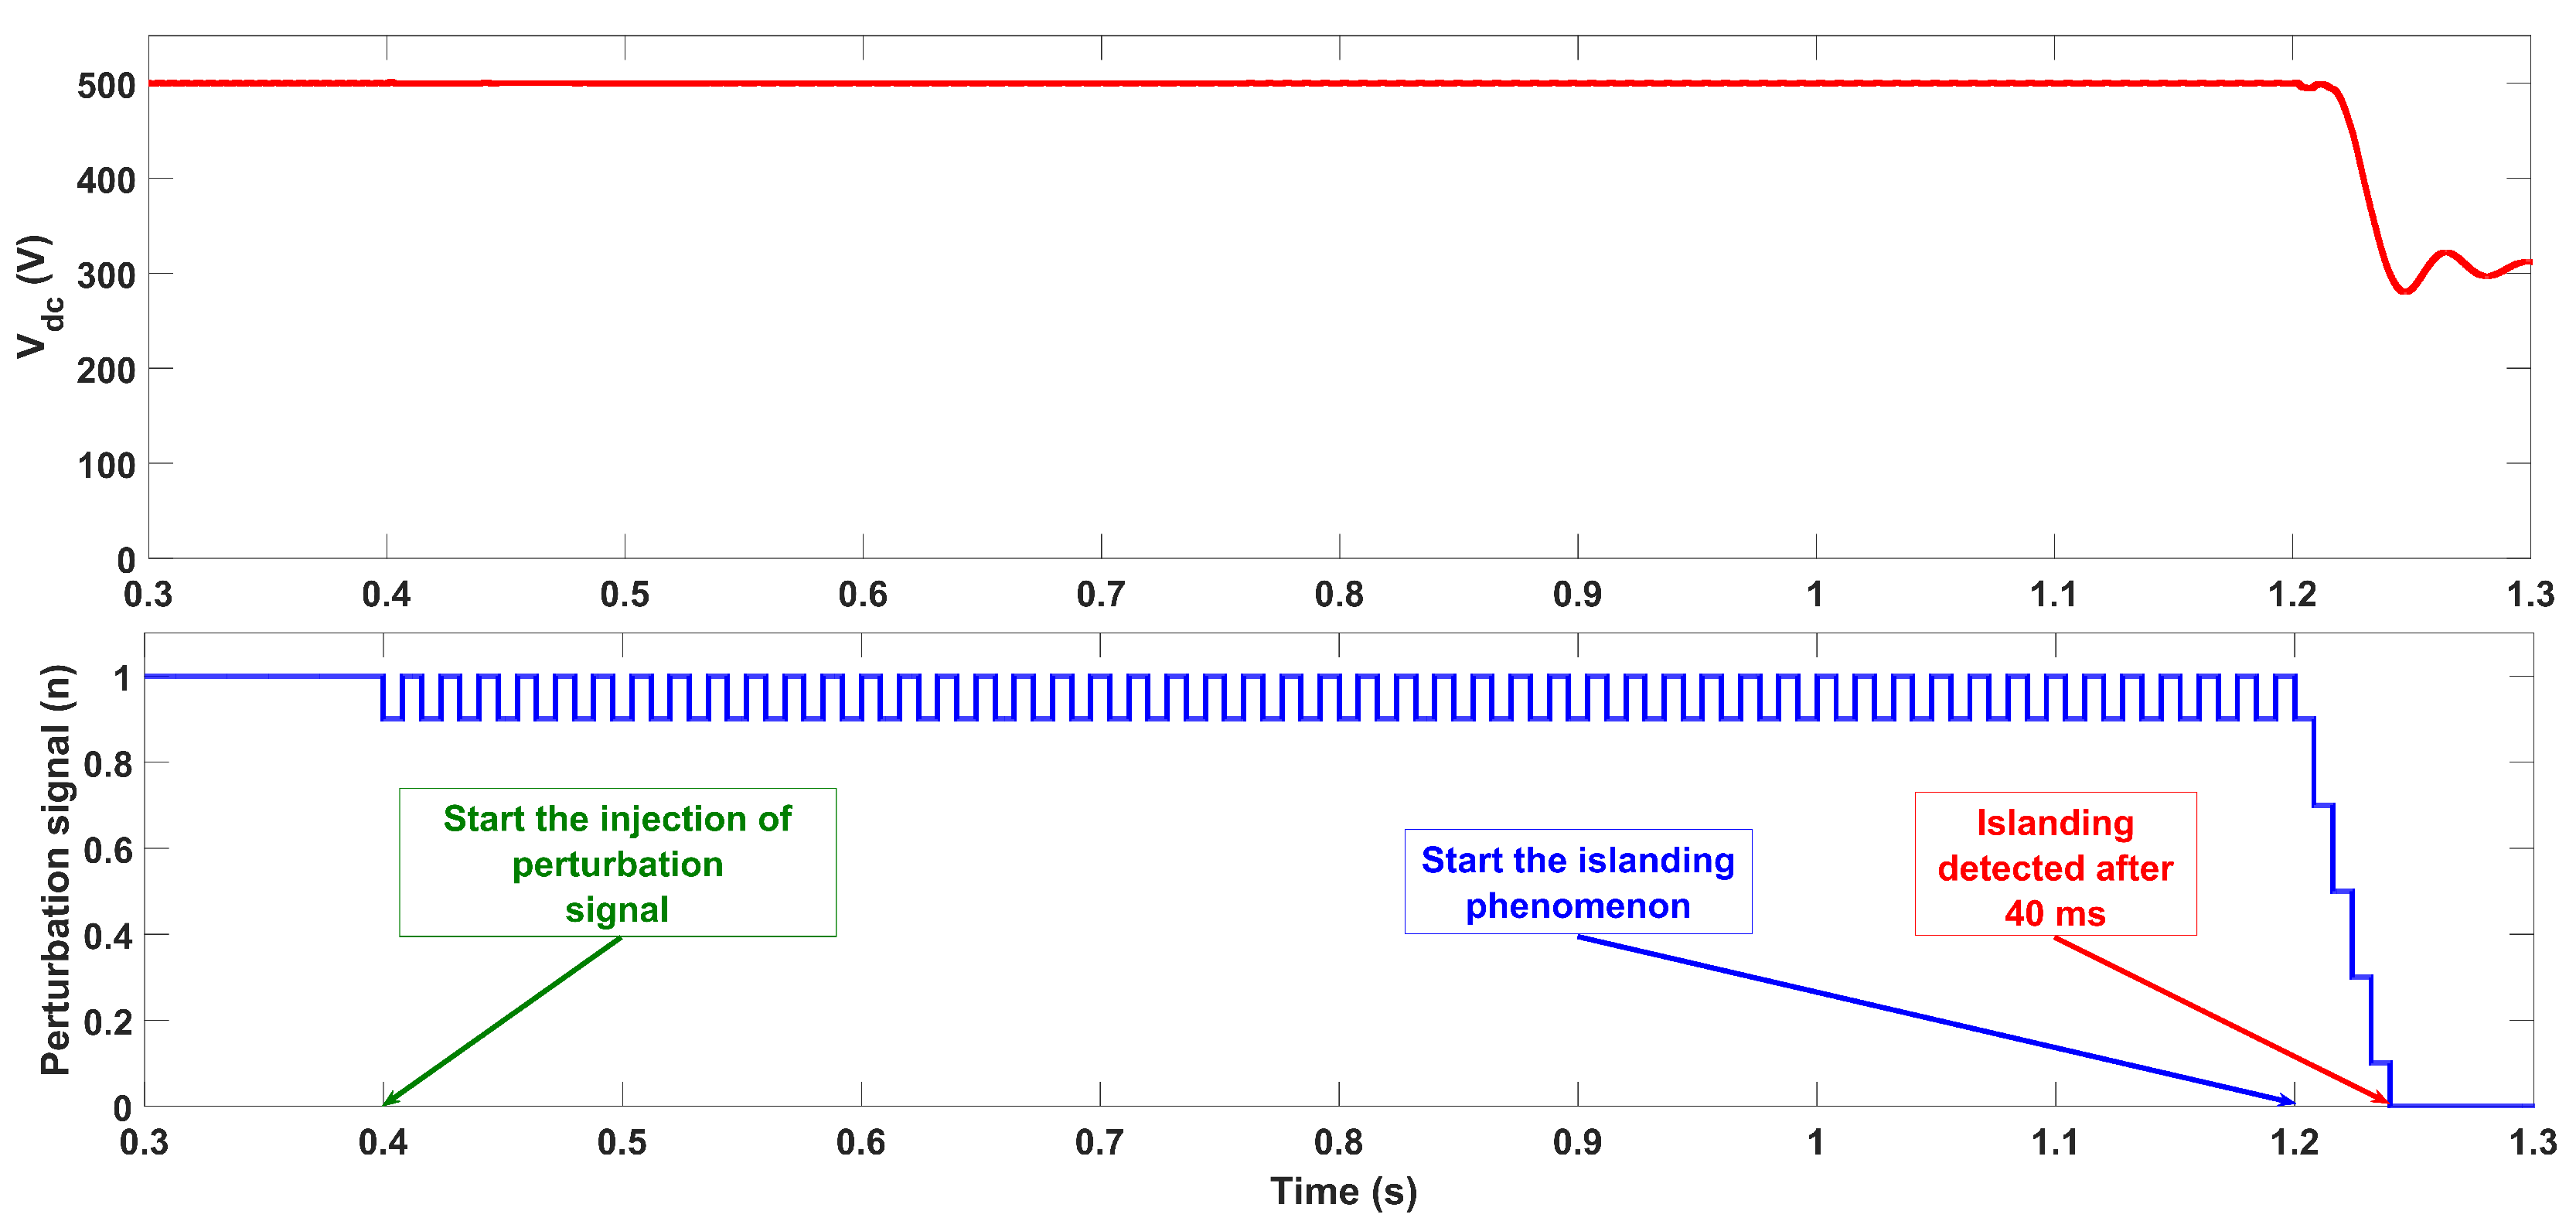
As shown in the results in Figure 8, the injected signal cancellation occurs in two-PV scenario. With the improved islanding detection method based on the proposed solution, the islanding condition is detected after 40 ms when the islanding occurs. The solution is effective in two-PV scenario.
The results of three-PV scenario are shown in Figure 9 and Figure 10. In Figure 9, the islanding detection method can not detect the islanding phenomenon when injected signal cancellation occurs.
The results in Figure 10 show that the islanding condition is detected after 64 ms when the islanding occurs by applying the proposed solution to the improved islanding detection method in the injected signal cancellation case.
The four-PV scenario has the similar results, the islanding condition can be detected after 48 ms when the islanding occurs by using the improved islanding detection method, but it cannot be detected by using the original one. The results are shown in Figure 11 and Figure 12.
The eight-PV scenario result is shown in Figure 13. The improved islanding detection method by applying the proposed solution can detect the islanding condition after 48 ms.
Based on the simulation results and mathematical explanations, the proposed solution eliminates the injected signal cancellation by using the improved islanding detection method based on the proposed solution in two-PV, three-PV, four-PV, and eight-PV scenarios.
Moreover, the injected signal cancellation is eliminated not only in the specified cases but also in the general case by using the improved islanding detection method. This result shows the achievement and efficiency of the proposed solution.
5. Conclusions
In this study, the islanding detection method based on perturbation signal injection and the rate of change of output power in a DC grid-connected photovoltaic system is investigated.
The impact of injected signal cancellation on the islanding detection method in [16] is significant. The islanding detection method in [16] cannot detect the islanding phenomenon but works well without injected signal cancellation (detection time is 56 ms).
The solution of using the new perturbation factors (n = 0.9–1 in normal condition) is proposed. With this solution, the improved islanding detection method can detect the islanding phenomenon after 40 ms (two-PV scenario), 64 ms (three-PV scenario), and 48 ms (four-PV and eight-PV scenarios) when the injected signal cancellation appears.
Through the mathematical explanations and simulation results, the injected signal cancellation is eliminated. Moreover, the improved islanding detection method by applying the proposed solution is correct not only in specified cases but also in the general case.
Author Contributions
T.S.T. and D.T.N. extensively reviewed the literature and drafted the manuscript and G.F. provided feedback and critical comments for inclusions and finally helped in revising the manuscript to improve the quality of paper. All authors provided critical feedback and helped shape the research, analysis and manuscript. Besides, all authors discussed the results and contributed to the final manuscript.
Funding
This research received no external funding.
Conflicts of Interest
The authors declare no conflict of interest.
References
- Elsayed, A.T.; Mohamed, A.A.; Mohammed, O.A. Review DC microgrids and distribution systems: An overview. Electr. Power Syst. Res. 2015, 119, 407–417. [Google Scholar] [CrossRef]
- Hammerstrom, D.J. AC Versus DC Distribution Systems: Did We Get it Right? In Proceedings of the IEEE Power Engineering Society General Meeting, Tampa, FL, USA, 24–28 June 2007; pp. 1–5. [Google Scholar]
- Seo, G.-S.; Baek, J.; Choi, K.; Bae, H.; Cho, B. Modeling and analysis of DC distribution systems. In Proceedings of the IEEE 8th International Conference on Power Electronics and ECCE Asia, Jeju, Korea, 30 May–3 June 2011; pp. 223–227. [Google Scholar]
- Starke, M.R.; Tolbert, L.M.; Ozpineci, B. AC vs DC distribution: A loss comparison. In Proceedings of the IEEE PES Transmission and Distribution Conference and Exposition, Chicago, IL, USA, 21–24 April 2008; pp. 1–7. [Google Scholar]
- Sannino, A.; Postiglione, G.; Bollen, M. Feasibility of a DC Network for Commercial Facilities. IEEE Trans. Ind. Appl. 2003, 39, 1499–1507. [Google Scholar] [CrossRef]
- IEEE. IEEE Recommended Practice for Utility Interface of Photovoltaic (PV) Systems; IEEE Std 929-2000; IEEE: Piscataway, NJ, USA, 2000. [Google Scholar] [CrossRef]
- Zamani, R.; Hamedani-Golshan, M.-E.; Alhelou, H.H.; Siano, P.; Pota, H.R. Islanding Detection of Synchronous Distributed Generator Based on the Active and Reactive Power Control Loops. Energies 2018, 11, 2819. [Google Scholar] [CrossRef]
- Ghalavand, F.; Alizade, B.A.M.; Gaber, H.; Karimipour, H. Microgrid Islanding Detection Based on Mathematical Morphology. Energies 2018, 11, 2696. [Google Scholar] [CrossRef]
- Di Fazio, A.R.; Russo, M.; Valeri, S. A New Protection System for Islanding Detection in LV Distribution Systems. Energies 2015, 8, 3775–3793. [Google Scholar] [CrossRef] [Green Version]
- Mlakić, D.; Baghaee, H.R.; Nikolovski, S. A Novel ANFIS-Based Islanding Detection for Inverter-Interfaced Microgrids. IEEE Trans. Smart Grid 2019, 10, 4411–4424. [Google Scholar] [CrossRef]
- Chen, X.; Li, Y.; Crossley, P. A Novel Hybrid Islanding Detection Method for Grid-Connected Microgrids with Multiple Inverter-Based Distributed Generators Based on Adaptive Reactive Power Disturbance and Passive Criteria. IEEE Trans. Power Electron. 2019, 34, 9342–9356. [Google Scholar] [CrossRef]
- Nale, R.; Biswal, M.; Kishor, N. A Transient Component Based Approach for Islanding Detection in Distributed Generation. IEEE Trans. Sustain. Energy 2019, 10, 1129–1138. [Google Scholar] [CrossRef]
- Haider, R.; Kim, C.H.; Ghanbari, T.; Bukhari, S.B.A. Harmonic-signature-based islanding detection in grid-connected distributed generation systems using Kalman filter. IET Renew. Power Gener. 2018, 12, 1813–1822. [Google Scholar] [CrossRef]
- Song, W.; Chen, Y.; Wen, A.; Zhang, Y.; Wei, C. Detection and switching control scheme of unintentional islanding for ‘hand-in-hand’ DC distribution network. IET Gener. Transm. Distrib. 2019, 13, 1414–1422. [Google Scholar] [CrossRef]
- Bekhradian, R.; Davarpanah, M.; Sanaye-Pasand, M. Novel Approach for Secure Islanding Detection in Synchronous Generator Based Microgrids. IEEE Trans. Power Deliv. 2019, 34, 457–466. [Google Scholar] [CrossRef]
- Son, T.T.; Tuyen, N.D.; FUJITA, G. Islanding Detection Method Based on Injecting Perturbation Signal and Rate of Change of Output Power in DC Grid-Connected Photovoltaic System. Energies 2018, 11, 1313. [Google Scholar] [CrossRef]
Figure 1.
Cancellation testing system.

Figure 2.
System model under analysis.
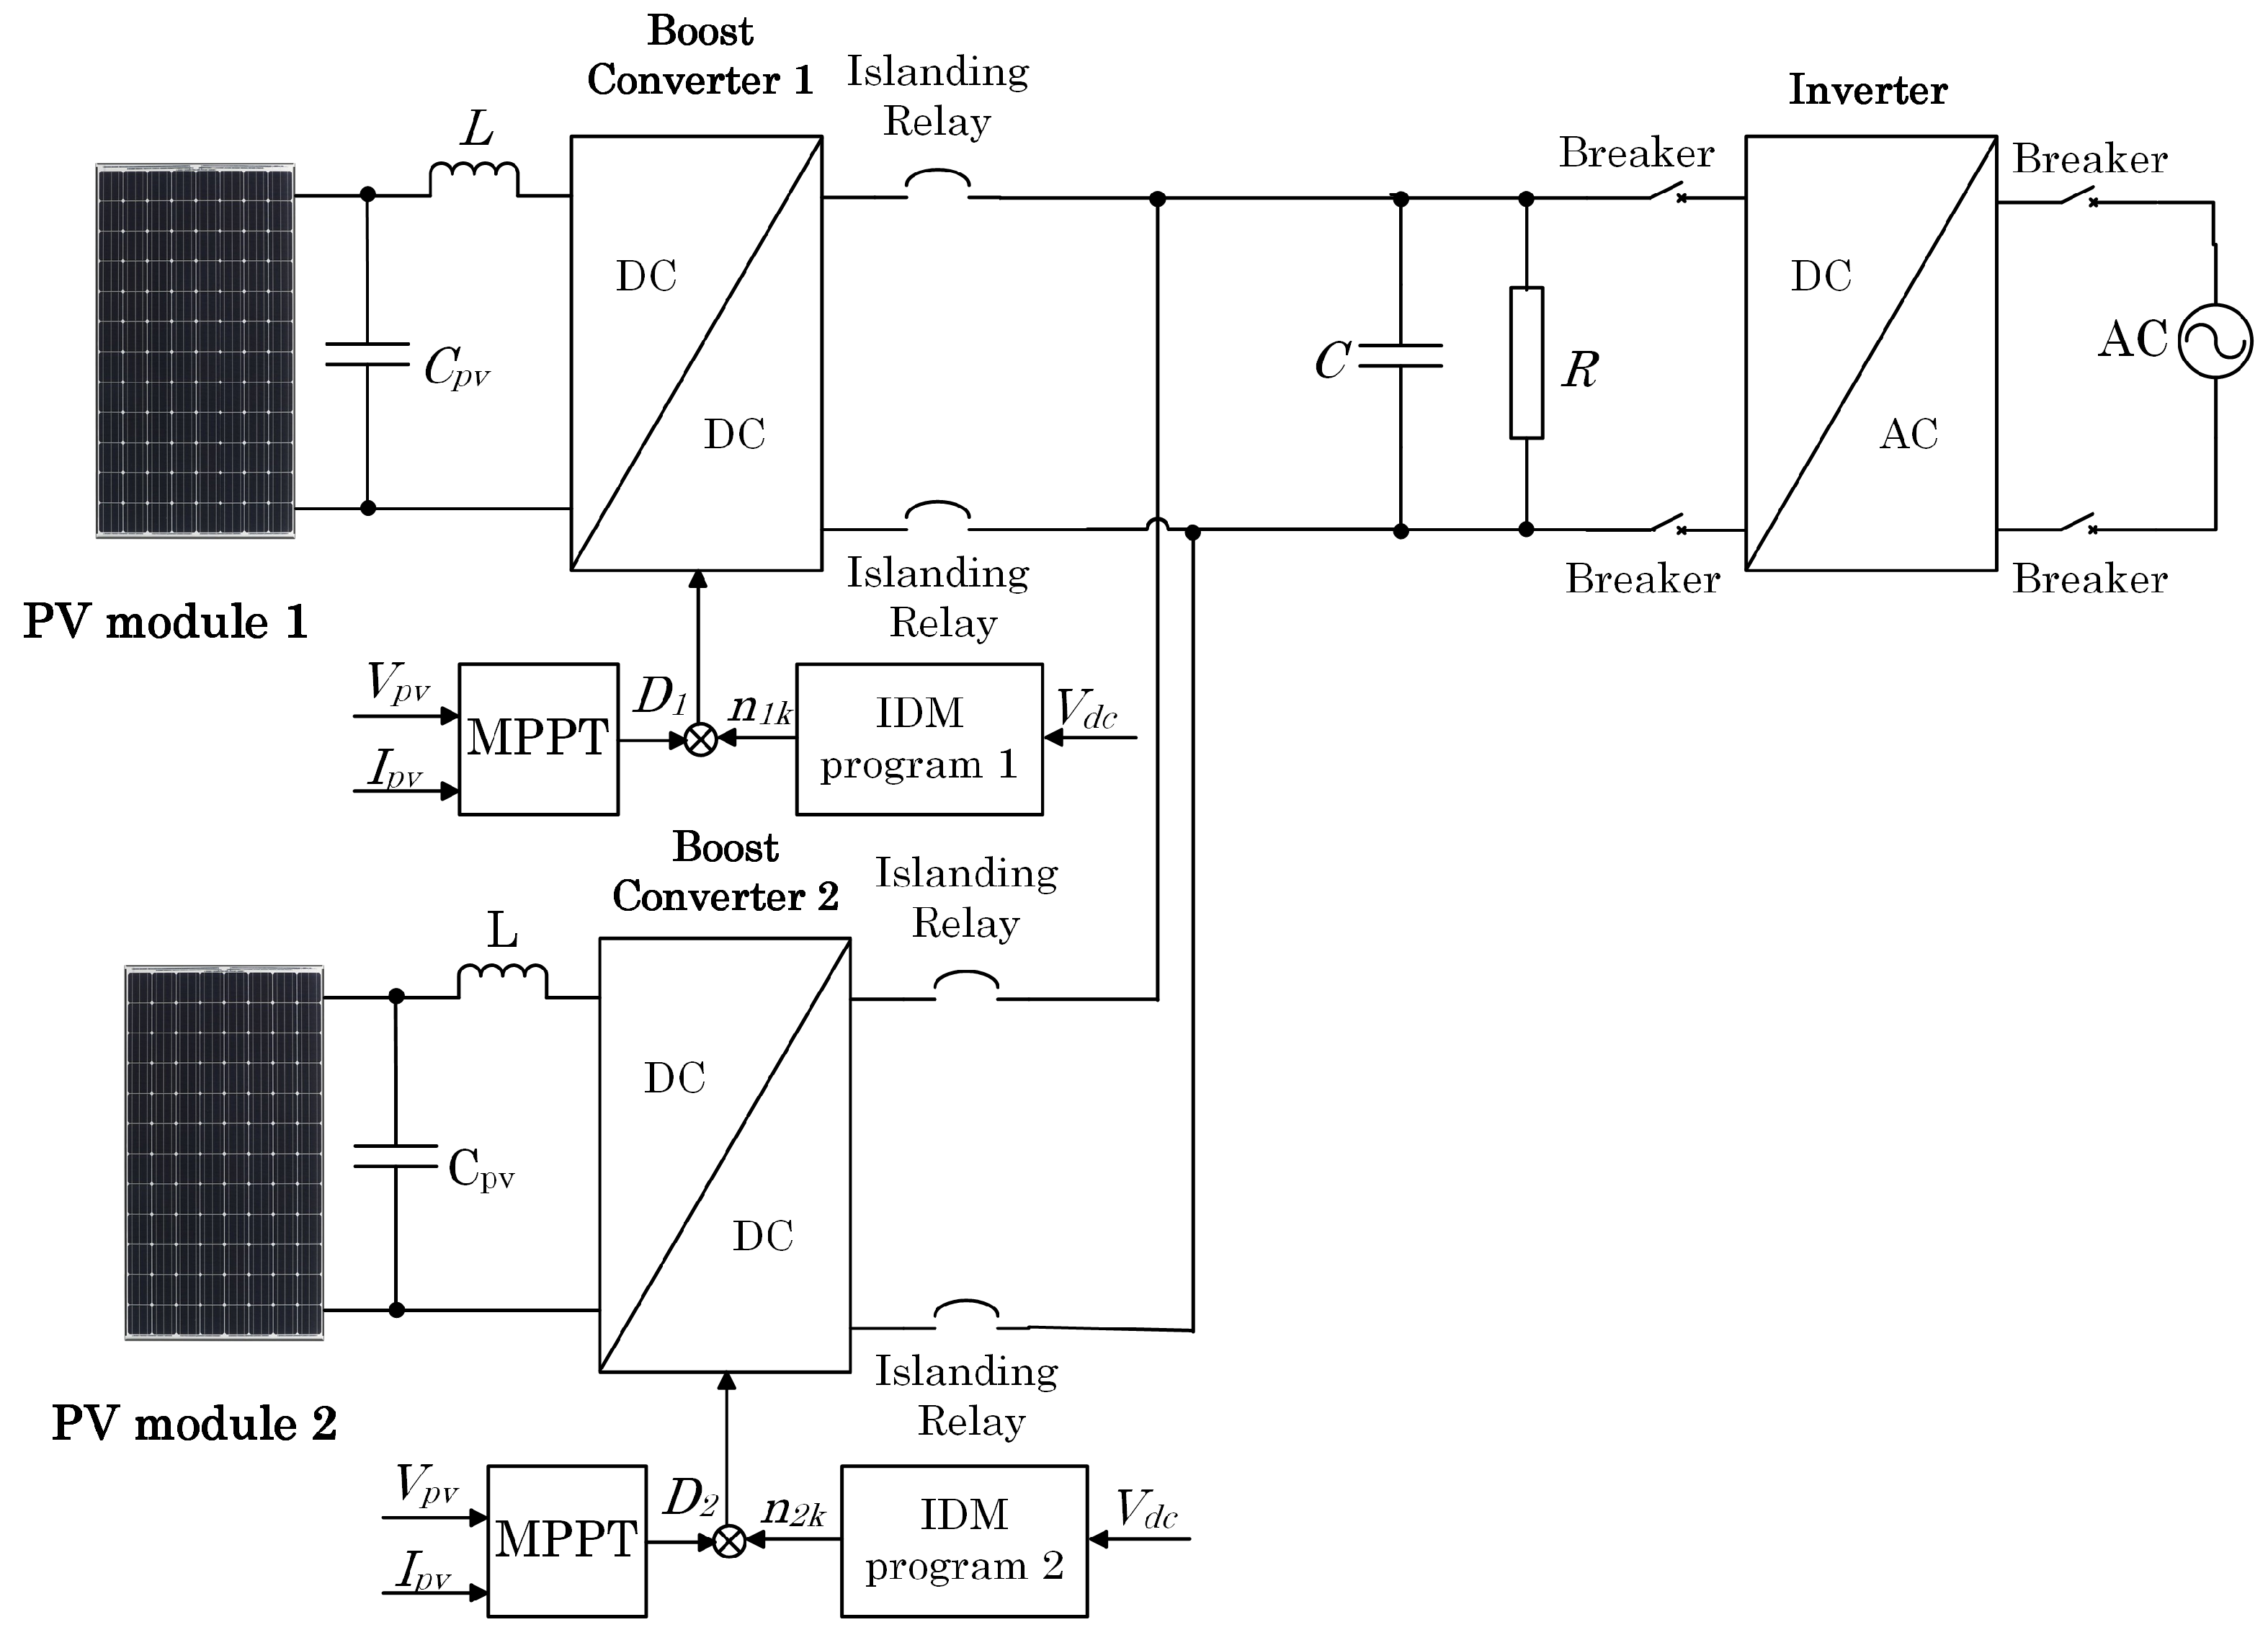
Figure 3.
Perturbation signals in cancellation signal scenario.
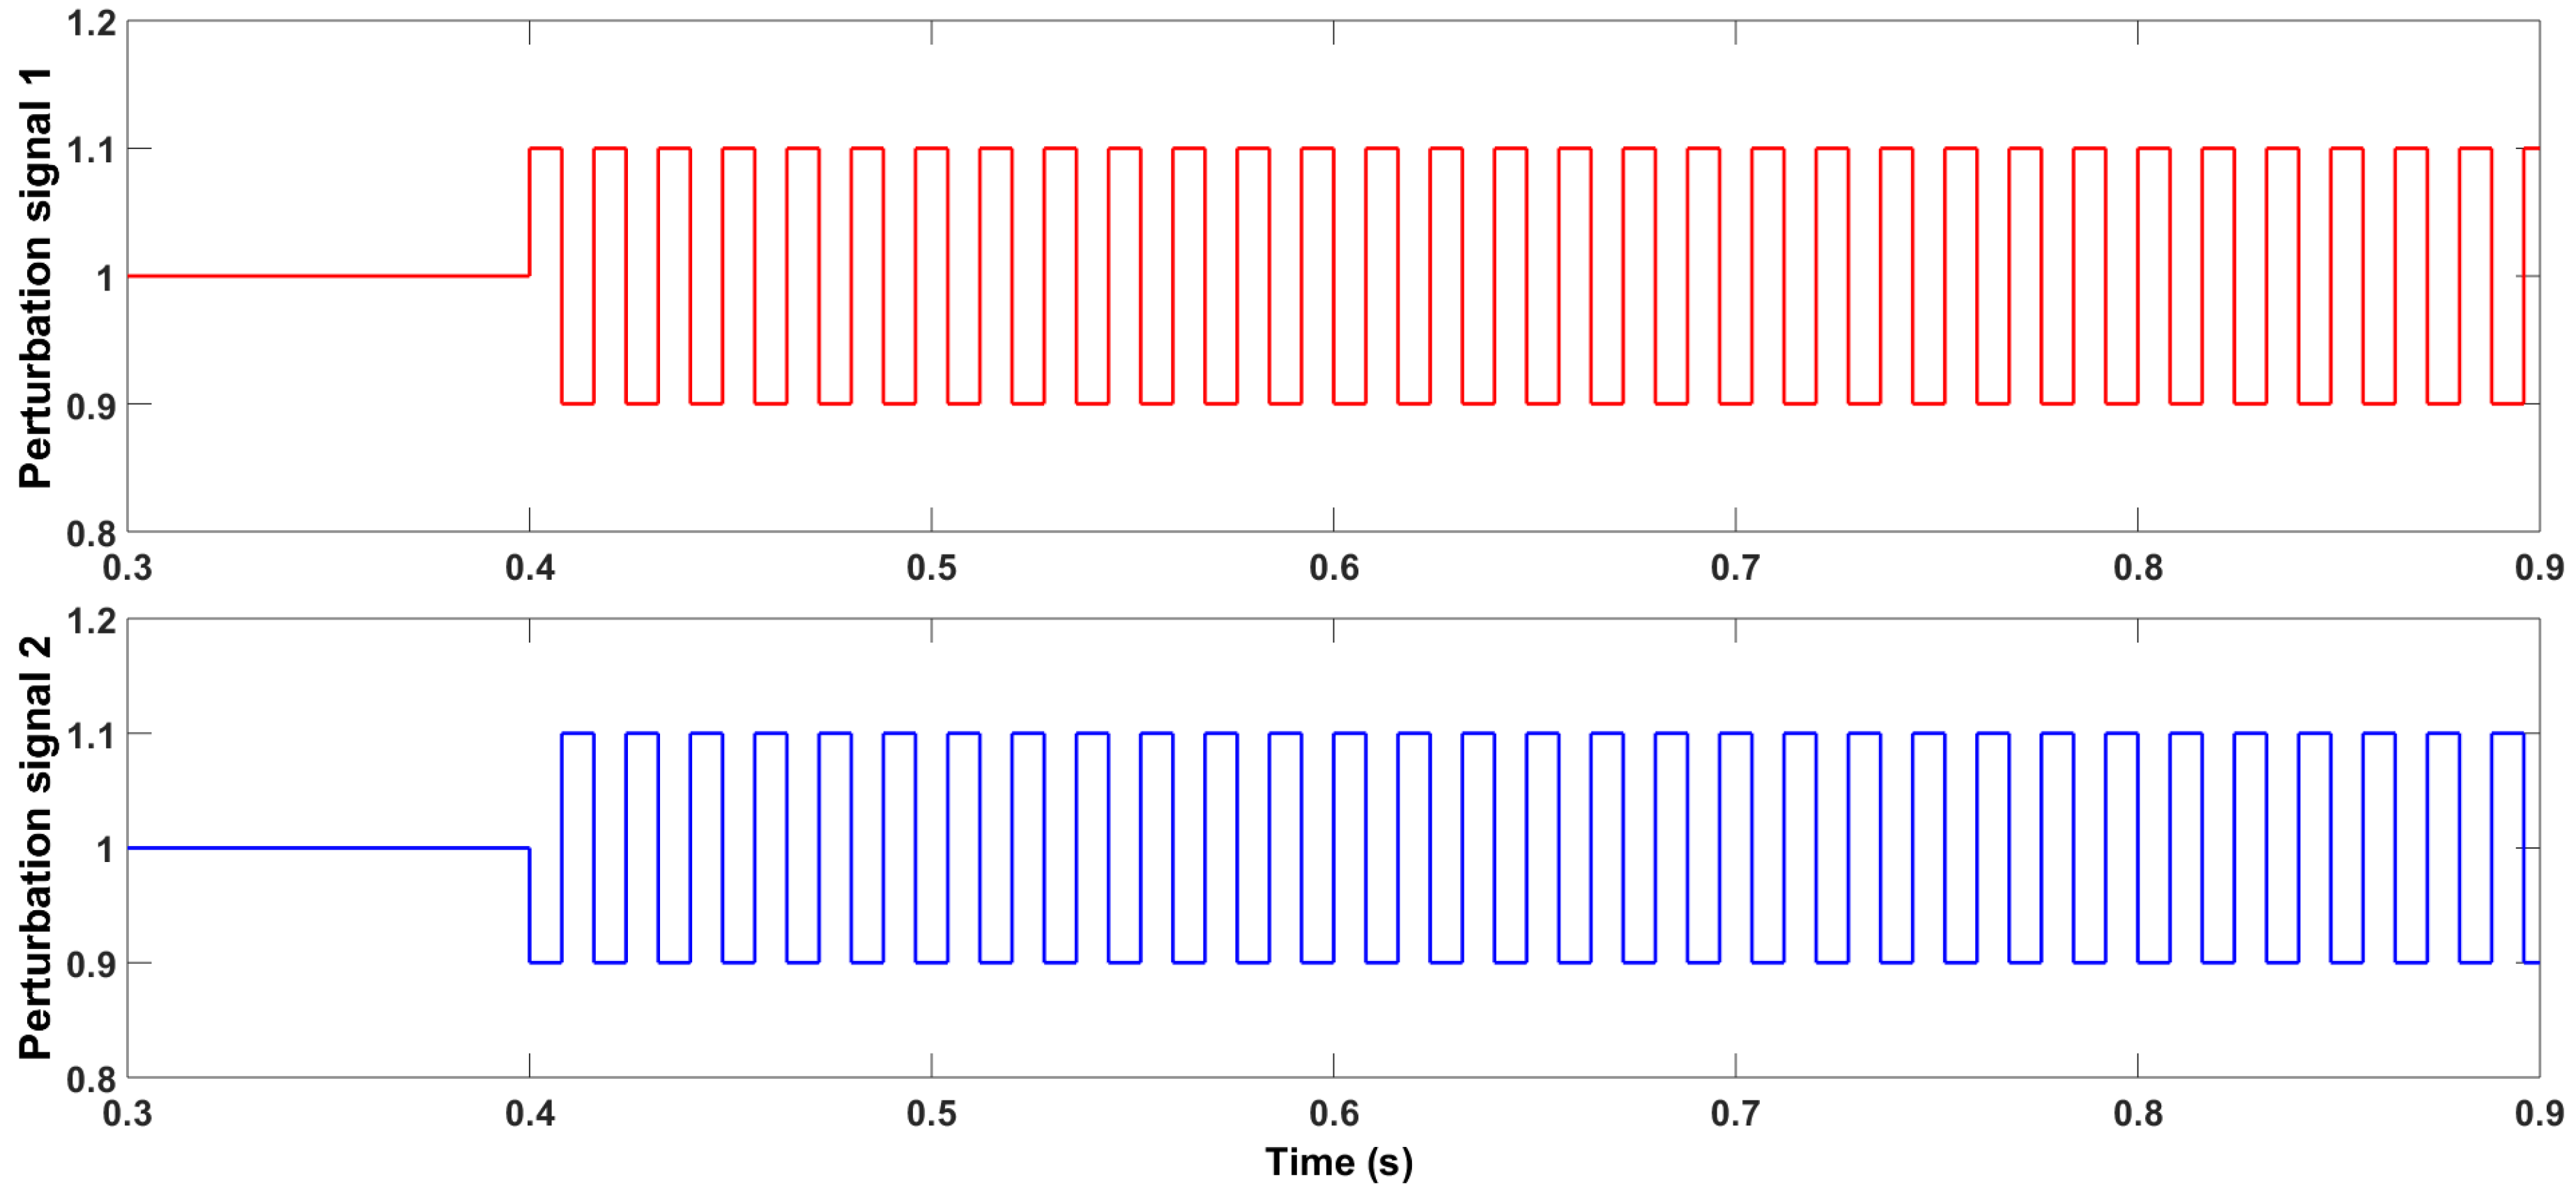
Figure 4.
Controller perturbation signal circuit ( is the measurement DC bus voltage; and are the PV1 and PV2 voltages, respectively; and are the PV1 and PV2 currents, respectively; and are the perturbation factors of IDM programs 1 and 2, respectively; and are the duty cycles of boost converter 1 and 2, respectively).
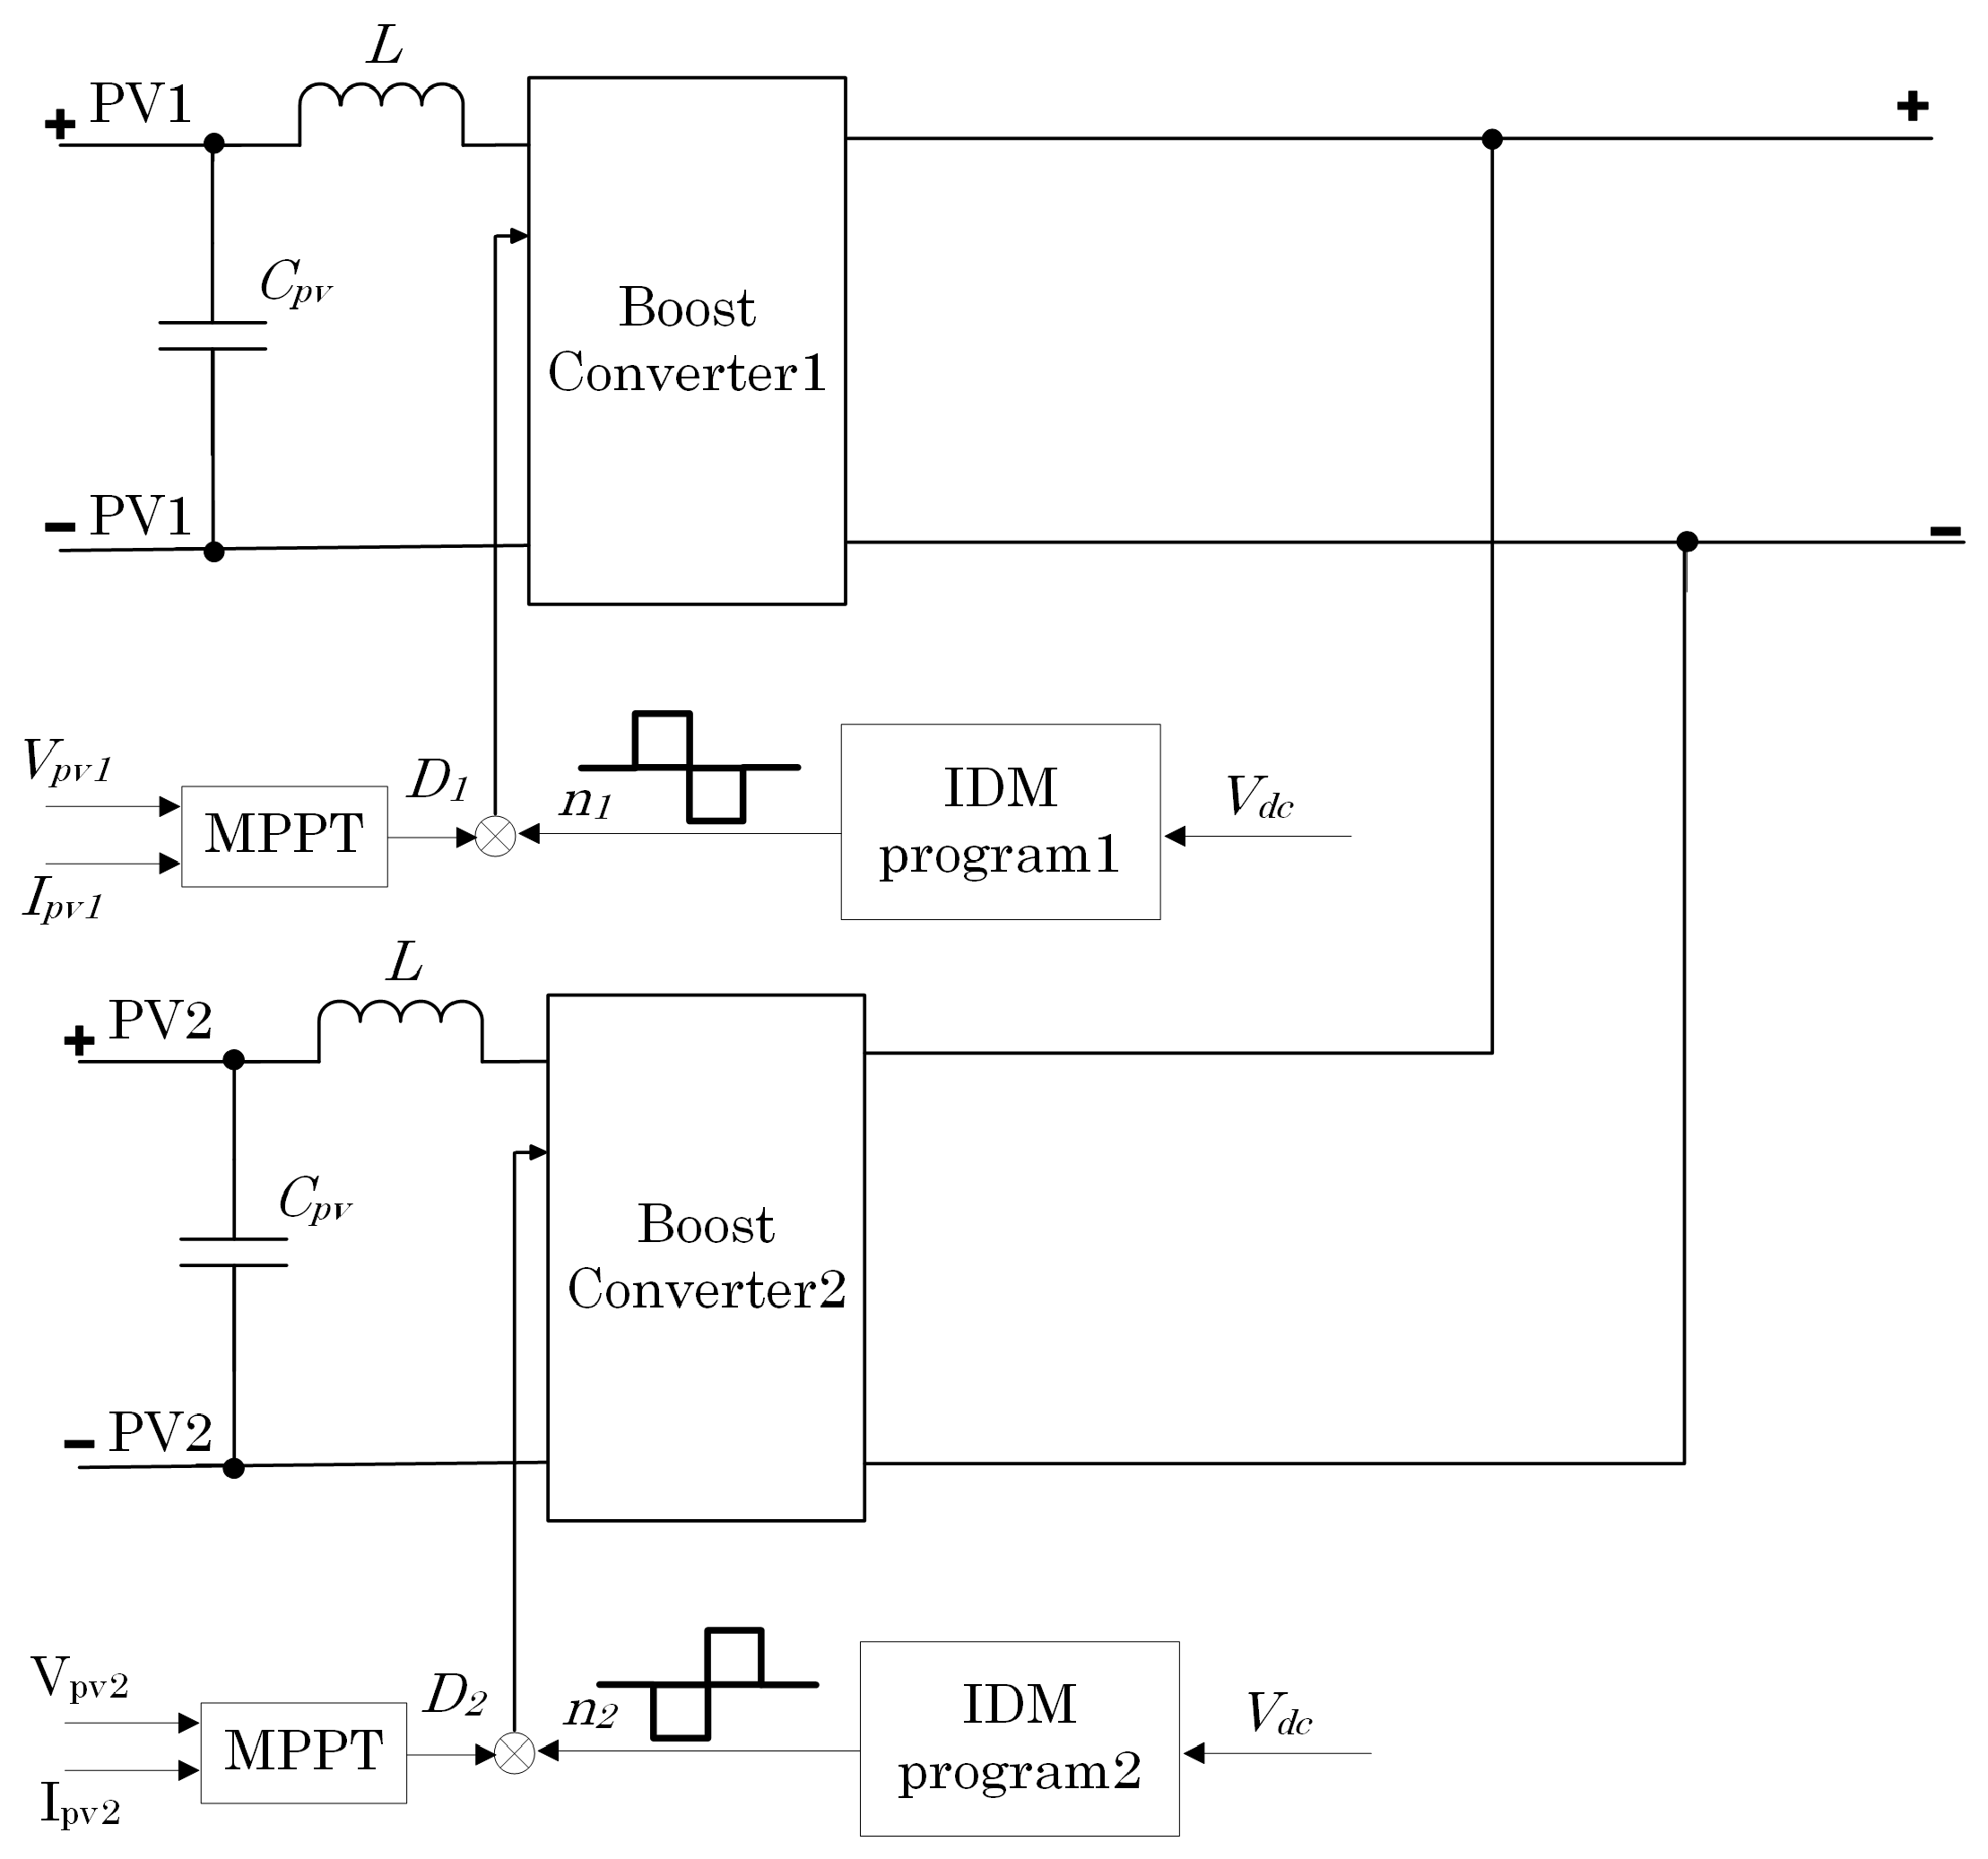
Figure 5.
Islanding detection result by using the IDM in [16] in normal scenario.
Figure 5.
Islanding detection result by using the IDM in [16] in normal scenario.
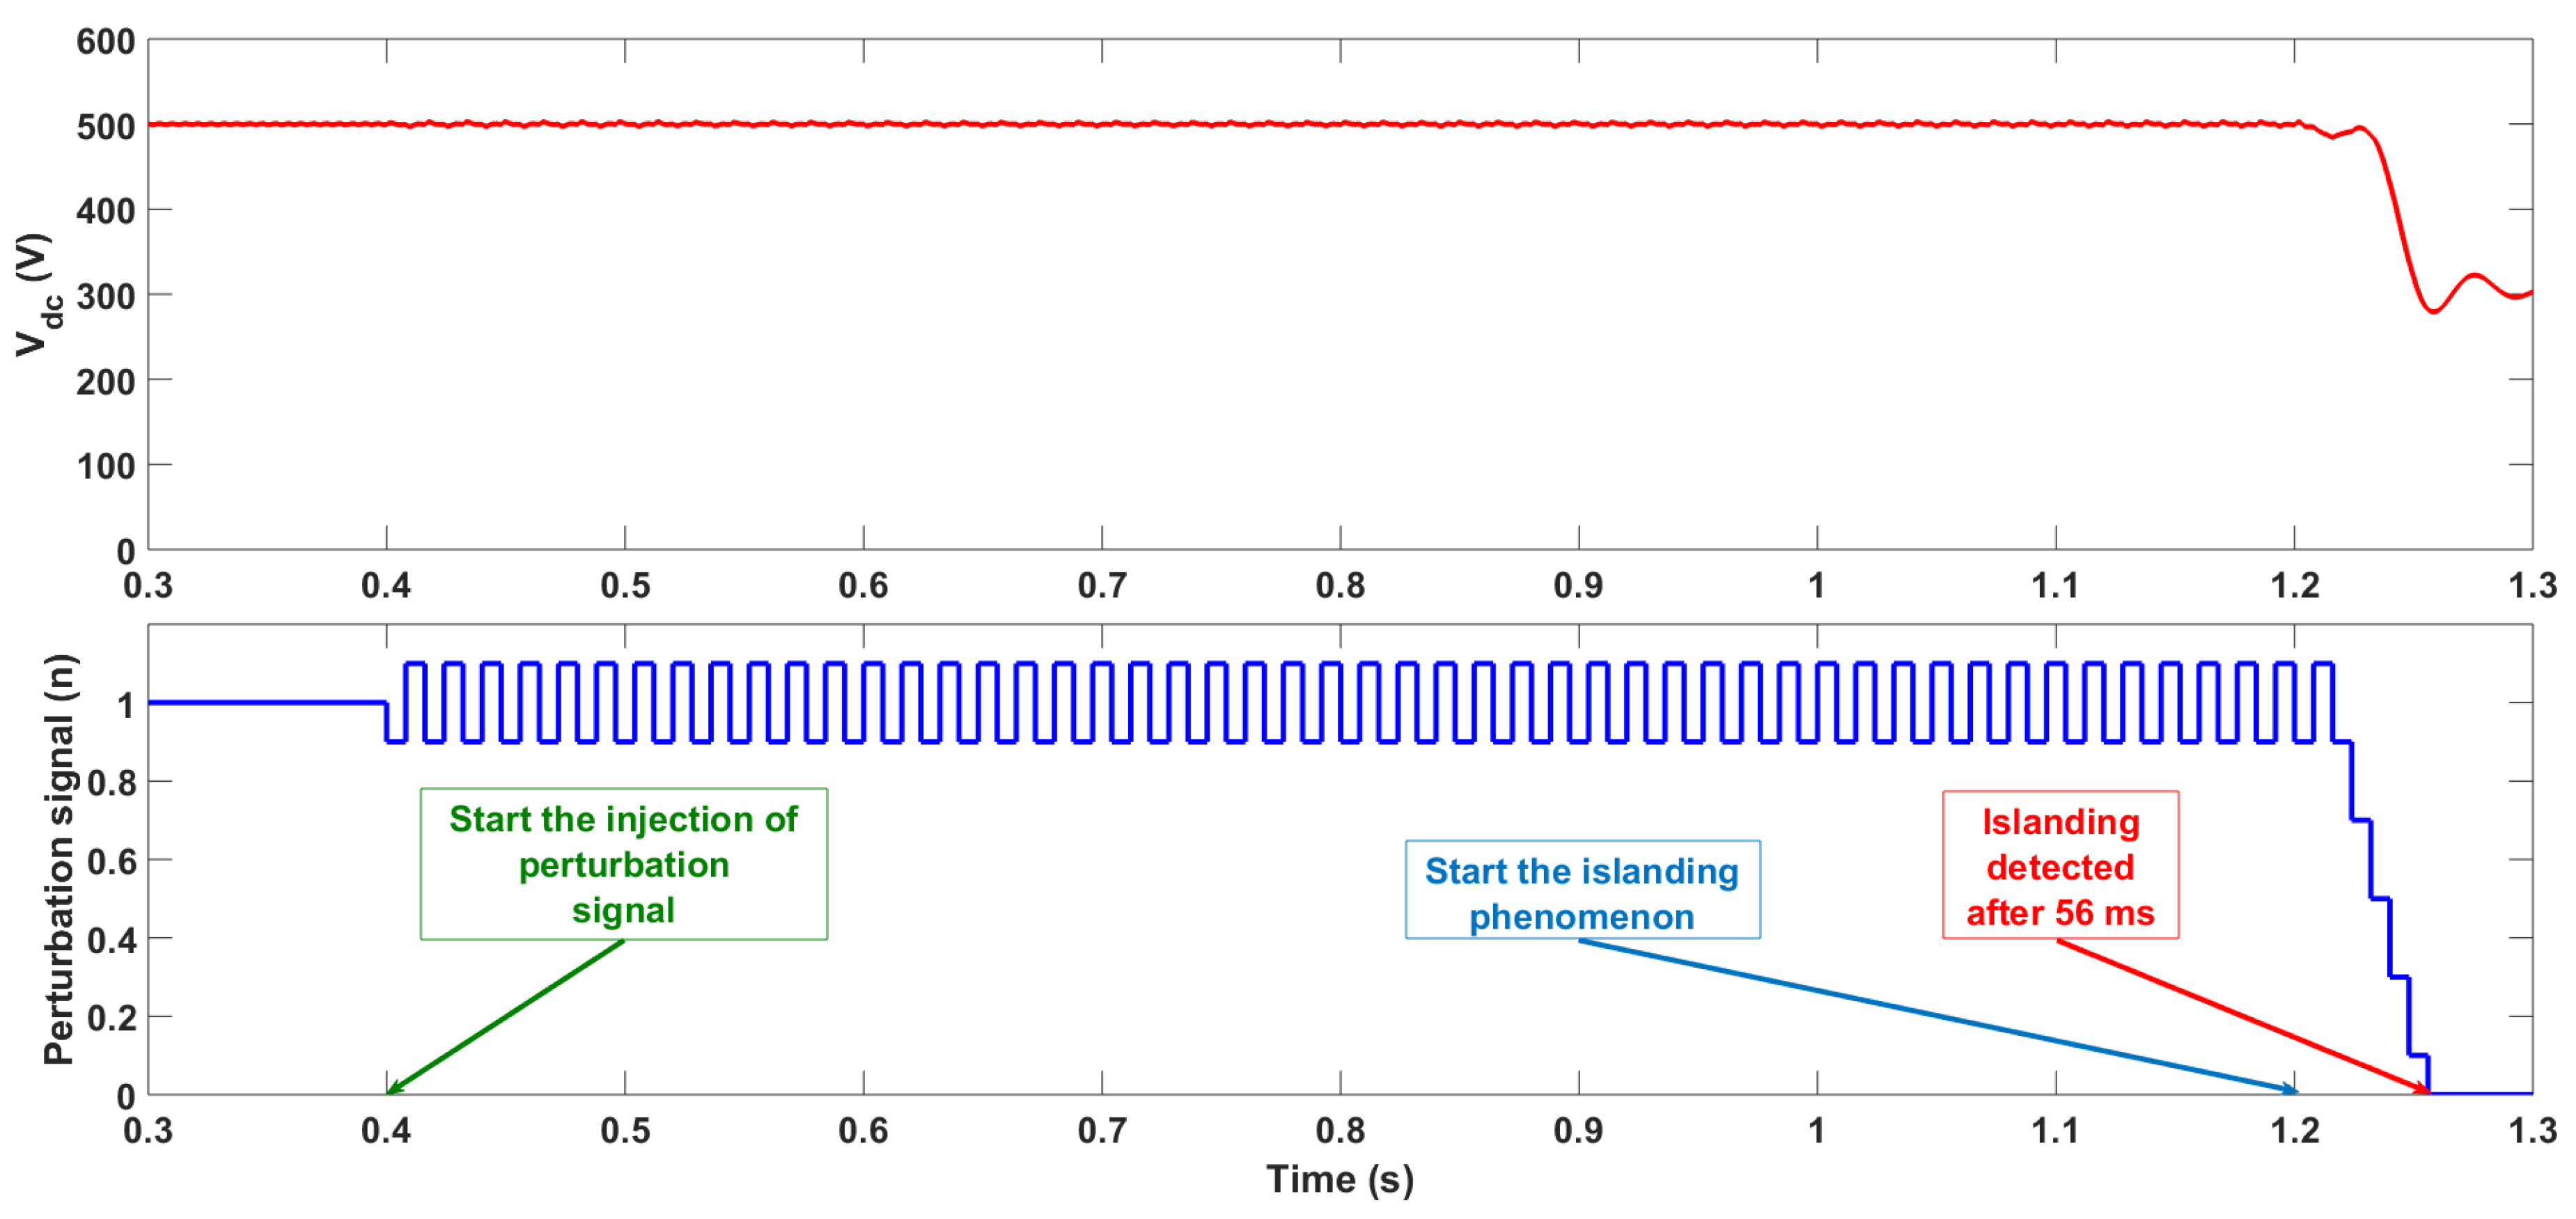
Figure 6.
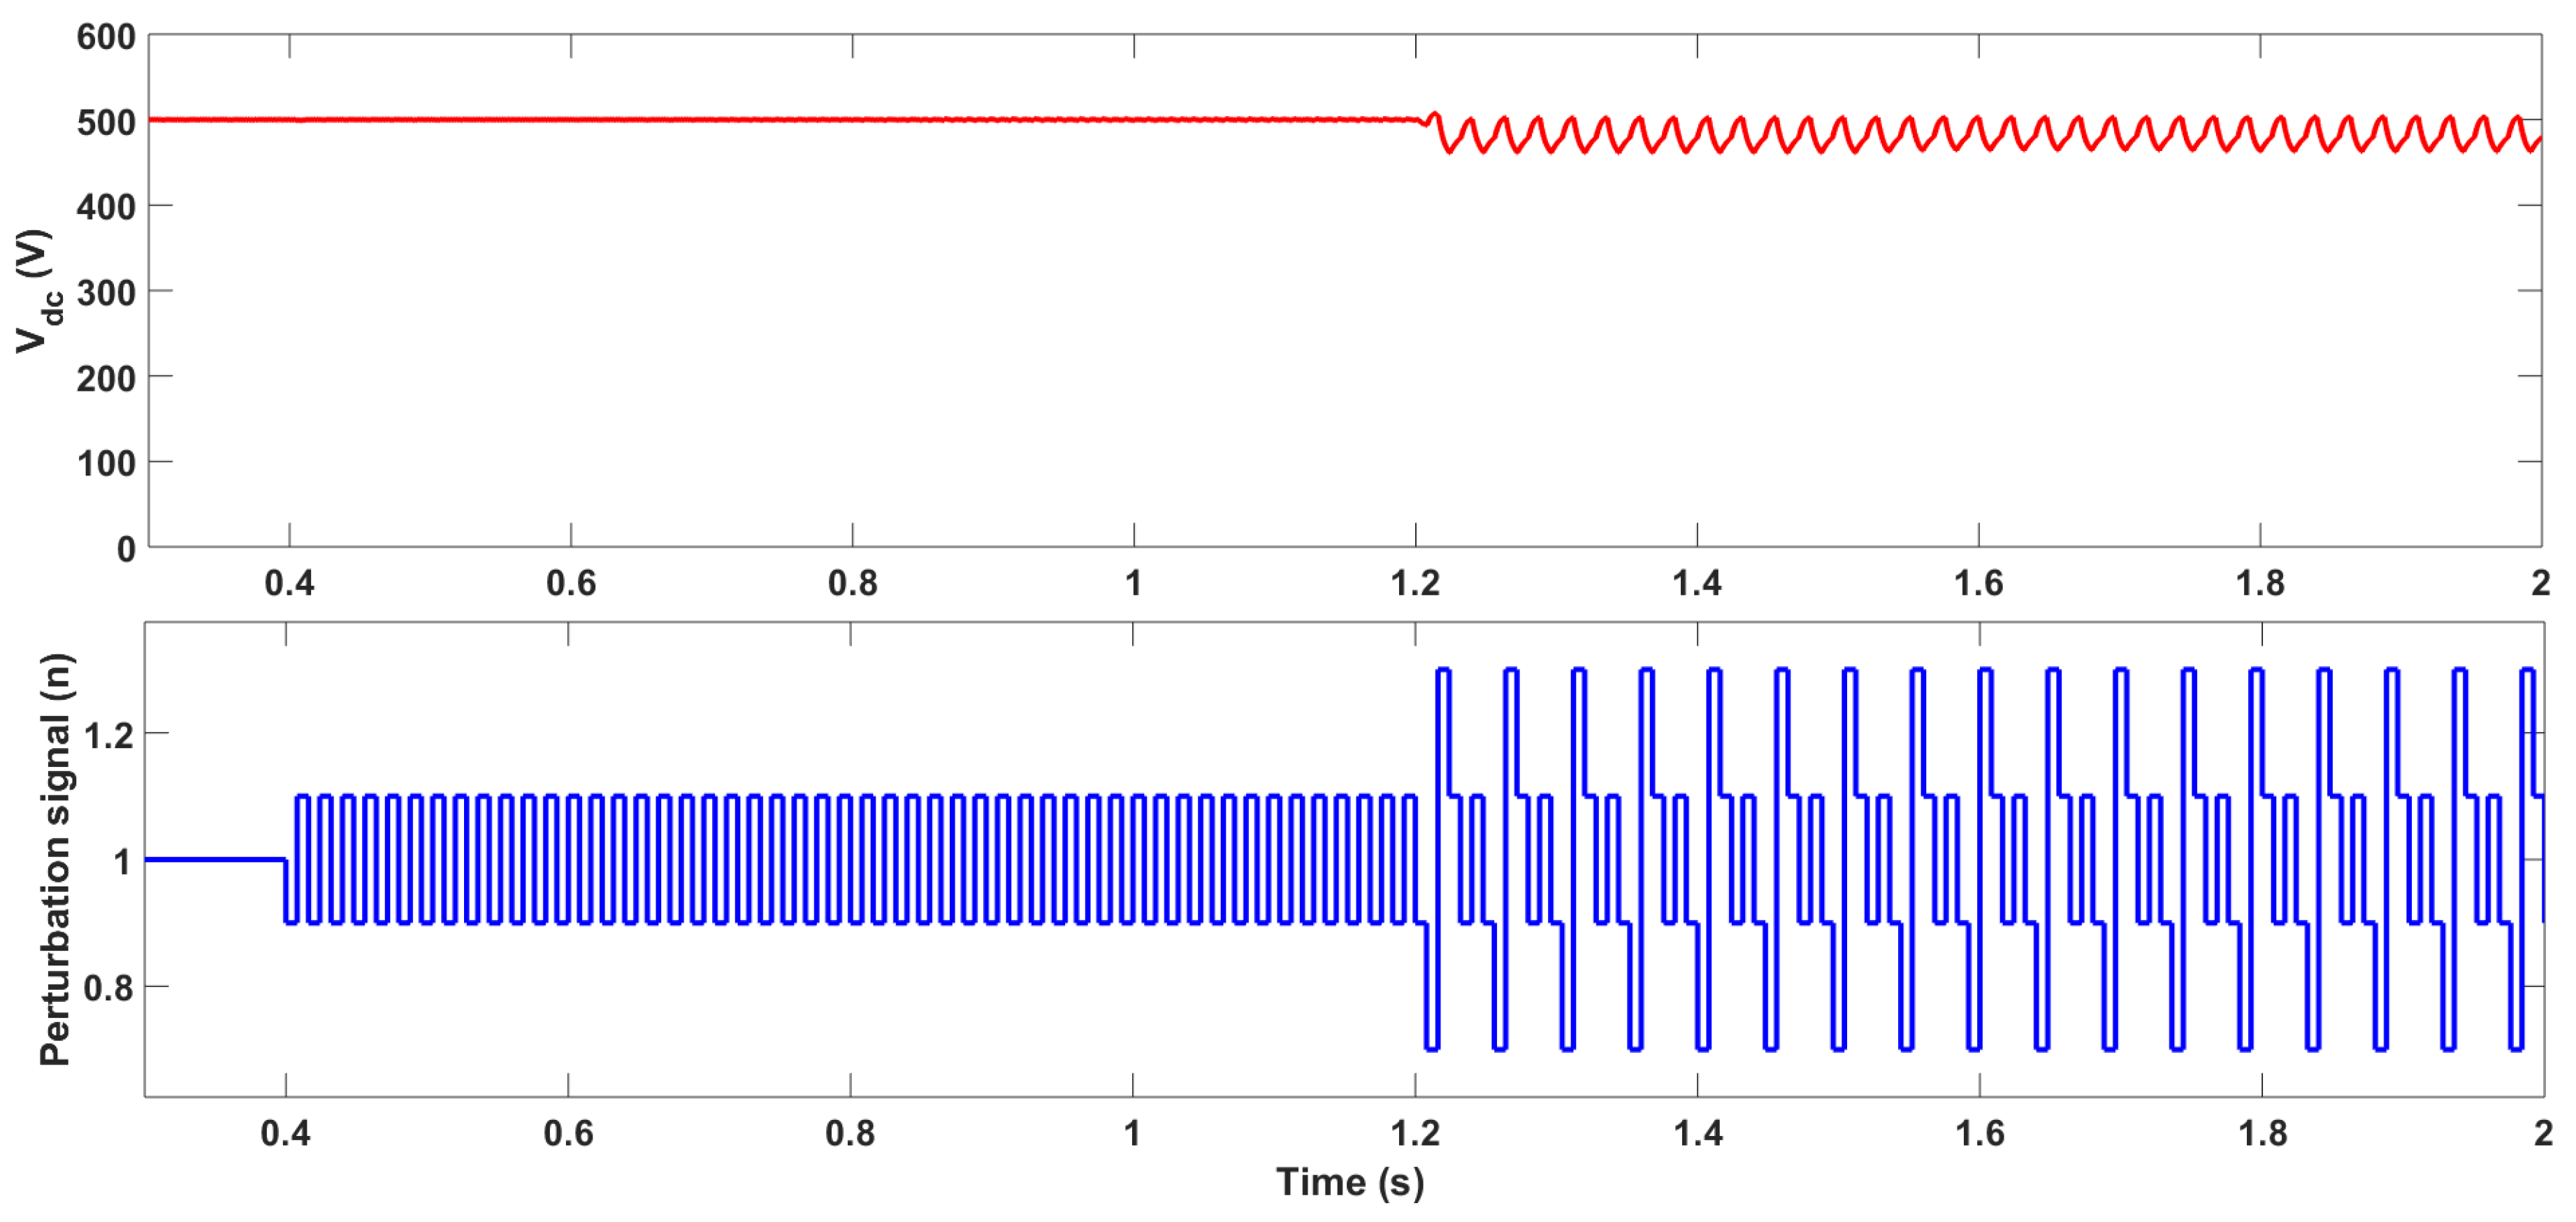
Islanding detection result by using the IDM in [16] in cancellation scenario.
Figure 6.
Islanding detection result by using the IDM in [16] in cancellation scenario.

Figure 7.
Flowchart of the improved IDM program ( is the perturbation factor at the beginning, is the voltage deviation, is the abnormal event value, is the rate of change of output power).
Figure 7.
Flowchart of the improved IDM program ( is the perturbation factor at the beginning, is the voltage deviation, is the abnormal event value, is the rate of change of output power).

Figure 8.
Solution result in two-PV scenario.

Figure 9.
Cancellation result in three-PV scenario.

Figure 10.
Solution result in three-PV scenario.
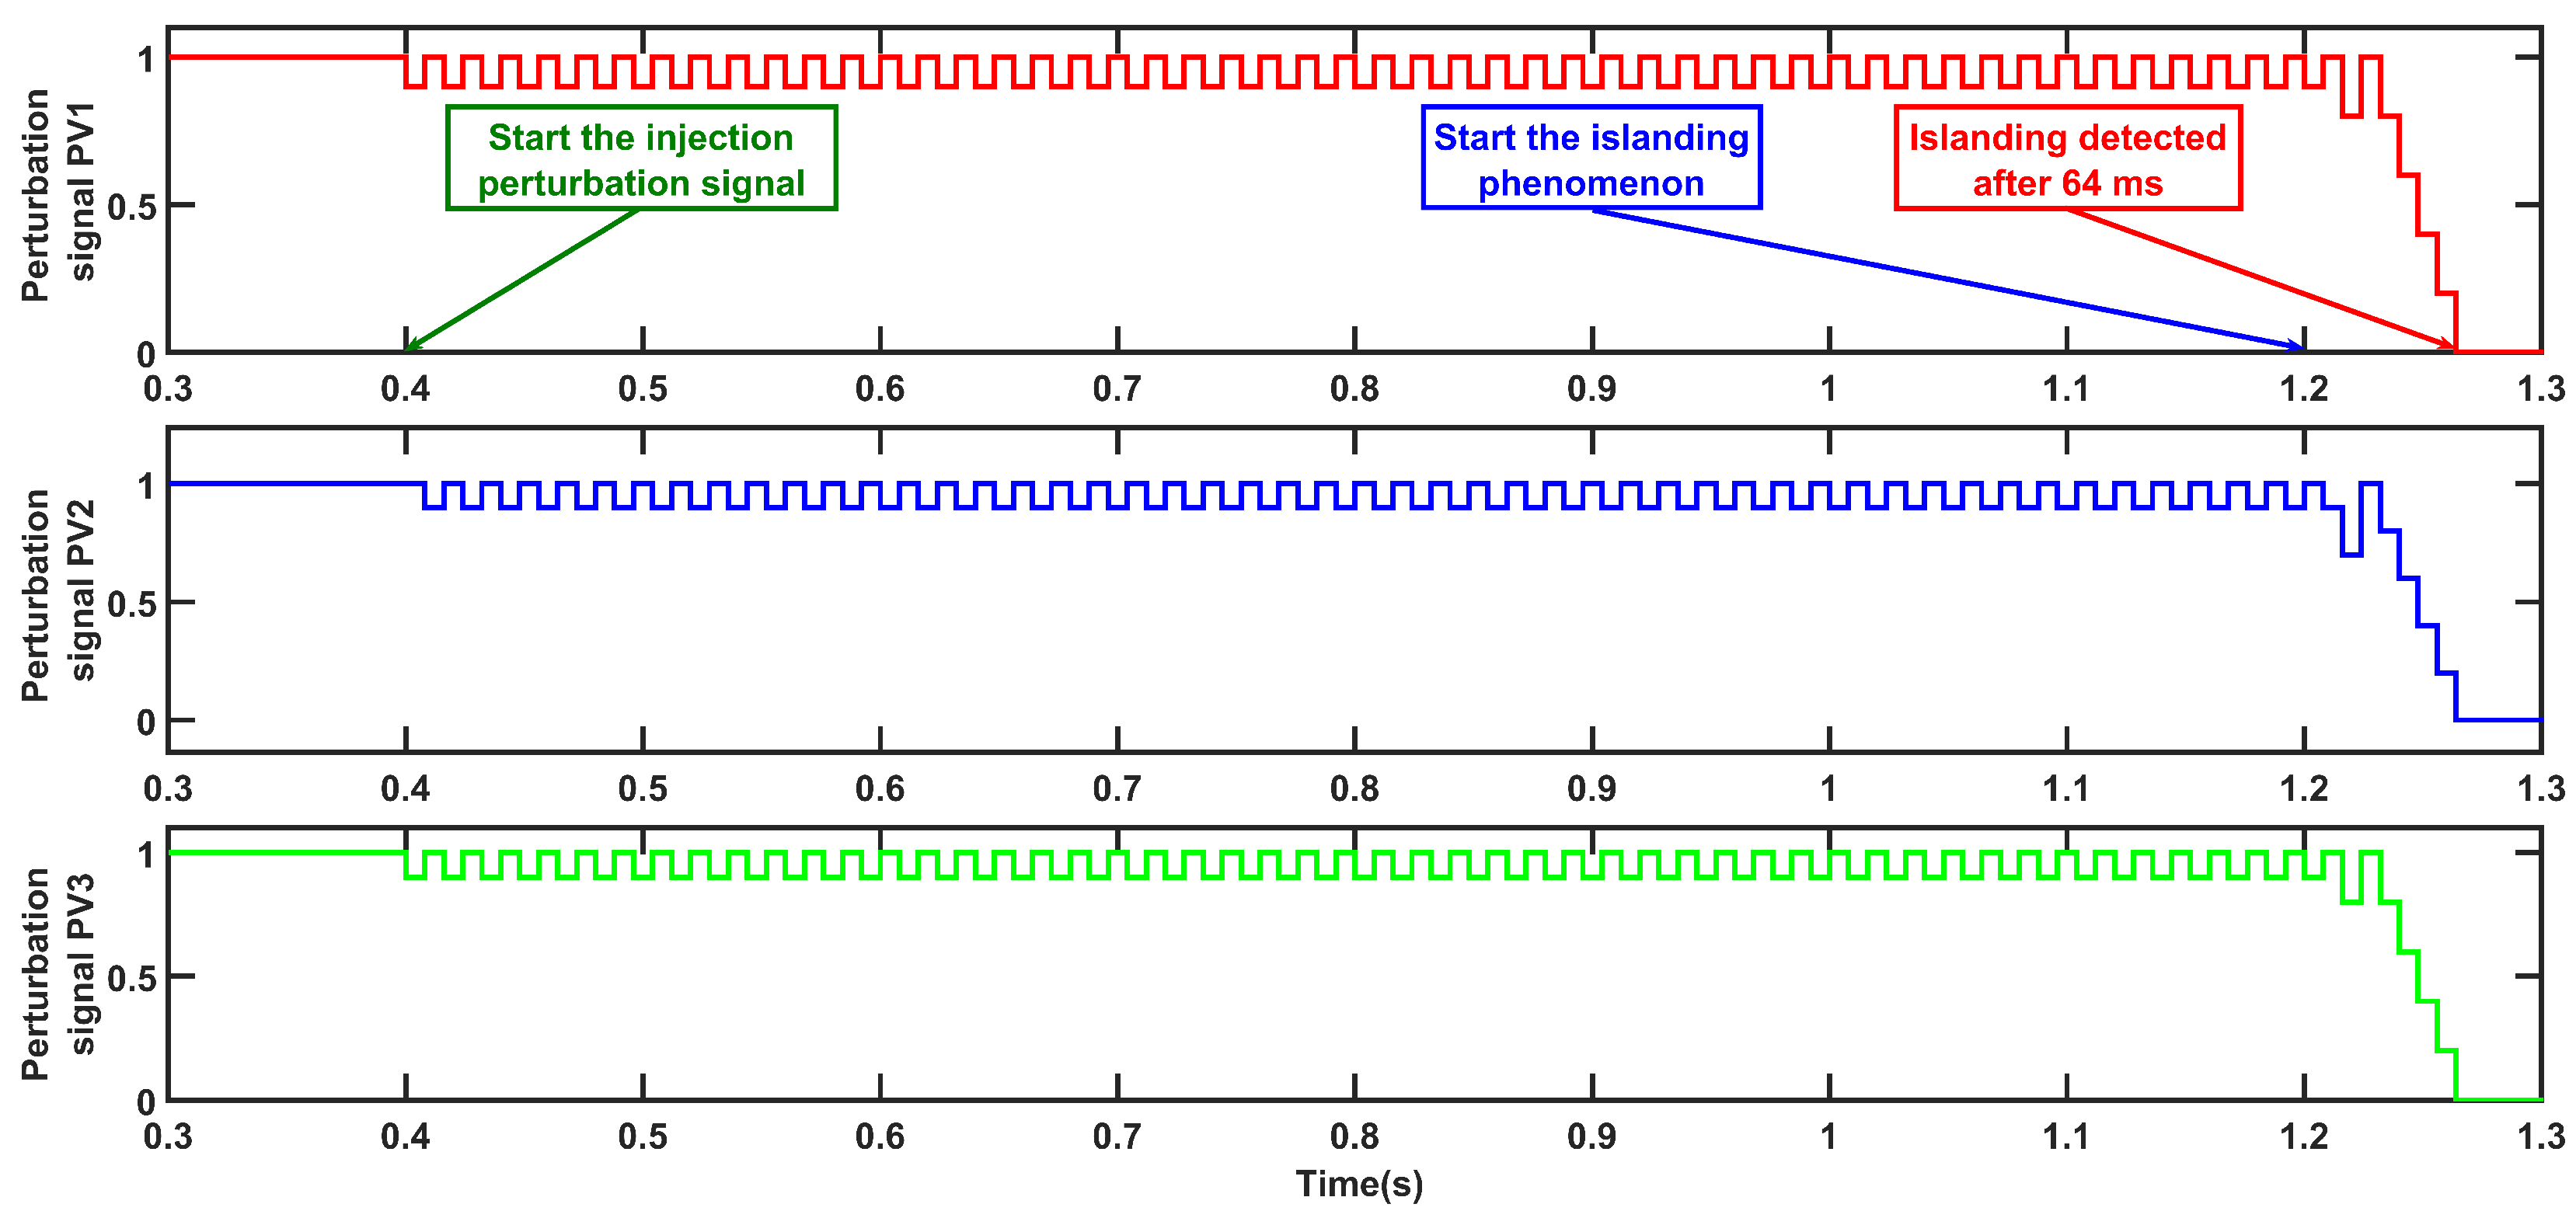
Figure 11.
Cancellation result in four-PV scenario.
Figure 12.
Solution result in four-PV scenario.
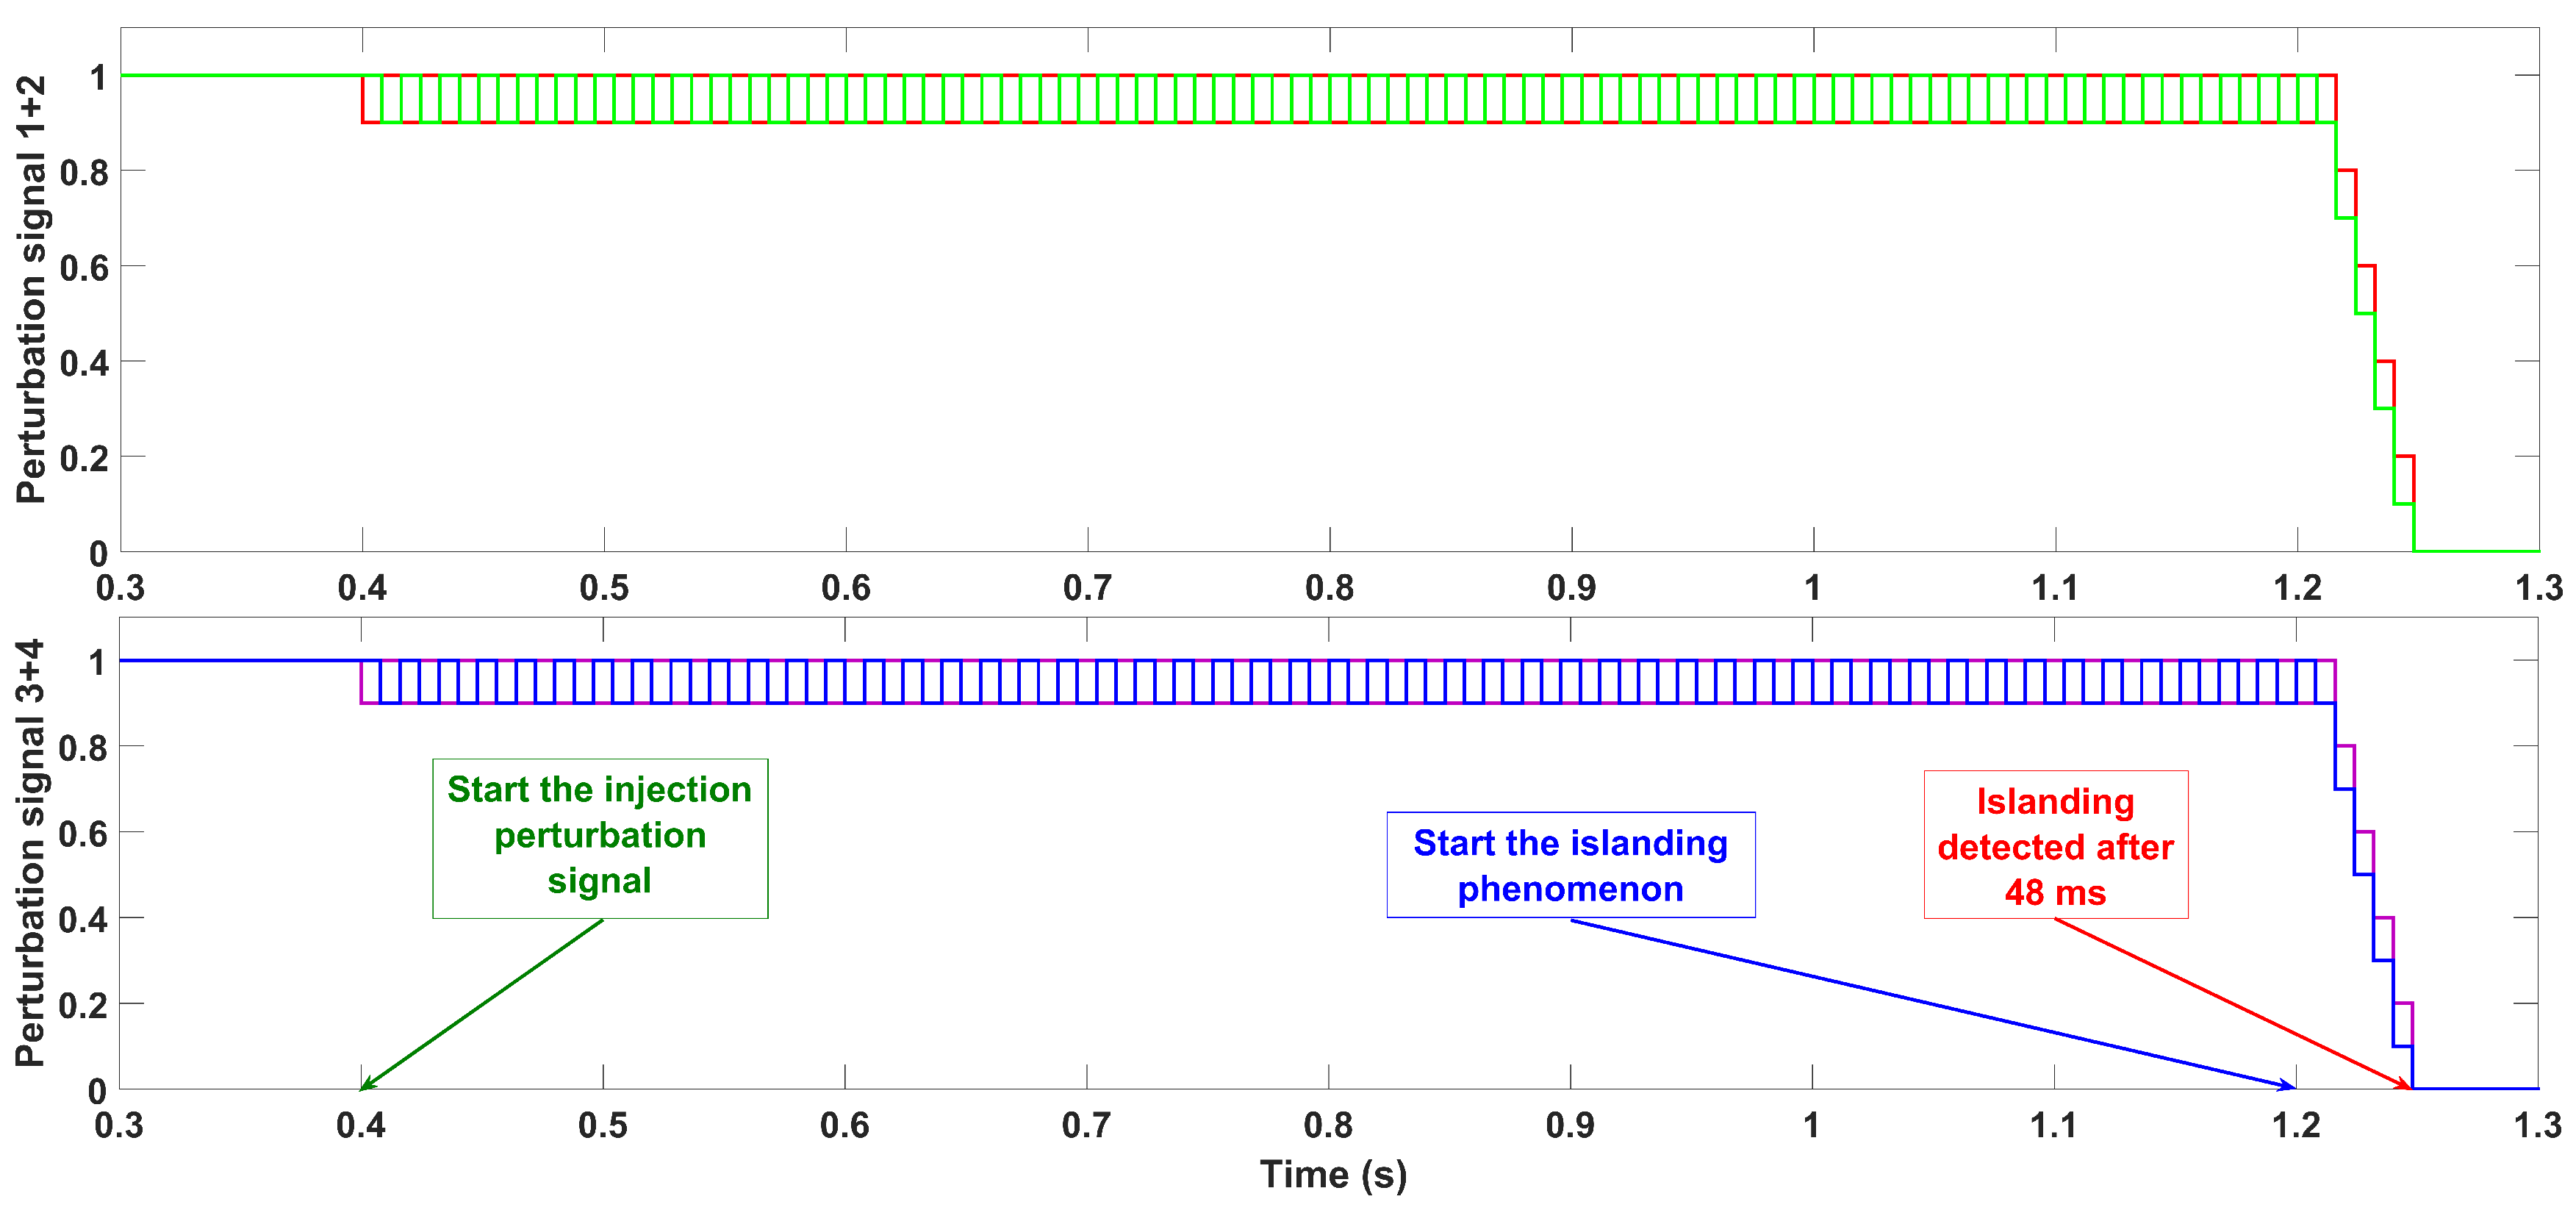
Figure 13.
Solution result in eight-PV scenario.

Table 1.
Specifications of SunPower SPR-305E-WHT-D (SunPower, San Jose, CA, USA) PV module.
| Information | Value |
|---|---|
| Open circuit voltage | 64.2 V |
| Short circuit current | 5.96 A |
| Voltage at maximum power point | 54.7 V |
| Current at maximum power point | 5.58 A |
| Maximum power | 305.226 W |
| Parallel strings | 66 |
| Series-connected modules per string | 5 |
Table 2.
Normal and cancellation scenarios.
| Cases | PV1 (kW) | PV2 (kW) | Total PV (kW) | Load (kW) | Vdc(V) |
|---|---|---|---|---|---|
| Normal | 50 | 50 | 100 | 100 | 500 |
| Cancellation | 50 | 50 | 100 | 100 | 500 |
Table 3.
Multi-PV operation scenario.
| Cases | PV1(kW) | PV2(kW) | PV3(kW) | PV4(kW) | Total PV(kW) | Load(kW) | Vdc(V) |
|---|---|---|---|---|---|---|---|
| 2-PV | 50 | 50 | 0 | 0 | 100 | 100 | 500 |
| 3-PV | 50 | 50 | 50 | 0 | 150 | 150 | 500 |
| 4-PV | 50 | 50 | 50 | 50 | 200 | 200 | 500 |
© 2019 by the authors. Licensee MDPI, Basel, Switzerland. This article is an open access article distributed under the terms and conditions of the Creative Commons Attribution (CC BY) license (http://creativecommons.org/licenses/by/4.0/).
Share and Cite
MDPI and ACS Style
Tran, T.S.; Nguyen, D.T.; FUJITA, G. The Improvement of an Islanding Detection Method Based on the Perturbation Signal in Case of a Multi-Photovoltaic Operation. Appl. Sci. 2019, 9, 4054. https://doi.org/10.3390/app9194054
AMA Style
Tran TS, Nguyen DT, FUJITA G. The Improvement of an Islanding Detection Method Based on the Perturbation Signal in Case of a Multi-Photovoltaic Operation. Applied Sciences. 2019; 9(19):4054. https://doi.org/10.3390/app9194054
Chicago/Turabian StyleTran, Thanh Son, Duc Tuyen Nguyen, and Goro FUJITA. 2019. "The Improvement of an Islanding Detection Method Based on the Perturbation Signal in Case of a Multi-Photovoltaic Operation" Applied Sciences 9, no. 19: 4054. https://doi.org/10.3390/app9194054
Note that from the first issue of 2016, this journal uses article numbers instead of page numbers. See further details here.