Article

Integrating the Shape Constants of a Novel Material Stress-Strain Characterization Model for Parametric Numerical Analysis of the Deformational Capacity of High-Strength X80-Grade Steel Pipelines

1
Department of Civil and Environmental Engineering, University of Alberta, Edmonton, AB T6G 1R1, Canada
2
TransCanada Pipelines Ltd., Calgary, AB T2P 5H1, Canada
*
Author to whom correspondence should be addressed.
Appl. Sci. 2019, 9(2), 322; https://doi.org/10.3390/app9020322
Submission received: 11 December 2018 / Revised: 11 January 2019 / Accepted: 11 January 2019 / Published: 17 January 2019
(This article belongs to the Special Issue Recent Trends in Advanced High-Strength Steels)

Abstract

:

Featured Application

A novel material stress-strain characterization model is presented herein, which is capable of precise and robust approximation of the full range of the nonlinear hardening portion of the stress-strain curve, notwithstanding the presence of a yield plateau. Parameterization of the stress-strain curve is, therefore, improved using two “shape“ constants, and material behavior is easily incorporated in the test matrix for semi-empirical modeling of the mechanical response of structural systems under various loading conditions.

Abstract

Pipelines typically exhibit significant inelastic deformation under various loading conditions, making it imperative for limit state design to include considerations for the deformational capacity of pipelines. The methods employed to achieve higher strength of API X80 line pipe steels during the plate manufacturing process tend to increase the hardness of the pipe material, albeit at the cost of ductility and strain hardenability. This study features a simple and robust material stress-strain characterization model, which is able to mathematically characterize the shape of a diverse range of stress-strain curves, even for materials with a distinct yield point and an extended yield plateau. Extensive parametric finite element analysis is performed to study the relationship between relevant parameters and the deformational capacity of API X80 pipelines subjected to uniform axial compression, uniform bending, and combined axial compression and bending. Nonlinear regression analysis is employed to develop six nonlinear semi-empirical equations for the critical limit strain, wherein the shape constants of the material model are adapted as dimensionless parameters. The goodness-of-fit of the developed equations was graphically and statistically evaluated, and excellent predictive accuracy was obtained for all six developed equations.

1. Introduction

Pipelines are commonly used as the primary means for transmission of hydrocarbon fluids in the energy industry, and for transportation of water resources in the public utility industry. Previous investigations into the main causes of damages and loss of mechanical and structural integrity in pipelines have highlighted the detrimental impacts of geological conditions or environmental actions associated with various time-dependent thermomechanical phenomena, such as ground subsidence, soil liquefaction and land sliding, discontinuous frost heave/ or thaw settlement, fault movement due to seismic action, etc. [1,2,3]. Large displacements tend to induce significant strains in the wall of pipe segments, which may ultimately result in the failure of a pipeline either due to tensile rupture, especially at welded regions, or due to bulging or wrinkling deformation of the pipe under the influence of compressive stresses [4,5,6]. As a result of the inevitable requirement for pipelines to traverse large geographical areas, a majority of pipelines in the onshore energy and public utility industry are installed below the soil surface. It is observed that, compared to above-ground pipelines, the mechanical behavior of buried pipelines is significantly influenced by the geophysical properties of the surrounding soil. Hence, the intricacies of the mutual interaction between the pipe and the surrounding soil are regarded as an important consideration in the design of buried continuous pipelines [7,8,9,10].
The common consequence of ground movement and thermal buckling deformation on pipelines is the experience of high longitudinal stresses and strains. Conventional pipeline design procedures are generally based on an “allowable stress” concept, which aims to limit the resultant longitudinal and circumferential stresses in pipelines, either due to load-controlled or displacement-controlled conditions, to a prescribed fraction of the specified minimum yield strength (SMYS) of the pipe material. Unfortunately, the allowable stress design (ASD) approach tends to be severely limited by its inability to distinguish between stable and unstable failure modes, as well as between loss of serviceability and loss of containment [11]. A strain-based design (SBD) approach has therefore been regarded as more appropriate, and has been recently more adopted by various pipeline design standards (e.g., API RP 1111 [12], DNV-OS-F101 [13], ABS 2006 [14], CSA Z-662 [15]) for design of pipelines expected to experience high longitudinal strains caused by displacement-controlled environmental and operational conditions in service [16,17]. SBD circumvents the inherent conservativeness of the ASD approach by permitting a limited amount of plastic strain, while maintaining relevant ultimate and serviceability limit state considerations. However, rather than consider the SBD and ASD approaches as independent techniques, best design practice recommends the application of SBD as a complementary tool to the more traditional ASD procedure [18]. SBD employs a limit state design approach, whereby the in-service longitudinal tensile or compressive strain that a pipeline is expected to experience due to displacement-controlled loading conditions (i.e., strain demand) is evaluated and compared to the tolerable limit of strain which the pipeline has intrinsic ability to withstand (i.e., strain capacity). Estimation of strain demand in pipelines typically involves a rigorous and often complex process, which requires all-inclusive consideration of numerous interrelating factors related to various environmental and geological conditions, and the pipe’s mechanical properties. The strain demand is also highly dependent on a number of peculiar, and sometimes transient, environmental conditions, making the development of deterministic prediction models difficult, and often necessitating the use of probabilistic and reliability-based estimation techniques for the SBD [19,20]. Unlike strain demand, evaluation of the strain capacity is essentially based on the inherent mechanical resistance of the pipe segments and has relatively less dependency on external factors, hence analytical evaluation and deterministic prediction of strain capacity is relatively more straightforward, as parameterization of influencing factors for incorporation in the SBD is relatively less complicated.
Extensive studies have been conducted by a number of researchers to investigate the limit load instability and deformational capacity of pipe segments, and cylindrical shells in general, subjected to various loading conditions. The earliest recorded investigations on the buckling behavior of pipe segments were analytical studies, known as the classical shell buckling theories, performed by Lorenz [21], Timoshenko [22], and Southwell [23] at the inception of the 20th century, which focused on deriving constitutive theoretical formulations for predicting the elastic critical buckling stress of perfect isotropic cylindrical shells subjected to pure axial compression. Subsequent experimental and analytical studies [24,25,26,27,28] pointed out some shortcomings of the classical shell buckling theories, and prescribed the extension of the classical equations to include nonlinear large-deflection considerations, as well as adequate characterization of material, geometric, and boundary characteristics. An analytical study by Brazier [29] on the circumferential flattening mode of distortion (referred to as “ovalization” or “Brazier instability”) observed in an infinitely long, circular tube subjected to pure bending led to the derivation of an expression for the limit moment. Brazier’s theory is based on the relationship between the strain energy per unit tube length and the change in axial curvature, such that the limit moment is directly related to the ovalization of the circular tube. Subsequent experimental studies [30,31,32,33], however, indicate that bifurcation instability (buckling) in the form of longitudinal wrinkling or bulging may precede the limit moment in pipes subjected to bending due to increase in axial stress on the compression side of the pipe. Corona and Kyriakides [34] explained that bifurcation instability is more likely to precede Brazier instability in “thinner” tubes, and vice versa in “thicker” tubes. They further speculated that the transition between one preceding instability phenomenon and the other occurs in the range of D/t (diameter/thickness) ratios between 35 and 45. Mathon and Limam [35] performed statistical evaluation of results obtained from (1) experimental tests of circular tubes under pure bending [36], (2) empirically-derived analytical formulations for cylinders under combined axial compression and bending [37], and (3) semi-empirical derivation of the critical buckling stress for pressurized circular tubes subjected to uniform bending [38]. They observed that the critical buckling stress of cylinders under pure bending is generally between 20 to 60% higher, depending on the diameter-to-thickness ratio (D/t ratio), than that of cylinders under pure axial compression.
Using a special-purpose non-linear finite element technique, Houliara and Karamanos [39] studied the structural stability of long uniformly pressurized thin elastic tubular shells subjected to in-plane bending. They observed that external overpressure reduces the buckling moment and corresponding curvature but increases the buckling wavelength, whereas internal overpressure tends to increase the buckling moment but reduce the cross-sectional ovalization and the buckling wavelength. Following a systematic series of experiments and by Limam et al. [40] involving stainless steel tubes bent to failure at fixed values of internal pressure, it was shown that cross-sectional ovalization and circumferential extension occur simultaneously, due to bending and internal pressure, respectively. Ref. [40] also performed computational simulation of the evolution of wrinkling and its eventual localization using a finite element (FE) shell model, and observed that internal pressure tends to stabilize the structure and increase the wavelength of the wrinkles, while also shifting the initiation of buckling towards the plastic range of the material. Ref. [40] indicates that accurate simulation of the structural stability of tubular shells requires accurate characterization of the nonlinear inelastic properties of the material stress-strain behavior, including yield anisotropies, as well as adequate representation of initial geometric imperfections. Highlighting the significant effect of the material properties on the moment-curvature relationship, Ref. [34] established that for pipes with D/t ratios less than 200, the mechanical and structural instabilities of the structure are strongly influenced by the interaction of the induced ovalization and the plastic and nonlinear characteristics of the material.
This study focuses on the deformational capacity of high-strength API-X80 [41] grade pipelines subjected to various loading conditions. The continuous increase in world energy demand has compelled the hydrocarbon industry to venture into more remote and more environmentally hostile environments in search of fossil fuels. This predicament necessitates the construction and operation of pipelines with the best possible transport efficiency and at the lowest possible cost, therefore initiating a tendency towards using line pipes of larger diameter or maintaining higher operational pressures. High-strength steel grades provide the advantage of forming line pipes with high material yield strength, thus reducing the wall thickness requirement for internal (or external; in the case of deep to ultra-deep offshore environments) pressure containment [42]. Suzuki and Toyoda [43] explained that the peak moment strain, and invariably the deformational capacity of line pipes, is strongly influenced by the strain-hardening characteristics of the pipe material. In a numerical study of API-X100 line pipes subjected to axial compression or bending moment, Suzuki et al. [44] pointed out that high-strength pipe steels tend to have inferior strain hardening properties, and consequently lower deformational capacity, compared to conventional pipeline steels of lower yield strength. However, results of a few experimental studies have shown that by carefully manipulating the thermomechanical control processes (TMCP) of slab reheating, rolling, and cooling during the manufacture of parent steel plates, the microstructural and mechanical properties of steel can be adjusted to produce line pipe steels with improved deformability, toughness, and resistance to strain-aging [45,46,47].
Kong et al. [48] explained that the basic morphology of most high-strength pipeline steels is a multiphase structure composed of ferrite, bainite, and martensite. While bainite and martensite ingredients naturally improve the strength and hardness of line pipe steel, ductile and plastic deformation capacities tend to be compromised. Also, variability in manufacturing processes of parent steel plates makes it inevitable for line pipes of the same grade classification to exhibit slight differences in material properties [49,50]. While manufacturing variability may be regarded as the primary cause of difference in the strain-hardening characteristics of materials with the same grade classification, other factors, such as strain aging, have also been observed to cause significant alteration of the material properties, leading to higher yield strength but lower deformational capacity [51]. Moreover, it has been established that the buckling response of pipes is highly sensitive to the material behavior, especially in the nonlinear range of the stress-strain relationship. Hence, it is imperative that the mathematical model that serves for characterization of the material stress-strain relationship should simultaneously provide reasonable simplicity and representative accuracy. Recent studies by Ndubuaku et al. [52,53,54,55] have led to the development of a novel stress-strain expression, referred to as the “Ndubuaku model”, which has proven to be exceptionally convenient and effective for parameterizing the true stress-true strain relationship of any metallic material with a non-negative gradient throughout the stress-strain curve, including materials with a distinct yield point and an extended yield plateau. The “Ndubuaku model” approximates the material stress-strain curve over the full range of strains using only two constitutive model constants (or “shape” constants), referred to as the “knee” constant and the “heel” constant.
The procedures implemented in this study for estimating the peak moment strain and the compressive limit strain take a cue from the semi-empirical modeling approach adopted by various prominent pipeline design standards [12,13,14,15]. ABAQUS CAE [56] was employed to create FE (finite element) pipe models for this study and three different loading conditions were studied: uniform axial compression, uniform bending, and combined axial compression and bending. Four variations of a constant net-section compressive axial stress were applied to the pipe models prior to bending to simulate combined axial compression and bending. Four and five variations of the D/t ratio and applied internal pressure, respectively, were also applied to the pipe models. The “Ndubuaku model” was used to create two sets of stress-strain curves according to the two main classifications of stress-strain curves for metallic materials, i.e., round-house type (RHT) curves and yield-plateau type (YPT) curves. Four and five variations of RHT and YPT curves, respectively, were created so that the numerical analyses performed in this study culminated in a total of 1080 separate FEA (finite element analysis) runs; 180 runs for uniform axial compression, 180 runs for uniform bending, and 720 runs for combined axial compression and bending. Advanced nonlinear regression techniques were subsequently employed to develop mathematical expressions for predicting the critical limit strain (CLS) for each loading condition using a powerful computational package, Wolfram Mathematica [57]. The strain-hardening peculiarities of the stress-strain curves were parameterized by the model “shape” constants of the “Ndubuaku model” and incorporated in the derived semi-empirical models.

2. Characterization of Material Stress-Strain Behavior

The “Ndubuaku model” was adopted in this study to adequately capture the slight variations that are generally observed to exist in the stress-strain response of metallic materials. Details of the fundamental concept and successive steps for developing the adopted material model have been previously presented in recent publications by Ndubuaku et al. [52,53,54,55]. The mathematical form of the material model derives the true stress ( σ ) as a function of the true strain ( ε ), using two “shape” constants, the “knee” constant (knm) and the “heel” constant (hnm):
σ = { E ε σ σ p l σ p l + ( σ u p σ p l ) ( ε ε p l ε u p ε p l ) k n m ( ε ε p l ε u p ε p l ) h n m σ > σ p l
where E is Young’s modulus of elasticity, σ p l and ε p l are the proportionality limit stress and the proportionality limit strain, respectively, and the ultimate proof stress and corresponding ultimate proof strain are represented by σ u p and ε u p , respectively. The first part of Equation (1) represents the linear (elastic) portion of the stress-strain curve, where the relationship between the stress and the strain is simply defined by the elastic modulus, E, while the second part characterizes the entire nonlinear portion of the stress strain curve, beginning at the proportionality limit stress (PLS) and terminating at the nominal ultimate proof stress (UPS).
The “Ndubuaku model” is easily applicable for generating any desired number of idealized strain curves by simply specifying two stress control points ( σ c 1 and σ c 2 ) and corresponding strain control points ( ε c 1 and ε c 2 ) according to the following expressions [54]:
k n m = ε R 1 ( h n m ) I n ( σ R 1 ) I n ( ε R 1 )   o r   ε R 2 ( h n m ) I n ( σ R 2 ) I n ( ε R 2 )
h n m = I n [ I n ( ε R 1 ) . I n ( σ R 2 ) I n ( σ R 1 ) . I n ( ε R 2 ) ] [ I n ( ε R 1 ) I n ( ε R 2 ) ]
where, σ R 1 = σ c 1 σ p l σ u p σ p l , σ R 2 = σ c 2 σ p l σ u p σ p l , ε R 1 = ε c 1 ε p l ε u p ε p l ,   and ε R 2 = ε c 2 ε p l ε u p ε p l .
To ensure conformity with the API 5L [41] specifications for X80 grade line pipe steels, the material model was employed such that all the stress-strain curves for this study (shown in Figure 1) are characterized by the same nominal yield stress (YS) and nominal ultimate proof stress (UPS), but different strain hardening properties.
As indicated by the plots in Figure 1, the nominal yield stress (YS = 586 MPa) was maintained at the stress corresponding to a total strain of 0.5% (i.e., σ 0.5 ), while the nominal ultimate proof stress (703 MPa) was maintained at the stress corresponding to a total strain of 10% (i.e., σ 10 ). The value of the elastic modulus was selected as 205,800 MPa. The strain hardening for the YPT materials was varied by simply changing the yield plateau length (YPL) of the stress-strain curves, while the various strain hardening properties of the RHT curves were obtained by adjusting the proportionality limit stress (PLS) of the stress-strain curves. The numeric designations of the elements of the graph legends for the stress-strain curves in Figure 1a and Figure 1b represent the YPL and the PLS, respectively. The YPLs are defined in terms of the total strain in percentage (%) units, while the PLSs are defined in megapascal (MPa) units.
The constitutive model constants which define the shapes, and invariably the strain-hardening characteristics, of the generated stress-strain curves are presented in Table 1.
For better representation of the shape constants two new designations, the “knee” factor ( K f ) and the “heel” factor ( H f ) are defined in Table 1 as inverse functions of the “knee” constant, K n m , and the “heel” constant, H n m , respectively.

3. Methodology of Numerical Analysis

Pipelines made of API X80-grade line pipe steel were numerically simulated in this study using a tubular FE shell model developed with ABAQUS/Standard, in order to study the stability of steel pipelines when subjected to uniform axial compression, uniform bending, or combined axial compression + bending. The parameters investigated in the FE study were selected according to three factors considered to be most influential to the buckling response and respective limit strains of tubular shell structures, i.e., the dimensional factor (related to the D/t ratio), the load factor (related to internal or external overpressure), and the strain hardening factor (related to shape of stress-strain curve). Four variations of the D/t ratio were specified thus: DT1 = 41.152, DT2= 64.078, DT3 = 82.156, and DT4 = 104.622. The D/t ratio was varied by maintaining the pipe’s outer diameter (OD) at a constant nominal pipe size (NPS) of 36 inches (914.4 mm), and respectively changing the wall thickness of the pipe models thus: t1 = 22.22 mm (for DT1), t2 = 14.27 mm (for DT2), t3 = 11.13 mm (for DT3), and t4 = 8.74 mm (for DT4). In addition to non-pressurized conditions, four levels of internal pressure corresponding to 20%, 40%, 60%, and 80% of the yield pressure in the circumferential direction were applied to the pipe models. To properly account for the influence of the material’s strain hardening properties on the CLS, three material-related parameters each were derived for both YPT curves and RHT curves. The two parameters obtained for both RHT and YPT pipes comprised the two model “shape” constants ( K n m and H n m ), while the yield plateau length (YPL) was applied as the third parameter for YPT pipes and the ratio of the PLS to the UPS (herein referred to as the “PLUS” ratio) was considered as the third parameter for RHT pipes.
The pipe geometry was modeled as a 3D deformable shell structure, and for computational efficiency, symmetric boundary conditions were applied in the longitudinal and transverse directions of the pipe, so that only a quarter of the full pipe specimen (half of the specified length and half of the circumference) was modeled. The numerical analysis procedure conducted in this study is a geometric and material nonlinear type; hence, the boundary conditions applied to create the X- and Z-symmetries for the assumed quarter models are able to provide an accurate representation of the actual response of the full pipe models. With the application of the Z-symmetry boundary condition (symmetry across the X-Y plane), the quarter pipe models were therefore extruded to three times the pipe diameter (3.0*D). The assigned length of the pipe model was selected according to the recommendations of Liu et al. [58] to ensure that there are no interactions between the end boundary conditions and the strain and stress distribution at the pipe mid-length, where initiation of local buckling deformation is expected to occur. At the loading end of the pipe model (i.e., the end where the rotation or axial displacement was applied), a reference point was created at the center of the pipe cross-section and restrained such that only translation along the Z-axis was allowed for uniform axial compression, and rotation about the X-axis plus translation along the Z-axis was allowed for uniform bending and combined axial compression + bending. A kinematic coupling constraint was then assigned for connecting the nodes at the loading end to the reference point to allow the end of the pressurized pipe to expand in the radial direction throughout the applied loading. The kinematic coupling constraint was defined in the cylindrical coordinate system to permit only one degree of freedom, i.e., circumferential extension, thereby inducing a uniform stress field and consequently facilitating the initiation of buckling at the mid-length cross-section of the pipe segment.
The four-node reduced-integration shell elements (S4R) with hourglass control in the ABAQUS element library were used for all the analyses, enabling up to five integration points through the wall thickness of the pipe models. The S4R elements are suitable for the analysis of thin to moderately thick shell structures with material and geometric nonlinearities. A mesh convergence study was conducted to establish the optimum number of elements required for the FE simulation, and a mesh size approximately equal to 3% of the pipe diameter (0.03*D) was applied respectively to all the FE pipe models. A large-strain von Mises plasticity model with isotropic hardening was applied to the line pipe steel material. Calibration of the material response is assumed to be related to the true stress vs. true strain relationship from a uniaxial tensile test performed on a coupon specimen of the pipe materials, hence, respective stress-strain curves were assigned to the pipe models using the standard multilinear material definition facility in ABAQUS.
For the three different loading conditions considered in this study, two loading steps (an initial load-controlled step followed by a displacement-controlled step) were defined in addition to the default “Initial” step in ABAQUS CAE for each simulation. To adequately track the nonlinear equilibrium path of deformation at the reference critical portions of the pipe segment, recording of the resultant moment and resultant compressive force, as well as the corresponding limit strains, was performed at the displacement-controlled stage of each simulation. In the initial load-controlled step of the simulation for uniform axial compression, specified levels of internal pressure were applied to the pipe models, while a monotonically-increasing uniform axial displacement was applied to the loading-end reference point in the following displacement-controlled step. Internal pressure was applied in the load-controlled step for uniform bending, while a monotonically-increasing rotation was subsequently applied to the loading-end reference point in the displacement-controlled step. For the load-controlled phase of the combined axial compression and bending, a finite compressive axial force was applied to the loading-end reference point, while respective percentages of the circumferential yield pressure were simultaneously applied to the internal surface of the pipe models. A monotonically-increasing rotation was then applied to the loading-end reference point in the second step. For combined axial compression + bending, the compressive axial force applied to the pipe prior to the monotonically-induced curvature was measured as respective percentages (20%, 40%, 60%, and 80%) of the peak force under uniform axial compression.
The measurement scheme for the average compressive strain is adopted for this study in line with the recommendations of Liu et al. [58]. For uniformity of estimation, the same measurement scheme was employed to determine the average values of compressive strain in the pipe models. The measurement scheme was defined with reference to the pipe model under uniform bending by evaluating the average value of the compressive strain of all the meshed elements within the reference gauge area on the compressive side of the pipe model. The measurement area was selected immediately adjacent to both the Z-symmetry plane and the X-symmetry plane, and corresponded to a longitudinal distance equal to the pipe diameter (1.0*D), and a circumferential distance approximately equal to one-eighth of the pipe diameter (0.125*D), respectively (shown in Figure 2). The critical limit strain was derived from the results of the individual FE runs in this study based on a “peak load criterion” [59], which regards the “critical” value as the resultant compressive longitudinal strain measured at the onset of local buckling, and is derived as the average strain that corresponds to the onset of “softening” in the load-deformation response (i.e., the X-Y plot of the average compressive strain on the X-axis versus the loading-end reaction moment or the loading-end reaction force on the Y-axis). A cylindrical coordinate system (with the origin at the center of the pipe cross-section) was assigned to the pipe model for obtaining the average longitudinal strains, while the loading-end reaction moment and the loading-end reaction force were obtained in the default Cartesian coordinate system.

4. Numerical Results

Based on the stipulated parameters, and using the above numerical simulation techniques, the post-processing module in ABAQUS CAE was used to extract field output data after each run, such that the recorded incremental values for the reaction force (“RF3”) or reaction moment (“RM1”), and the corresponding average compressive strains over the gauge length area were exported to a Microsoft Excel spreadsheet to estimate the critical limit strain of the API X-80 grade steel pipeline models. The individual variable functions that form the semi-empirical models generated in this study emanate from the observed trends of the CLS, with respect to the various parameters investigated.

4.1. Validation of Numerical Model

The pilot FE pipe model was validated by comparing the result obtained for pure bending of an unpressurized pipe model of D/t ratio = 64 to the result of an experimental study by Mohareb et al. [60], and satisfactory correspondence between the FE result and the experimental result was obtained for the end reaction bending moment vs. average induced curvature response, as well as the diamond-shaped wrinkling deformation at failure (Figure 3).

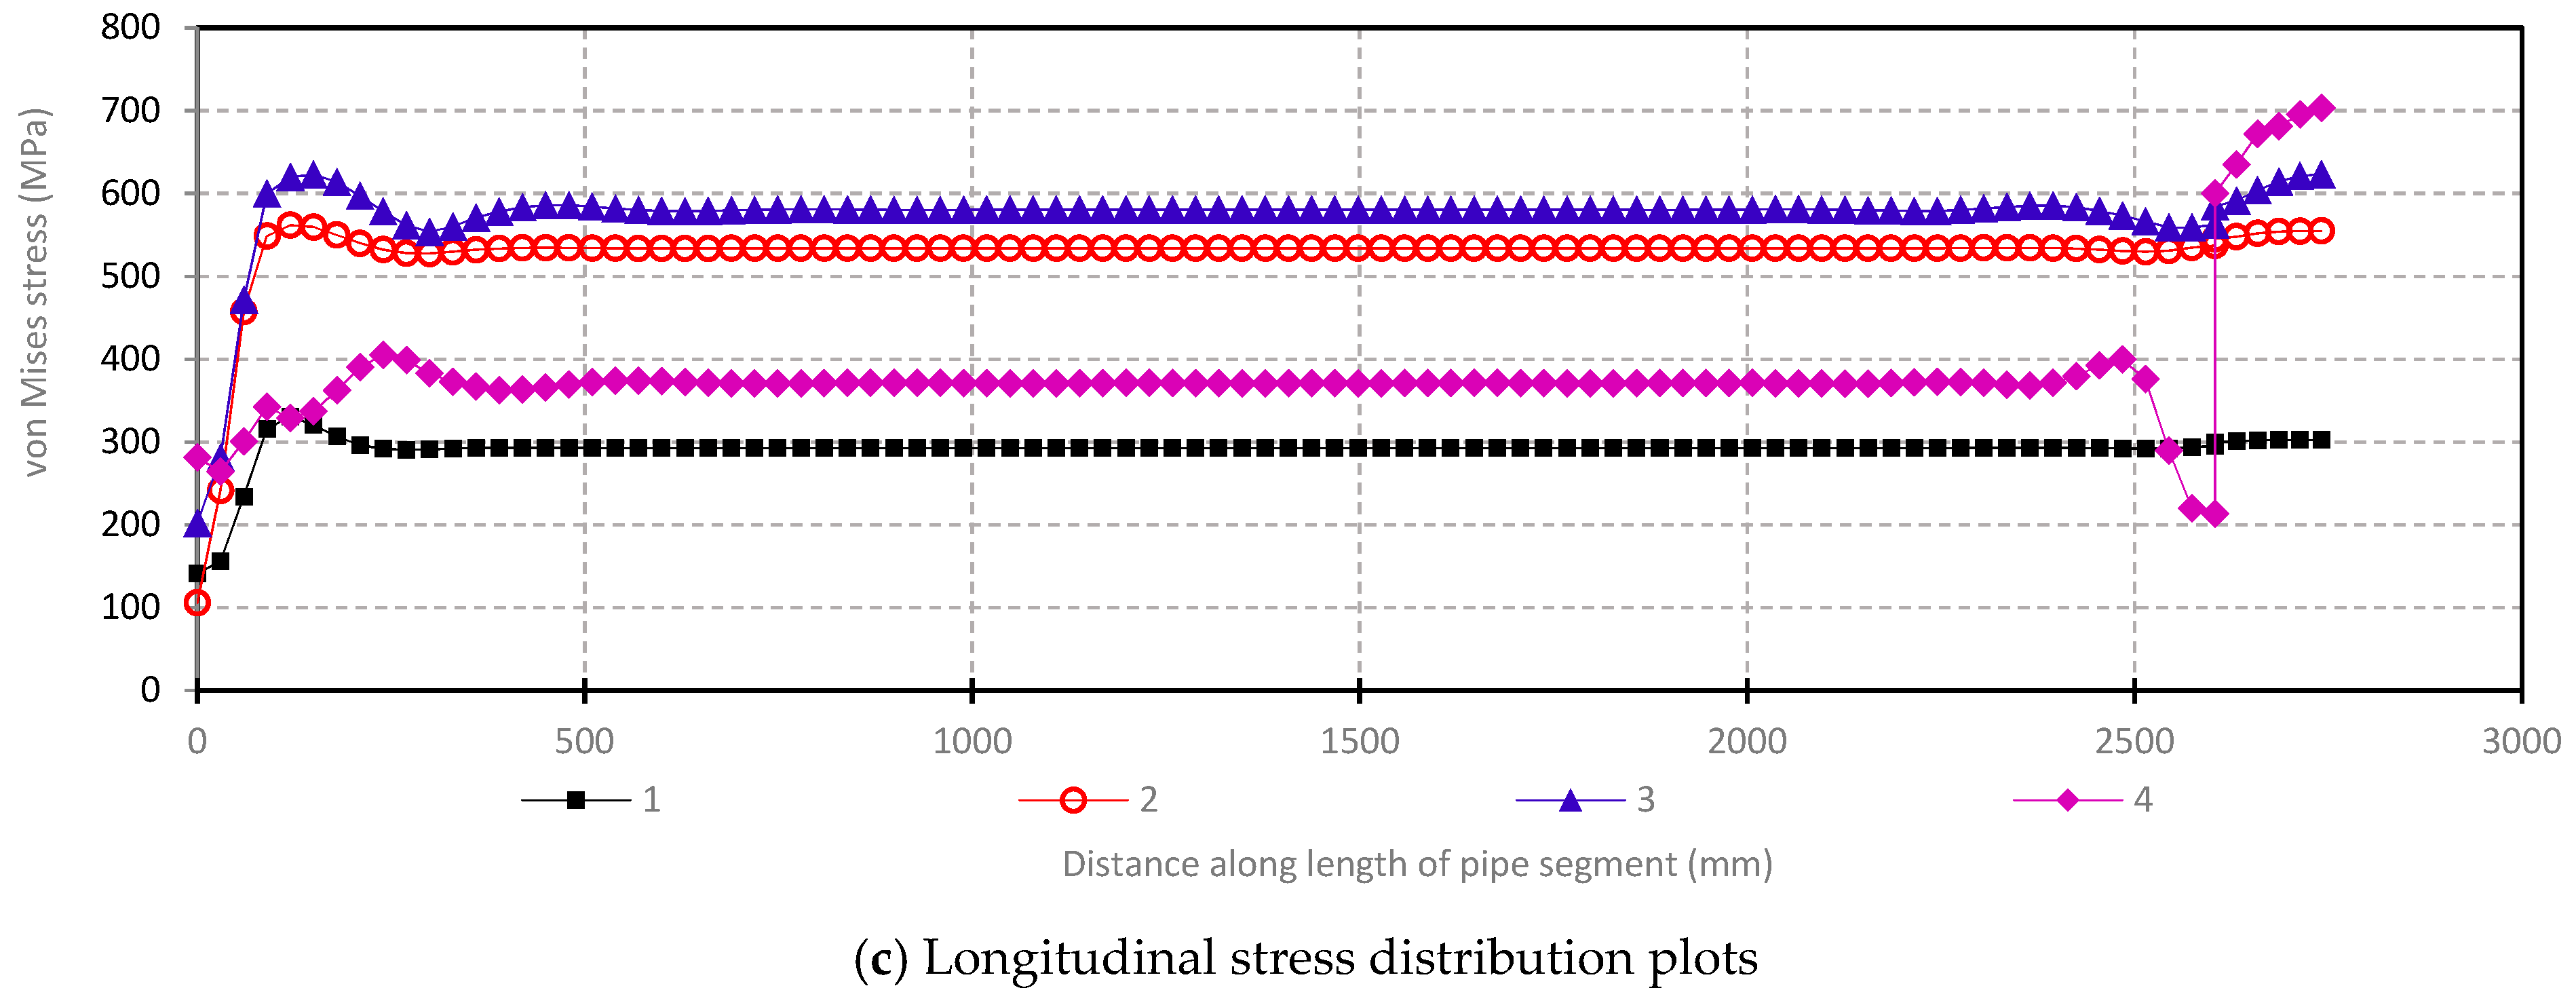
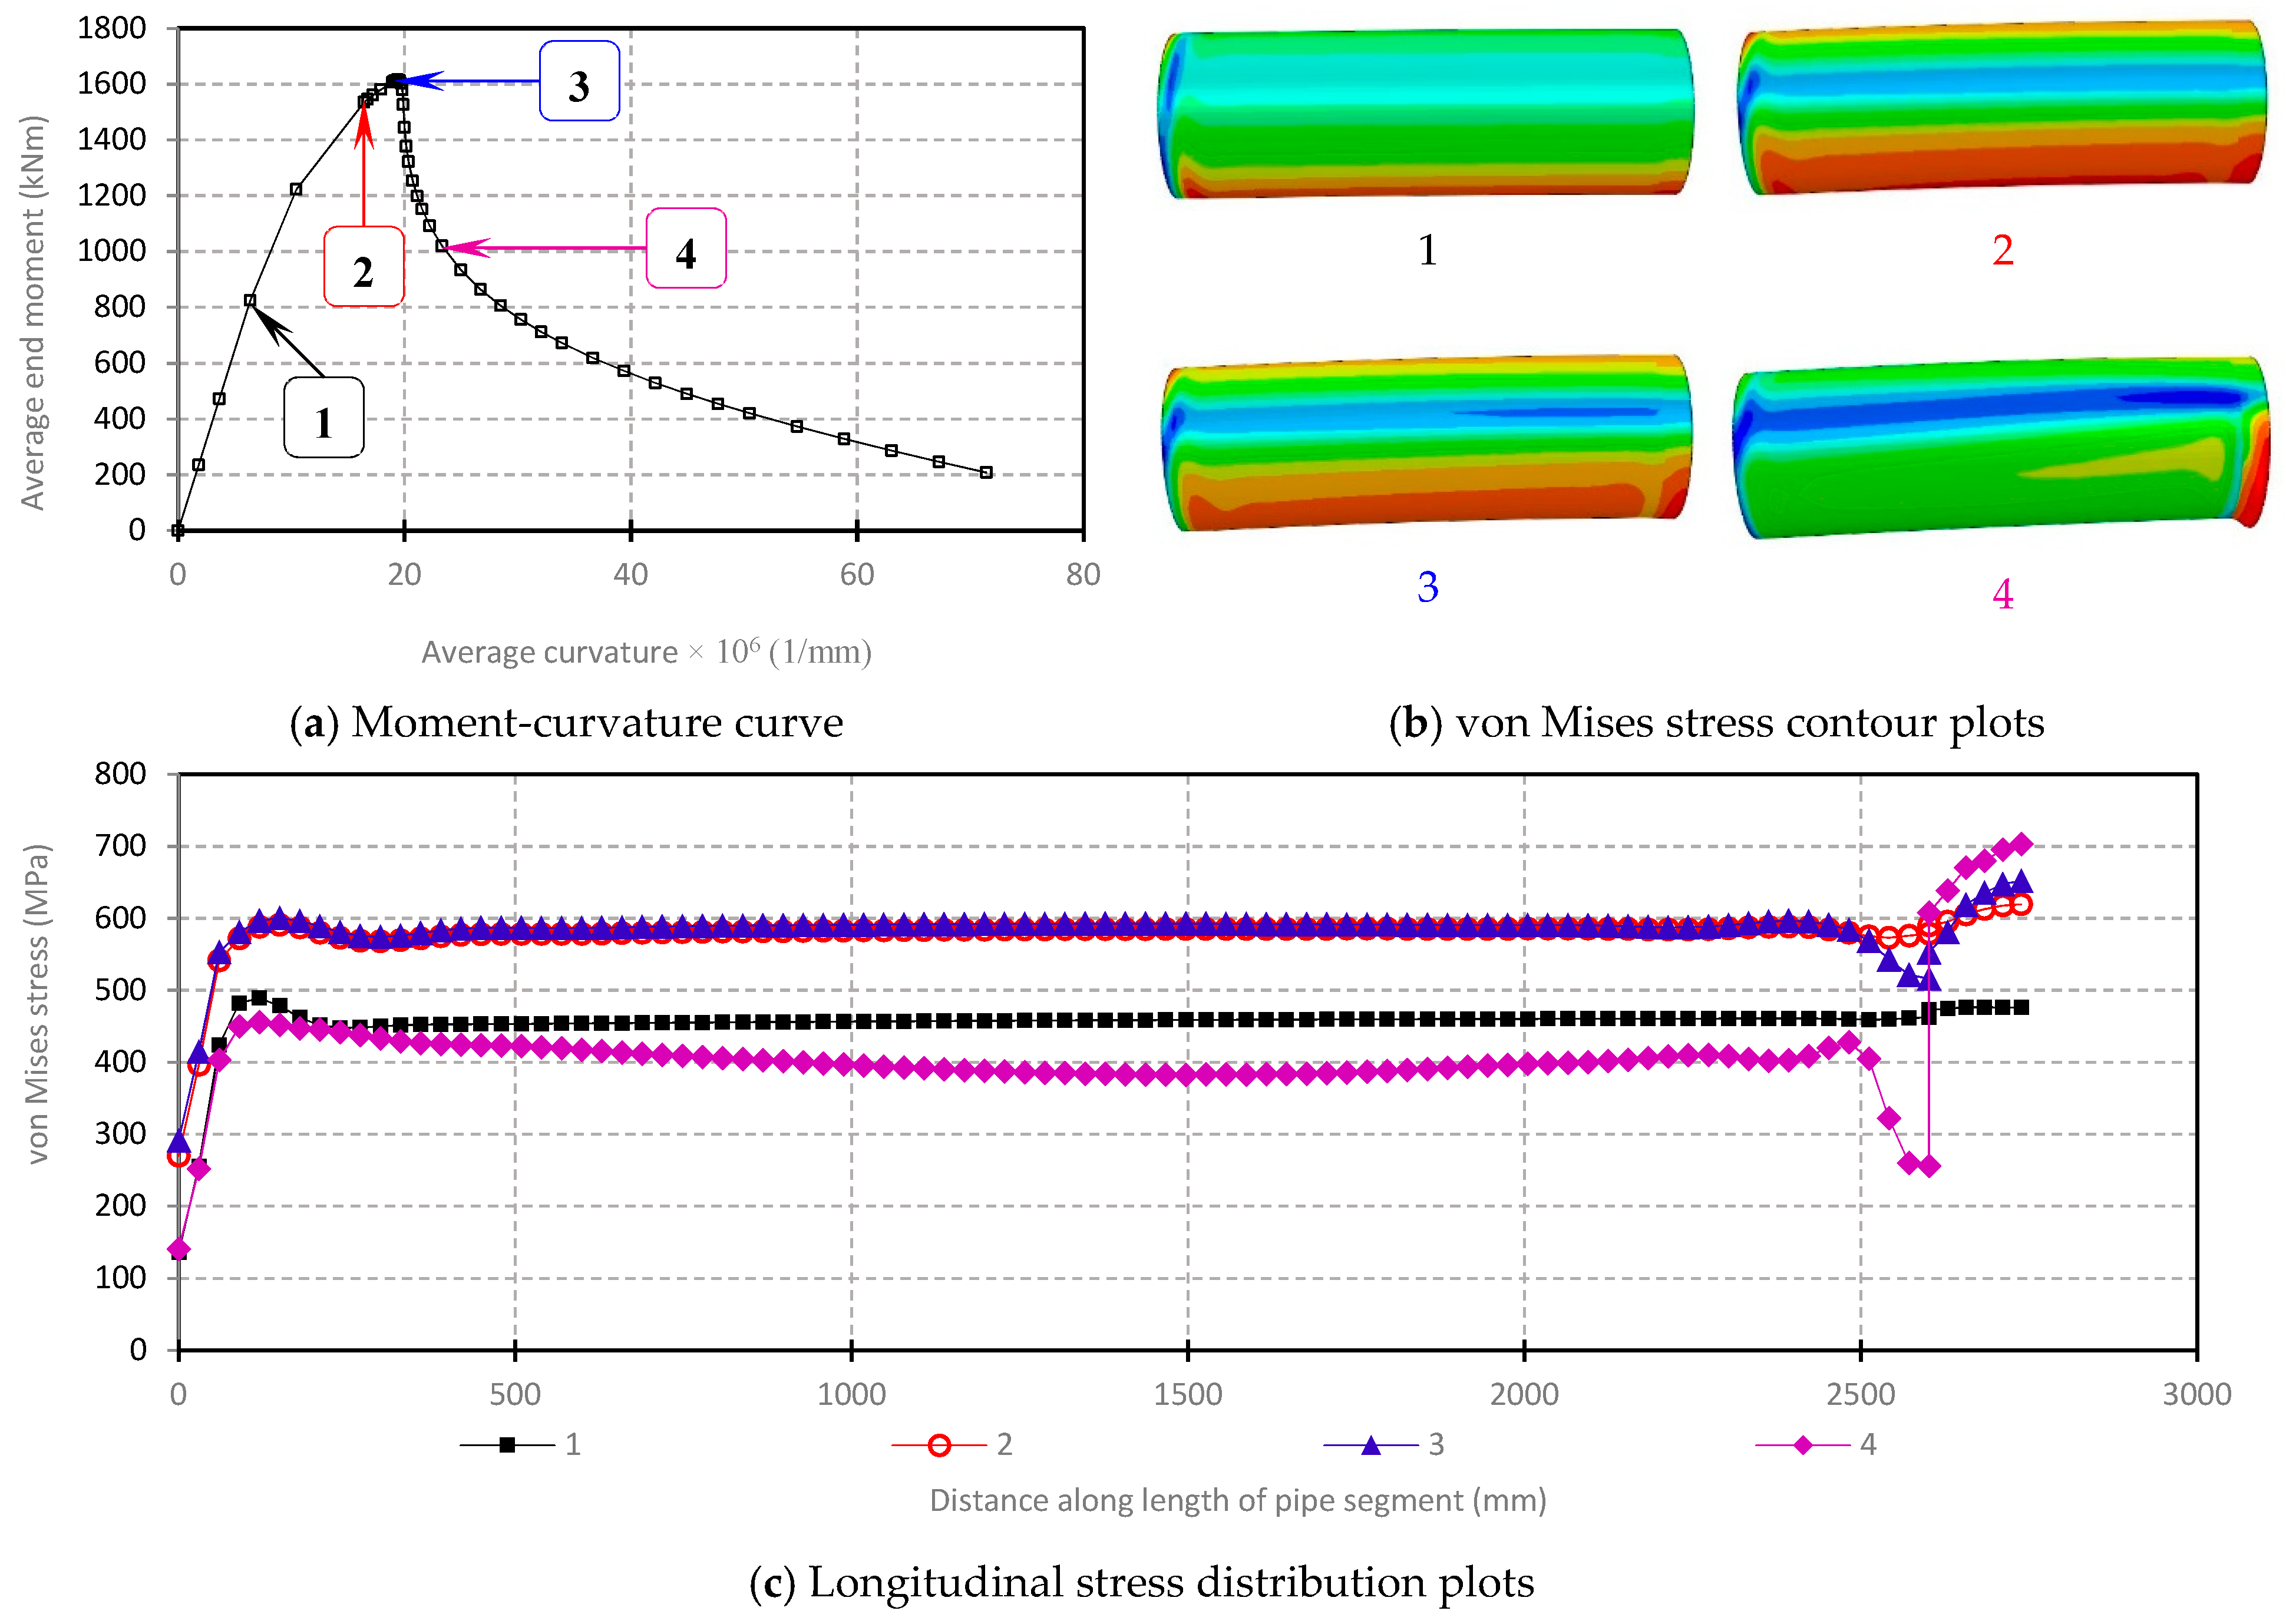
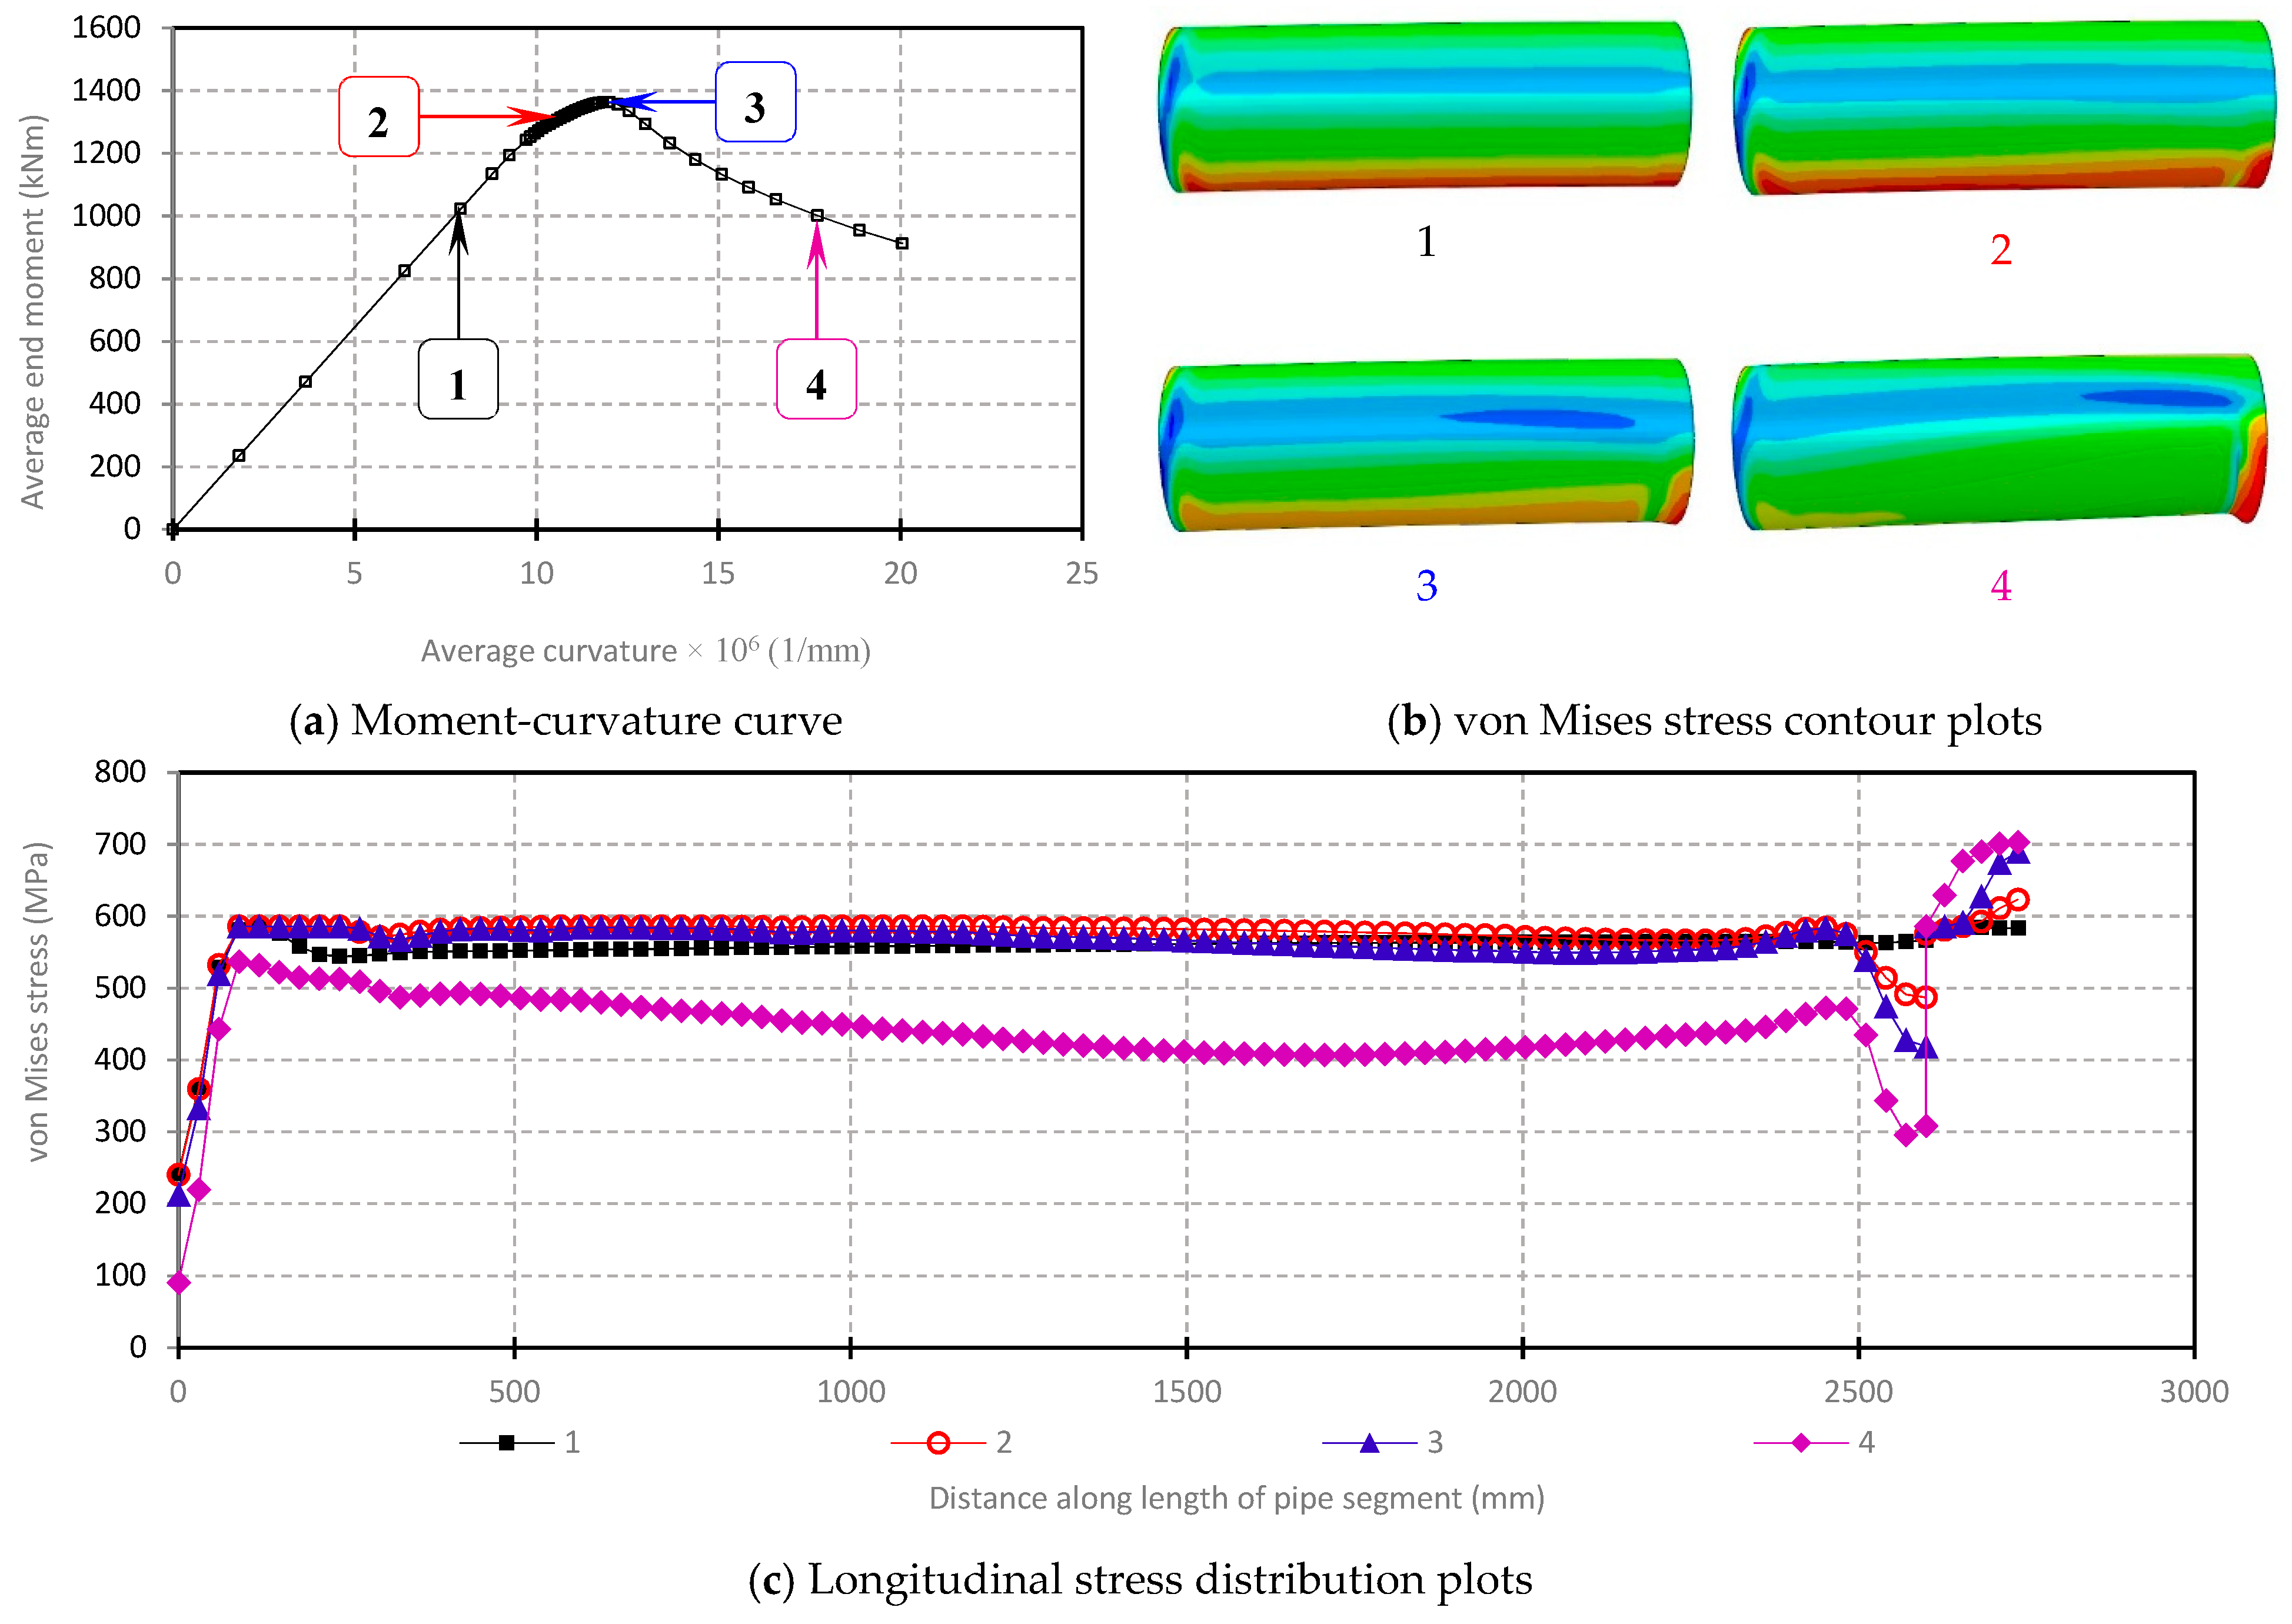
4.2. Evolution of Stress in Pipes

The evolution of the resultant stress along the length of pipe segments due to applied loads and induced deformation is portrayed in the following figures using contour plots of the von Mises stress. The contour plots are captured at various points along the path of the load-displacement (or moment-curvature) curve, which coincide with three of the strategic stages of the load-deformation response, i.e., pre-buckling, limit load, and post-buckling. Figure 4a and Figure 5a represent the axial load-displacement plots of YPT pipes and RHT pipes, respectively, under uniform axial compression. Figure 6a and Figure 7a represent the moment-curvature plots of YPT pipes and RHT pipes, respectively, under uniform bending. The longitudinal distribution of the von Mises stress at the extreme of the compression side of the pipe’s cross-section, which is aligned with the bending plane, is plotted in Figure 4b and Figure 5b for YPT pipes and RHT pipes, respectively, under uniform axial compression. The longitudinal stress distribution is plotted in Figure 6b and Figure 7b for YPT pipes and RHT pipes, respectively, under uniform bending. Contour plots of the von Mises stress at specified stages of the load-deformation response are respectively presented in Figure 4c and Figure 5c for YPT pipes and RHT pipes under uniform axial compression, while the contour plots for YPT pipes and RHT pipes under uniform bending are presented in Figure 6c and Figure 7c, respectively. The results presented in Figure 4, Figure 5, Figure 6 and Figure 7 are for DT4 pipes with fp = 0.4; where the YPL = 1.0% for the YPT pipes and the PLUS ratio = 0.691 for the RHT pipes. The von Mises contour plots are longitudinally aligned with the longitudinal stress distribution plots such that the left end is the load end and the right end is mid-length cross-section of the pipe.
The plots presented in Figure 4, Figure 5, Figure 6 and Figure 7 indicate that the von Mises stress is constant over the entire length at the compression zone of the pipe in the pre-buckling stage (i.e., from the beginning of load application until buckling occurs). Buckling is associated with the formation of a longitudinal wrinkle, and may either precede the limit load, as in Figure 5a, Figure 6a and Figure 7a, or coincide with the limit load, as in Figure 4a. The limit load is typically reached when the von Mises stress in the extreme compression fibers of the pipe reach the yield stress of the pipe material, after which localization of strains and resultant stresses commences at the mid-length region of the pipe, and the remaining portions of the pipe experience a stress relief. Attainment of the limit load is essentially followed by load collapse and softening of the load-deformation response. The above plots indicate that, beyond the limit load, the von Mises stresses in the compression zone evolve such that the stresses around the mid-length cross-section advance towards the UPS, while the stresses in the remaining portions of the pipe continue to decrease.

4.3. Results of Parametric Analysis

The influence of the D/t ratio, internal pressure, and material strain-hardening (represented by the YPL for YPT pipes, and PLUS ratio for RHT pipes) on the CLS of X80 pipes is outlined herein for the three different loading conditions considered. The PLUS ratios, defined as the ratios of respective values of the proportionality limit stress (as indicated by the stress-strain curve labels in Figure 1) to the specified value of the ultimate proof stress (703 MPa), are obtained as: PL486 = 0.691, PL446 = 0.634, PL406 = 0.577, PL366 = 0.520. The ratio of applied internal pressure to the circumferential yield pressure is herein referred to as the “pressure factor”, f p , and various levels of internal pressurization are assigned numeric designations (0.0, 0.2, 0.4, 0.6, and 0.8) according to respective percentages (0%, 20%, 40%, 60%, and 80%) of the yield pressure. For combined axial compression + bending, the ratio of the applied stress to the limit stress of the pipe (obtained under uniform axial compression conditions) is herein referred to as the “compression factor”, f c , and various levels of axial compression are assigned numeric designations (0.2, 0.4, 0.6, and 0.8) according to respective percentages (20%, 40%, 60%, and 80%) of the limit stress.

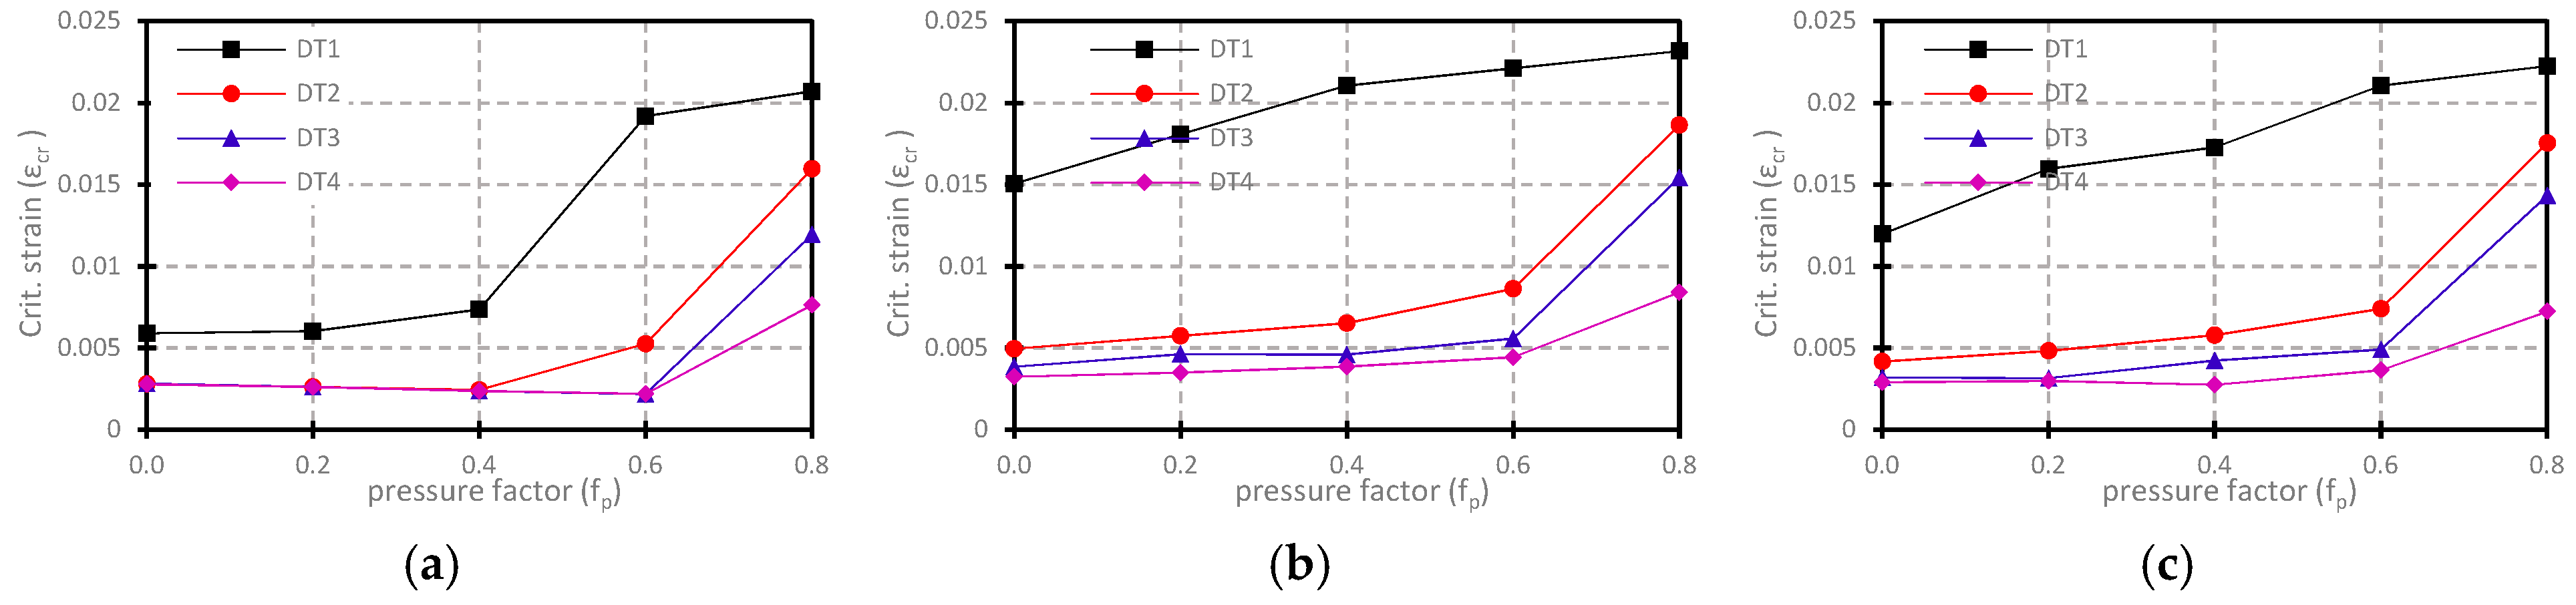
4.3.1. Influence of D/t Ratio

The plots in Figure 8 and Figure 9 illustrate the relationship between the CLS and the D/t ratio of YPT and RHT pipes, respectively. The plots in Figure 8 are obtained for YPT pipes with YPL = 1.50%, while the plots in Figure 9 are obtained for RHT pipes with PLUS ratio = 0.634. The plots for combined axial compression + bending in Figure 8c and Figure 9c are both obtained for pipes subjected to compression factor, f c = 0.6. The CLS trends are presented for all five levels of internal pressure considered.
The most obvious aspect of the plots above is the nonlinear negative correlation between the CLS and the D/t ratio. The plots indicate the tendency for the CLS to reduce as the D/t ratio increases, and even more evident is this phenomenon in YPT pipes, especially at high levels of internal pressure. It is also reasonable to deduce that the influence of internal pressure on the CLS vs. D/t ratio trends is minimal in RHT pipes compared to YPT pipes, as the change in the slope of the CLS vs. D/t ratio trends for RHT pipes is observed to be generally much lower than for YPT pipes. The relationship between the CLS of YPT pipes and the D/t ratio becomes nearly linear at internal pressure = 80%. For intermediate D/t ratios (DT2 and DT3) and high D/t ratios (DT4), RHT pipes are observed to have a higher deformational capacity than YPT pipes at internal pressure ≤ 60% YS. However, at high internal pressure ( f p = 0.8) and/or low D/t ratio (DT1), the deformational performance of YPT pipes tends to supersede that of RHT pipes. The CLS of pipes under uniform bending is generally observed to surpass the CLS under uniform axial compression, while the CLS under combined axial compression and bending is somewhat bounded by the uniform axial and uniform bending CLS values.

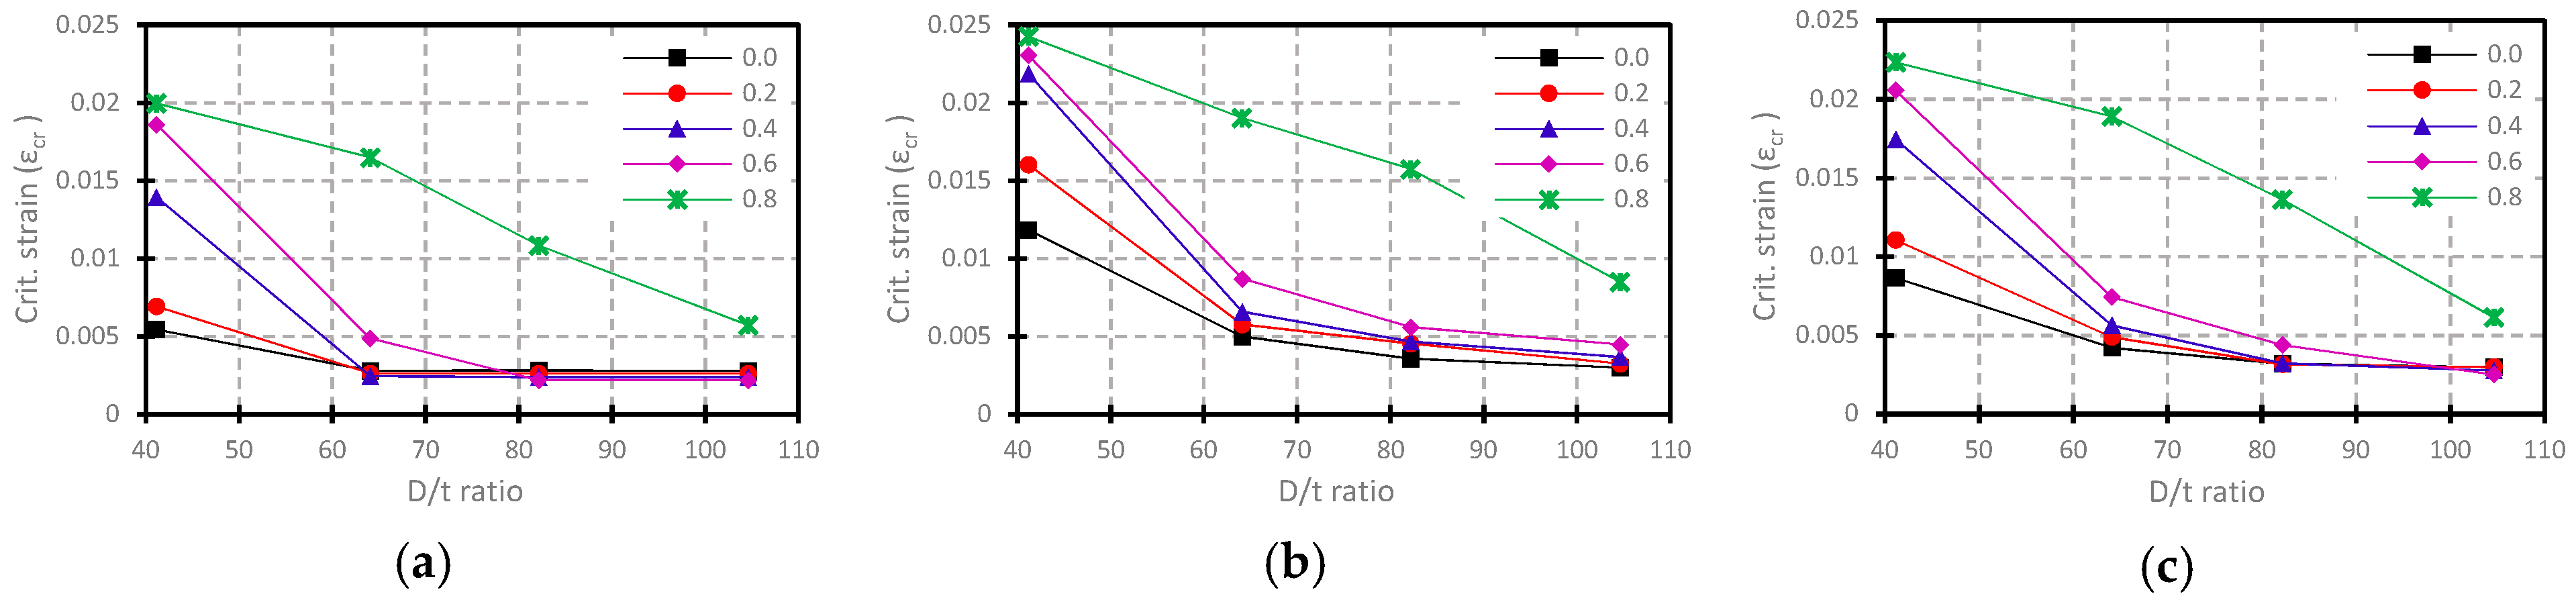
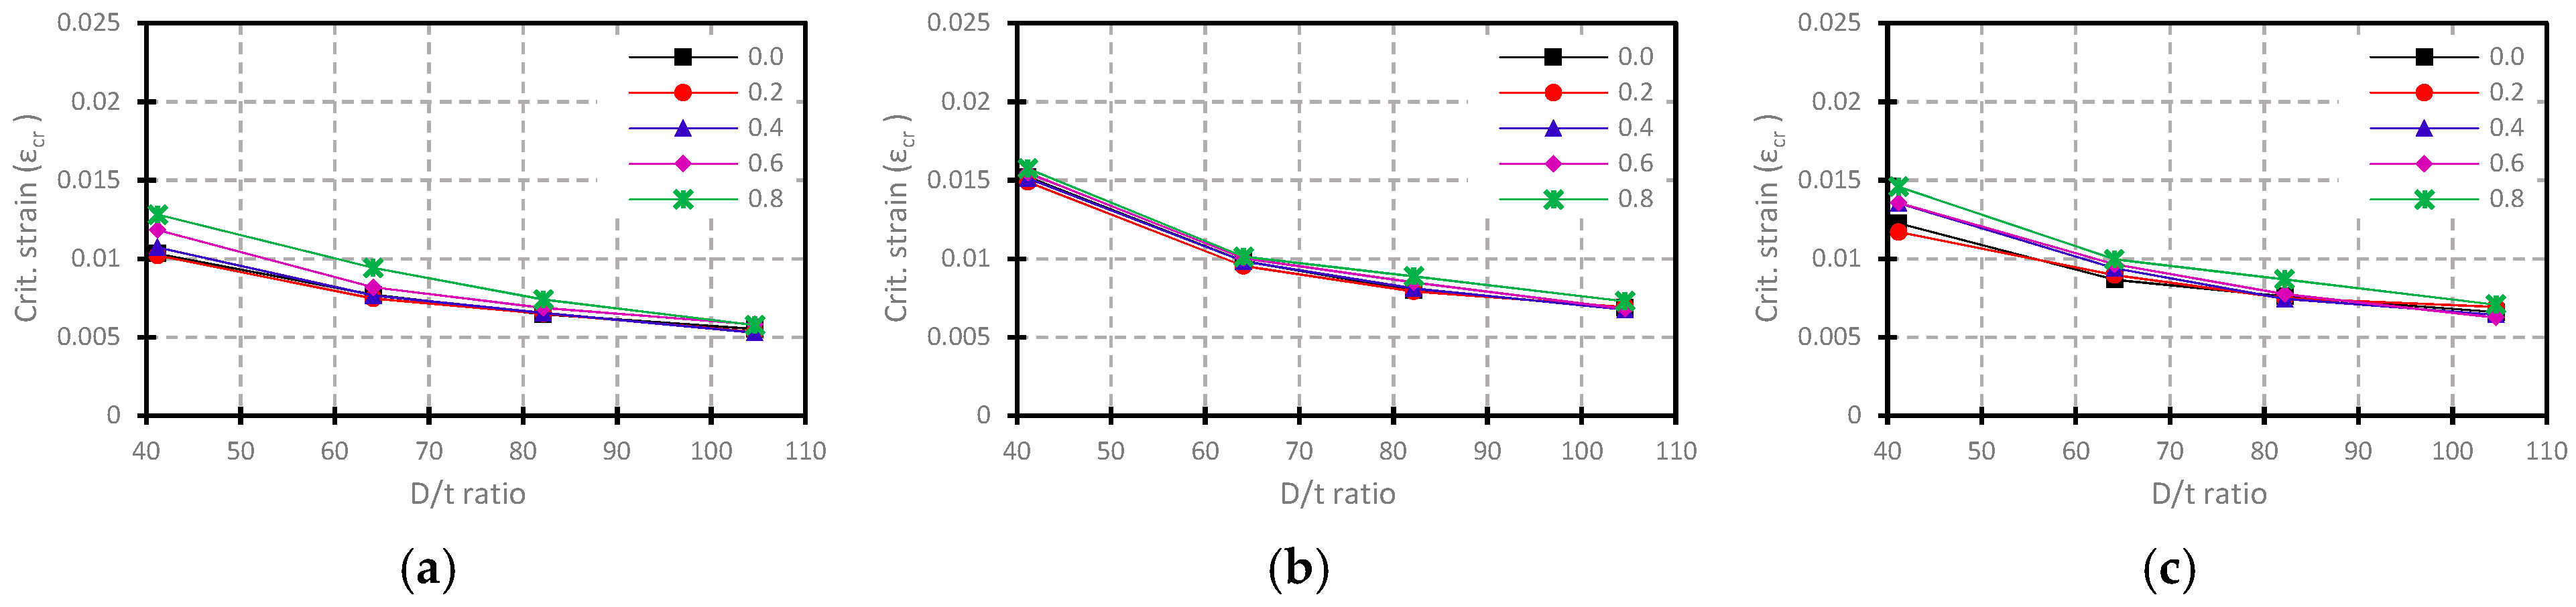
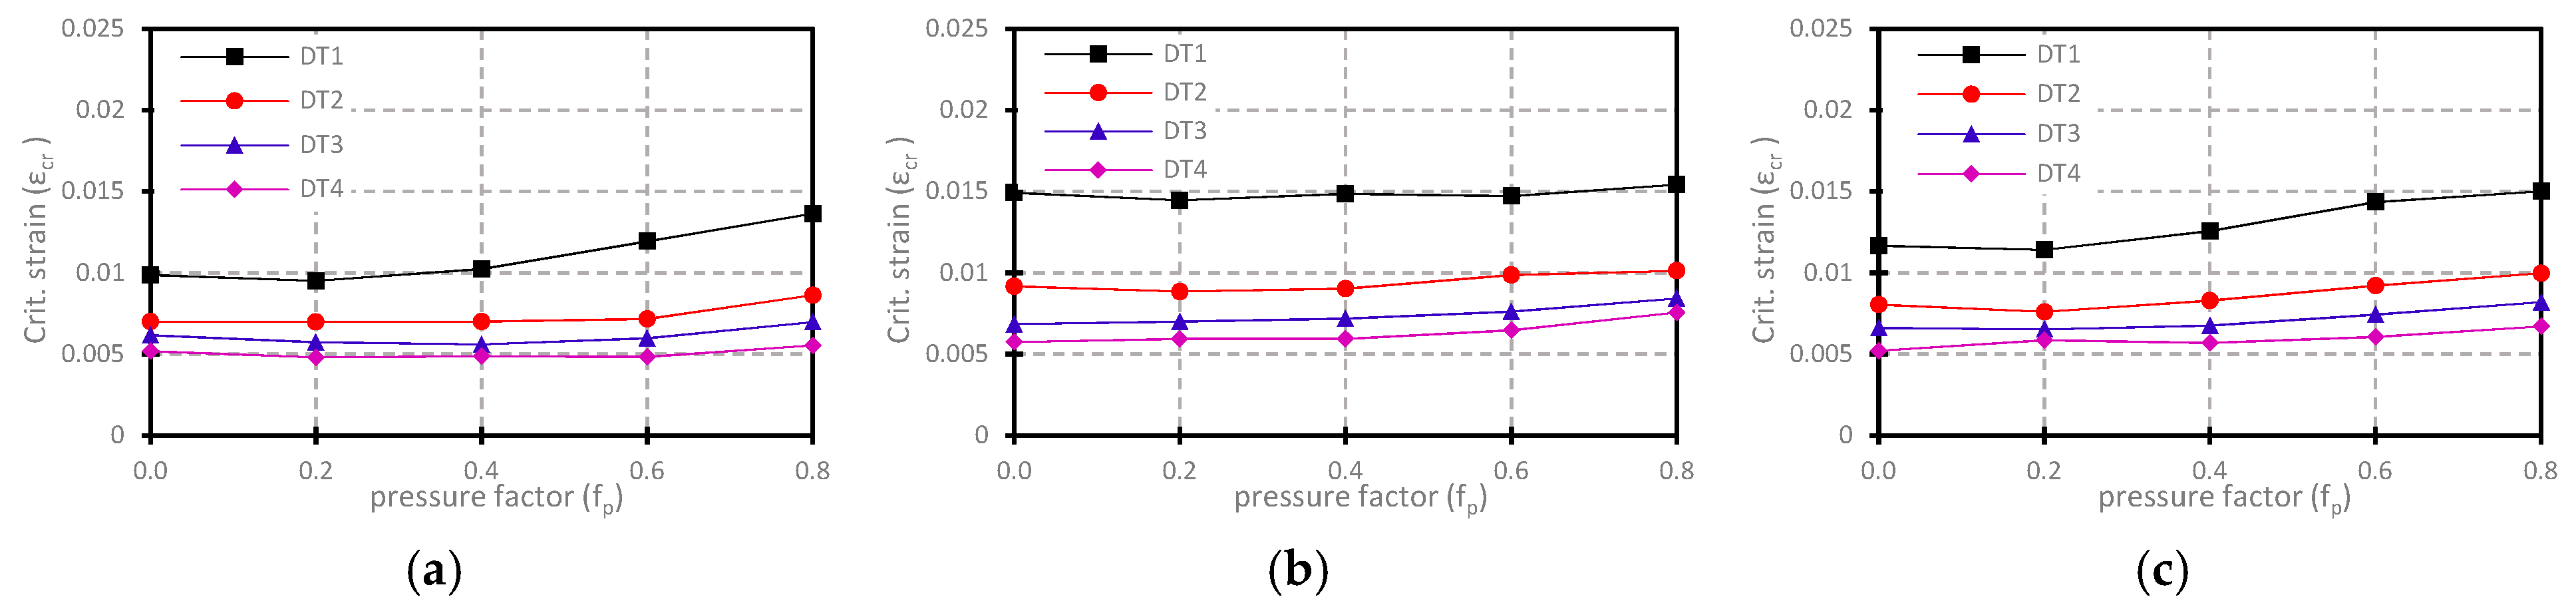
4.3.2. Influence of Internal Pressure

The relationship between the CLS and internal pressure for YPT and RHT pipes is illustrated by the plots of CLS vs. fp in Figure 10 and Figure 11, respectively. The plots in Figure 10 are obtained for YPT pipes, with YPL = 1.25%, while the plots in Figure 11 are obtained for RHT pipes, with PLUS ratio = 0.691. Similar to the plots in Figure 8 and Figure 9, the plots for combined axial compression + bending in Figure 10c and Figure 11c are both obtained for pipes subjected to compression factor, f c = 0.6. The CLS trends are presented for all four D/t ratios considered.
Unlike the relationship between the CLS and the D/t ratio, the correlation between the CLS and internal pressure is characteristically positive and is more evident in YPT pipes. In conformance with the deductions from the CLS vs. D/t ratio plots in Figure 9, variation of the internal pressure is observed to have a negligible influence on the CLS of RHT pipes for all D/t ratios. On the other hand, the influence of internal pressure on the CLS of YPT pipes is only minimal at intermediate D/t ratios (DT2 and DT3) and high D/t ratios (DT4) for internal pressures ≤ 60% YS. The most significant influence of internal pressure is observed in YPT pipes of low D/t ratios (DT1).

4.3.3. Influence of Strain-Hardening Properties

The strain-hardening properties relate to the YPL of the stress-strain curve for YPT pipes, and the PLUS ratio for RHT pipes. The influence of variations in D/t ratio on the relationship between the CLS and the strain-hardening properties is considered to be significant, and is therefore included in the CLS-trend illustrations in Figure 12, Figure 13, Figure 14 and Figure 15. The plots in Figure 12 and Figure 13 are both obtained for YPT pipes, with D/t ratio = 41.15 and 82.16, respectively, while the plots in Figure 14 and Figure 15 are both obtained for RHT pipes, with D/t ratio = 41.15 and 82.16, respectively. The plots for combined axial compression + bending in Figure 12c, Figure 13c, Figure 14c and Figure 15c are all obtained for pipes subjected to compression factor, f c = 0.2.
The plots above indicate that the influence of the strain hardening properties of the pipe material is more prevalent in pipes with low D/t ratios (DT1) for YPT pipes; as the D/t ratio of the pipe increases, the influence of the YPL on the CLS diminishes. For YPT pipes of low D/t ratio (DT1), a positive relationship is observed between the YPL and the CLS at a high internal pressure ( f p = 0.8). The YPL indicates a progressively negative correlation with the CLS as the internal pressure drops below 60% YS. On the other hand, a negative correlation between the PLUS ratio and the CLS is more apparent at higher D/t ratios and the influence tends to diminish as the D/t ratio decreases. As is the case for YPT pipes with low D/t ratio (DT1), a positive (but relatively less significant) relationship between the PLUS ratio and the CLS of RHT pipes with low D/t ratio (DT1) is also observed at high internal pressure ( f p = 0.8).

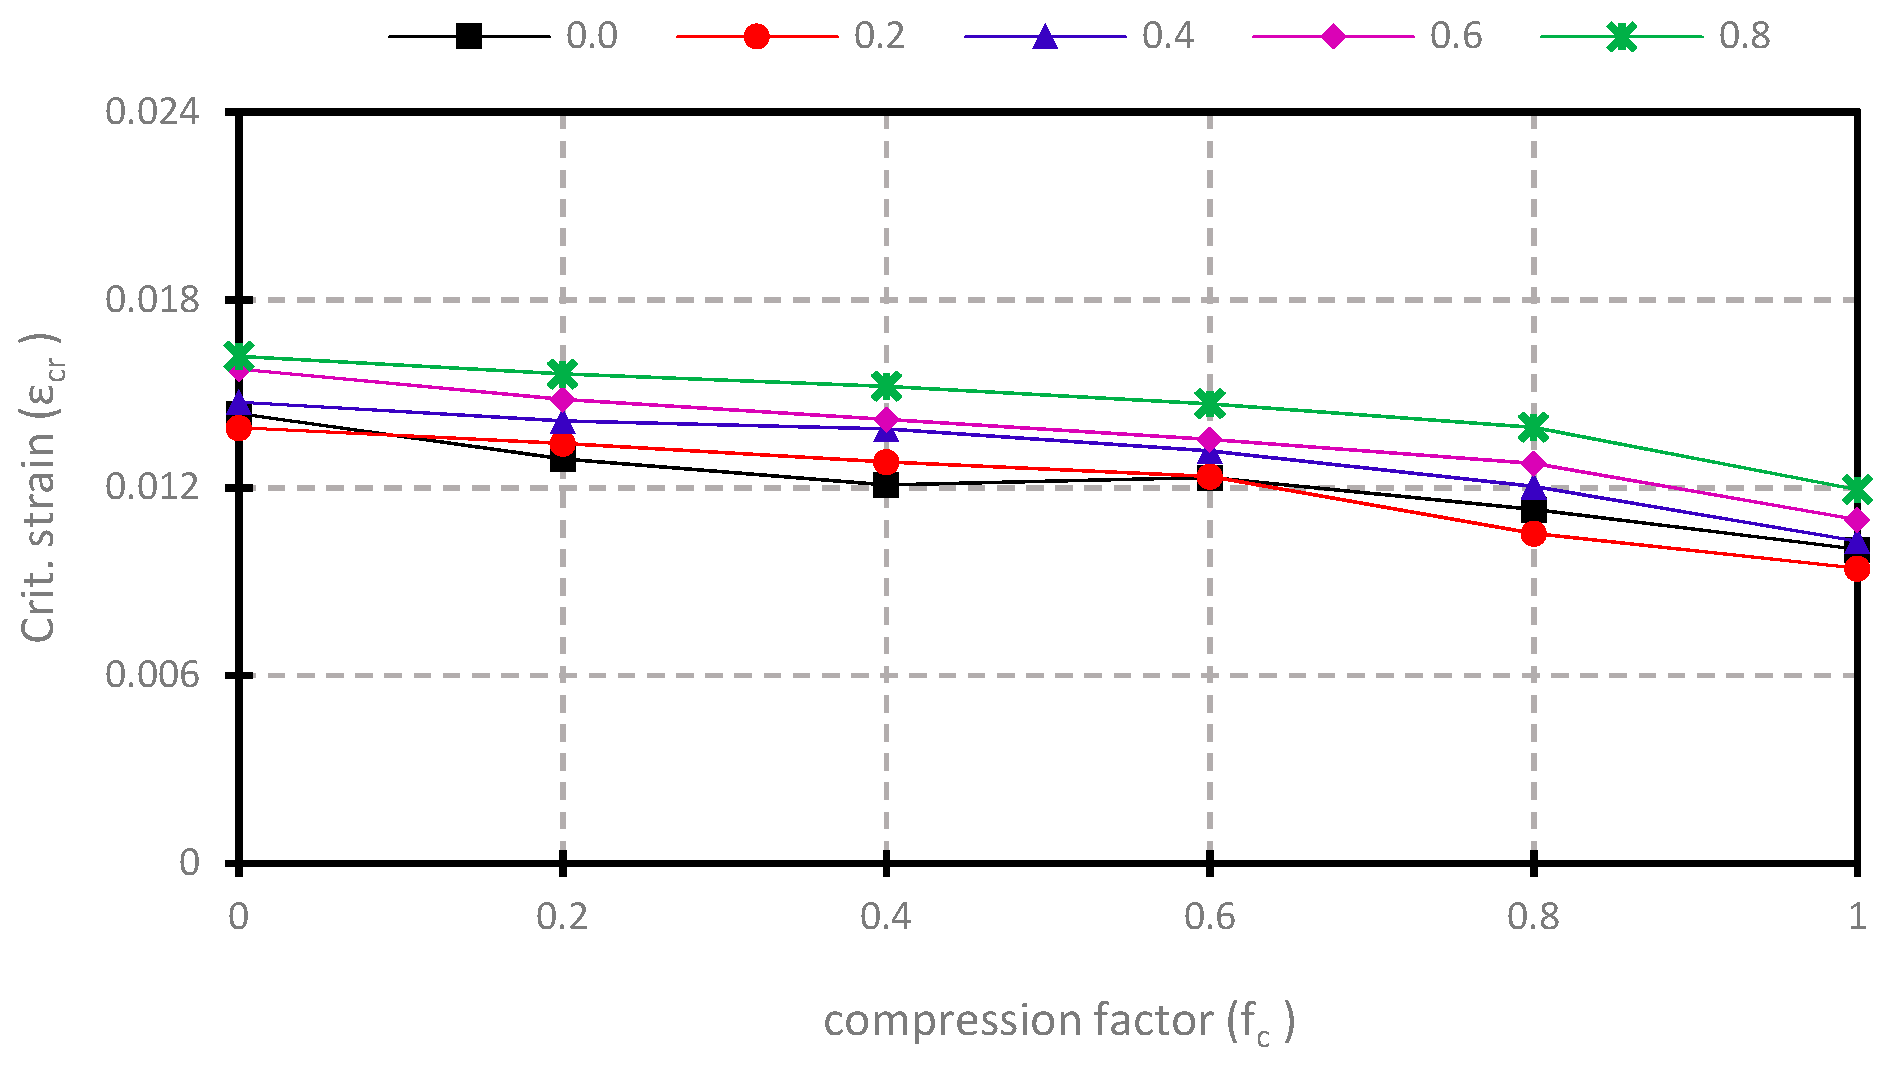
4.3.4. Influence of Compressive Net-Section Axial Force for Combined Loading

The effect of a compressive net-section axial force on the CLS of pipes subjected to monotonically-increasing curvature is depicted in Figure 16 and Figure 17. The relationship between the CLS and the compression factor, f c , is represented by the plots in Figure 16 for YPT pipes, with D/t ratio = 64.08 and YPL = 1.25%. Figure 17 comprises CLS vs. f c plots for RHT pipes, with D/t ratio = 41.15 and PLUS ratio = 0.577. Each plot corresponds to a respective level of internal pressure, as indicated by the elements of the graph legends.
An inverse relationship is observed between the compression factor and the CLS for both YPT and RHT pipes. Observation of various parametric combinations of the factors investigated in this study shows a strong and general indication that the upper and lower bounds of the CLS for pipes subjected to combined axial compression + bending is coincident with the CLS under uniform bending and the CLS under uniform axial compression, respectively. The observed upper and lower bound phenomenon is portrayed accordingly on the horizontal axes of the plots in Figure 16 and Figure 17. such that a f c = 0 represents uniform bending and f c = 1 represents uniform axial compression. It can therefore be inferred that for all combinations of investigated parameters, the CLS of both YPT and RHT pipes reduces progressively and somewhat nonlinearly from a state of uniform bending to a state of uniform axial compression as the compressive net-section axial force is increased from 0% to 100% of the limit axial stress.

5. Derivation of Semi-Empirical Models
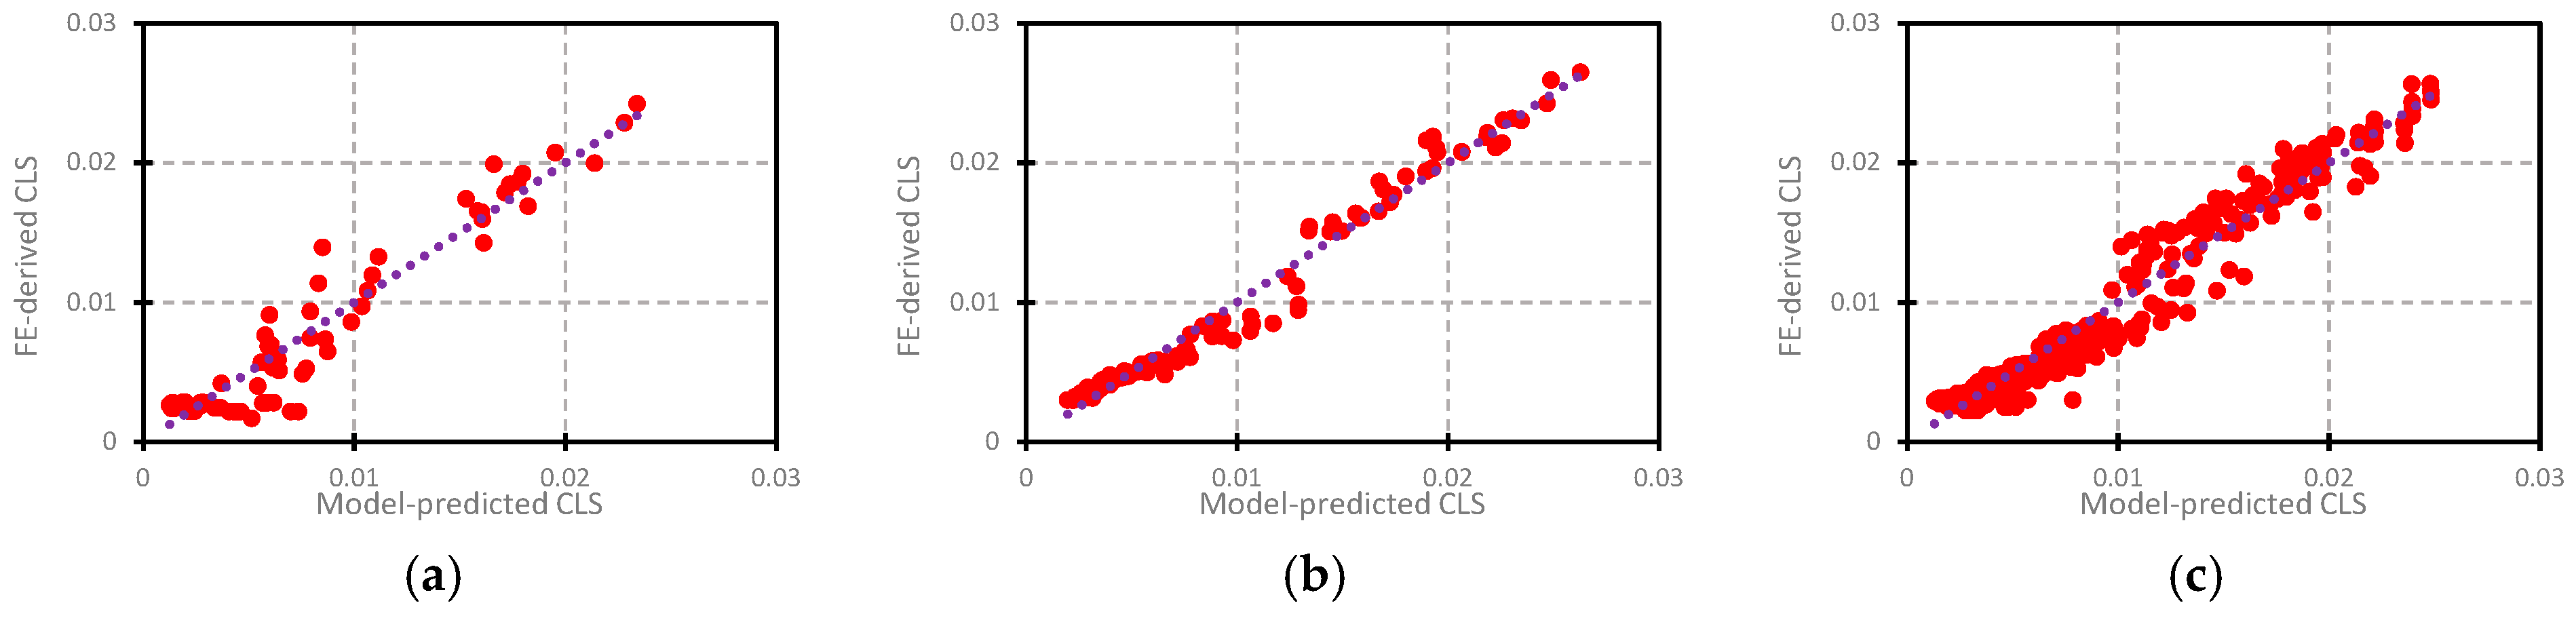
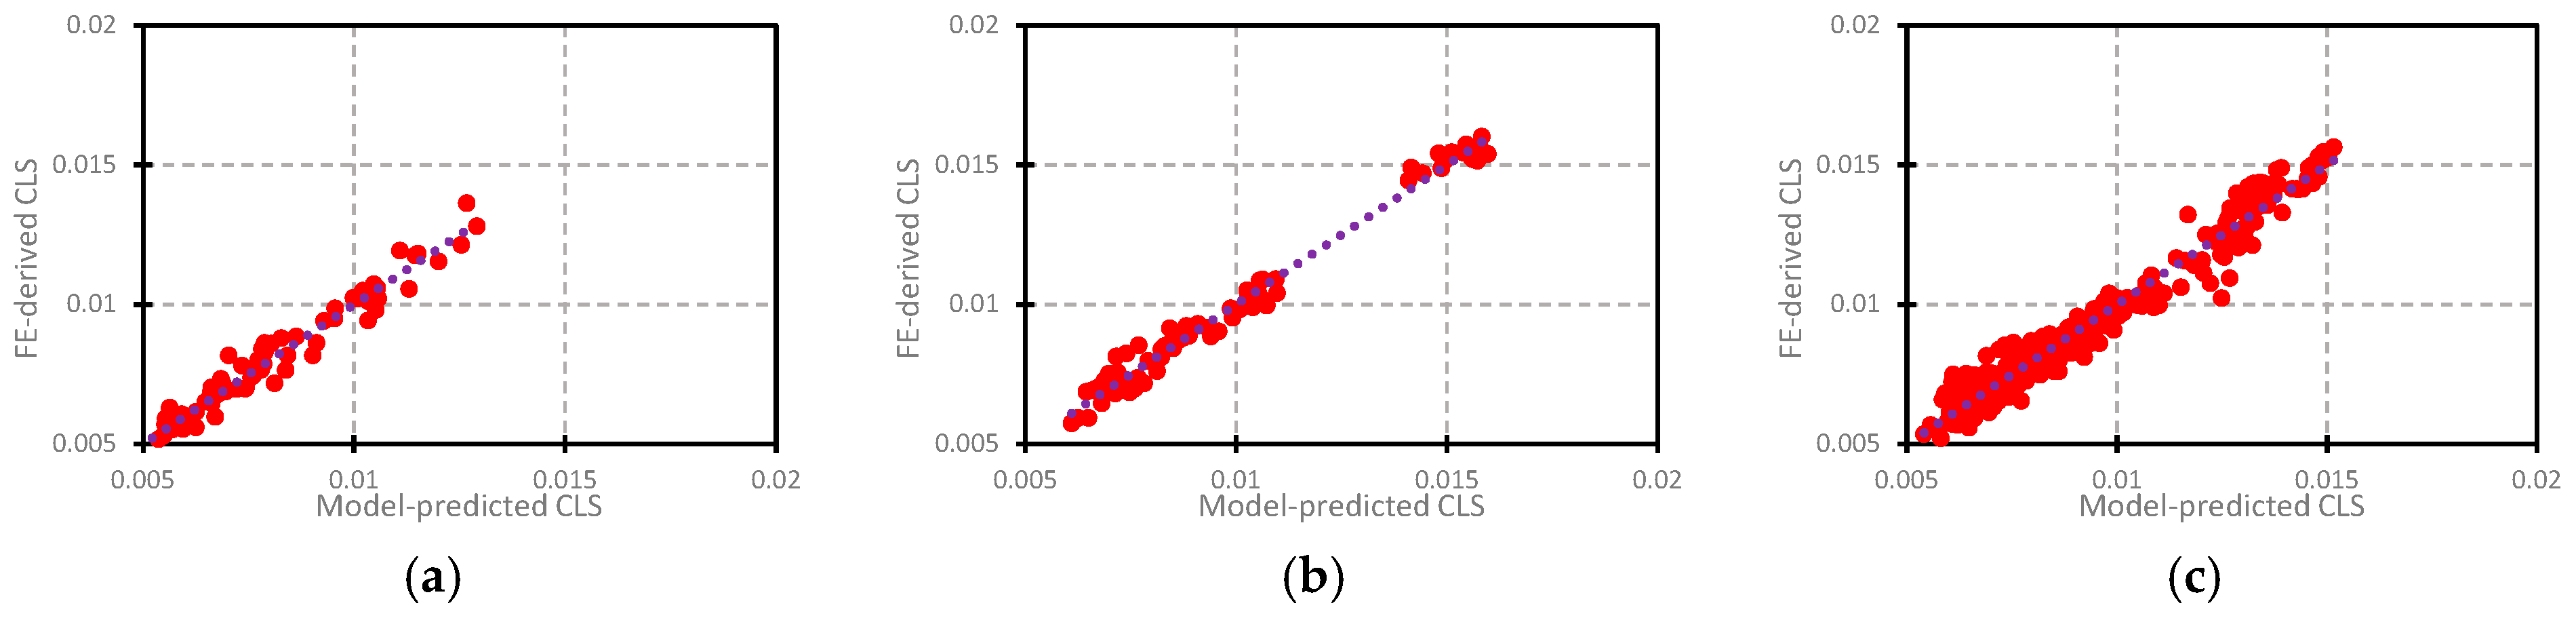
5.1. CLS Derivation

The CLS trends obtained with respect to the various considered parameters were examined to derive appropriate individual variable functions for each parameter, while taking any significant inter-relationships between the constitutive factors into consideration. Taking a cue for successful development of semi-empirical models for prediction of mechanical performance in pipelines from recent numerical studies [58,59,61], a multiplicative approach was employed for development of six nonlinear mathematical expressions, each formed as a product of the individual variable functions for the respective constitutive parameters. The basic form of the nonlinear expressions for the CLS of YPT and RHT pipes under the three loading conditions investigated is:
ε c r = f c r [ π 1 , π 2 , π 3 , π 4 , π 5 , π 6 ] = f 1 . f 2 . f 3 . f 4 . f 5 . f 6
where f 1 ,   f 2 ,   f 3 ,   f 4 ,   f 5 , and f 6 represent the D/t ratio function ( f d t ) , the pressure factor function ( f f p ) , the strain hardening function ( f s h ) , the heel factor function ( f h f ) , the knee-to-heel ratio function ( f k h ) , and the compression factor function ( f f c ) , respectively. Here, π 1 represents the D/t ratio ( D t ) , π 2 represents the pressure factor ( p p y ) , π 3 represents the yield plateau length ( Y P L ) for YPT pipes or the PLUS ratio ( σ p l σ u s ) for RHT pipes, π 4 represents the heel factor ( h f ) , π 5 represents the “knee-to-heel” ratio ( k f h f ) , and π 6 represents the compression factor ( f c ) .
For simplicity of presentation, the three loading conditions investigated are hereafter assigned the following alphanumeric designations: LC1 for uniform axial compression, LC2 for uniform bending, and LC3 for combined axial compression + bending.
An iterative process was thoroughly implemented for deriving the final form of the individual variable functions by targeting the highest possible value of the coefficient of multiple determination (R2). An R2 value greater than 0.95 was considered to be a satisfactory goodness-of-fit between the FEA-derived CLS values and the predictions of the derived nonlinear expressions.
The individual variable functions for YPT pipes are outlined thus:
f 1 = f d t = a 1 . ( π 1 ) b 1 f 2 = f f p = [ a 2 + ( b 2 + c 2 π 1 ) . E x p ( π 2 ) ( d 2 + e 2 π 4 ) a 2 π 4 + ( b 2 + c 2 π 1 ) . E x p ( π 2 ) ( d 2 + e 2 π 4 ) ] ( L C 1   &   L C 3 ) ( L C 2   o n l y ) f 3 = f s h = a 3 π 4 + ( b 3 π 2 + c 3 π 1 ) . ( π 3 ) d 3 ( L C 3   o n l y ) f 4 = f h f = [ a 4 + ( b 4 π 1 + c 4 π 2 ) . ( π 4 ) d 4 a 4 + ( b 4 π 1 ) . ( π 4 ) c 4 ] ( L C 1   &   L C 2 ) ( L C 3   o n l y ) f 5 = f k h = a 5 + ( b 5 π 3 ) . ( π 5 ) c 5 f 6 = f f c = a 6 + ( b 6 π 2 + c 6 π 1 ) . ( π 6 ) d 6 ( L C 3   o n l y )
The individual variable functions for RHT pipes are given by:
f 1 = f d t = a 1 . ( π 1 ) b 1 f 2 = f f p = ( a 2 + b 2 . π 2 ) . [ c 2 + ( d 2 + e 2 π 1 ) . E x p ( π 2 ) ( f 2 ) ] f 3 = f s h = a 3 + ( b 3 π 2 + c 3 ) . ( π 3 ) d 3 f 4 = f h f = a 4 + b 4 . ( π 4 ) c 4 f 5 = f k h = a 5 + b 5 . ( π 5 ) c 5 f 6 = f f c = a 6 + ( b 6 π 1 ) . ( π 6 ) c 6 ( L C 3   o n l y )
The nonlinear regression coefficients and coefficients of multiple determination (R2), obtained by advanced nonlinear regression analysis using the “NonlinearModelFit” command in the powerful computational package (Wolfram Mathematica [57]), are presented in Table 2.
The applicable ranges for the constitutive factors of the developed semi-empirical models are determined by the range of the parameters used in the FE analyses, given in Table 3 as follows.

5.2. Limit Stress Derivation

The nonlinear regression procedures employed for deriving the above semi-empirical equations for the CLS were extended to obtain two nonlinear expressions for the limit stress, for YPT pipes and RHT pipes. The values of the limit stress were obtained based on the values of the peak load on the axial load vs. axial deformation plots for pipes subjected to uniform axial compression. The following regression equations are required for determining the appropriate fractions of the limit stress that feed into the semi-empirical equations for evaluating the CLS of pipes subjected to combined axial compression + bending:
For YPT pipes,
σ l i m , Y P = 6.16262 ( 586 ) [ ( 8.49601 7.19159 . π 2 ) ( π 1 0.307568 ) ] [ ( 8.36548 ) + 8.36562 ( E x p ( π 2 ) 5.59778 10 6 ) ] [ ( 1.52236 . π 1 ) + 350.286 ( π 3 0.038848 ) ]
For RHT pipes,
σ l i m , R H = 5.45103 ( 586 ) [ ( 7.32071 6.48533 . π 2 ) ( π 1 0.107001 ) ] [ ( 8.45167 ) + 6.90582 ( E x p ( π 2 ) 0.843233 ) ] [ ( 5.23197 ) + 7.78213 ( π 4 0.451323 ) ] [ ( 5.67028 ) + 5.67057 ( π 5 2.72452 10 6 ) ]

6. Goodness-of-Fit

In addition to highlighting the coefficients of multiple determination, which indicate the level of correspondence between the predictions of the developed semi-empirical equations and the FEA results, the plots in Figure 18 and Figure 19 are presented to provide graphical illustrations of the accuracy of the developed models. The model-predicted CLS values were plotted against the FEA-derived CLS values in Figure 18 and Figure 19, respectively, for YPT pipes and RHT pipes subjected to (a) uniform axial compression, (b) uniform bending, and (c) combined axial compression + bending.

7. Discussion of Results

The results obtained for YPT and RHT pipes indicate that the CLS varies inversely with the D/t ratio for all combinations of parameters. For the CLS of RHT pipes, however, the effect of varying the D/t ratio is observed to be mild for all cases considered. The observed deformation behavior, with respect to the D/t ratio, may be attributed to the somewhat dichotomous phenomenon associated with the buckling response of cylindrical shell structures as the initiation of buckling transitions from the elastic region of the material stress-strain curve (elastic buckling) to the nonlinear region of the material stress-strain curve (inelastic or plastic buckling). RHT pipes exhibit continuous strain-hardening, and invariably a gradual reduction in the tangential modulus of the stress-strain curve beyond the proportionality limit point, and therefore do not experience significant changes in deformational capacity due to the delay of buckling initiation. The effect of D/t variation on the CLS of RHT pipes can therefore be deduced to be predominantly influenced by the increase in axial or bending rigidity of the pipe due to decrease in slenderness of the pipe wall, and vice versa. YPT pipes, on the other hand, feature a sudden zeroing of the slope of the stress-strain curve at the proportionality limit, and subsequent strain hardening that commences toward the end of a significantly-extended yield plateau. The existence of a distinct yield point in the stress-strain curve tends to cause an automatic trigger of buckling instability in YPT pipes once the initiation of buckling extends beyond the elastic region of the pipe material. However, there exists the possibility of recovery from initial softening of the load-deformation or moment-curvature response if intrinsic properties (e.g., D/t ratio) or loading conditions (e.g., internal pressure) provide additional stiffness that sufficiently counteracts the detrimental impact of the yield plateau on the deformational response of the pipe.
The deformational response of a pipe to uniform axial compression is characteristically different from the response to bending, even with the additional application of a compressive force. Under uniform axial compression, the entire cross-section of the pipe is susceptible to buckling, and the pipe relies on geometric, material, loading, and boundary conditions for sustenance against induced deformation. Under bending, however, the pipe gains additional stiffness due to the counteractive interaction between tensile and compressive stresses in the pipe’s cross-section. This can, therefore, be considered to be responsible for the more apparent effect of D/t variation on the CLS of YPT pipes subjected to uniform bending and combined bending, and axial compression at pressure levels between 0% and 60% YS. The deformational response of a YPT pipe subjected to all three loading conditions at a high level of internal pressure ( f p = 0.8) is analogous to the deformational response of RHT pipes, as an almost-linear relationship is observed between the CLS and the D/t ratio. This is attributable to the tendency that a pressure level of f p = 0.8 significantly increases the stability of the pipe’s response, such that catastrophic collapse leading to failure of the pipe inevitably takes advantage of the strain-hardening portion of the stress-strain curve at the end of the yield plateau. This also implies that the influence of D/t ratio variation on the CLS will be predominantly impelled by the stiffness of the pipe response associated with pipe wall slenderness factors.
The results presented for the influence of internal pressure on the CLS further substantiate the assertion that increase of the internal pressure in a pipe results in a corresponding increase in the stability of the pipe’s response to loading. Internal pressure hinders the localization of wrinkling and bulging deformation, and also increases the tendency for buckling to be initiated further along the stress-strain curve. The results indicate a negligible influence of internal pressure variation on the CLS of RHT pipes at all levels of pressure. On the other hand, the CLS of YPT pipes tends to be unaffected by changes in internal pressure between 0% and 60% YS, whereas at higher pressure ( f p = 0.8), there is a spike in the CLS depending on the D/t ratio.
For YPT pipes, varying the length of the yield plateau is observed to have a higher effect on the CLS as the D/t ratio of the pipe decreases. For YPT pipes with D/t ratio = 41.15, the CLS is likely to be negatively affected by an increase in YPL at levels of internal pressure between 0% and 60% YS, whereas the YPL positively correlates with the CLS at a high level of internal pressure ( f p = 0.8). Unlike YPT pipes, varying the PLUS ratio tends to have a less significant influence on the CLS of RHT pipes as the D/t ratio decreases. At DT1, however, the influence of the PLUS ratio on the CLS of RHT pipes is observed to be negligible, except at a level of pressure equal to 80% YS. It can be inferred from the results for YPT pipes that improvement of the CLS for pipes with lower D/t ratio or high internal pressure is not necessarily automatic, as the length of the yield plateau exhibits a secondary, but significant, influence on the deformational capacity. Figure 12b,c further illustrate that subjection of a pipe to bending considerably enhances the stiffness response of the pipe, even at zero-to-low levels of internal pressure. Enhanced stiffness is, therefore, accompanied by an increased tendency for buckling to be initiated in the nonlinear region of the material stress-strain curve. The higher stiffness of a pipe under bending, compared to a pipe under uniform axial compression, leads to a relatively greater positive effect of a longer YPL on the CLS of a pipe under bending, especially at internal pressures as high as 80% YS. However, additional benefits of a longer yield plateau tend to diminish once the YPL exceeds 1.75%. For levels of internal pressure between 0% and 60% YS, increasing the length of the yield plateau results in a reduced ability of the pipe to recover from initial softening of the mechanical response before reaching the actual peak stress or moment. A decrease in the PLUS ratio for RHT pipes implies a lower proportionality limit point, and invariably, ‘superior’ strain hardening and vice versa. At higher D/t ratios, initiation of buckling tends to occur before the yield point of the material is reached, implying that materials with a lower proportionality limit earlier experience a softer inelastic response, which translates to higher deformability. As the D/t ratios become lower, initiation of buckling shifts towards the yield point of the material, where the stress-strain curves of materials with different PLUS ratios are likely to converge, hence the effect of PLUS ratio variation becomes negligible. However, beyond the yield point, the stress-strain curve of higher-PLUS ratio materials exhibits a softer post-YS response; hence, if the initiation of buckling is delayed beyond the yield point of the material (as is likely the case when internal pressure is as high as 80% YS), a higher PLUS ratio (i.e., inferior strain hardening) may have a positive effect on the deformational capacity of an RHT pipe, and vice versa.

8. Conclusions

The relationships between the CLS of pipelines and the relevant influencing parameters was studied herein, and a comparison was made between three different loading conditions; uniform axial compression, uniform bending, and combined axial compression and bending. The distinction in the nonlinear strain-hardening of YPT and RHT pipes has been observed in previous studies [62,63,64,65,66] to significantly impact on the deformational capacity of pipes, but marginally affect the limit stress and limit moment. An extensive parametric study was, therefore, conducted to derive the functional relationships between nondimensionalized parameters representing the relevant factors and the deformational performance of pipes made of API X80 grade line pipe steel, while separately considering the material behavior under YPT and RHT classifications.
The shape constants of a new material model were used to fully describe the shape of the nonlinear portion of the stress-strain curve of the material, and were included as dimensionless parameters in developing semi-empirical models for predicting the CLS. Individual variable functions were developed to mathematically represent the trends of the CLS with respect to the parameters that constitute the semi-empirical models. Advanced nonlinear multiple regression was performed using Wolfram Mathematica to obtain the nonlinear regression coefficients for each of the derived semi-empirical equations, and effort was made to achieve the highest possible R2 value for each nonlinear expression by accounting for the complex interrelationships between the different parameters. The nonlinear regression analysis yielded high R2 values (>0.95), indicating an excellent goodness-of-fit between the model prediction and the FEA-derived results of the CLS.
The semi-empirical models developed in this paper are considered as handy tools for evaluating the deformational capacity of both unpressurized and pressurized API X80 line pipes. The results clearly demonstrate that the CLS values for combined axial compression + bending typically exist in a spectrum between the CLS for uniform bending and the CLS for uniform axial compression. It is, however, the prerogative of the designer to determine the level of axial compression to consider, especially in the case of displacement-controlled loading conditions, where the axial stress is not readily derivable. For cases such as this, it may be necessary to conservatively adopt the models for uniform axial compression as a lower bound measure of the CLS.

Author Contributions

This research paper is a product of assiduous collaboration between the authors: conceptualization, O.N. and S.A.; methodology, O.N. and S.A.; validation, O.N., J.J.R.C., and S.A.; formal analysis, O.N.; investigation, O.N.; resources, M.M., J.J.R.C., and S.A.; writing—original draft preparation, O.N.; writing—review and editing, O.N. and S.A.; supervision, S.A.; project administration, M.M.; funding acquisition, M.M. and S.A.

Funding

This research and the APC for publication were funded by TransCanada Pipelines Ltd.

Acknowledgments

The authors wish to express their appreciation to TransCanada Pipelines Ltd. for providing the financial support and technical input necessary for conducting this research study.

Conflicts of Interest

The authors declare no conflict of interest.

References

  1. Taylor, L.C. Fault displacement and ground deformation associated with surface faulting. Proceedings of the Technical Council on Lifeline Earthquake Engineering Specialty Conference 338–353.
  2. Ariman, T.; Muleski, G.E. A review of the response of buried pipelines under seismic excitations. Earthq. Eng. Struct. Dyn. 1981, 9, 133–152. [Google Scholar] [CrossRef]
  3. Selvadurai, A.P.S. Mechanics of buried pipelines induced by random ground movement. In Proceedings of the CSCE Annual Conference (Engineering Mechanics Symposium), Vancouver, BC, Canada, 29–31 May 1991; pp. 142–151. [Google Scholar]
  4. Yun, H.; Kyriakides, S. On the beam and shell modes of buckling of buried pipelines. Soil Dyn. Earthq. Eng. 1990, 9, 179–193. [Google Scholar] [CrossRef]
  5. Dama, E.; Karamanos, S.A.; Gresnigt, A.M. Failure of Locally Buckled Pipelines. J. Press. Vessel Technol. 2007, 129, 272. [Google Scholar] [CrossRef]
  6. Trifonov, O.V.; Cherniy, V.P. Elastoplastic stress–strain analysis of buried steel pipelines subjected to fault displacements with account for service loads. Soil Dyn. Earthq. Eng. 2012, 33, 54–62. [Google Scholar] [CrossRef]
  7. American Lifelines Alliance. Guidelines for the Design of Buried Steel Pipe (with Addenda through February 2005); American Society of Civil Engineers: Reston, VA, USA, 2005. [Google Scholar]
  8. Vazouras, P.; Karamanos, S.A.; Dakoulas, P. Finite element analysis of buried steel pipelines under strike-slip fault displacements. Soil Dyn. Earthq. Eng. 2010, 30, 1361–1376. [Google Scholar] [CrossRef]
  9. Vazouras, P.; Karamanos, S.A.; Dakoulas, P. Mechanical behavior of buried steel pipes crossing active strike-slip faults. Soil Dyn. Earthq. Eng. 2012, 41, 164–180. [Google Scholar] [CrossRef]
  10. Vazouras, P.; Dakoulas, P.; Karamanos, S.A. Pipe–soil interaction and pipeline performance under strike–slip fault movements. Soil Dyn. Earthq. Eng. 2015, 72, 48–65. [Google Scholar] [CrossRef]
  11. Kan, W.C.; Weir, M.; Zhang, M.M.; Lillig, D.B.; Barbas, S.T.; Macia, M.L.; Biery, N.E. Strain-Based Pipelines: Design Consideration Overview. In Proceedings of the Eighteenth International Offshore and Polar Engineering Conference, Vancouver, BC, USA, 6–11 July 2008; International Society of Offshore and Polar Engineers: Vancouver, BC, USA, 2008. [Google Scholar]
  12. API 1111 Design, Construction, Operation, and Maintenance of Offshore Hydrocarbon Pipelines; American Petroleum Institute (API): Washington, DC, USA, 1999.
  13. Det Norske Veritas. Submarine Pipeline Systems—DNV-OS-F101; DNV: Oslo, Norway, 2010. [Google Scholar]
  14. American Bureau of Shipping. Guide for Building and Classing Subsea Pipeline Systems; ABS: Houston, TX, UAS, 2006. [Google Scholar]
  15. Canadian Standards Association Oil and Gas Pipeline Systems; CSA-Z662-2007; CSA Group: Mississauga, ON, Canada, 2007.
  16. Macia, M.L.; Kibey, S.A.; Arslan, H.; Bardi, F.; Ford, S.J.; Kan, W.C.; Cook, M.F.; Newbury, B. Approaches to Qualify Strain-Based Design Pipelines. In Proceedings of the 2010 8th International Pipeline Conference, Calgary, AB, Canada, 27 September–1 October 2010; Volume 4, pp. 365–374. [Google Scholar]
  17. Liu, B.; Liu, X.J.; Zhang, H. Strain-based design criteria of pipelines. J. Loss Prev. Process Ind. 2009, 22, 884–888. [Google Scholar] [CrossRef]
  18. Wang, Y.-Y.; Liu, M.; Horsley, D.; Salama, M.; Sen, M. Overall Framework of Strain-Based Design and Assessment of Pipelines. In Proceedings of the 10th International Pipeline Conference, Calgary, AB, Canada, 29 September–3 October 2014; p. V004T11A023. [Google Scholar]
  19. Kenny, S.; Barrett, J.; Phillips, R.; Popescu, R. Integrating Geohazard Demand And Structural Capacity Modelling Within a Probabilistic Design Framework For Offshore Arctic Pipelines. In Proceedings of the The Seventeenth International Offshore and Polar Engineering Conference, Lisbon, Portugal, 1–6 July 2007; International Society of Offshore and Polar Engineers: Lisbon, Portugal, 2007. [Google Scholar]
  20. Nessim, M.; Zhou, W.; Zhou, J.; Rothwell, B. Reliability Based Design and Assessment for Location-Specific Failure Threats With Application to Natural Gas Pipelines. J. Press. Vessel Technol. 2009, 131, 041701. [Google Scholar] [CrossRef]
  21. Lorenz, R. Achsensymmetrische Verzerrungen in dünnwandigen Hohlzylindern. Zeitschrift des Vereines Deutscher Ingenieure 1908, 52, 1706–1713. [Google Scholar]
  22. Timoshenko, S.P. Einige stabilitäts probleme der elastizitäts theorie. Z. Math. Phys. 1910, 58, 337–385. [Google Scholar]
  23. Southwell, R.V. On the General Theory of Elastic Stability. Philos. Trans. R. Soc. A Math. Phys. Eng. Sci. 1914, 213, 187–244. [Google Scholar] [CrossRef] [Green Version]
  24. Robertson, A. The Strength of Tubular Struts; Report No.: 23-9003-1-29; British Aeronautical Research Committee: Bedford, UK, 1929.
  25. Wilson, W.M.; Newmark, N.M. The strength of thin cylindrical shells as columns. In Proceedings of the Civil Engineering Classics, The Engineering Experiment Station, University of Illinois, Urbana, IL, USA, 28 February 1933; pp. 1–42. [Google Scholar]
  26. Lundquist, E.E. Strength Tests of Thin-Walled Duralumin Cylinders in Compression; NACA Technical Note, No 473; National Advisory Committee for Aeronautics: Washington, DC, USA, 1934.
  27. Von Kármán, T.; Tsien, H.S. The Buckling of Thin Cylindrical Shells under Axial Compression. In Collected Works of Hsue-Shen Tsien (1938–1956); Elsevier: Oxford, UK, 2012; Volume 8, pp. 165–181. ISBN 9780123982773. [Google Scholar]
  28. Koiter, W.T. The Stability of Elastic Equilibrium. Ph.D. Thesis, Cornell University, New York, NY, USA, 1945. [Google Scholar]
  29. Brazier, L.G. On the Flexure of Thin Cylindrical Shells and Other “Thin” Sections. Proc. R. Soc. A Math. Phys. Eng. Sci. 1927, 116, 104–114. [Google Scholar] [CrossRef]
  30. Jirsa, J.O.; Lee, F.H.; Wilhoit, J.C.; Merwin, J.E. Ovaling Of Pipelines Under Pure Bending. In Proceedings of the Offshore Technology Conference, Houston, TX, USA, 1–3 May 1972. [Google Scholar]
  31. Sherman, D.R. Test of Circular Steel Tubes in Bending. J. Struct. Div. 1976, 102, 2181–2195. [Google Scholar]
  32. Tugcu, P.; Schroeder, J. Plastic deformation and stability of pipes exposed to external couples. Int. J. Solids Struct. 1979, 15, 643–658. [Google Scholar] [CrossRef]
  33. Reddy, B.D. An experimental study of the plastic buckling of circular cylinders in pure bending. Int. J. Solids Struct. 1979, 15, 669–683. [Google Scholar] [CrossRef]
  34. Corona, E.; Kyriakides, S. On the collapse of inelastic tubes under combined bending and pressure. Int. J. Solids Struct. 1988, 24, 505–535. [Google Scholar] [CrossRef]
  35. Mathon, C.; Limam, A. Experimental collapse of thin cylindrical shells submitted to internal pressure and pure bending. Thin-Walled Struct. 2006, 44, 39–50. [Google Scholar] [CrossRef]
  36. Lundquist, E.E. Strength Tests of Thin-Walled Duralumin Cylinders in Pure Bending; NACA Technical Note, No 479; National Advisory Committee for Aeronautics: Langley Field, VA, USA, 1933.
  37. Donnell, L.H. A new theory for the buckling of thin cylinders under axial compression and bending. Trans. ASME 1934, 56, 795–806. [Google Scholar]
  38. Suer, H.S.; Harris, L.A.; Skene, W.T.; Benjamin, R.J. The Bending Stability of Thin-Walled Unstiffened Circular Cylinders Including the Effects of Internal Pressure. J. Aerosp. Sci. 1958, 25, 281–287. [Google Scholar] [CrossRef]
  39. Houliara, S.; Karamanos, S.A. Buckling and post-buckling of long pressurized elastic thin-walled tubes under in-plane bending. Int. J. Non. Linear. Mech. 2006, 41, 491–511. [Google Scholar] [CrossRef]
  40. Limam, A.; Lee, L.-H.; Corona, E.; Kyriakides, S. Inelastic wrinkling and collapse of tubes under combined bending and internal pressure. Int. J. Mech. Sci. 2010, 52, 637–647. [Google Scholar] [CrossRef]
  41. American Petroleum Institute. API 5L: Specification for Line Pipe, 44th ed.; American Petroleum Institute: Washington, DC, USA, 2007. [Google Scholar]
  42. Bai, Q.; Bai, Y. Use of High-Strength Pipeline Steels. In Subsea Pipeline Design, Analysis, and Installation; Gulf Professional Publishing: Oxford, UK, 2014; pp. 675–694. [Google Scholar]
  43. Suzuki, N.; Toyoda, M. Critical Compressive Strain of Linepipes Related to Workhardening Parameters. In Proceedings of the 21st International Conference on Offshore Mechanics and Arctic Engineering, Oslo, Norway, 23–28 June 2002; Volume 3, pp. 217–224. [Google Scholar]
  44. Suzuki, N.; Muraoka, R.; Glover, A.; Zhou, J.; Toyoda, M. Local Buckling Behavior of X100 Linepipes. In Proceedings of the ASME 2003 22nd International Conference on Offshore Mechanics and Arctic Engineering, Cancun, Mexico, 8–13 June 2003; pp. 67–76. [Google Scholar]
  45. Kang, K.-B.; Yoo, J.-Y.; Ahn, S.-S.; Cho, W.Y.; Yoon, T.-Y. Buckling Behavior of API-X80 Linepipe. In Proceedings of the Seventeenth International Offshore and Polar Engineering Conference, Lisbon, Portugal, 1–6 July 2007; International Society of Offshore and Polar Engineers: Lisbon, Portugal, 2007; pp. 3254–3260. [Google Scholar]
  46. Ishikawa, N.; Okatsu, M.; Endo, S.; Shikanai, N.; Muraoka, R.; Kondo, J. Mechanical And Metallurgical Properties of Grade X80 High Strain Linepipe Produced By Heat Treatment On-line Process. In Proceedings of the Eighteenth International Offshore and Polar Engineering Conference, Vancouver, BC, Canada, 6–11 July 2008; International Society of Offshore and Polar Engineers: Vancouver, BC, Canada, 2008; pp. 13–20. [Google Scholar]
  47. Yoo, J.-Y.; Ahn, S.-S.; Seo, D.-H.; Song, W.-H.; Kang, K.-B. New Development of High Grade X80 to X120 Pipeline Steels. Mater. Manuf. Process. 2011, 26, 154–160. [Google Scholar] [CrossRef]
  48. Kong, L.Z.; Zhou, X.Y.; Chen, L.Q.; Shuai, J.; Huang, K.; Yu, G.J. True Stress–Strain Curves Test and Material Property Analysis of API X65 and API X90 Gas Pipeline Steels. J. Pipeline Syst. Eng. Pract. 2018, 9, 04017030. [Google Scholar] [CrossRef]
  49. Porter, D.; Laukkanen, A.; Nevasmaa, P.; Rahka, K.; Wallin, K. Performance of TMCP steel with respect to mechanical properties after cold forming and post-forming heat treatment. Int. J. Press. Vessel. Pip. 2004, 81, 867–877. [Google Scholar] [CrossRef]
  50. Mouriño, N.S.; Petrov, R.; Bae, J.-H.; Kim, K.; Kestens, L.A.I. Texture Dependent Mechanical Anisotropy of X80 Pipeline Steel. Adv. Eng. Mater. 2010, 12, 973–980. [Google Scholar] [CrossRef]
  51. Hines, J.R.; Timms, C.M.; DeGeer, D.D. Thermal Ageing Effects on Thickwalled Line Pipe. In Proceedings of the ASME 2007 26th International Conference on Offshore Mechanics and Arctic Engineering, San Diego, CA, USA, 10–15 June 2007; pp. 573–579. [Google Scholar]
  52. Ndubuaku, O.; Martens, M.; Cheng, R.; Ahmed, A.; Adeeb, S. A Novel Approach for True Stress-True Strain Material Characterization of Metallic Materials Using the Product-Log (Omega) Function. In Proceedings of the 6th International Conference on Engineering Mechanics and Materials, Vancouver, BC, Canada, 31 May–3 June 2017. [Google Scholar]
  53. Ndubuaku, O.; Martens, M.; Cheng, J.J.R.; Adeeb, S. Expression of a Generic Full-Range True Stress-True Strain Model for Pipeline Steels Using the Product-Log (Omega) Function. In Proceedings of the ASME 2017 Pressure Vessels and Piping Conference, Waikoloa, HI, USA, 16–20 July 2017; p. V06BT06A050. [Google Scholar]
  54. Ndubuaku, O.; Liu, X.; Martens, M.; Roger Cheng, J.J.; Adeeb, S. The effect of material stress-strain characteristics on the ultimate stress and critical buckling strain of flat plates subjected to uniform axial compression. Constr. Build. Mater. 2018, 182, 346–359. [Google Scholar] [CrossRef]
  55. Ndubuaku, O. A New Material Characterization Approach for Evaluating the Deformational Capacity of Onshore Pipelines. Ph.D. Thesis, University of Alberta, Edmonton, AB, Canada, 2019. [Google Scholar]
  56. Hibbitt, D.; Karlsson, B.; Sorensen, P. ABAQUS Standard User’s and Reference Manuals, version 6.14; Dassault Systèmes: Providence, RI, USA, 2014. [Google Scholar]
  57. Wolfram Research Inc. Mathematica, version 11.3; Wolfram Research Inc.: Champaign, IL, USA, 2018. [Google Scholar]
  58. Liu, M.; Wang, Y.-Y.; Zhang, F.; Kotian, K. Realistic Strain Capacity Models for Pipeline Construction and Maintenance; Prepared for US Department of Transportation; Contract No. DTPH56-10-T-000016; Pipeline and Hazardous Materials Safety Administration, Office of Pipeline Safety: Dublin, OH, USA, 2013.
  59. Dorey, A.B.; Murray, D.W.; Cheng, J.J.R. Critical Buckling Strain Equations for Energy Pipelines—A Parametric Study. J. Offshore Mech. Arct. Eng. 2006, 128, 248. [Google Scholar] [CrossRef]
  60. Mohareb, M.E.; Elwi, A.E.; Kulak, G.L.; Murray, D.W. Deformation Behavior of Line Pipe; Structural Engineering Report No. 202; University of Alberta: Edmonton, AB, Canada, 1994. [Google Scholar]
  61. Liu, X.; Zhang, H.; Han, Y.; Xia, M.; Zheng, W. A semi-empirical model for peak strain prediction of buried X80 steel pipelines under compression and bending at strike-slip fault crossings. J. Nat. Gas Sci. Eng. 2016, 32, 465–475. [Google Scholar] [CrossRef]
  62. Dorey, A.B.; Murray, D.W.; Cheng, J.J.R. Material Property Effects on Critical Buckling Strains in Energy Pipelines. In Proceedings of the 2002 4th International Pipeline Conference, Calgary, AB, Canada, 30 Septembe–3 October 2002; pp. 475–484. [Google Scholar]
  63. Gresnigt, A.M.; Karamanos, S.A. Local Buckling Strength And Deformation Capacity of Pipes. In Proceedings of the Nineteenth International Offshore and Polar Engineering Conference, Osaka, Japan, 21–26 July 2009; International Society of Offshore and Polar Engineers: Osaka, Japan, 2009; pp. 212–224. [Google Scholar]
  64. Neupane, S.; Adeeb, S.; Cheng, R.; Ferguson, J.; Martens, M. Modeling the Deformation Response of High Strength Steel Pipelines—Part I: Material Characterization to Model the Plastic Anisotropy. J. Appl. Mech. 2012, 79, 051002. [Google Scholar] [CrossRef]
  65. Neupane, S.; Adeeb, S.; Cheng, R.; Ferguson, J.; Martens, M. Modeling the Deformation Response of High Strength Steel Pipelines—Part II: Effects of Material Characterization on the Deformation Response of Pipes. J. Appl. Mech. 2012, 79, 051003. [Google Scholar] [CrossRef]
  66. Adeeb, S.; Zhou, J.; Horsley, D. Investigating the Effect of UOE Forming Process on the Buckling of Line Pipes Using Finite Element Modeling. In Proceedings of the 2006 International Pipeline Conference, Calgary, AB, Canada, 25–29 September 2006; Volume 2006, pp. 169–174. [Google Scholar]
Figure 1. Idealized variations for stress-strain curves of (a) X80-YPT, and (b) X80-RHT materials.
Applsci 09 00322 g001
Figure 2. Meshed area for average strain measurement.
Applsci 09 00322 g002
Figure 3. Comparison of FEA result with experimental result (UGA508) by Ref. [60].
Applsci 09 00322 g003
Figure 4. Axial load-displacement response and stress evolution in YPT DT4 pipes under uniform axial compression (YPL = 1.0%, fp = 0.4).
Applsci 09 00322 g004
Figure 5. Axial load-displacement response and stress evolution in RHT DT4 pipes under uniform axial compression (PL/US = 0.691, fp = 0.4).
Applsci 09 00322 g005aApplsci 09 00322 g005b
Figure 6. Moment-curvature response and stress evolution in YPT DT4 pipes under uniform bending (YPL = 1.0%, fp = 0.4).
Applsci 09 00322 g006
Figure 7. Moment-curvature response and stress evolution in RHT DT4 pipes under uniform bending (PL/US = 0.691, fp = 0.4).
Applsci 09 00322 g007
Figure 8. Plots of CLS vs. D/t ratio of YPT pipes with YPL = 1.50% for (a) uniform axial compression, (b) uniform bending, and (c) combined loading (fc = 0.6).
Applsci 09 00322 g008
Figure 9. Plots of CLS vs. D/t ratio of RHT pipes with PL/US = 0.634 for (a) uniform axial compression, (b) uniform bending, and (c) combined loading (fc = 0.6).
Applsci 09 00322 g009
Figure 10. Plots of CLS vs. fp of YPT pipes with YPL = 1.25% for (a) uniform axial compression, (b) uniform bending, and (c) combined loading (fc = 0.6).
Applsci 09 00322 g010
Figure 11. Plots of CLS vs. fp of RHT pipes with PL/US = 0.691 for (a) uniform axial compression, (b) uniform bending, and (c) combined loading (fc = 0.6).
Applsci 09 00322 g011
Figure 12. Plots of CLS vs. YPL of YPT DT1 pipes for (a) uniform axial compression, (b) uniform bending, and (c) combined loading (fc = 0.2).
Applsci 09 00322 g012
Figure 13. Plots of CLS vs. YPL of YPT DT3 pipes for (a) uniform axial compression, (b) uniform bending, and (c) combined loading (fc = 0.2).
Applsci 09 00322 g013
Figure 14. Plots of CLS vs. PLUS ratio of RHT DT1 pipes for (a) uniform axial compression, (b) uniform bending, and (c) combined loading (fc = 0.2).
Applsci 09 00322 g014
Figure 15. Plots of CLS vs. PLUS ratio of RHT DT3 pipes for (a) uniform axial compression, (b) uniform bending, and (c) combined loading (fc = 0.2).
Applsci 09 00322 g015
Figure 16. Plots of CLS vs. fc for YPT DT2 pipes with YPL = 1.25%.
Applsci 09 00322 g016
Figure 17. Plots of CLS vs. fc for RHT DT1 pipes with PL/US = 0.577.
Applsci 09 00322 g017
Figure 18. Model prediction vs. FEA results for YPT pipes for (a) LC1, (b) LC2, and (c) LC3.
Applsci 09 00322 g018
Figure 19. Model prediction vs. FEA results for RHT pipes for (a) LC1, (b) LC2, and (c) LC3.
Applsci 09 00322 g019
Table 1. Model shape constants for the derivation of stress-strain curves.
YPTRHT
Curve LabelKf = 1/KNMHf = 1/HNMCurve LabelKf = 1/KNMHf = 1/HNM
YP-1.0083.73950.5187PL-48611.54483.9814
YP-1.25115.20480.4221PL-44621.10992.7531
YP-1.50162.98590.3510PL-40635.33912.1374
YP-1.75240.24430.2953PL-36669.24451.5847
YP-2.00374.31780.2501
Table 2. Nonlinear regression coefficients.
REG. COEFF.YPTRHT
LC1LC2LC3LC1LC2LC3
a10.075820.0031710.73021.5861.2310.1829
b1−2.192−2.386−4.256−0.5804−1.112−0.6736
a20.0601418.57−386.22.9190.48720.947
b20.005009−0.000358−7.1110.7857−0.1282−0.2245
c2−0.000036238.397 × 10−60.02827−218.1−48.49170.2
d28.18611.667.735−34.63−16.936.393
e20.68973.537−2.3540.1272−0.2596−0.02223
f2---3.5651.3352.82
a3--72.59−1.5130.5007797.783
b3--182.2−1.2346.915 × 10−514.71
c3--1.1163.225−0.5010861.263
d3--3.6320.24510.00028464.778
a486.4415.09−30.34−2.608−1.2723.37183
b40.59660.004361−1.7881.3922.396−3.37182
c4−136.51.0191.665−0.15132.458−1.127 × 10⁻⁶
d40.07415−3.204----
a540.73271.92.464 × 10−5−1.40902−0.2618−5.336
b5−0.0003071−1.1891.2161.409050.49944.04
c51.2740.6593−1.6154.185 × 10−60.9315−0.1044
a6--30.23--−18.19
b6--−200.4--0.03894
c6--3.893--2.456
d6--−0.199---
R20.9620340.9907460.9830410.9972710.9986190.997224
Table 3. Applicable range for dimensionless parameters.
Par.YPTRHT
π14110541105
π20.00.80.00.8
π3120.5200.691
π40.2500.5191.583.98
π516114972.943.7
π6>0.0<1.0>0.0<1.0

