Featured Application
This work applies to the production of large, complex, metallic preform structures in the aerospace and tool and die industries. In the aerospace industry, this technology has a potential role in the rapid production of custom, near-net shape preforms for machined Ti-6Al-4V components. Specifically, site-specific control enables localized control of bead geometry, which has enhanced defect mitigation capabilities and may enable local control of material properties.
Abstract
A variety of techniques have been utilized in metal additive manufacturing (AM) for melt pool size management, including modeling and feed-forward approaches. In a few cases, closed-loop control has been demonstrated. In this research, closed-loop melt pool size control for large-scale, laser wire-based directed energy deposition is demonstrated with a novel modification, i.e., site-specific changes to the controller setpoint were commanded at trigger points, the locations of which were generated by the projection of a secondary geometry onto the primary three-dimensional (3D) printed component geometry. The present work shows that, through this technique, it is possible to print a specific geometry that occurs beyond the actual toolpath of the print head. This is denoted as extra-toolpath geometry and is fundamentally different from other methods of generating component features in metal AM. A proof-of-principle experiment is presented in which a complex oak leaf geometry was embossed on an otherwise ordinary double-bead wall made from Ti-6Al-4V. The process is introduced and characterized primarily from a controls perspective with reports on the performance of the control system, the melt pool size response, and the resulting geometry. The implications of this capability, which extend beyond localized control of bead geometry to the potential mitigations of defects and functional grading of component properties, are discussed.
1. Introduction
Monitoring and control of metal additive manufacturing (AM) processes is the subject of intense research interest, from powder bed fusion to wire- or powder-based directed energy deposition (DED). In particular, for large-scale wire-based DED, real-time sensing and control are part of the array of techniques being employed to address the primary technical challenge, which is simultaneous management of geometry, material properties, and residual stress and distortion [1]. In terms of thermal control, closed-loop melt pool size control via power modulation has proven to be an important capability; this mode of control has been demonstrated by Hu et al. in laser cladding, Hu et al. and Hofmeister et al. in laser powder based DED, Zalameda et al. in electron beam freeform fabrication, and the present authors in laser wire-based DED [2,3,4,5,6]. This mode of control effectually enables control of local bead geometry and management of interlayer energy density as heat accumulates in the component during construction [2]. The degree to which thermal gradients and heating and cooling rates are modified by this mode of control, and the subsequent impacts on solidification dynamics, microstructure, and material properties, is the subject of continuing investigation, largely on a machine- and material-specific basis.
The literature indicates that, in the research demonstrated to date, the common goal of efforts to control the melt pool size in DED has been to maintain a consistent melt pool size with a constant controller setpoint. This type of control has the effect of maintaining nominal bead geometry both on an intralayer basis and throughout the printing of components, yielding global geometry control. However, the concept of site-specific modifications to deposition parameters, which are driven by additional information attached to the toolpath, is of great interest to AM researchers; after all, one of the unique benefits of AM is that it affords manufacturing flexibility in the form of shape, hierarchical, material, and functional complexity [7]. Site-specific parameter modifications can enable local bead geometry control, vary the magnitude of energy input, and induce changes to thermal gradients and rates of solidification for functionally grading the material properties of components [8]. This capability was demonstrated in electron beam melting, a powder-bed AM process, with site-specific control of crystallographic grain orientation in a nickel-based superalloy, Inconel 718, which was achieved through open-loop changes to scan strategy [9].
For large-scale DED, pre-programmed, open-loop changes to primary process parameters, such as laser power, print speed, and deposition rate, are also possible, however, the mode of operation proposed here is to command site-specific modifications (e.g., melt pool size) at desired setpoints under closed-loop control. In this way, a system would be capable of automatically achieving consistent property modifications in the presence of the ever-changing thermal conditions of the component under construction. Demonstrating this technology served as the motivation for this research. In this work, a proof-of-principle experiment was completed in which a laser hot-wire DED process was used to print Ti-6Al-4V components with closed-loop control of melt pool size through laser power modulation, and site-specific changes were commanded to the melt pool size at locations determined by a secondary, extra-toolpath (”extra” denoting specific, printed geometry that occurs beyond the toolpath) geometry. The performance of the control system, melt pool size response, and resulting geometry are presented. Because this research was conducted through a public-private partnership, some details are considered protected intellectual property (IP), and therefore have not been included in the article.
2. Materials and Methods
Titanium components printed for this study were deposited in a custom, large-scale laser hot-wire DED workcell. The workcell contained a 6-axis industrial robot, wirefeeder, hot-wire system, and was supplied by two fiber-delivered diode lasers, the power from which was combined into a single fiber for 20 kW of total laser power. In addition to the laser optics, the print head contained in-axis process and thermal cameras, as well as a laser line scanner. The in-axis cameras received emissions from the melt pool that were transmitted through a dichroic mirror in the laser optics. The process camera was primarily used to monitor process stability and identify process interruptions, such as an improper wire input location or unstable wire feed behavior. The thermal camera was used to image the melt pool and generate a thermal field, which was processed to generate a melt pool definition in real time. The generated definition of melt pool size was low noise, which is desirable from a control perspective, and consistently tracked with the thermal properties of the build, behavior that has been realized through an extensive research and development effort. Additional detail regarding the thermal camera, including calibration and several other melt pool measurement considerations, are available in prior work [10]. Example false-color images from the thermal camera are shown in Figure 1, along with the corresponding thresholded images that contain only that which is defined as the melt pool.
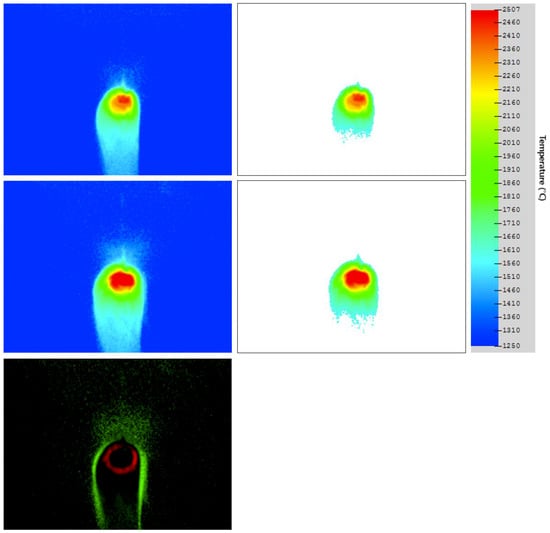
Figure 1.
Thermal camera images of the melt pool: As-collected nominal size (top left), thresholded nominal size (top right), as-collected increased size (middle left), thresholded increased size (middle right), and as-collected comparison (bottom left).
The melt pool size signal was provided to a closed-loop controller that manipulated laser power in real time to control melt pool size. The controller was of a typical linear, feedback control architecture. While the specific control law and gain values utilized are considered protected IP, it is noteworthy that the controller was tuned for setpoint tracking performance. The controller architecture is diagramed in Figure 2. The desired melt pool size setpoint was provided to the controller in pixels. While this parameter would typically be maintained at a constant value throughout the printing of a component, in this research it was changed at specified trigger points, the locations of which were determined by a secondary geometry.
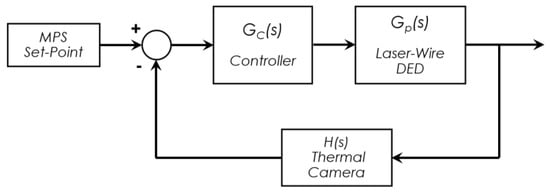
Figure 2.
Closed-loop controller architecture.
In addition to laser power being continuously modulated, other process variables were also subjected to manipulation through additional process control algorithms. The laser line scanner on the print head was used to measure layer height, relative to the nominal ideal layer height, on an interlayer basis. Deviations then drove parameter modifications on subsequent layers to correct errors, a process described in [11]. Given that the process variables were modulated over a range of values, Table 1 displays only the nominal deposition values used for the test geometry.

Table 1.
Primary process parameters.
The feedstock used was Ti-6Al-4V wire in 1.6 mm diameter. The build plate material was also Ti-6Al-4V, with a 6.35 mm (0.25 inch) thickness. Deposition rate was a function of wire feed rate, wire diameter, and feedstock density (4.43 g/cm3 for Ti-6Al-4V). The delivered amount of laser power was determined through a calibration process that used a power measurement device. Depositions were completed in an argon environment maintained by a tent-like enclosure that surrounded the build plate and was purged prior to printing. A steady flow of Argon throughout the printing process maintained oxygen levels below 300 ppm.
The concept of trigger points generated by a secondary geometry is diagramed in Figure 3. The primary geometry is the traditional geometry that would be input to a slicer, i.e., it is the three-dimensional (3D) object to be printed. The object is sliced into layers that are oriented with the X-Y plane, which are then filled with pathing. The secondary geometry, for the purposes of this proof-of-principle experiment, was a two-dimensional (2D) geometry oriented with the Y-Z plane. This is not the only representation or orientation that is possible, however. Other formats may make sense for accomplishing different objectives. The intersections between the layer and the secondary geometry then drive the generation of trigger points, which are distances from a common edge such as the leading edge of the primary geometry, which for the test geometry in this study was the starting point for the pathing for each layer. The trigger points must be stored in some format that can be attached to the toolpath and used by the printer. For this study, the trigger points were used by the printer’s control system to command step changes in melt pool size, and therefore two trigger points form a complete step (up some prescribed magnitude and back down to nominal size).
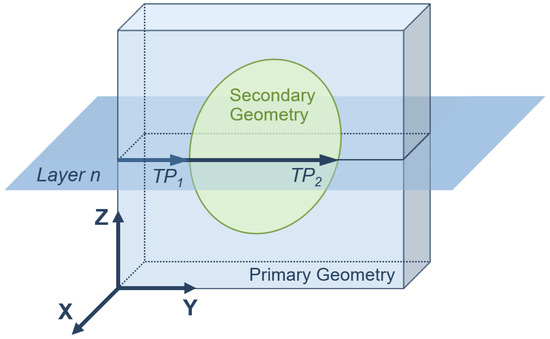
Figure 3.
Concept of generating trigger points using a secondary geometry.
The primary geometry selected for this study was a double-bead wall, 175 mm in length and 150 mm in height (94 layers with a 1.6 mm layer height). The ORNL Slicer (Manufacturing Demonstration Facility, Knoxville, TN, USA), which was developed specifically for large-scale AM, was utilized. Figure 4 shows the primary geometry in the slicer environment after slicing. Note that the geometry is a simple double-bead wall with two paths per layer, known as skeletons, and no additional geometric detail. Beads were deposited with the front-feed wire orientation, with the exception of a bead termination routine that took place at the end of each bead, in which the print head reversed to deposit additional material for a prescribed distance that could evolve on a per layer basis. This routine served as an additional measure to maintain proper layer height. The reversal distance and the nominal deposition rate evolved in the termination routine according to the parameters in Table 2. In addition to helping maintain layer height, the use of the termination routine could also manifest as slight wall width increases that were evident in the wall geometry scans.
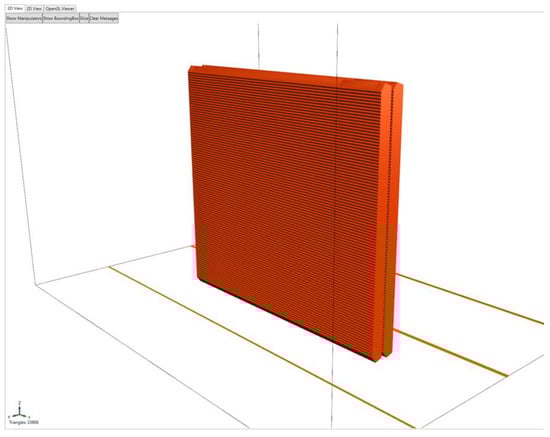
Figure 4.
Double-bead wall in ORNL Slicer environment.
Table 2.
Bead termination routine parameters.
The secondary geometry selected for this study was an oak leaf. The oak leaf is a complex geometry that afforded the opportunity to study the melt pool size response over a large variety of step durations, a function of step distance and print speed. The oak leaf design, segmented with layers, contained 139 total steps, 116 of which were of unique distances, ranging from 0.7 mm to 77.5 mm. It was anticipated that short step distances would be bandwidth limited, i.e., the rate of change of melt pool size is limited by the physics of the melt pool, even under active closed-loop control, and would provide an interesting behavioral study. Figure 5 shows the conceptual workflow for the generation of the oak leaf trigger points. The workflow starts with a 2D sketch of the geometry, which must be appropriately scaled and then segmented into layers using the known layer height. The intersection points of the secondary geometry and the layer lines become the trigger points at which the melt pool size setpoint would change. For the purposes of this study, trigger points were limited to a maximum of six per layer, yielding a maximum of three complete step changes in melt pool size per layer. This required some filtering of fine details from the oak leaf geometry, particularly at the leaf tips, but maintained the overall design and sufficient complexity. The trigger points are color coded in Figure 5 to show the progression and number of triggers on a per layer basis.
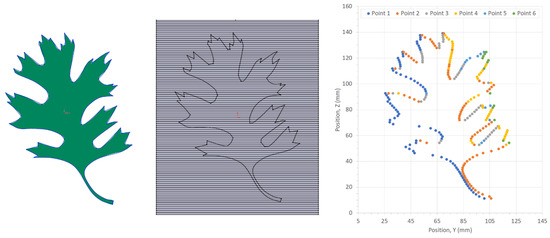
Figure 5.
Generalized workflow for oak leaf trigger point generation. From Left to right: Original sketch, layered geometry, final trigger points.
Two walls were printed for this study. The first wall contained step changes in only the second of two beads per layer, and the step changes commanded the melt pool size 25% higher than nominal. The second wall contained step changes in both beads, and the melt pool size was commanded 37.5% higher than nominal. This experimental setup allowed for a comparison of melt pool size and laser power response across beads and across magnitudes of step changes. This is summarized in Table 3. The nominal melt pool size was determined through testing in which deposits were made with nominal parameters while only monitoring with the thermal camera. The measured melt pool size then subsequently became the setpoint for control. The increased melt pool size was selected to produce a large increase in size while still maintaining process stability based on significant experience with the deposition parameters.
Table 3.
Test wall melt pool size parameters.
The stability concern arises from the fact that if laser power increases too much, the wire feedstock can begin to transfer in droplet form, at which point it is difficult, if not impossible, to measure the melt pool size. Additionally, a command for a larger melt pool size results in an increase in laser power, which, without a corresponding increase in wire feed rate, results in a wider and shorter bead profile. In theory, if this behavior happened repeatedly on a layer-by-layer basis, a height deficit could propagate and result in a major defect. The previously discussed layer height control algorithm counteracts this effect through interlayer scanning and modification of the parameters of the following layer. While the melt pool size controller and the layer height controller operate concurrently, the systems have no a priori knowledge of the other’s actions, meaning that interesting interactions between the systems are certainly possible. Characterizing these interactions was not within the scope of this work, but a measurement of the final wall geometry served as an indicator of the degree to which the layer height control system accomplished its task.
The response of the melt pool size control system was characterized by examining the melt pool size and laser power behavior at the selected locations. The scaled melt pool size data was overlaid with robot position feedback data to generate a visualization of melt pool size for an entire half of a wall. The melt pool response time was specifically examined in the region of the oak leaf stem in Wall 2, which contained the higher magnitude step changes. The stem contained a range of steps that were relatively short in duration, an ideal scenario for evaluating the minimum duration for which the melt pool setpoint could actually be achieved, i.e., the process resolution. A further examination of melt pool bandwidth was not within the scope of this work, but additional information has been presented in the literature on the melt pool response for this specific laser-wire DED process [12].
Final part geometry was characterized via scanning with a FaroArm scanner (FARO, Lake Mary, FL, USA), which generated virtual, 3D representations of the printed components. This allowed for a comparison of the printed geometry against an ideal representation of a flat wall with no embossed, secondary geometry. The magnitude of oak leaf embossing could be determined and compared across test cases.
3. Results
During wall printing, laser power was modulated as expected and the desired melt pool size was achieved at the setpoints. Qualitative evidence of this is available in Figure 1, which shows thermal camera images of the melt pool from bead one of layer 35 in Wall 2. The images of high and low melt pool size setpoints are shown in the as-collected conditions and threshold conditions. Additionally, a comparison of the as-collected images is shown via a subtraction of RGB (red-green-blue) values in which the melt pool size difference between the high and low cases manifests as a bright green region against a field of black.
The melt pool size data from an entire half of a wall was overlaid with the corresponding toolpath, i.e., feedback position data from the print head, to provide a high-level confirmation that the desired site-specific changes in melt pool size were achieved. Bead one of Wall 2 was selected for this visualization, and the result is shown in Figure 6. The melt pool size was scaled such that magnitude increases would nicely show the secondary geometry. This was accomplished by subtracting the nominal melt pool size (2450 pixels) and scaling by a factor of 10−3 the scaled value was then added to the print head Z position on a point-by-point basis. The oak leaf is clearly visible in the overlaid melt pool size data.
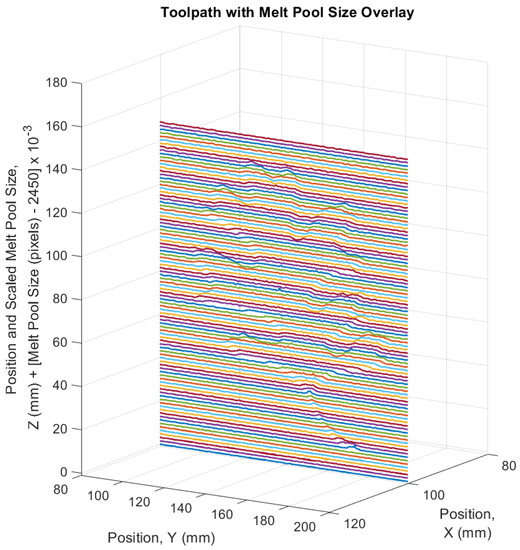
Figure 6.
Toolpath with melt pool size overlay for bead one of Wall 2.
3.1. Laser Power Modulation
For a more detailed look at laser power modulation, Figure 7 displays laser power data and the melt pool size response for both beads of layer 35 for each wall. Layer 35 was selected because it contained the maximum of three step changes, and each was sufficiently long to allow the system to achieve the desired melt pool size at setpoints. In Wall 1, bead one did not contain any site-specific step changes. Figure 7 shows that the melt pool was controlled at the nominal size (2450 pixels) throughout the bead. Some increased error is evident as the print head entered the bead termination routine (at ~24 s on the figure), at which point laser power was significantly modulated to control melt pool size in a highly transient thermal condition that tested the disturbance rejection capabilities of the controller, rather than setpoint tracking performance. In bead two, three step changes were present, and laser power modulated over a range of approximately 1.5–2 kW to achieve the higher melt pool size of 3063 pixels. It is noteworthy that the laser power required to achieve the nominal melt pool size was lower for bead two as compared with bead one, by approximately 0.5 to 1 kW. This result is not unexpected, in that the residual heat present in the wall after the deposition of bead one contributes to the deposition of bead two, in what can be thought of as a secondary heating or insulating effect; the inter-bead time, or the duration from laser-off of bead one to laser-on of bead two, was only 16 s. After the deposition of bead two, however, there was a longer cooling time before the deposition of bead one of the subsequent layer; the interlayer time, which included the built height scan, was 89 s.
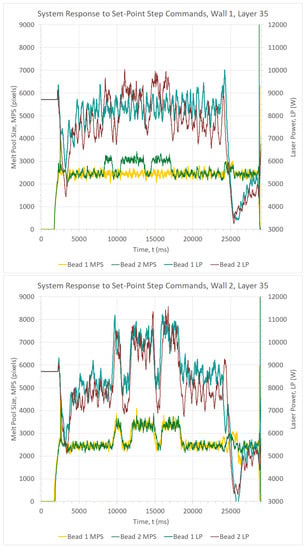
Figure 7.
Laser power and melt pool size response for layer 35.
In Wall 2, both beads contained site-specific step changes in melt pool size. The secondary geometry was shifted +10 mm in the Y-axis for Wall 2 to better position the leaf within the wall; this is evident as a slight shift in time of the step changes for Wall 2 as compared with Wall 1. The laser power magnitude required to achieve the nominal melt pool size in Wall 2 was remarkably similar to that of Wall 1, and again, bead two laser power trended lower than bead one laser power. Where differences arise are in the step changes. Larger modulations in laser power, in the order of 2 to 3 kW, were required to achieve the increased melt pool size. Interestingly, the largest and most distinct difference between bead one laser power and bead two laser power occurred at the two inter-step returns to nominal melt pool size, at which point bead two laser power was approximately 1 kW lower than bead one. It is believed that the residual heat contributed to the larger reductions in laser power that were required to return the melt pool to the nominal size.
3.2. Melt Pool Size Response
For a deeper dive on melt pool size response, an examination of the leaf stem region, which contained a range of steps that were relatively short in duration, was conducted. Wall 2 was selected for this analysis, due to its larger magnitude step changes. Specifically, layers 9 to 25, which contained single step changes in the leaf stem, were examined. Figure 8 displays the melt pool response time comparison for select layers in this range. Curves were temporally aligned using the rising edge of the melt pool size signal to allow for direct comparisons among step durations. It was found that 2.7 mm, the step distance of layer 21, was the minimum step distance for which the higher melt pool size setpoint (3369 pixels) could be achieved. Step distances shorter than this were characterized by melt pool size responses that did not attain the higher setpoint; one such example is shown in Figure 8. For the combination of primary process parameters used to print these walls, 2.7 mm would be considered the extra-toolpath feature resolution for which full embossing could be achieved. The 2.7 mm step distance, in combination with an 8 mm/s print speed and a 919 pixel step magnitude, corresponds to a 37 msec per 100 pixel rise time, which is remarkably similar to that which has been documented in prior work on this laser wire-based DED process [2]. In all, there were 18 steps shorter than 2.7 mm in the oak leaf design, with seven of those located in the leaf stem.
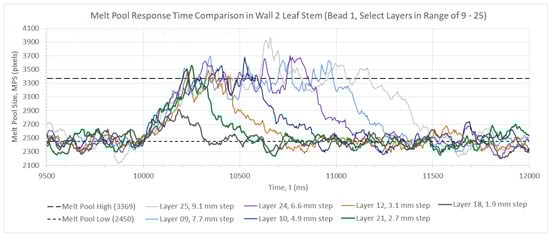
Figure 8.
Melt pool response time comparison for Wall 2 leaf stem; bead one, select layers in the range of 9–25.
3.3. Extra-Toolpath Geometry
Scans of the wall geometries revealed the embossed, or extra-toolpath geometry achieved through site-specific melt pool size control. Thickness color maps are shown for both sides of both Walls 1 and 2 in Figure 9. The thickness maps were generated by comparing the scanned, as-printed geometry with that of a flat reference wall, like that used for slicing purposes; the thickness magnitude represented by the color scale is the difference between the two geometries. Relative positioning of the reference wall and the scanned geometry in the inspection software led to some differences in the color scale from case to case. Because of this, a white reference marker was inserted into the color scale at the position believed to represent the average steady-state wall surface outside of the oak leaf. Embossing measurements could then be made in comparison to the thickness magnitude of this white reference marker on a case-by-case basis.
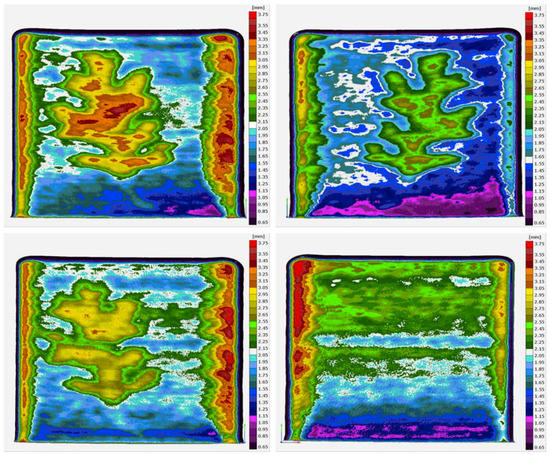
Figure 9.
Wall geometry scans; Wall 2, side two (top left), Wall 2, side one (top right), Wall 1, side two (bottom left), Wall 1, side one (bottom right).
Wall 1, side one did not contain site-specific changes to the melt pool size setpoint; instead, it provides a nominal reference in which some thickness variation is evident from the bottom to the top of the wall. Increases in thickness at the bead initiation and termination regions are evident and were expected. Examining the oak leaf, the maximum embossing achieved on Wall 1, side two was 1 mm. The maximum embossing of the oak leaf achieved on Wall two was 1.2 mm on side one and 1.5 mm on side two. The maximum of 1.5 mm corresponds to 7.2% of the total wall thickness of 20.7 mm. The total through-thickness, from the combination of both sides one and two (because the oak leaves are mirror images of each other on Wall 2), was 2.7 mm, or 13% of the total wall thickness. The leaf stem is more readily discernable on Wall 2, although its prominence is still reduced due to the previously discussed melt pool size response time and resolution limitations.
Finally, Figure 10 shows photographs of side two of Wall 2 in both the as-printed condition and after heat treatment. Both walls were subjected to a post-print stress-relieve (720 °C for t > 2 h or 650 °C for t > 2.5 h for Ti-6Al-4V). The heat treatment process removed surface oxides (coloration) from the walls and gave a uniform appearance. The extra-toolpath geometry is clearly visible on the side of the wall.
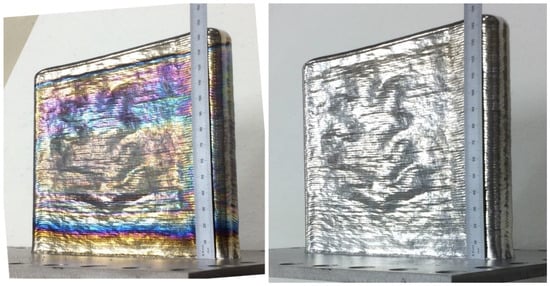
Figure 10.
Photographs of Wall 2, side two; as-printed (left) and after heat treatment (right).
4. Discussion
In this work, a closed-loop, site-specific control of melt pool size was successfully utilized to impart local process changes and print an extra-toolpath geometry, i.e., a geometry that occurs beyond the toolpath. The embossing resolution of the extra-toolpath geometry was dependent upon the melt pool size response time and the print speed. The ability of this technique to control local bead geometry has interesting implications, particularly for a large-scale AM process such as laser wire-based DED, which requires a different set of design rules than the majority of AM processes and has traditionally been limited to lower resolution of component details [13]. It is anticipated that the technique can be used in the near future for volumetric defect mitigation in toolpaths where local overlap of adjacent beads is inadequate. The capability to emboss specific, secondary geometry means that part identification features, such as a serial number or quick response (QR) code, could be permanently added to components during the printing process. The prospect of printing single toolpath walls with varying wall widths is also attractive from a post-print machining perspective, in that, when machining thin-walled structures, preforms ideally contain integrated structural support such as thicker sections that buttress and support adjacent thinner sections during the machining process.
An important aspect of the process demonstrated here is the closed-loop nature of the process. While it would certainly be possible to pre-program open-loop, site-specific modifications to process parameters in laser wire-based DED, a closed-loop system ensures that variables, like melt pool size, are controlled regardless of the thermal properties of the component under construction. This was evident in the laser power magnitude variance between beads one and two of the walls in this study. A model-referenced feed-forward approach would be an improvement over feed-forward alone, but there are certain things that are difficult to model, like unexpected print interruptions, which can happen at any time and have varying durations.
Another method that could be used to emboss secondary geometry would be to actually make the secondary geometry part of the primary toolpath, in that the sliced 3D object would contain the geometry to be embossed, and the toolpath would joggle laterally while nominal process parameters are maintained to create the embossing. The issue associated with this method is that toolpath turns generally induce print head velocity reductions, which can be a challenge to handle from a process stability perspective, particularly when they are sharp turns, such as those likely associated with secondary geometry embossing. Additionally, the small, localized nature of the toolpath joggles may induce print system vibrations that are undesirable.
The technique presented here is a fundamentally unique way of 3D printing a geometry, and accordingly, an area in which there is much room for advancement is process planning and automation, i.e., slicing and generation of what may otherwise be known as support code. The challenge in slicing is using the projection of the secondary geometry onto the primary toolpath to generate additional information that is attached to the toolpath and used to make site-specific adjustments to process parameters, e.g., melt pool size. The embossing resolution and the ability to deal with irregularities such as singularities (locations at which the layer intersects the secondary geometry at only a single point) must be built into the capabilities of the slicer. An additional challenge is in realizing the format by which additional information is attached to the toolpath. Generally, this is an area of great interest to AM researchers and may induce the rise of new forms of metadata for g-code based systems, or more widespread adoption of fully voxel-based approaches, methods that have gained significant traction in the field due to the capability for high resolution encoding of part information [14,15,16]. Software support and automation of this technique open the door for more advanced capabilities, with the potential for site-specific ramp changes, multiple parameter magnitudes, and the generation of detailed texture within the realm of possibilities.
Immediate future work will focus on process planning and automation, as well as the aspect of local property control. The impact of site-specific melt pool size control on cooling rates, solidification dynamics, and thermal cycling, which drives the resulting microstructure and mechanical properties in metal AM [17,18,19], was not characterized and is not within the scope of this work, but it is of great interest due to the potential for local property control with an eye toward functionally grading components in accordance with the demands of their applications. Future investigations should seek to answer the question of the degree to which local properties can be influenced using this technique for site-specific control of melt pool size.
Author Contributions
Conceptualization, B.T.G.; methodology, B.T.G.; software, B.T.G.; validation, B.T.G. and T.W.S.; formal analysis, B.T.G. and T.W.S.; investigation, B.T.G. and T.W.S.; resources, B.S.R. and L.J.L.; data curation, B.T.G. and T.W.S.; writing—original draft preparation, B.T.G.; writing—review and editing, B.T.G. and B.S.R.; visualization, B.T.G. and T.W.S.; supervision, B.S.R. and L.J.L.; project administration, B.S.R. and L.J.L.; funding acquisition, B.S.R. and L.J.L.
Funding
This research was funded by the U.S. Department of Energy, Office of Energy Efficiency and Renewable Energy, Advanced Manufacturing Office in partnership with GKN Aerospace. This manuscript has been authored by UT-Battelle, LLC under contract no. DE-AC05-00OR22725 with the U.S. Department of Energy. The United States government retains and the publisher, by accepting the article for publication, acknowledges that the United States government retains a non-exclusive, paid-up, irrevocable, worldwide license to publish or reproduce the published form of this manuscript, or allow others to do so, for United States government purposes. The Department of Energy will provide public access to these results of federally sponsored research in accordance with the DOE public access plan (http://energy.gov/downloads/doe-public-access-plan).
Acknowledgments
The authors would like to acknowledge the contributions of the extended Oak Ridge National Laboratory and GKN Aerospace teams, particularly those of Brian Post, Alex Roschli, Michael Borish, and Abigail Barnes of ORNL and John Potter, Emma Vetland, Chad Henry, Aaron Thornton, Ronnie Wilson, and Chris Allison of GKN Aerospace, along with Yashwanth Bandari of the EWI Buffalo Manufacturing Works.
Conflicts of Interest
The authors declare no conflict of interest.
References
- Babu, S.S.; Love, L.; Dehoff, R.; Peter, W.; Watkins, T.R.; Pannala, S. Additive manufacturing of materials: Opportunities and challenges. MRS Bull. 2015, 40, 1154–1161. [Google Scholar] [CrossRef]
- Gibson, B.; Bandari, Y.K.; Richardson, B.; Henry, W.C.; Vetland, E.J.; Sundermann, T.W.; Love, L. Melt Pool Size Control through Multiple Closed-Loop Modalities in Laser-Wire Directed Energy Deposition of Ti-6Al-4V; Oak Ridge National Lab: Oak Ridge, TN, USA, 2019. [Google Scholar]
- Hofmeister, W.; Knorovsky, G.A.; Maccallum, D.O. Video Monitoring and Control of the LENS Process. In Proceedings of the American Welding Society 9th International Conference of Computer Technology in Welding, Detroit, MI, USA, 28–30 September 1999. [Google Scholar]
- Hu, D.; Kovacevic, R. Modelling and measuring the thermal behaviour of the molten pool in closed-loop controlled laser-based additive manufacturing. Proc. Inst. Mech. Eng. Part B J. Eng. Manuf. 2003, 217, 441–452. [Google Scholar] [CrossRef]
- Hu, D.; Mei, H.; Tao, G.; Kovacevic, R. Closed loop control of 3D laser cladding based on infrared sensing. In Proceedings of the Solid Freeform Fabrication Symposium, Austin, TX, USA, August 2001; pp. 129–137. [Google Scholar]
- Zalameda, J.N.; Burke, E.R.; Hafley, R.A.; Taminger, K.M.; Domack, C.S.; Brewer, A.; Martin, R.E. Thermal imaging for assessment of electron-beam freeform fabrication (EBF3) additive manufacturing deposits. In Proceedings of the SPIE, Baltimore, MD, USA, 22 May 2013. [Google Scholar]
- Gibson, I.; Rosen, D.; Stucker, B. Additive manufacturing technologies: 3D printing, rapid prototyping, and direct digital manufacturing. Johns. Matthey Technol. Rev. 2015, 59, 193–198. [Google Scholar]
- Lee, Y.S.; Kirka, M.M.; Dinwiddie, R.B.; Raghavan, N.; Turner, J.; Dehoff, R.R.; Babu, S.S. Role of scan strategies on thermal gradient and solidification rate in electron beam powder bed fusion. Addit. Manuf. 2018, 22, 516–527. [Google Scholar] [CrossRef]
- Dehoff, R.R.; Kirka, M.M.; Sames, W.J.; Bilheux, H.; Tremsin, A.S.; Lowe, L.E.; Babu, S.S. Site specific control of crystallographic grain orientation through electron beam additive manufacturing. Mater. Sci. Technol. 2015, 31, 931–938. [Google Scholar] [CrossRef]
- Gibson, B.; Bandari, Y.K.; Richardson, B.; Roschli, A.; Post, B.; Borish, M.; Thornton, A.S.; Henry, W.C.; Lamsey, M.D.; Love, L. Melt pool monitoring for control and data analytics in large-scale metal additive manufacturing. In Proceedings of the International Solid Freeform Fabrication Symposium, Austin, TX, USA, 12–14 August 2019. [Google Scholar]
- Borish, M.; Post, B.K.; Roschli, A.; Chesser, P.C.; Love, L.J.; Gaul, K.T. Defect Identification and Mitigation Via Visual Inspection in Large-Scale Additive Manufacturing. JOM 2019, 71, 893–899. [Google Scholar] [CrossRef]
- Bristow, D. Melt pool measures and effective sensor bandwidth for direct energy deposition. In Proceedings of the International Solid Freeform Fabrication Symposium, Austin, TX, USA, 12–14 August 2019. [Google Scholar]
- Greer, C.; Nycz, A.; Noakes, M.; Richardson, B.; Post, B.; Kurfess, T.; Love, L. Introduction to the design rules for Metal Big Area Additive Manufacturing. Addit. Manuf. 2019, 27, 159–166. [Google Scholar] [CrossRef]
- Aremu, A.O.; Brennan-Craddock, J.P.J.; Panesar, A.; Ashcroft, I.A.; Hague, R.J.M.; Wildman, R.D.; Ruck, C. A Voxel-Based Method of Constructing and Skinning Conformal and Functionally Graded Lattice Structures Suitable for Additive Manufacturing. Aditive Manuf. 2017, 13, 1–13. [Google Scholar] [CrossRef]
- Wittkopf, J.; Erickson, K.; Olumbummo, P.; Hartman, A.; Howrd, T.; Zhao, L. 3D Printed Electronics with Multi Jet Fusion. In Proceedings of the Printing for Fabrication, San Francisco, CA, USA, 29 September–3 October 2019. [Google Scholar]
- Yokoyama, Y.; Hiji, N.; Takahasji, T. Application of Attribute Information of Voxel-Based 3D Data Format FAV for Metamaterials Structure Design. In Proceedings of the Printing for Fabrication, San Francisco, CA, USA, 29 September–3 October 2019. [Google Scholar]
- Seifi, M.; Salem, A.; Beuth, J.; Harrysson, O.; Lewandowski, J.J. Overview of Materials Qualification Needs for Metal Additive Manufacturing. JOM 2016, 68, 747–764. [Google Scholar] [CrossRef]
- Collins, P.C.; Brice, D.A.; Samimi, P.; Ghamarian, I.; Fraser, H.L. Microstructural Control of Additively Manufactured Materials. Annu. Rev. Mater. Res. 2016, 46, 63–91. [Google Scholar] [CrossRef]
- Lewandowski, J.J.; Seifi, M. Metal Additive Manufacturing: A Review of Mechanical Properties. Annu. Rev. Mater. Res. 2016, 46, 151–186. [Google Scholar] [CrossRef]
© 2019 by UT-Battelle, LLC. Licensee MDPI, Basel, Switzerland. This article is an open access article distributed under the terms and conditions of the Creative Commons Attribution (CC BY) license (http://creativecommons.org/licenses/by/4.0/).