Hyperspectral Imaging Techniques for the Study, Conservation and Management of Rock Art


1
Manufacturing and Construction Engineering Department, ETS de Ingenieros Industriales, Universidad Nacional de Educación a Distancia, Calle Juan del Rosal 12, 28040 Madrid, Spain
2
GIM Geomatics, S.L. C/Conde Torreanaz 8, 39300 Torrelavega, Spain
3
Paleolithic Studies Laboratory, Prehistory and Archaeology Department, Universidad Nacional de Educación a Distancia, Avda. Senda del Rey 7, 28040 Madrid, Spain
*
Author to whom correspondence should be addressed.
Appl. Sci. 2019, 9(23), 5011; https://doi.org/10.3390/app9235011
Submission received: 20 October 2019
/
Revised: 15 November 2019
/
Accepted: 19 November 2019
/
Published: 21 November 2019
(This article belongs to the Special Issue Special Issue of the Manufacturing Engineering Society 2019 (SIMES-2019))
Abstract
:Featured Application
This work presents several hyperspectral techniques that can provide a scientific and non-destructive method for the study, conservation and management of rock art. Tasks such as recognition of coloring matter, formal recognition of the figures, superposition of forms and documentation of the state of conservation can be solved efficiently with hyperspectral imaging.
Abstract
Paleolithic rock art is one of the most important cultural phenomena in the history of mankind. It was made by making incisions and/or applying natural pigments mixed with water or organic elements on a rock surface, which for millennia has been subjected to different factors of natural and anthropogenic alteration that have caused its deterioration and/or disappearance. The present paper shows a methodology that employs hyperspectral technology in the range of visible light and the near infrared spectrum, providing a scientific and non-destructive way to study, conserve and manage such a valuable cultural heritage. Recognition of coloring matter, formal recognition of the figures, superposition of forms and documentation of the state of conservation are relevant topics in rock art, and hyperspectral imaging technology is an efficient way to study them. The aim is to establish a method of creating pigment cartography and enhancing the visualization of rock art panels. Illumination sources, spectroradiometry measurements and camera adjustments must be taken into account to generate accurate results that later will be pre-processed to derive reflectance data, and then pigment analysis and enhanced visualization methods are applied. This methodology has allowed us to obtain 76% more figures than using traditional techniques throughout the case study area.
1. Introduction
Prehistoric art is an extraordinary manifestation that documents, with great detail and precision, some facts and animal species that coexisted with the humans of Paleolithic times. It is the first industrial and technical heritage of history, and such a singular phenomenon must be protected [1]. It was made by making incisions and/or applying natural pigments mixed with water or organic elements on a rock surface, which for millennia has been subjected to different factors of natural and anthropogenic alteration that may have caused its deterioration or disappearance.
The deteriorating factors can act in an isolated or combined way on this cultural heritage and its support, and include dirt, impacts, flaking, disintegration, washing, glazes, coatings, etc.
The conservation of industrial, technical and cultural heritage requires a deep understanding of the significance and complexity of a place. Good conservation of our heritage is based on informed decisions, and good documentation ensures that knowledge of heritage places will be passed on to future generations.
This work analyses, develops and implements a methodology to generate information not visible to the naked eye due to dirt, washing, glazes and coatings. This information not only improves the visualization of the panels, but also helps us to understand how they were created and sheds light on the stratigraphy or sequence of the execution of different motifs.
The methodology is applicable to any rock art panels, and any cultural or industrial heritage objects in general, that need to be studied or controlled in time. The method has been tested on a panel that has been studied since the beginning of the 20th century, which presents a series of complex cases to solve such as superposition of paints, calcite glazes, pigment–sketch combination, etc.
Traditional rock art documentation systems are subjective [2], as an individual decides, usually by direct visualization, whether a unit is part of the panel or not. Throughout history, harmful methods such as casts and direct molds have been used, as well as others such as analogue, digital, ultraviolet and infrared photography, which have contributed to create “digital tracings” from images processed using image software. In all of them, it is an operator who decides whether or not the panel belongs to the class. Such subjectivity must be avoided, and hyperspectral remote sensing is an optimal tool for this.
A plethora of techniques, analyses and applications for hyperspectral remote sensing have been developed in the last few decades [3]. It has been used for the documentation of murals [4], detection of buried archaeological relics [5], and exploration of their geologic [6] or mineralogic composition. It has a number of advantages [7]: It is considered a safe detection technique because it is non-contact and non-destructive. Another advantage is its high spectral resolution with multiple bands and narrow bandwidth, i.e., it allows a continuous spectral response to be obtained for each pixel of the image. Because of these unique features, hyperspectral images have been used in conservation [8] and the study of artefacts [9] and to reveal hidden details in ancient manuscripts and paintings, although its use in rock art [10], and in cultural and industrial heritage objects [11], has been scarce and relatively recent.
The main objective of this study is to propose a method of generating the cartography of pigments and improving the visualization of aspects of rock art not visible to the naked eye due to the causes previously mentioned, as well as to understand its process of creation or the sequence of execution of different motifs.
2. Materials and Methods
2.1. Study Area
The study area corresponds to a series of panels in the Cave of El Castillo in Puente Viesgo, Cantabria, Spain, which was declared a World Heritage Site by United Nations Educational, Scientific and Cultural Organization (UNESCO) in 2008.
Today this cave has the world’s oldest Paleolithic art, at least 40,800 years old. The cave contains animal figures such as bison, horses, deer, mammoth, aurochs, goats, etc. The panels also feature hands, dots and rectangular shapes. Also found is one of the oldest industrial and technical heritage sites, associated with bone and lithic industry.
It is possible to find engravings with different characteristics and paintings that have red, black or yellow colors, applied with finger, airbrush, pencil or brush. The state of conservation of the panels is not very good. The panels have suffered graffiti, glazes, cleanings, etc., that make the motives unrecognizable with the naked eye. In order to reveal latent information, hyperspectral data from the panels have been captured and analyzed.
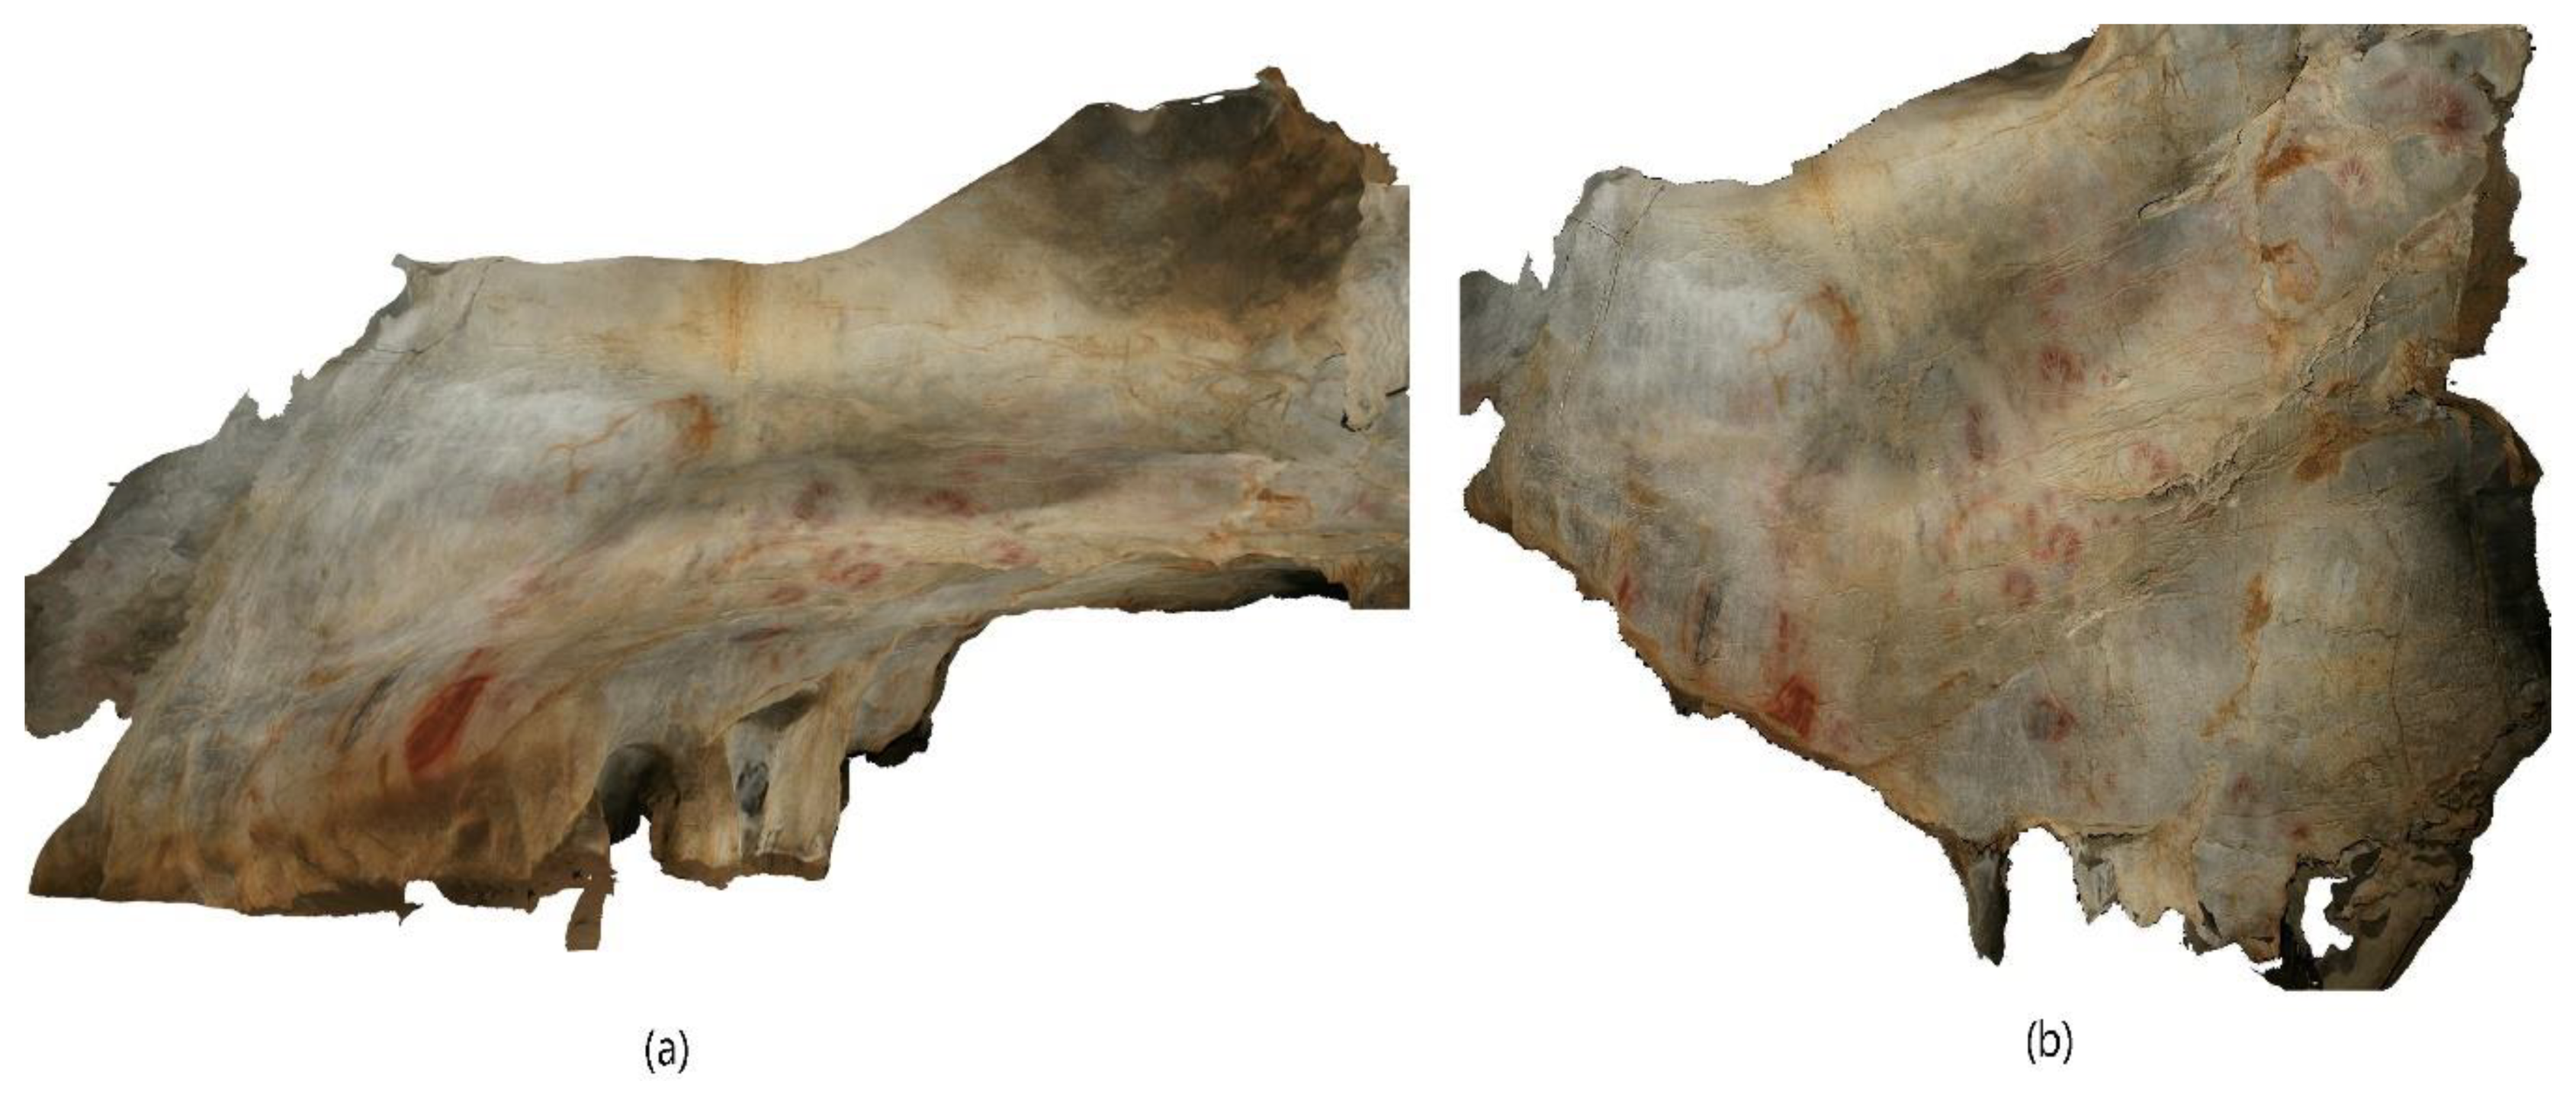
The panel de las manos of the cave of El Castillo (Figure 1) is possibly one of the most complex among Paleolithic art in general. The use of different techniques and colorants allows us to establish differences between groups and help us understand the chronostylistic evolution based on the superpositions of figures. The chronological frame of the figures has been set between 41,400 and 10,000 years before the present (BP) thanks to uranium-thorium and radiocarbon dating, although we have focused on the overlays of the Gravettian-Aurignacian phases. The panels were first studied by Alcalde del Río [12] in 1911, but during the last century many researchers have revisited the site and have applied different techniques to study the rock art panels of the cave such as hand-drawing, direct tracing, rubbing or frottage tracing; making molds directly from the panels; analogue photography; digital images; and techniques to enhance visualization such as decorrelation of individual elements [13,14,15,16,17,18].
As will be shown, hyperspectral remote sensing can help not only to better identify figures, but also isolate them by type of dye and analyze superimpositions.
In the first study carried out on the panel de las manos [12], 9 animals painted in yellow, 33 negative hands, 13 painted signs and some groups of red punctuation, and 6 engraved figures, mainly deer, were identified. Using hyperspectral technology, 35 zoomorphs (23 in yellow, 2 in red, 19 in black and 1 in white), 56 hands (in 2 phases) and 22 signs have been documented today [18].
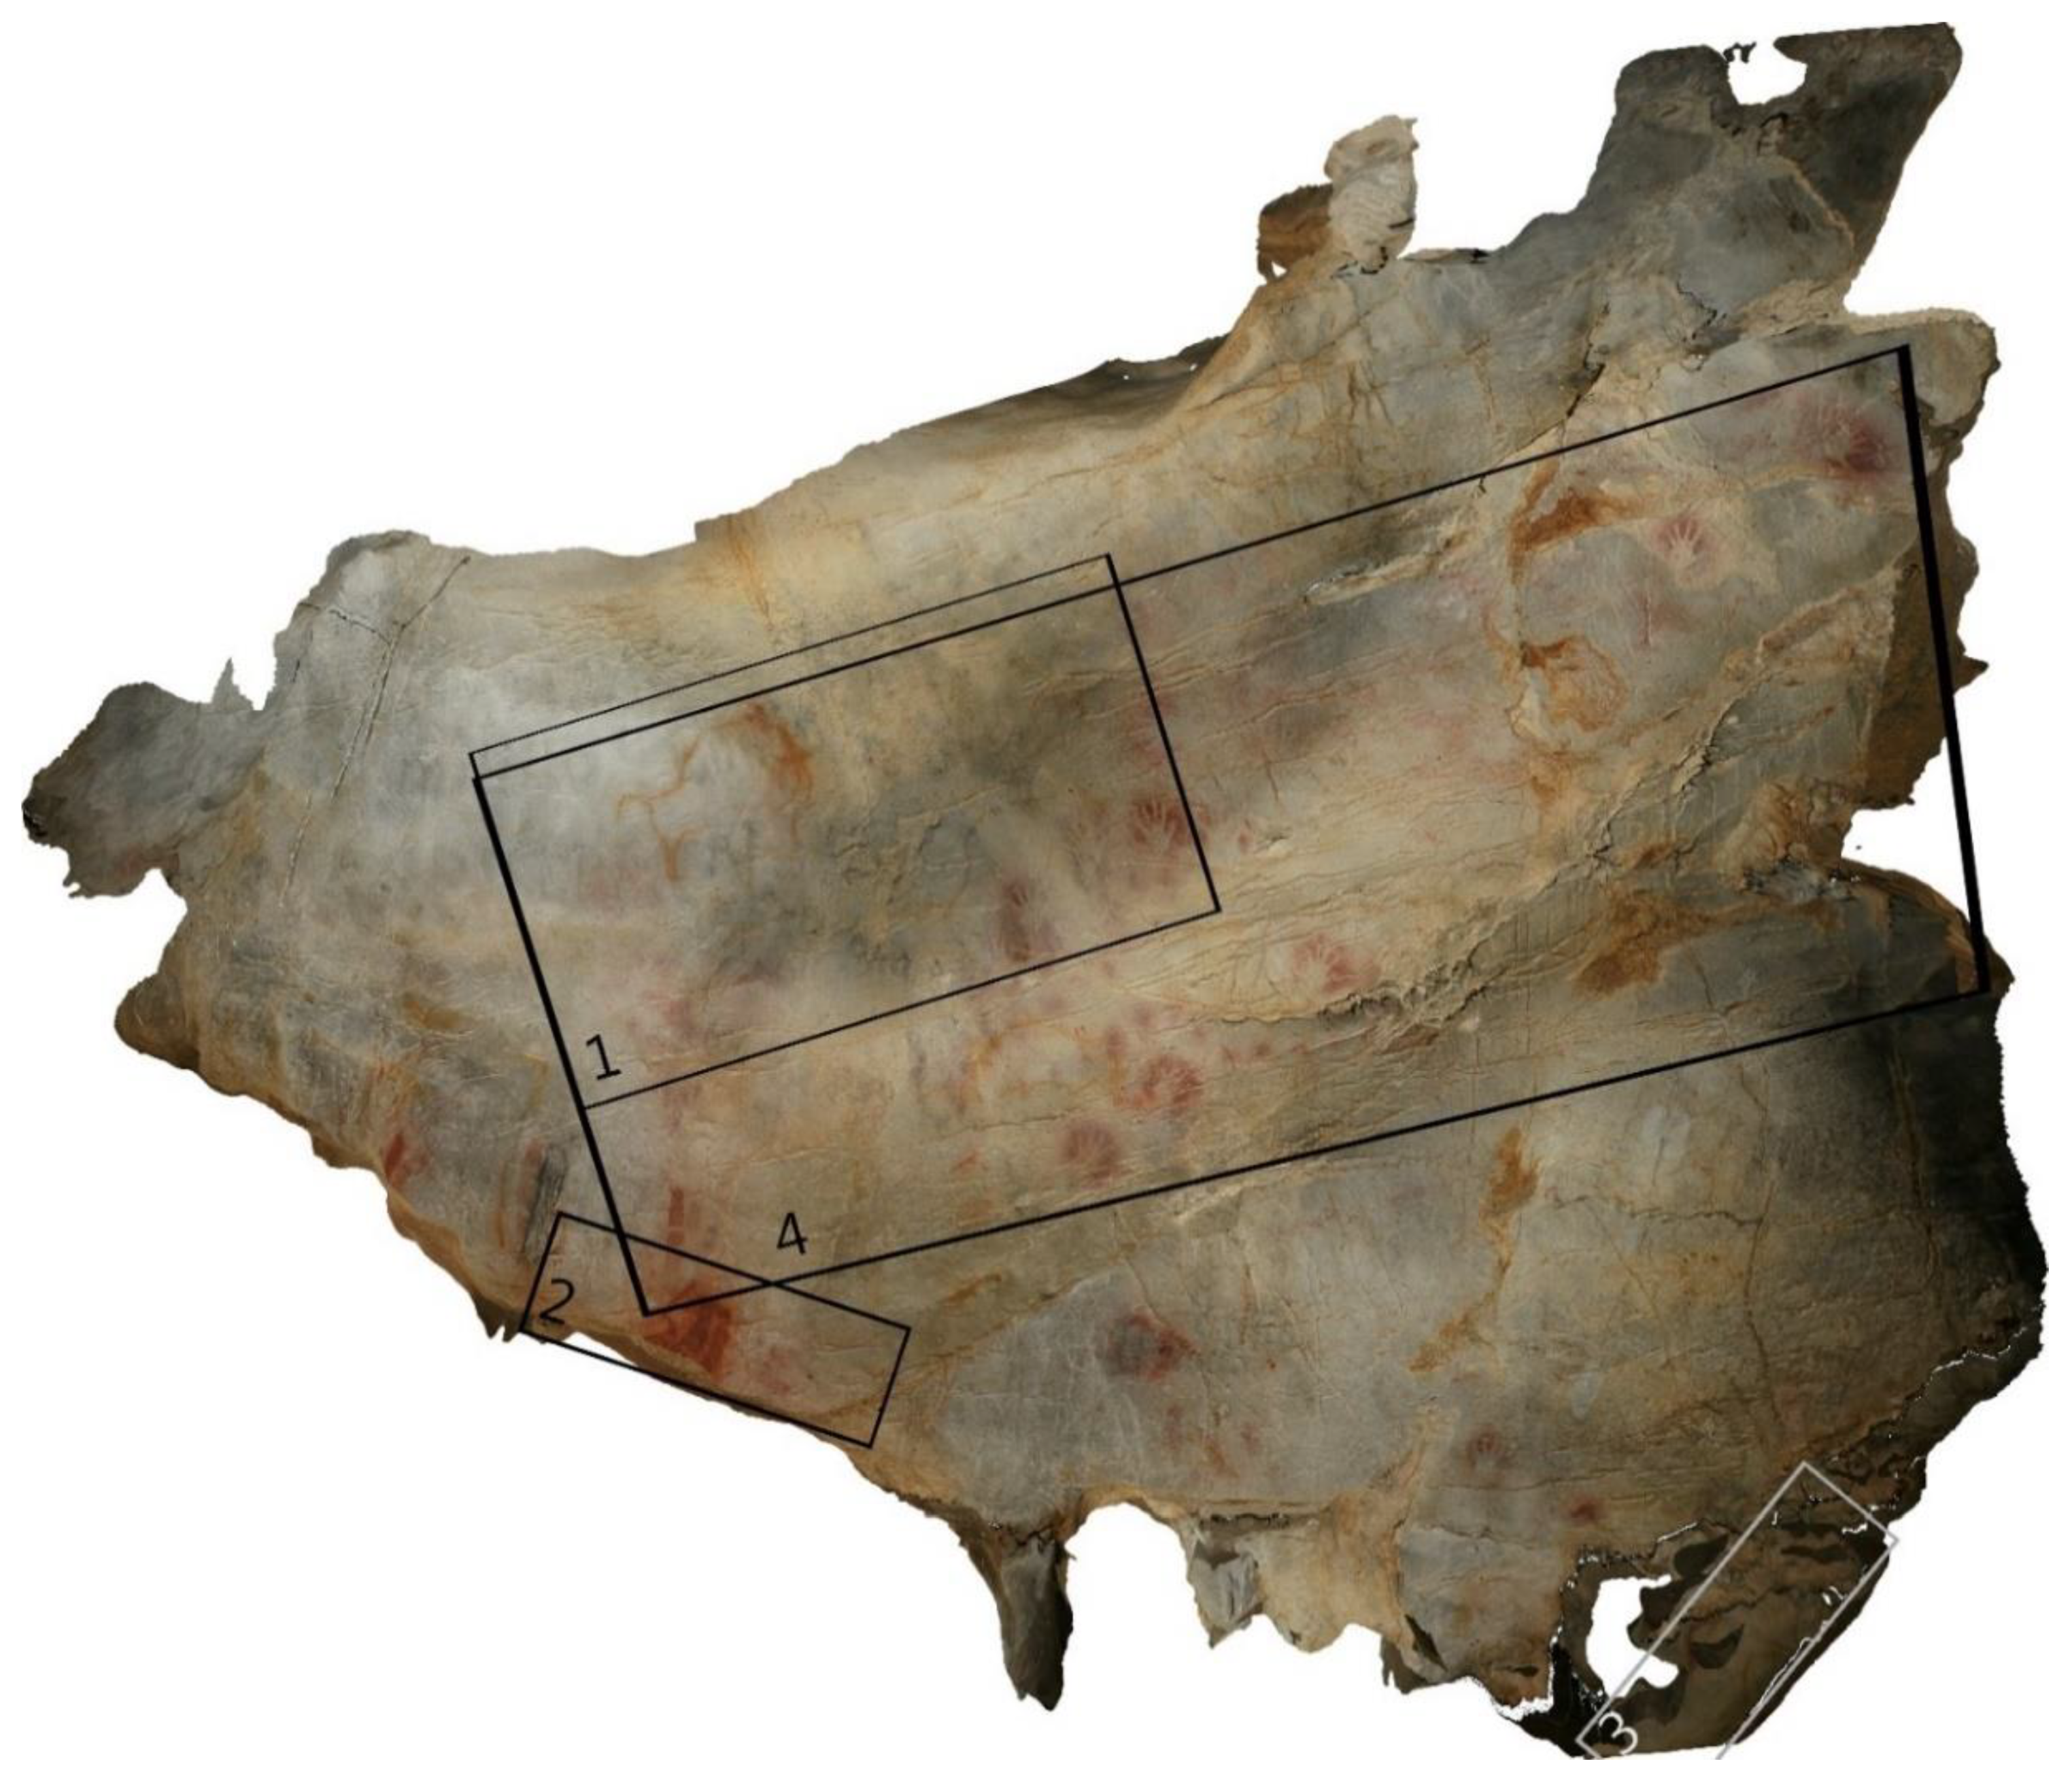
The study was carried out on the panel as a whole; the archaeological interpretation was made by Ripoll [19]. Nevertheless, the present study shows three areas of special interest and the hand analysis of the whole panel.
2.2. Overall Workflow
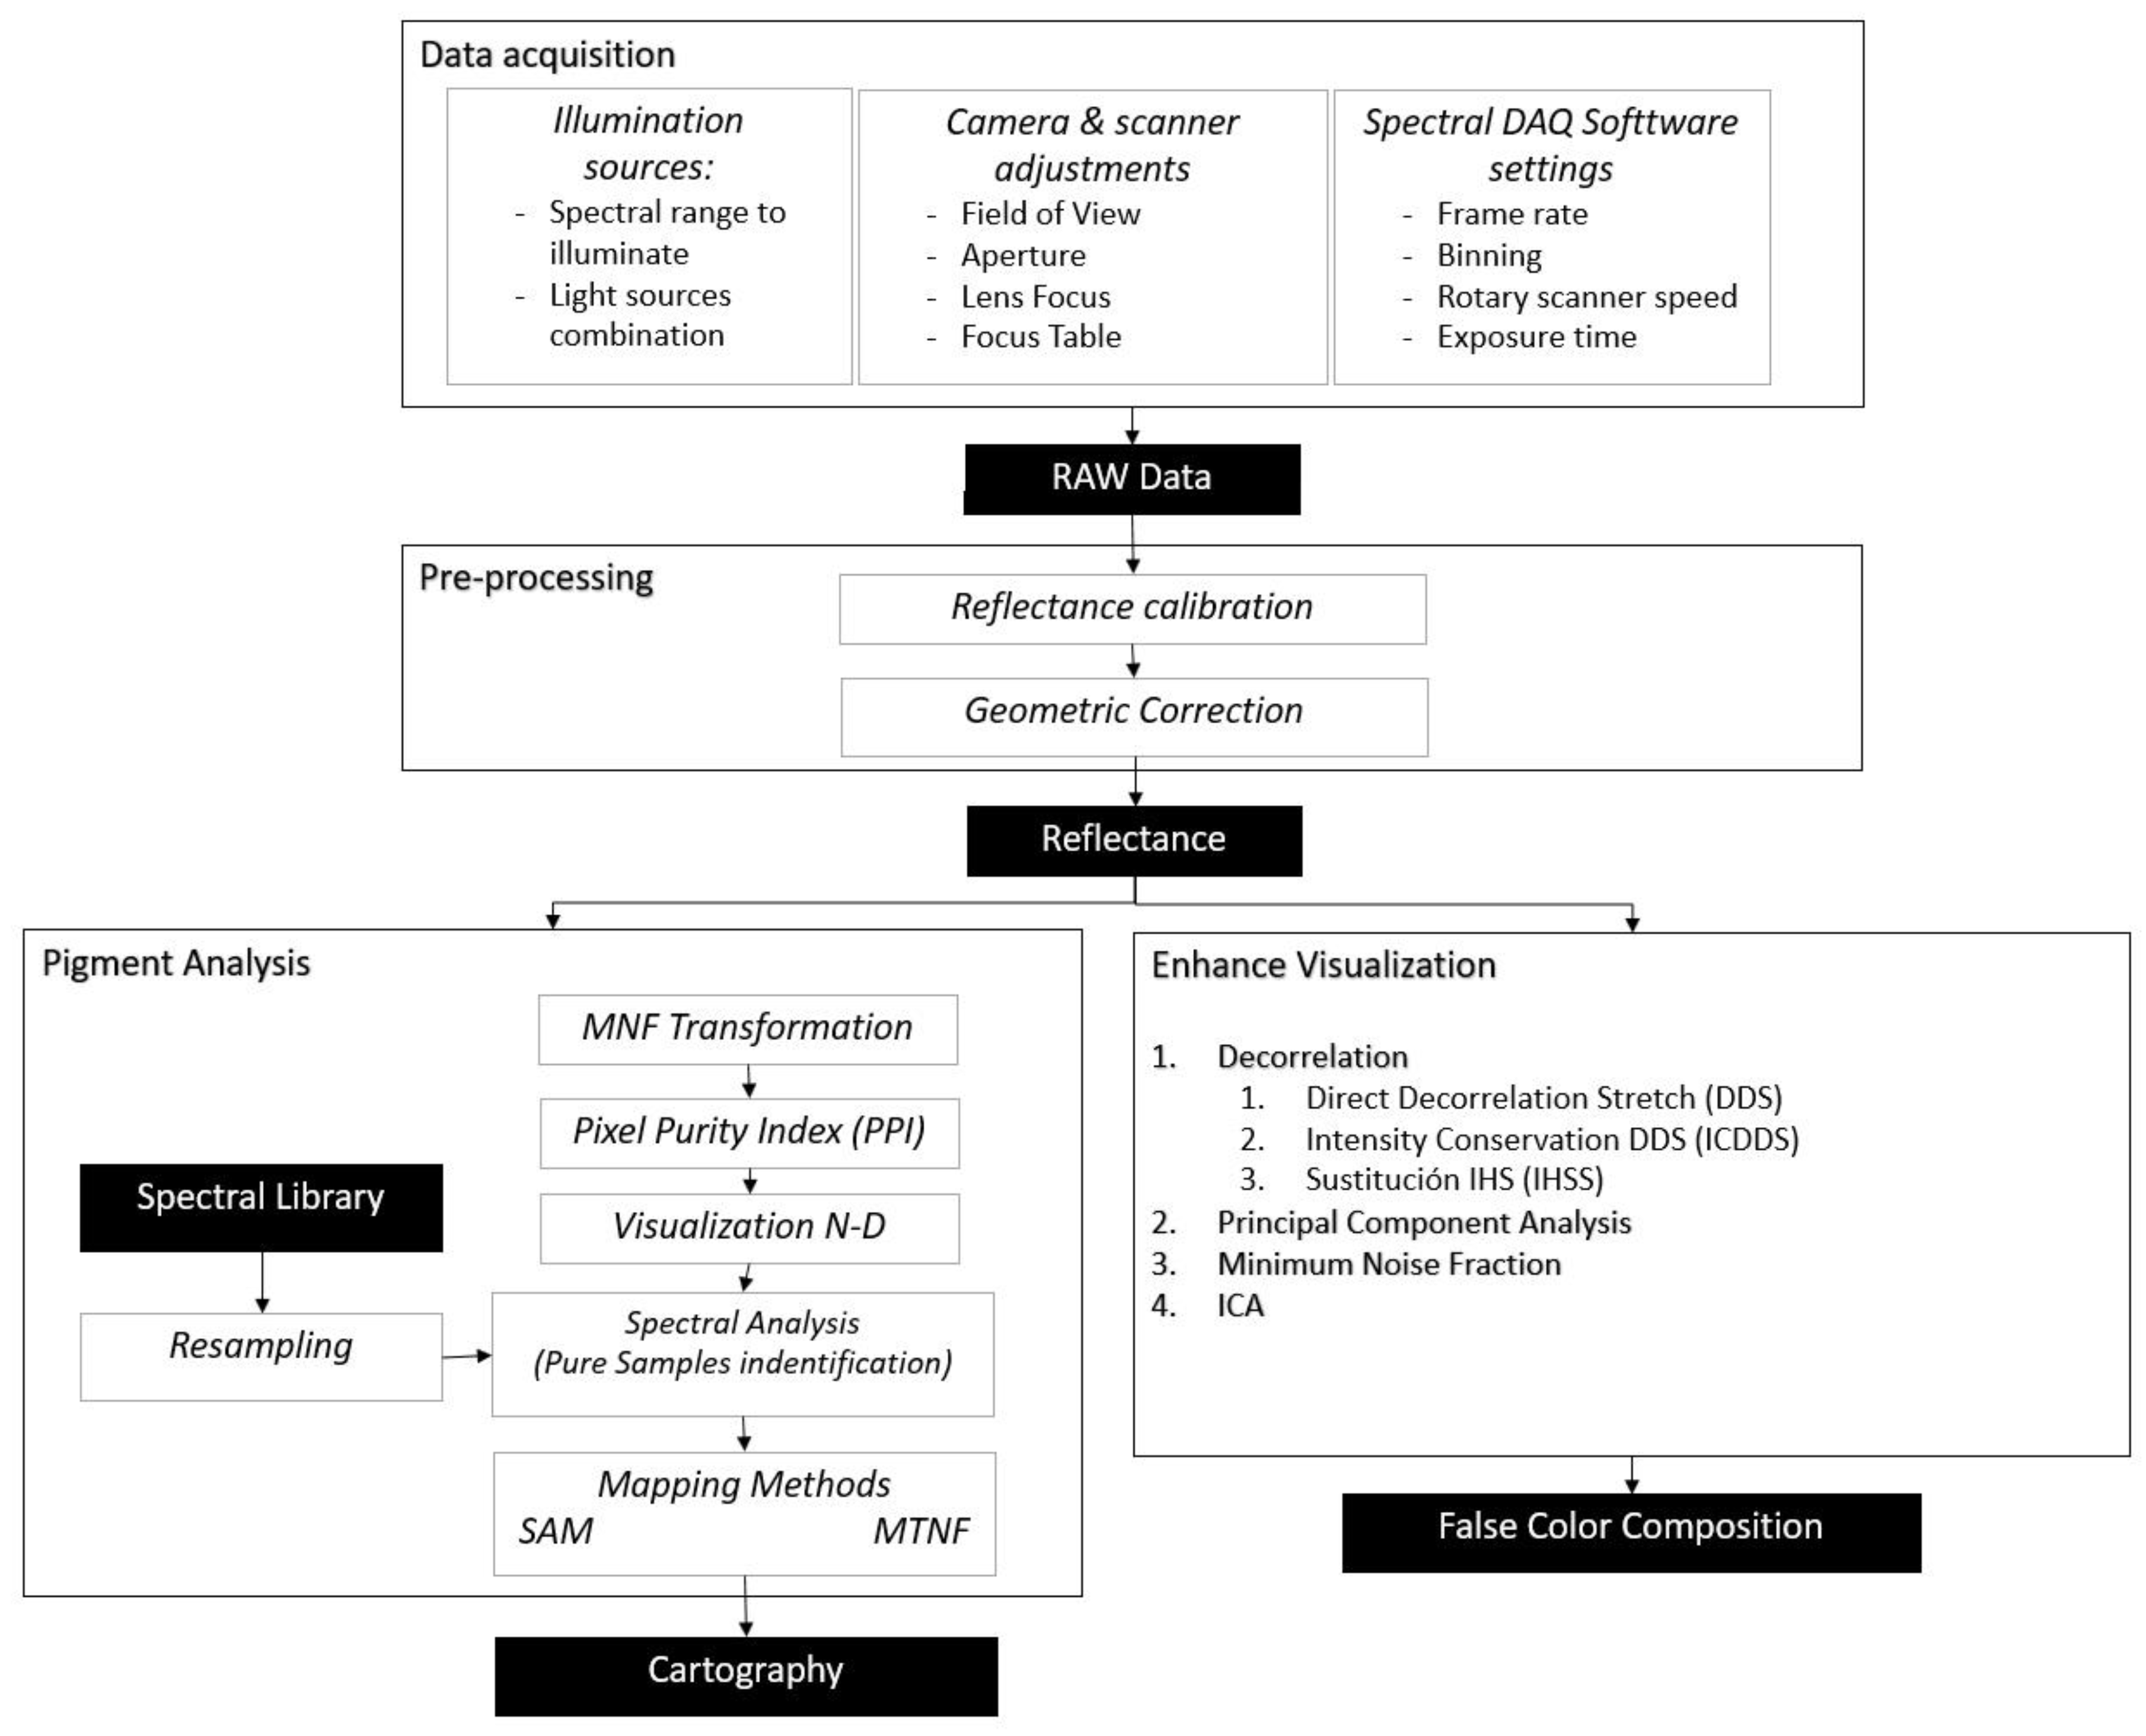
Figure 2 shows the overall workflow of the proposed method for the data acquisition, pre-processing, pigment analysis and extraction of the hidden information of rock art. The details of each step are discussed in the following subsections.
The data acquisition was carried out in 2014 and 2018. Hyperspectral imaging data were acquired with a VNIR Specim V10E sensor and pre-processing steps were applied to transform raw data from radiance into reflectance values and were georeferenced and geometrically corrected.
Pre-processed hyperspectral images were classified using spectral angle mapper (SAM) and mixture tuned match filtering (MTMF) [20] image processing algorithms to generate a pigment cartography. End members for classification were selected from pure samples identification spectral analysis and were sampled by using a field spectroradiometer. In parallel, a process to enhance visualization was used in order to generate false color compositions to ease the pigment interpretation.
2.3. Data Acquisition
2.3.1. Hyperspectral Imaging System
The hyperspectral imaging system used in this study consists of a Specim V10E spectrograph (Spectral Imaging Ltd., Oulu, Finland) covering a spectral range of 400–1000 nm, a sCMOS camera (CL-30, effective resolution 1312 × 728 pixels by 12 bits), an objective lens (Cinegon 2.4/30 mm focal length), a rotating scanner light and data acquisition (DAQ) spectral software.
The 2.8 nm spectral resolution was reduced to 5.6 nm by applying binning to improve the signal-to-noise ratio. The data were recorded as a hypercube with two-dimensional spatial images and wavelength bands as the third dimension, and 214 spectral bands were extracted from each pixel to form a relatively continuous spectral curve.
2.3.2. Illumination Sources
The cave of El Castillo is a place with very stable conditions, with an average temperature of 13.8 °C, humidity of 99% and total absence of light.
This makes it necessary to illuminate the panels with artificial light, for which the recommendations of the International Council of Museums (ICOM) were followed [21]: section 9, “physical environment”, recommends that moderately sensitive elements should only be exposed to filtered ultraviolet light with an intensity not exceeding 150 lux. This was necessary to create a lighting setup for the field campaigns in 2014–2018, which was calibrated in the spectral range where the sensors were operational.
For this purpose, ultraviolet and infrared light-emitting diode (LED) lights and tube lights were used. The lighting setup was formed by an array of four Phillips TL5 tubular fluorescent lamps (green), ultraviolet and infrared LED lamps. The spectral signature of the lights was obtained from the 1 nm wide narrowband FieldSpec Pro FR spectroradiometer manufactured by Analytical Spectral Devices measuring spectra over a range of 350–1050 nm (Figure 3).
2.4. Pre-Processing
2.4.1. Reflectance Calibration
Prior to image acquisition, a protocol to eliminate the effects of black (B) and white (W) background on the hyperspectral images was followed. A white image was acquired by recording a uniform white target, and a black image by closing the shutter of the camera. The calibrated reflectance values (R) of raw sample images (I) were calculated by the following formula:
where i is the pixel index.
2.4.2. Geometric Correction
A hyperspectral image is a conical projection of reality. The geometric correction process is carried out to eliminate errors or distortions that occur in the image, and to adapt the image to an established 3D reference system that allows it to be compared.
The steps to follow in the geometric correction of an image are as follows:
- Select control points.
- Calculate the transformation.
- Resample the image.
- Verify the process.
In this case, the correction was made by projecting the hyperspectral image onto the 3D model of the panel de las manos obtained by photogrammetry, which was subsequently re-projected following an orthogonal plane (Figure 1). The hyperspectral imaging camera had certain limitations regarding the imaging range and resolution. The pixel size was set to 1 mm and each recording had approximately 1 m2.
2.5. Pigment Analysis
Integrated processes are classified into two families:
- Analysis techniques, where the aim is to be able to generate pigment cartography and distinguish between those that are equal and those that are not.
- Enhance visualization techniques, where the aim is to be able to recover paintings that cannot be seen with the naked eye.
The result of the pigment analysis is thematic cartography, and each pixel has an assigned class value, but the result of the enhanced visualization technique is images.
2.5.1. Minimum Noise Fraction Transformation
The modified minimum noise fraction (MNF) transformation was implemented as described by Green [22]. It is a technique that transforms the data hypercube into a set of canals with increasing noise levels by means of noise whitening and the subsequent application of main components. The MNF transformation is also used to eliminate noise from data by performing a direct transformation, determining which bands contain coherent images (examining images and auto-values), and then executing an inverse transformation using a spectral subset that includes only good bands, or smoothing the noisier bands before executing the inverse.
2.5.2. Pixel Purity Index
The pixel purity index (PPI) is used to find the most spectrally pure (extreme) pixels in multispectral and hyperspectral images. In our case it was used to distinguish between different types of ochre and black pigments. It normally corresponds to the final mixing members. The PPI is calculated by repeatedly projecting n-D scatter diagrams on a random unit vector.
Computationally, extreme pixels are recorded at each projection (pixels that fall on the ends of the unit vector), and the number of times each pixel is marked as extreme is recorded. A pixel purity image is created where each pixel value corresponds to the number of times the pixel was recorded as extreme. The PPI function can create a new output band or continue its iterations and add the results to an existing output band. The PPI is typically executed in an MNF transformation result, excluding noise bands. PPI results are generally used as input in the n-D viewer.
2.5.3. n-D Display
The n-D Visualizer is an interactive tool in the ENVI system that is used to locate, identify and group the purest pixels and the most extreme spectral responses in a dataset. The n-D viewer helps to visualize the shape of a data cloud that results from plotting image data in the spectral space (with image bands as frame axes). A spatial subset of MNF data using only the purest pixels determined from the PPI is normally used. It is also used to check the separability of classes when generating regions of interest (ROIs) as an entry in supervised classifications.
2.5.4. Spectral Angle Mapper
The spectral angle mapper (SAM) was developed by Boardman [20], but we based ours on Rashmi [23]. It is a physics-based spectral classification that uses an n-D angle to match pixels to reference spectra. The algorithm determines the spectral similarity between two spectra by calculating the angle between the spectra and treating them as vectors in a space with dimensionality equal to the number of bands.
This technique, when used with calibrated reflectance data, as in the present case study, is relatively insensitive to the effects of lighting and albedo. The spectra of pure samples used by SAM were recorded using the Analytical Spectral Devices full-resolution spectroradiometer, as described in Section 2.5.5. SAM compares the angles between final member spectrum vectors and each pixel vector in n-D space. Smaller angles represent coincidences closer to the reference spectrum. Pixels further than the maximum angle threshold specified in radians are not classified.
2.5.5. Field Spectroradiometer
Spectral reflectance signatures usually help to determine whether two pigment types can be distinguished from each other, and if so, in which part of the spectrum the spectral characteristics differ.
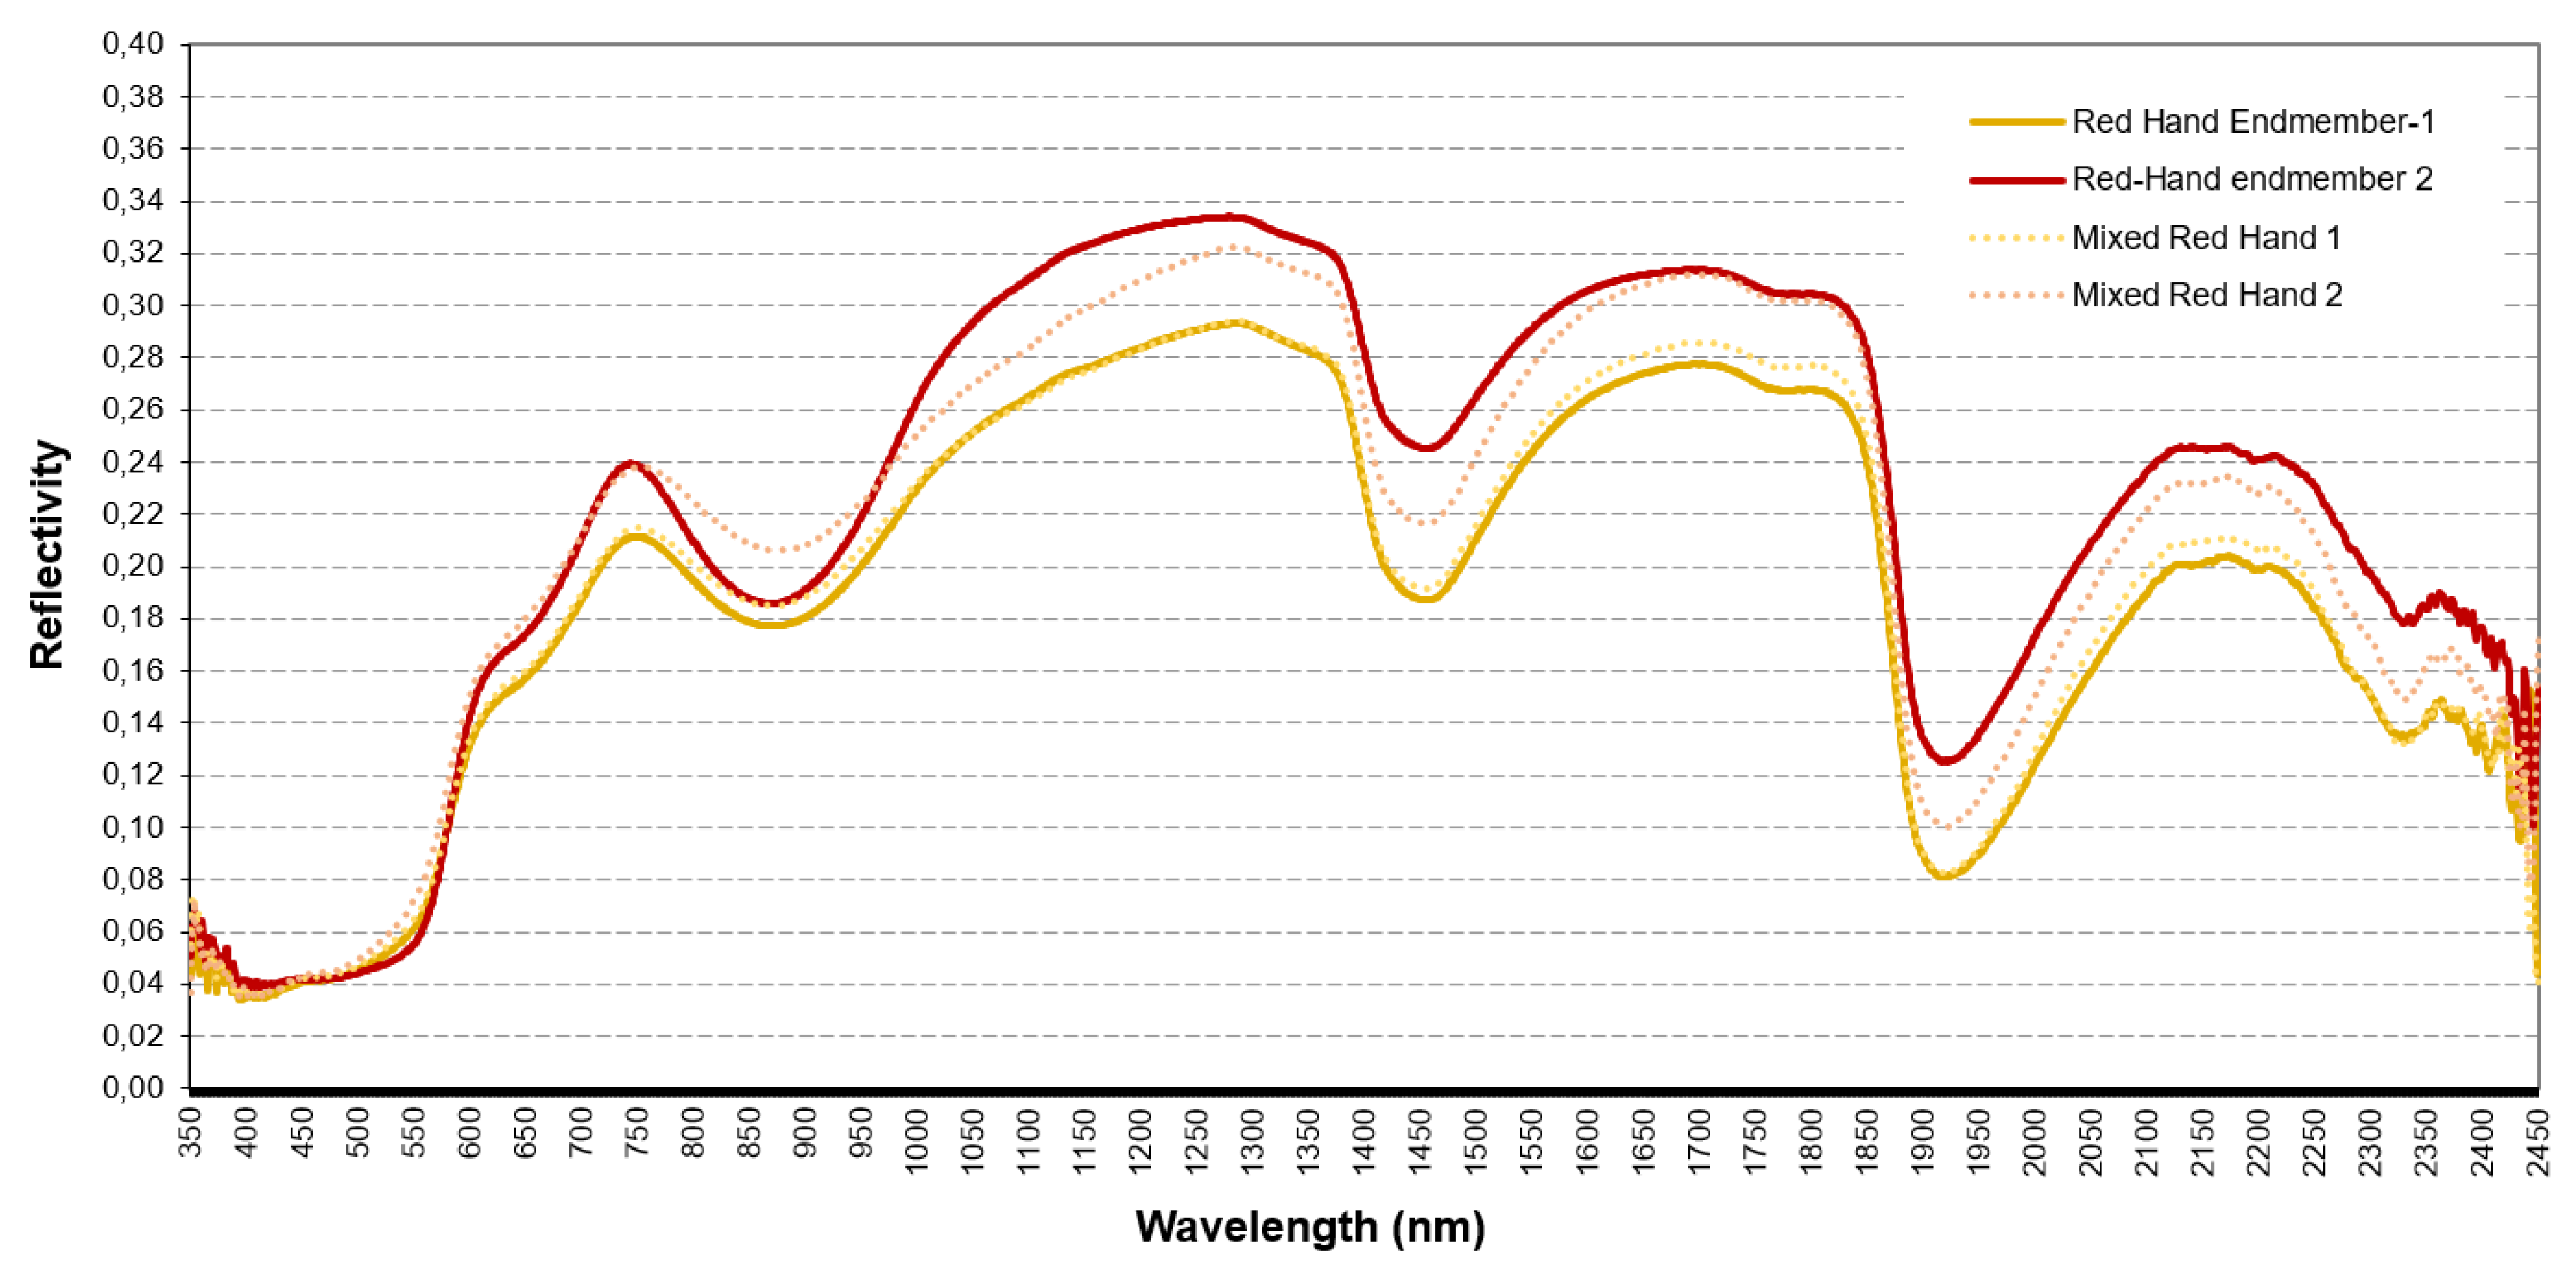
The sampling was made by using the Analytical Spectral Devices full-resolution spectroradiometer. This spectroradiometer can obtain data in the range of 350–2500 nm (Figure 4), but it’s important to note that the hyperspectral imaging system will take advantage of data only between 400 and 1000 nm. Spectral signatures of the pigments were obtained, and it was especially important to characterize the places where the spectral analysis detected the end members or pure samples of ochre pigment in order to train the later process of mapping methods.
With the data, it is possible to differentiate between different types of pigments that to an observer’s eye would be almost indistinguishable. This is possible because the spectral signature, instead of using information from the visible spectrum, integrates parts of the ultraviolet and infrared spectra, where the different composition offers different signals. Spectral signature data are used to analyze the separability between classes, that is, to know how many types of pigment can be distinguished and then integrated into the processing of clouds.
2.6. Visualization Improvement
2.6.1. Decorrelation Adjustment
Decorrelation adjustment is implemented for generic binary band data stored in 16 bits, as described by Sabins [24], and is used to enhance the image. It consists of converting the data to the space defined by the main components of the original bands, followed by equalizing the data according to the new axes, and finally converting the data to the initial space and combining the bands with the primary colors, red/green/blue (RGB). In this way, the dots are more evenly distributed in the RGB space, so the image will show much higher contrast.
2.6.2. Principal Component Analysis
2.6.3. Minimum Noise Fraction Transformation
The modified MNF transformation was implemented as described by Green [22].
2.6.4. Independent Component Analysis
3. Results and Discussion
The panel de las manos of the cave of El Castillo is possibly one of the most complex among Paleolithic art in general. The use of different techniques and colorants allowed us to establish differences between groups and help us understand the chronostylistic evolution based on superpositions of figures. It has been studied repeatedly by many researchers since 1911 [13,14,15,16,17,18].
This study was carried out on the panel as a whole; the archaeological interpretation was made by Ripoll [19]. The present study shows three areas of special interest and the hand analysis of the whole panel (Figure 5).
3.1. Working Area 1
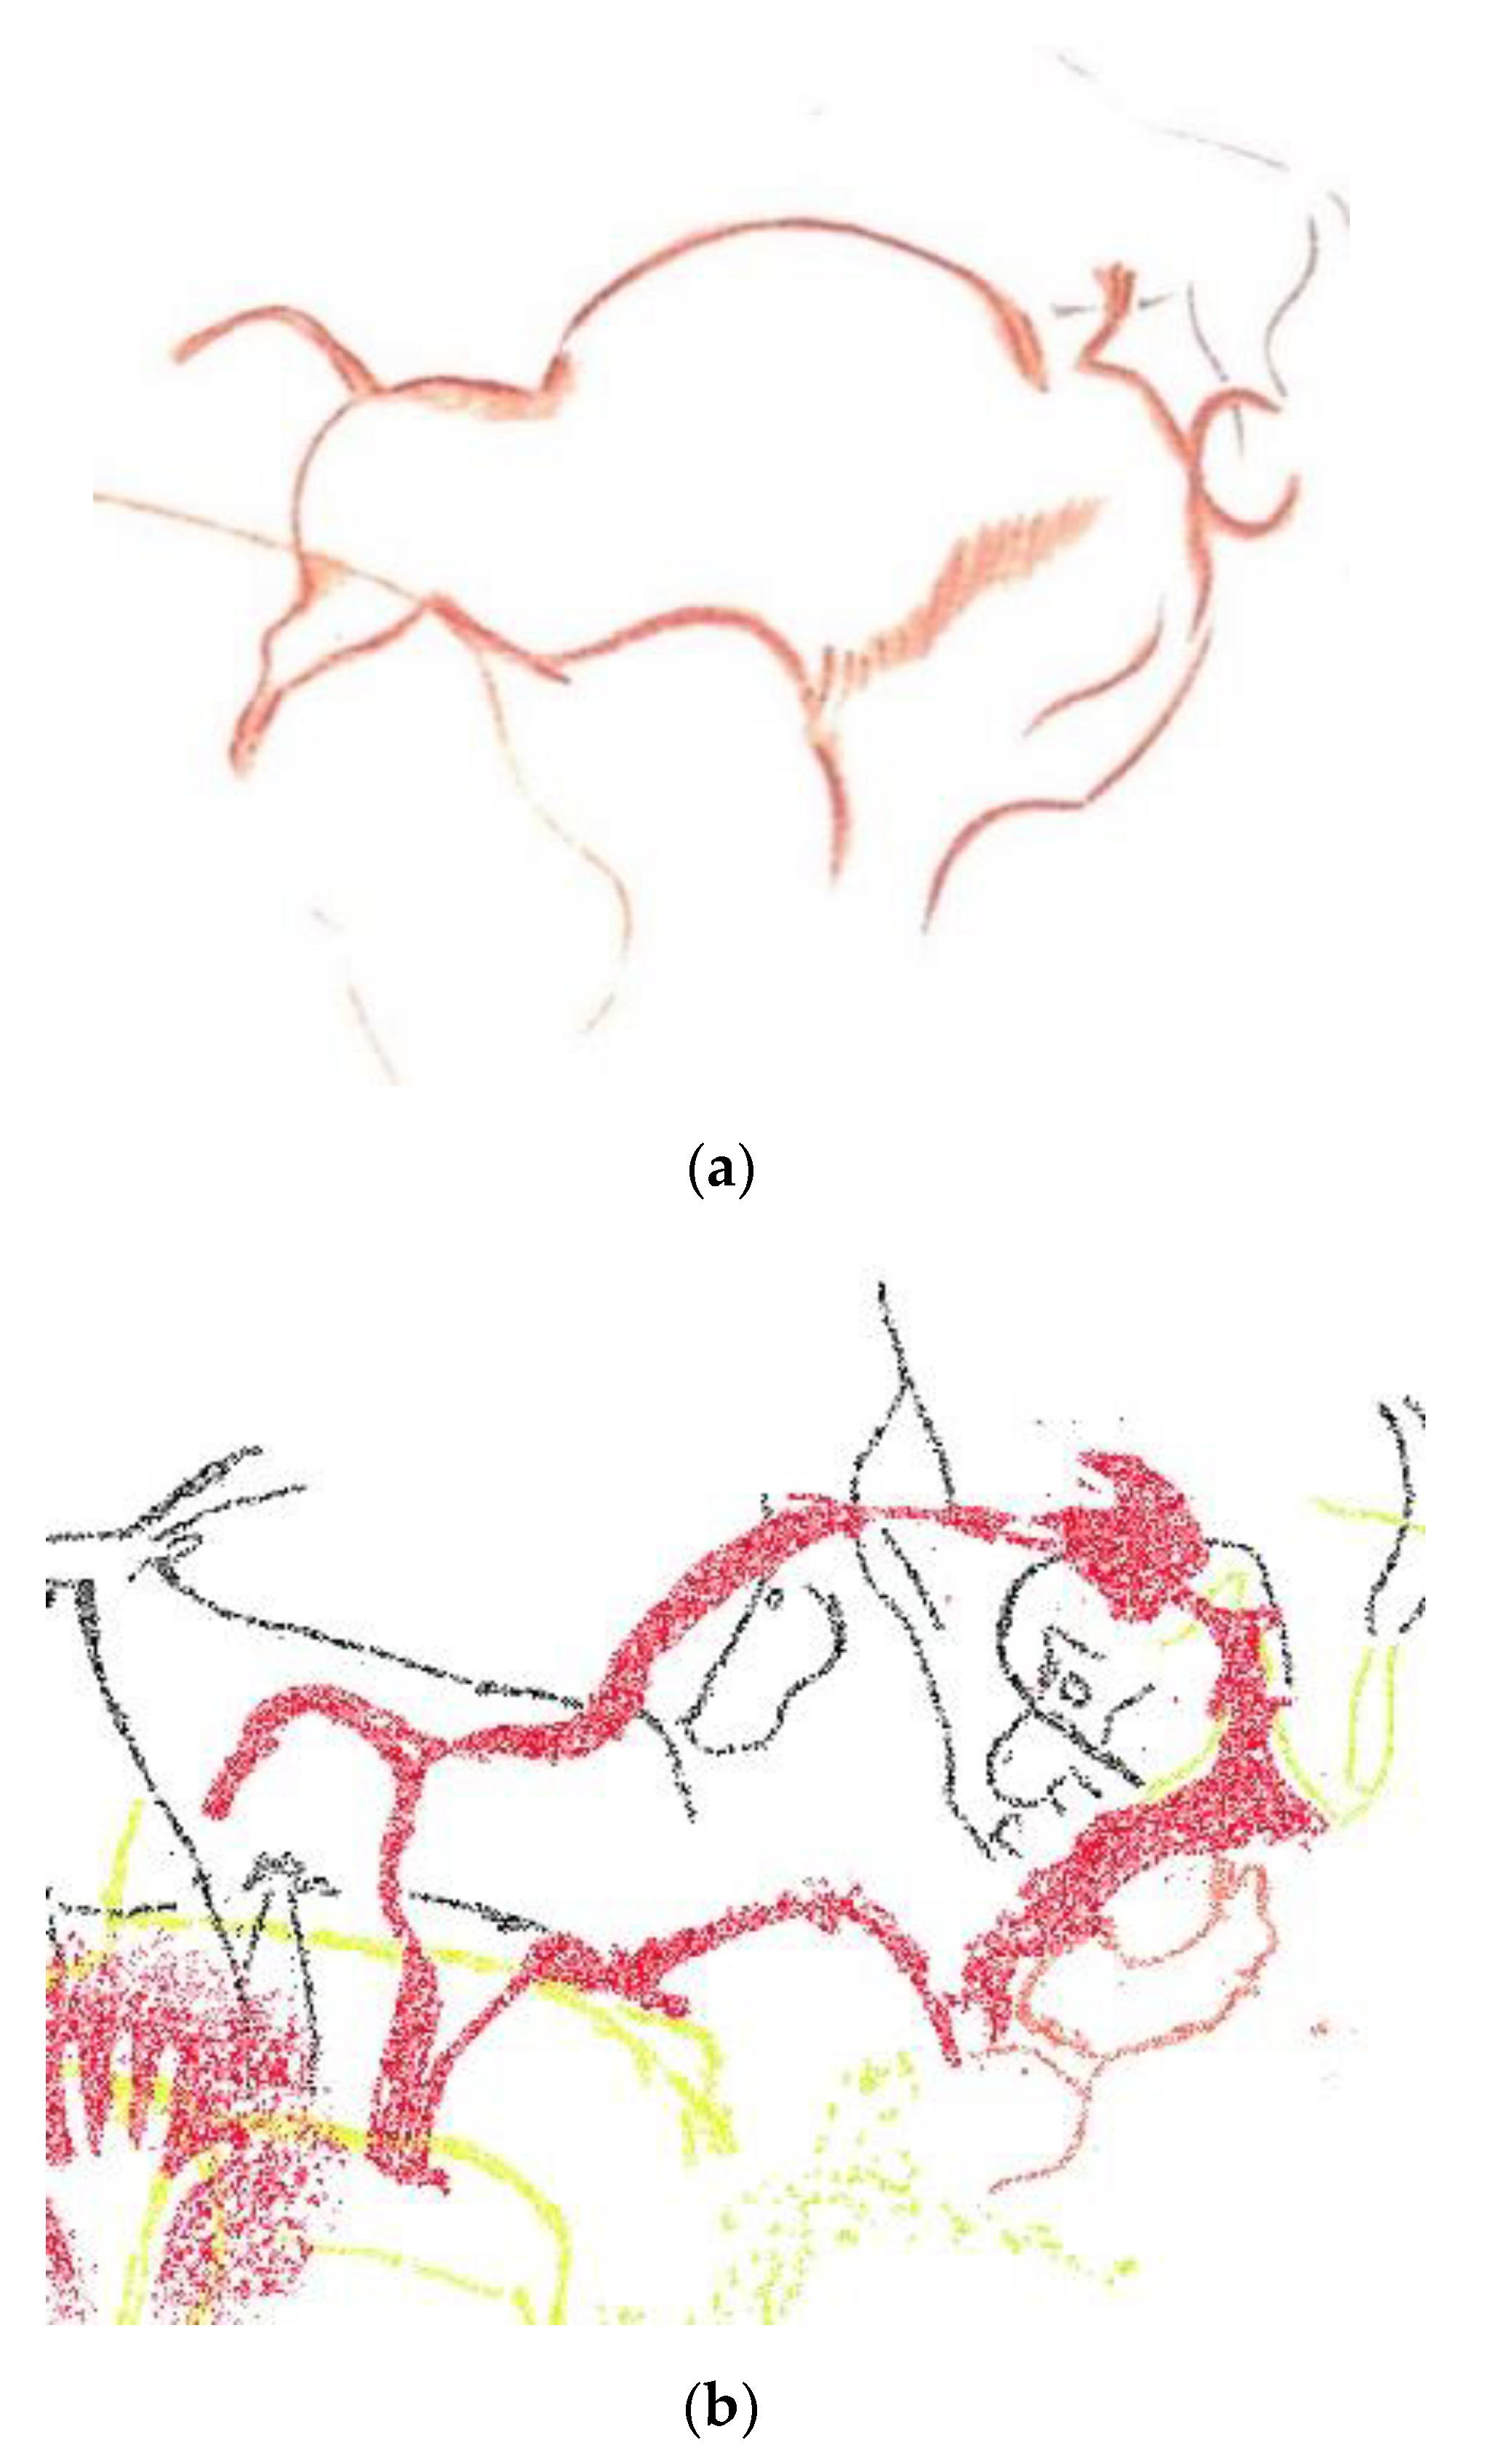
This area consists of a red bison figure, made of iron oxide with black graphite remains of old graffiti, which was cleaned in the 1960s (Figure 6).
After applying the workflow, the following can be concluded:
1. Thanks to enhanced visualization algorithms, it was possible to recover the processes of cleaning of superpositions and observe graffiti that had been previously eliminated (Figure 7), so that visitors can have a more real perception of the prehistoric images. In the same way, this information allowed us to document the surfaces of the Paleolithic images that were affected by cleaning. This appeared in both MNF and ICA transforms.
2. Spectral differentiation according to the different mineralogical compositions of the pigments was possible, possibly associated with repainting. Figure 8a shows ochre remains of a bison with the same spectral signature as the lower left hand side, while the left image signal shows the same ochre as one of the “yellow” phases between the two hand phases. This allowed us to say that the bison was painted simultaneously with the first hands (Figure 8a) and later repainted with other figures (Figure 8b).
3. When pigment types were isolated, it was possible to recover the pigments; the limits of the contours of the figure were clearly documented, and a formal reconstruction of the motif was carried out depending on the type of pigment, as shown in Figure 9.
3.2. Working Area 2
In this area, two elements were included (Figure 10):
- A rectangular geometric pattern: a yellow drawing of flat ink using iron oxide. The drawn motif was contoured, exceeding the contours of the drawing by means of repeated external contour engraving.
- A complex geometric and linear motif formed by two slightly concave rectangular structures and finished off at the top by small strokes associated with continuous lines. Probably prior to the drawing of the motif, a light layer of red dye was applied to the substrate. The drawn motif was contoured, surpassing and superimposing by means of contour engraving repeated externally to the contours of the drawing.
3.2.1. Element 1
1. A reconstruction of the technical process was possible. The reading of the image allowed us to study in detail the traceability of the lines that compose the figure, which allowed us to approach the analytical reconstruction of the superposition of lines within the same line (Figure 11a).
2. Reconstruction with full sharpness of the delineation of engraved strokes and consequently of the engraving was possible (Figure 11b).
3. Recovery of the pigments: the limits of the contours of the figure were clearly documented and a formal reconstruction of the motif was carried out.
Study of the execution process: superpositions between figures were observed, which allowed reconstruction of the stratigraphy and the process of adding motifs (Figure 12).
3.2.2. Element 2
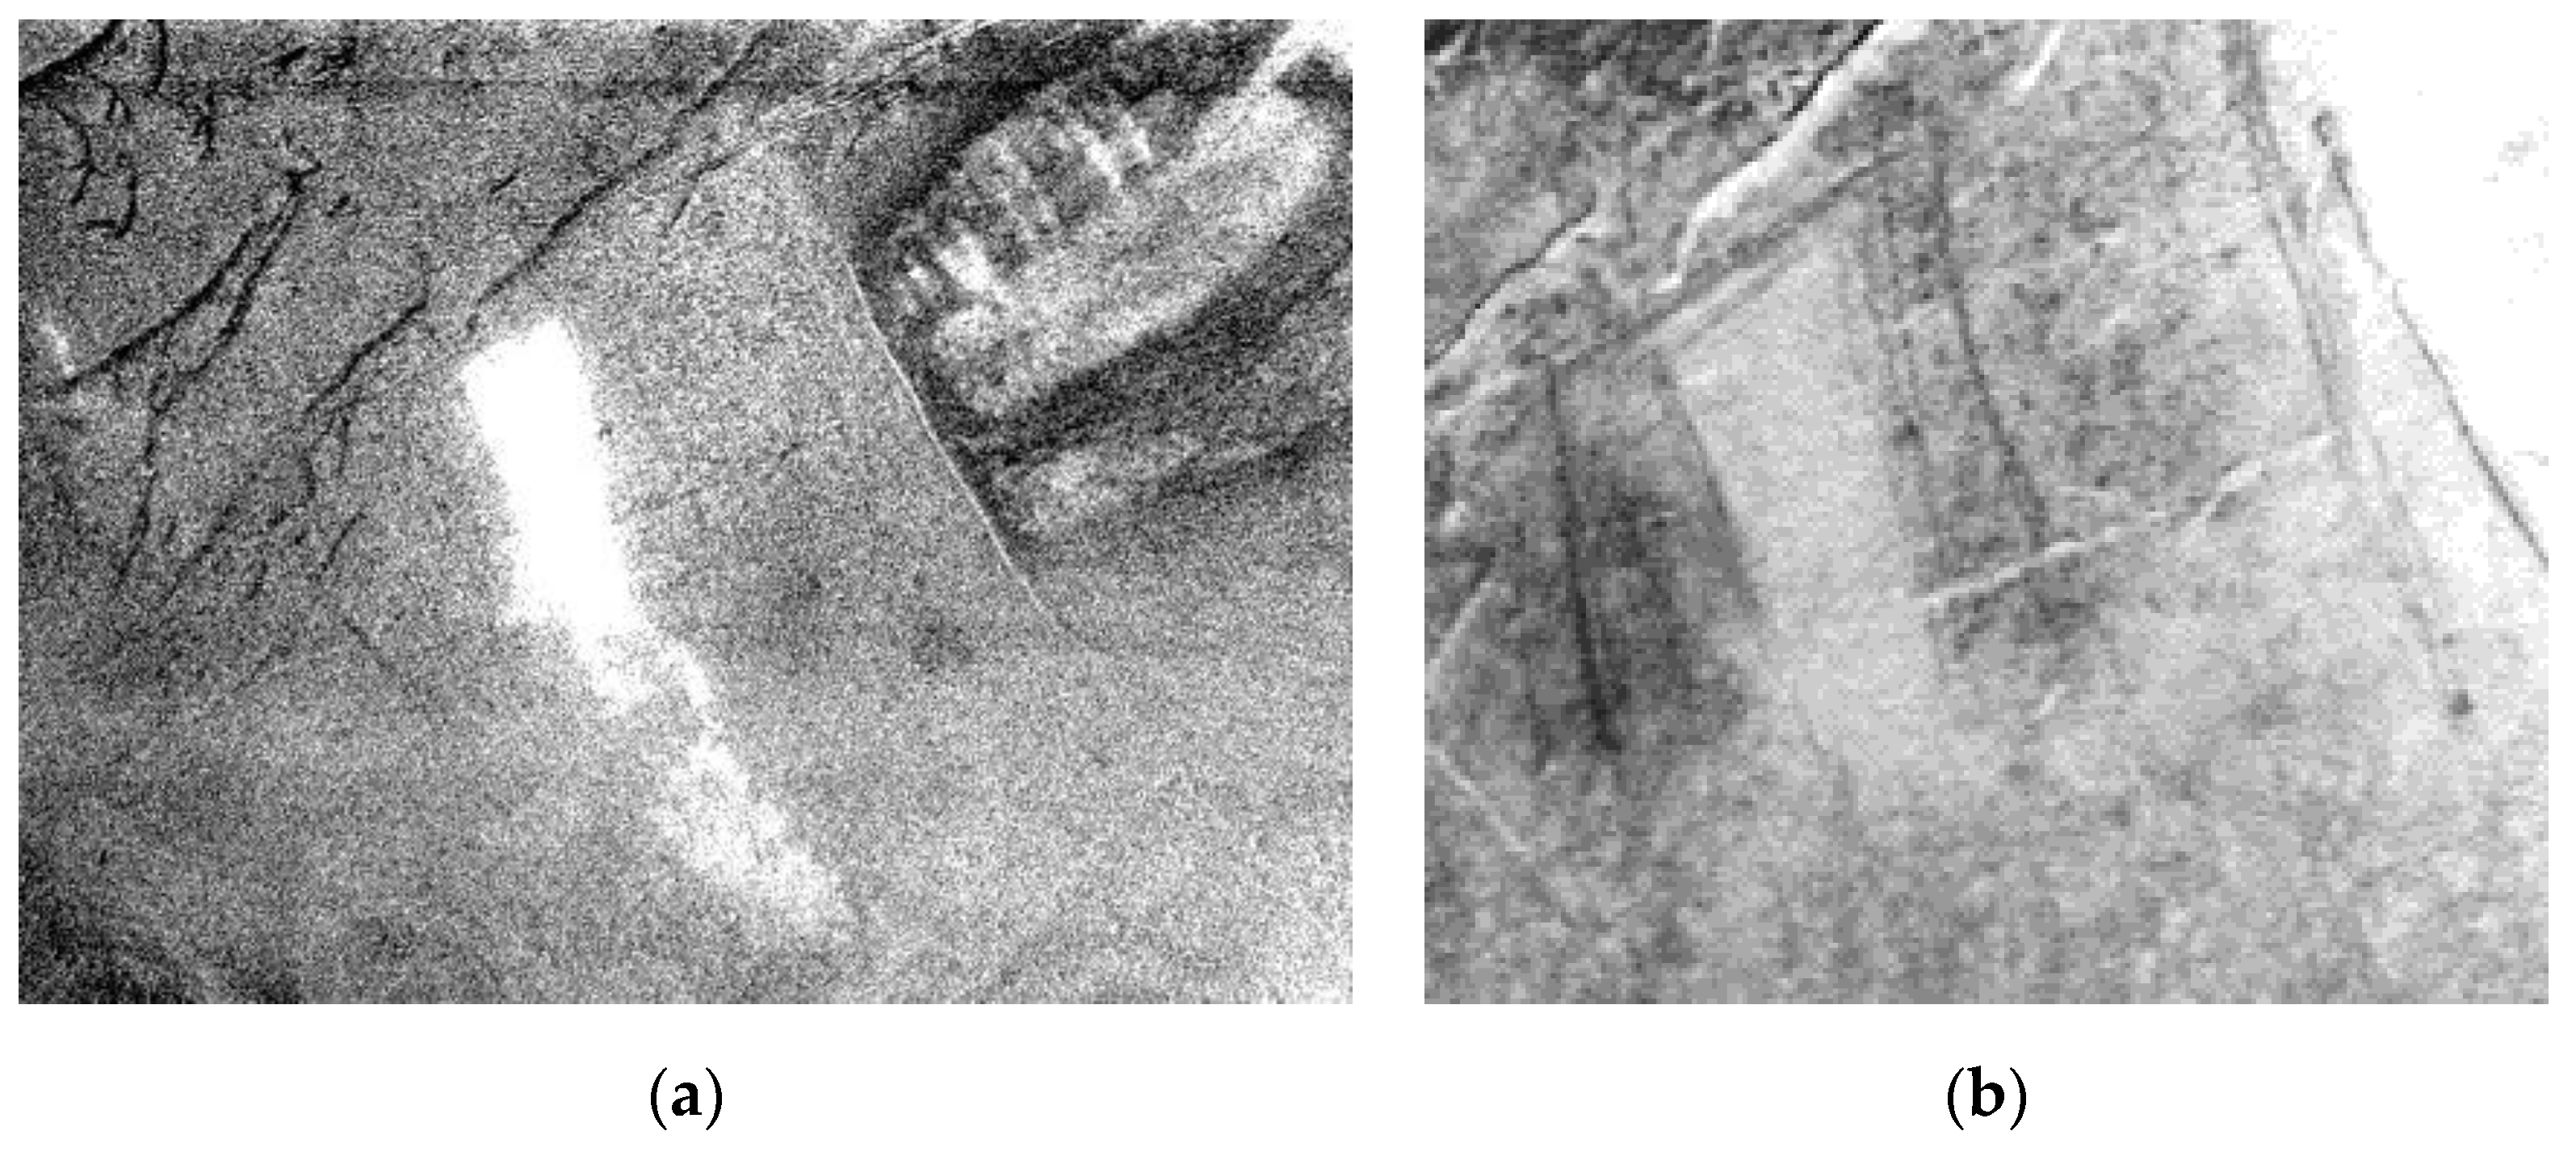
4. Reconstruction of the technical process: the reading of the image made it possible to identify the possible existence of a layer of “plaster” (Figure 13a) prior to the drawing of the rectangular shapes, which made it possible to approach the graphic process.
5. Reconstruction with full sharpness of the delineation of engraved strokes and consequently of the engraving was possible.
6. Study of the execution process: in both images superpositions between figures were observed, which allowed reconstruction of the stratigraphy and the process of adding motifs.
7. Precise formal identification: the limits of the contours of the figure were clearly documented and a formal reconstruction of the motif was carried out (Figure 13b).
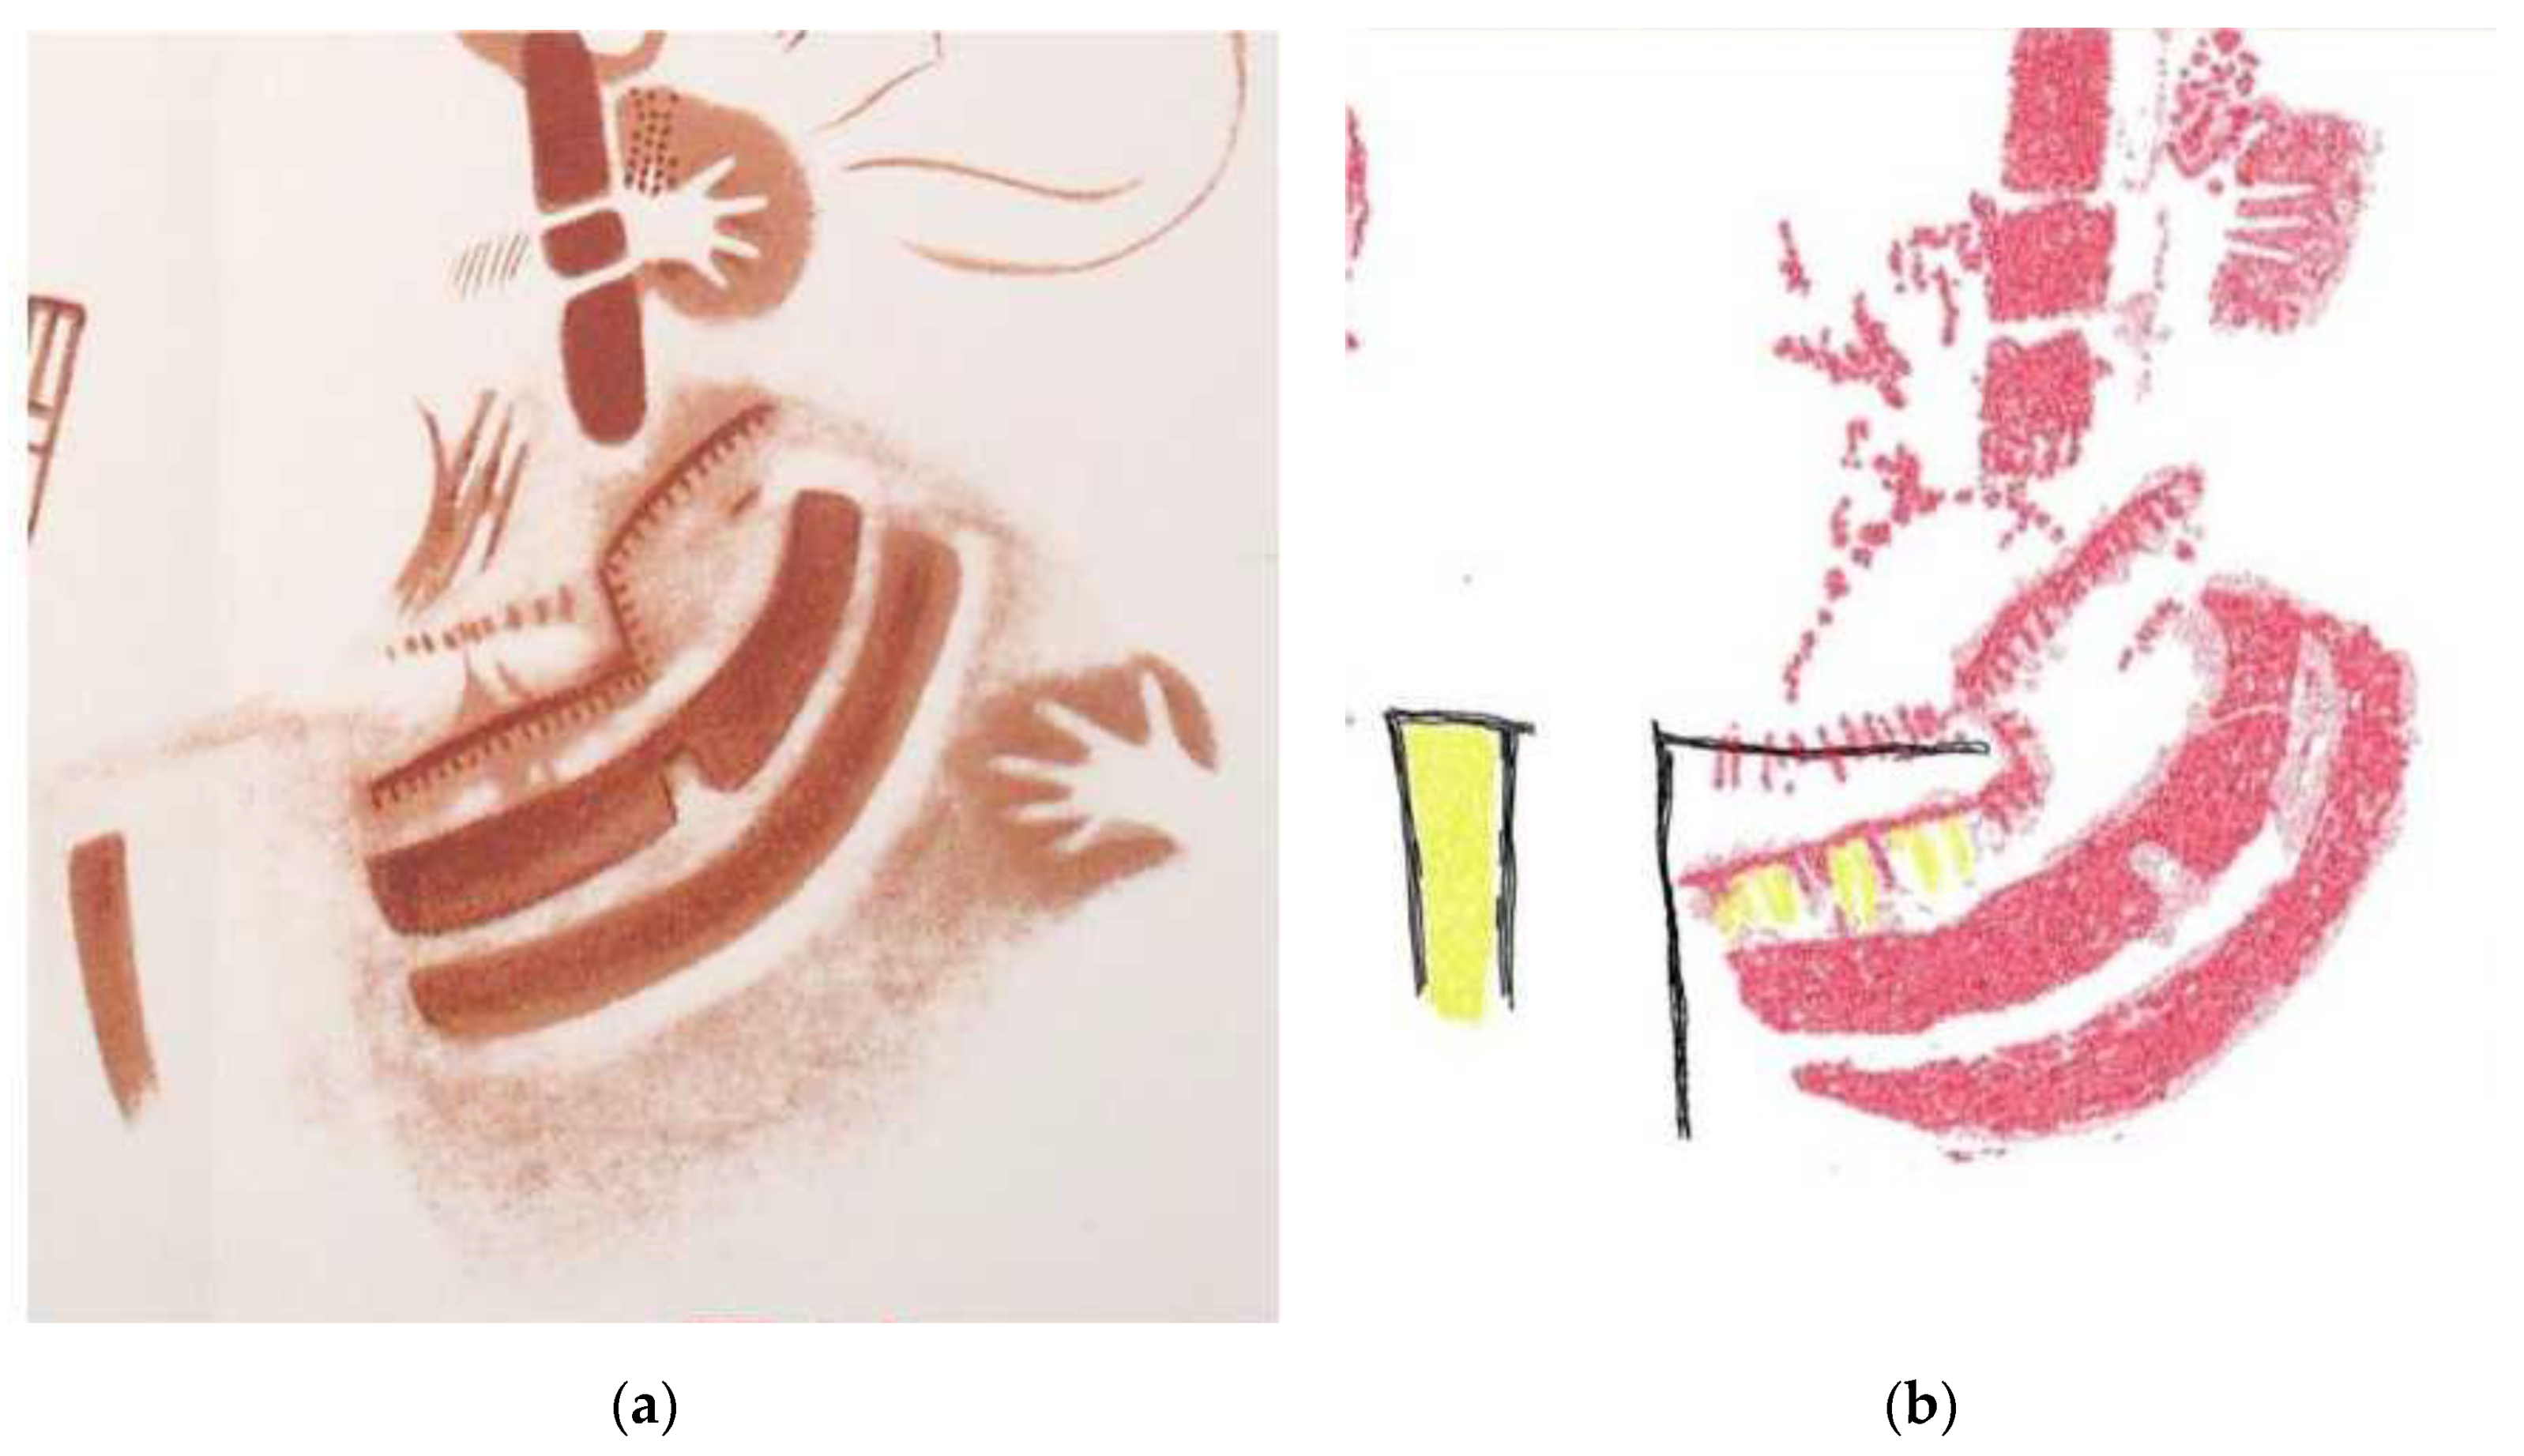
8. Isolation of spectrally different pigments: Figure 14a shows (in black) coloring matter with different mineralogical composition that belongs to element 1 inside the motif. It was detected that the same pigments used in element 1 were used for eight strokes in element 2 of the panel, which were hardly perceptible to the naked eye (Figure 14b).
3.3. Working Area 3
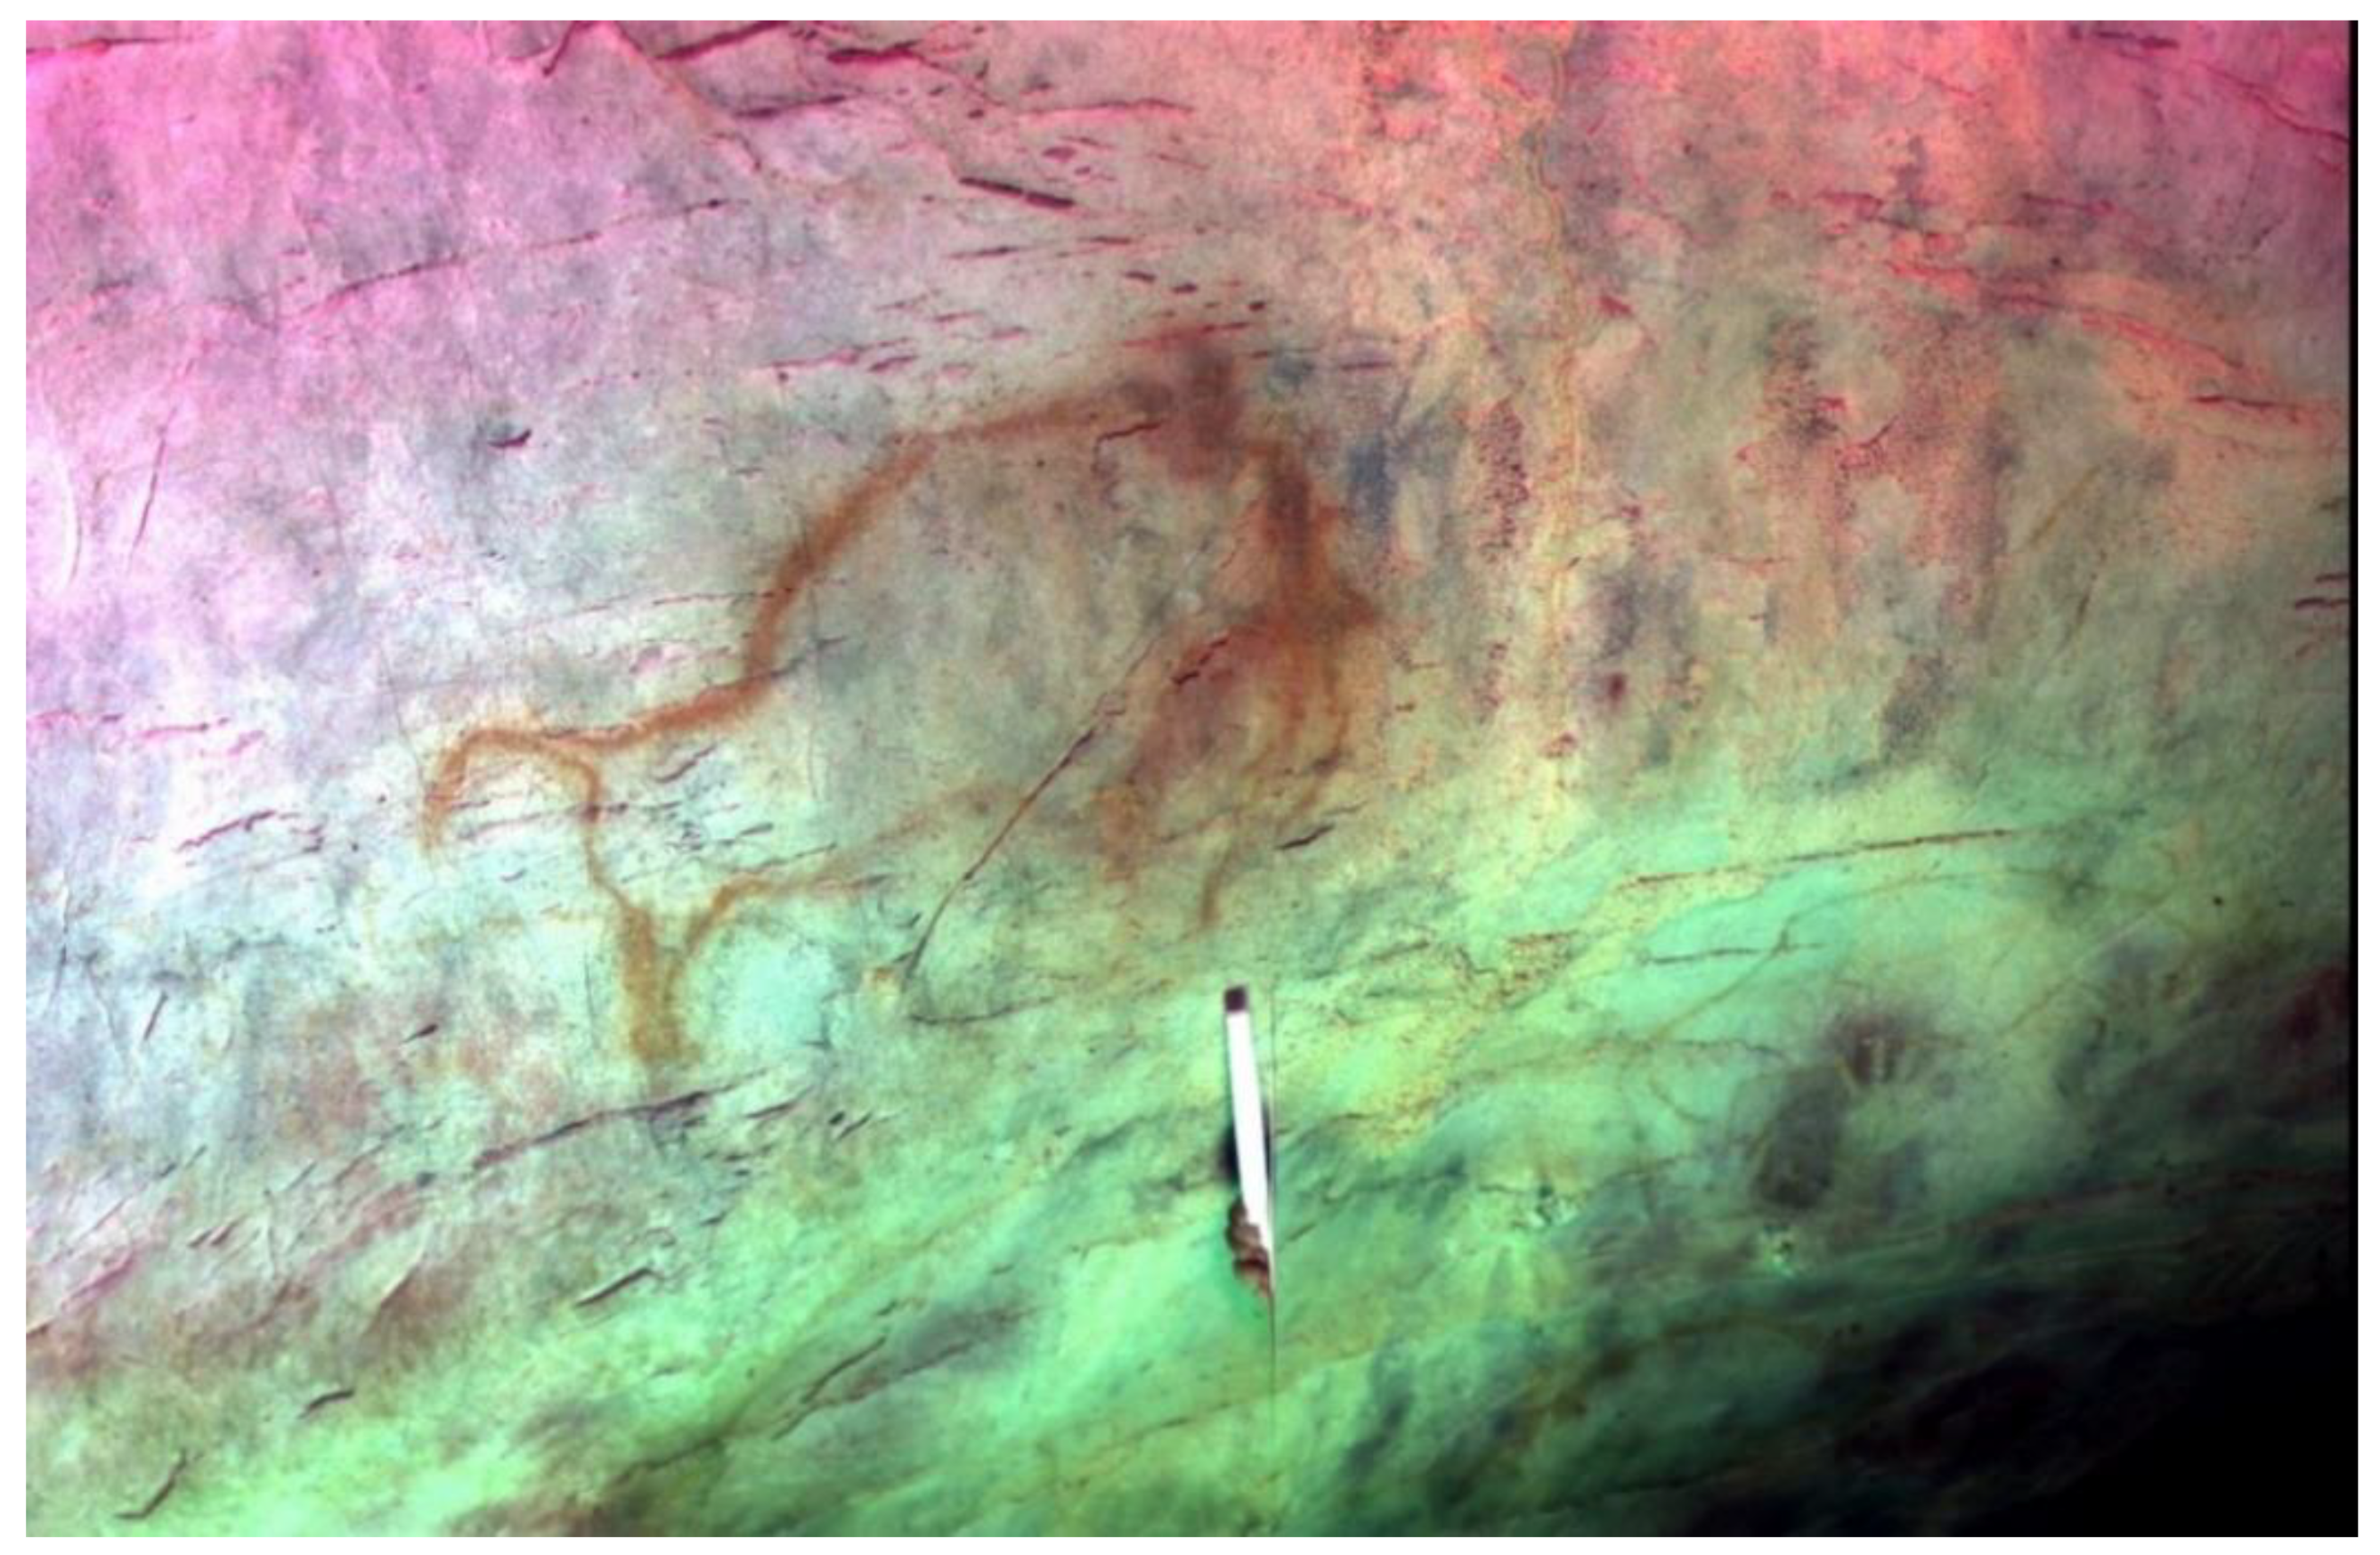
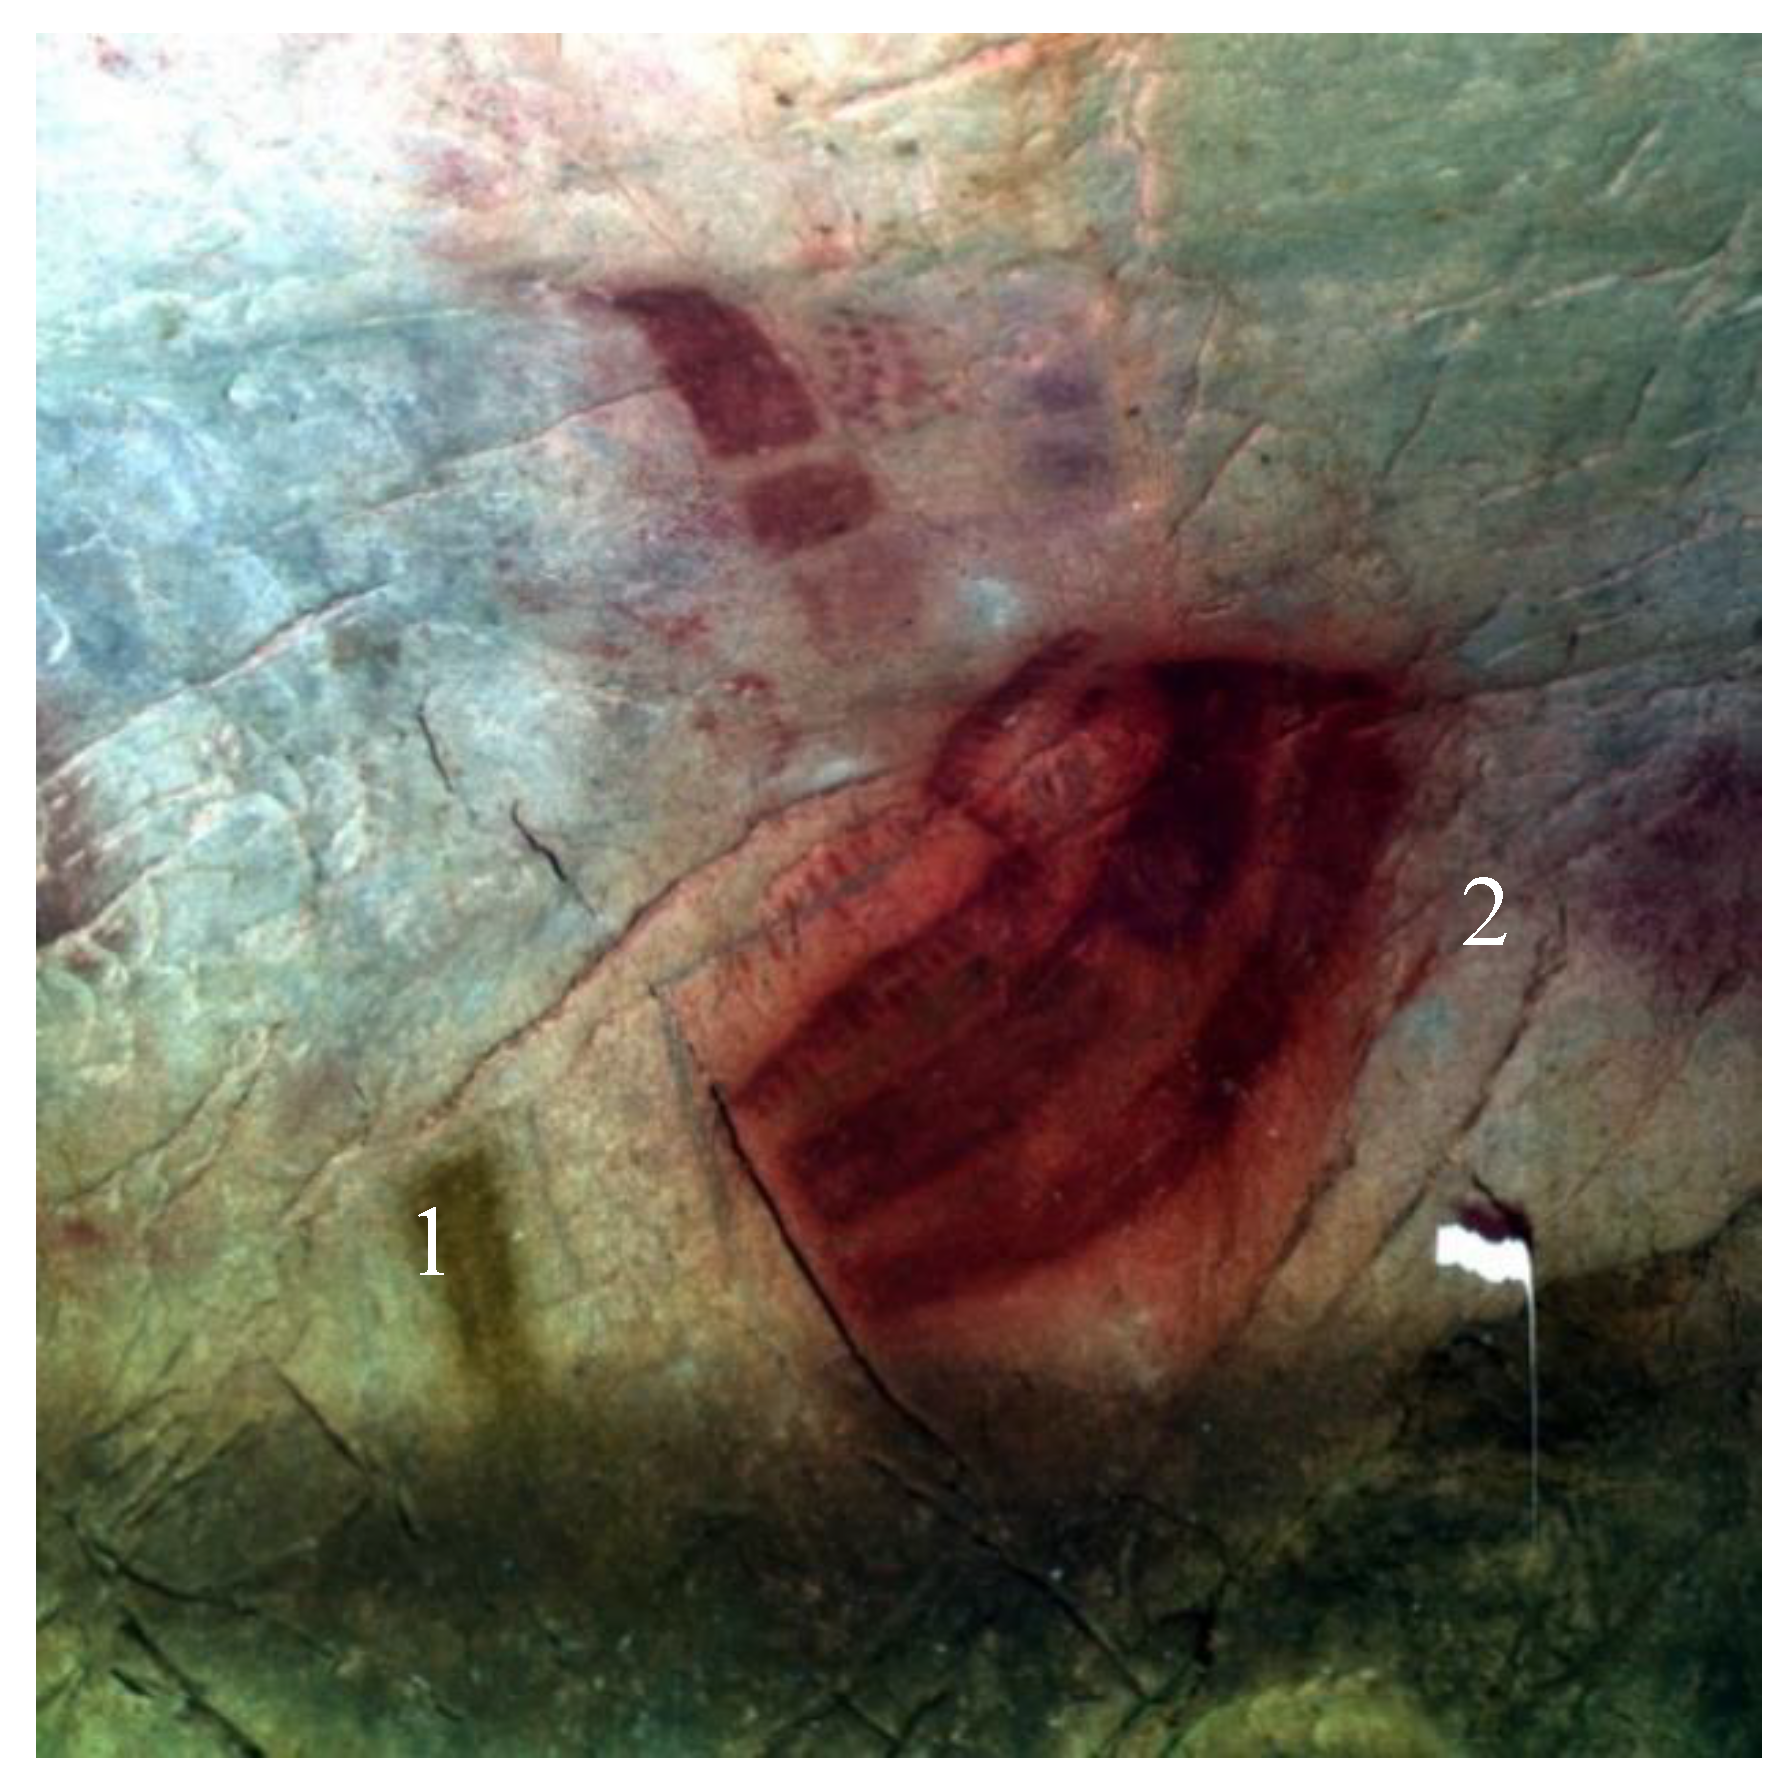
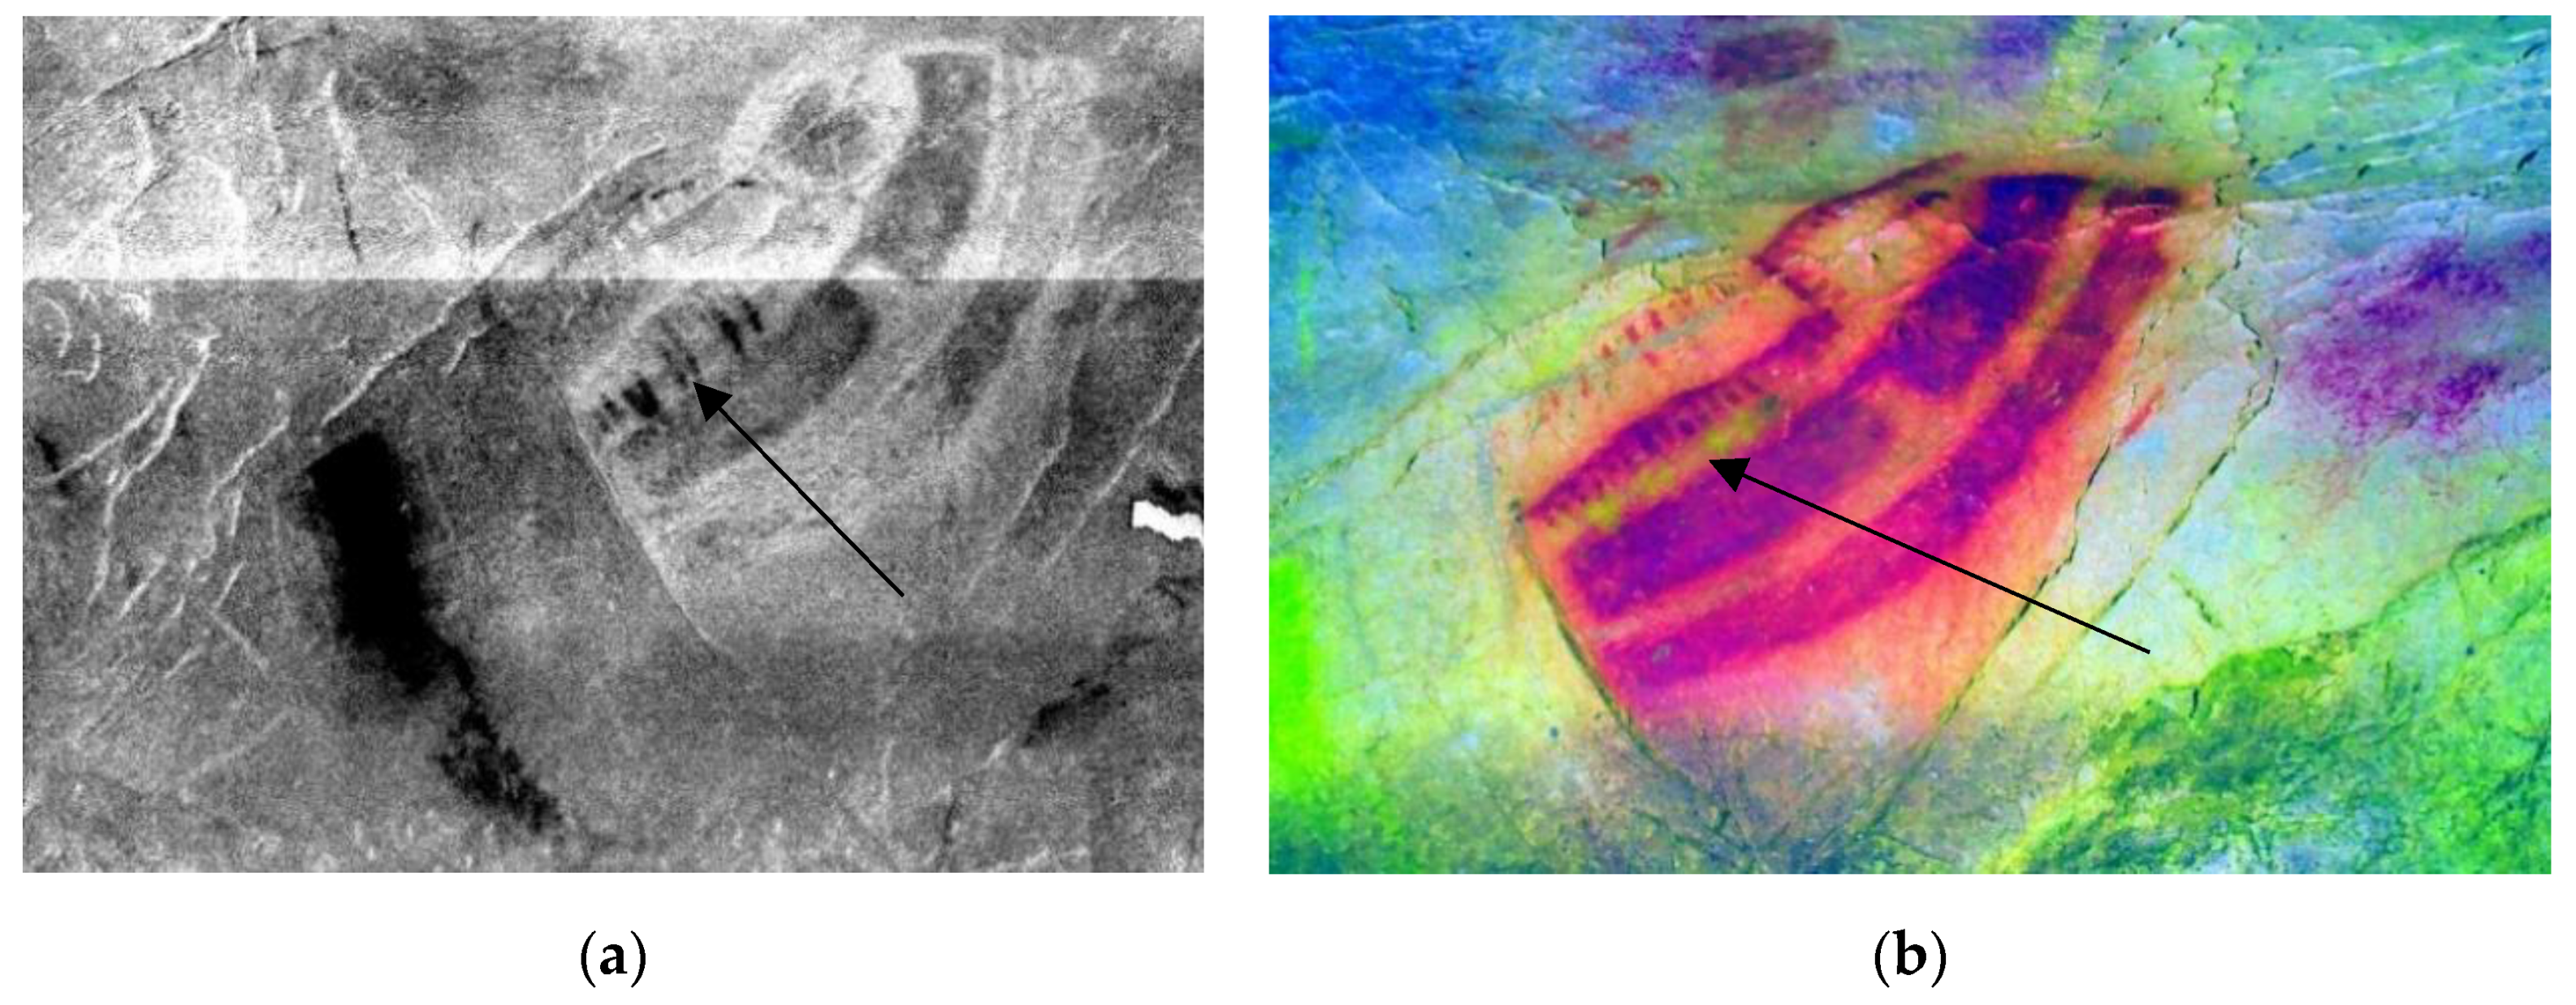
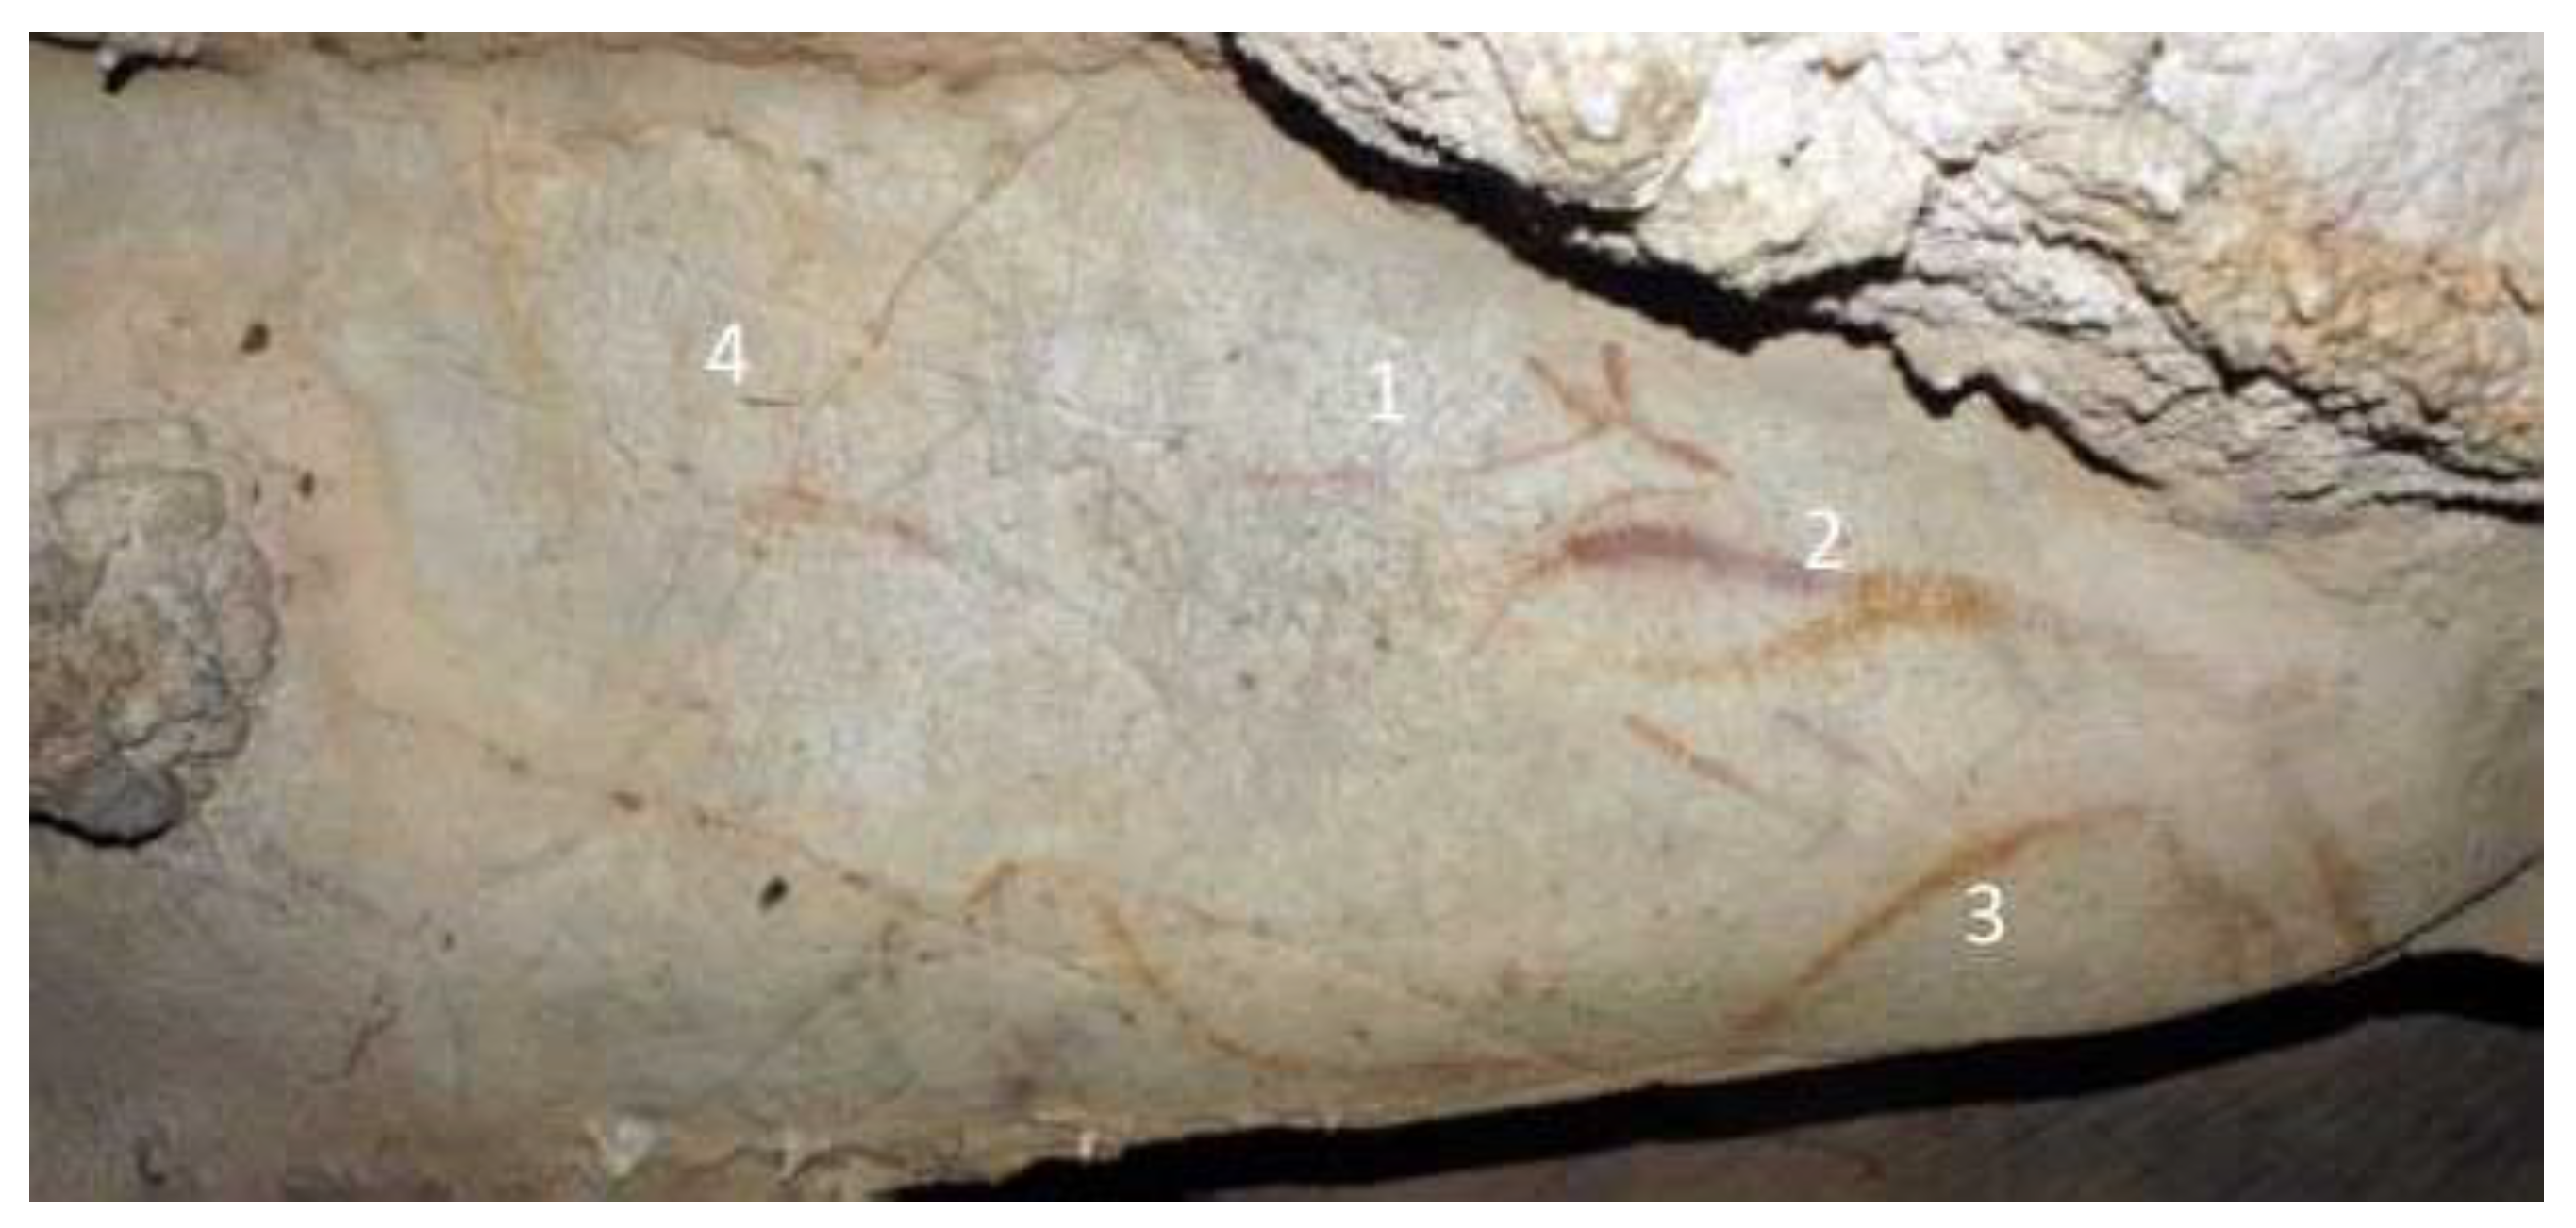
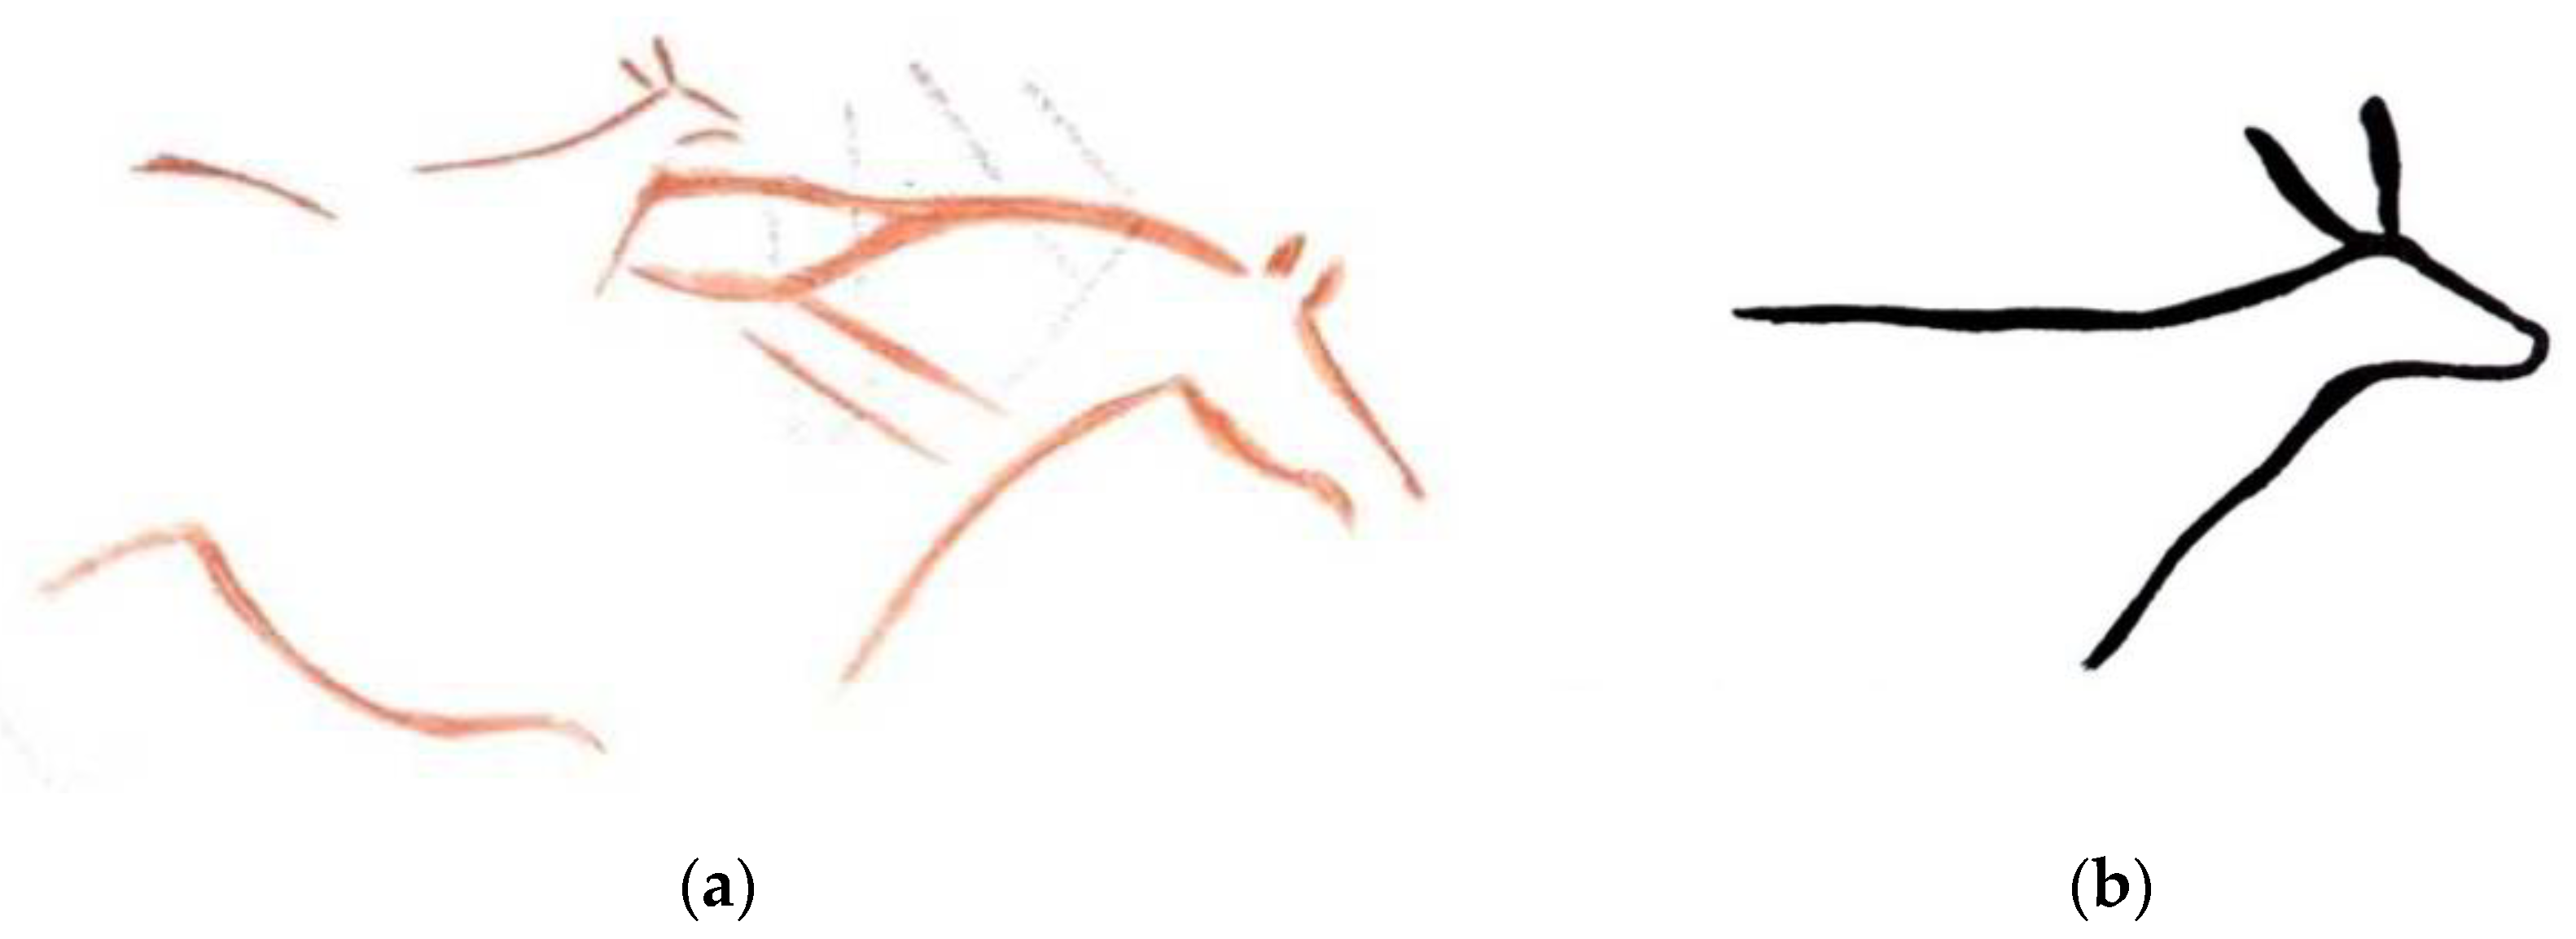
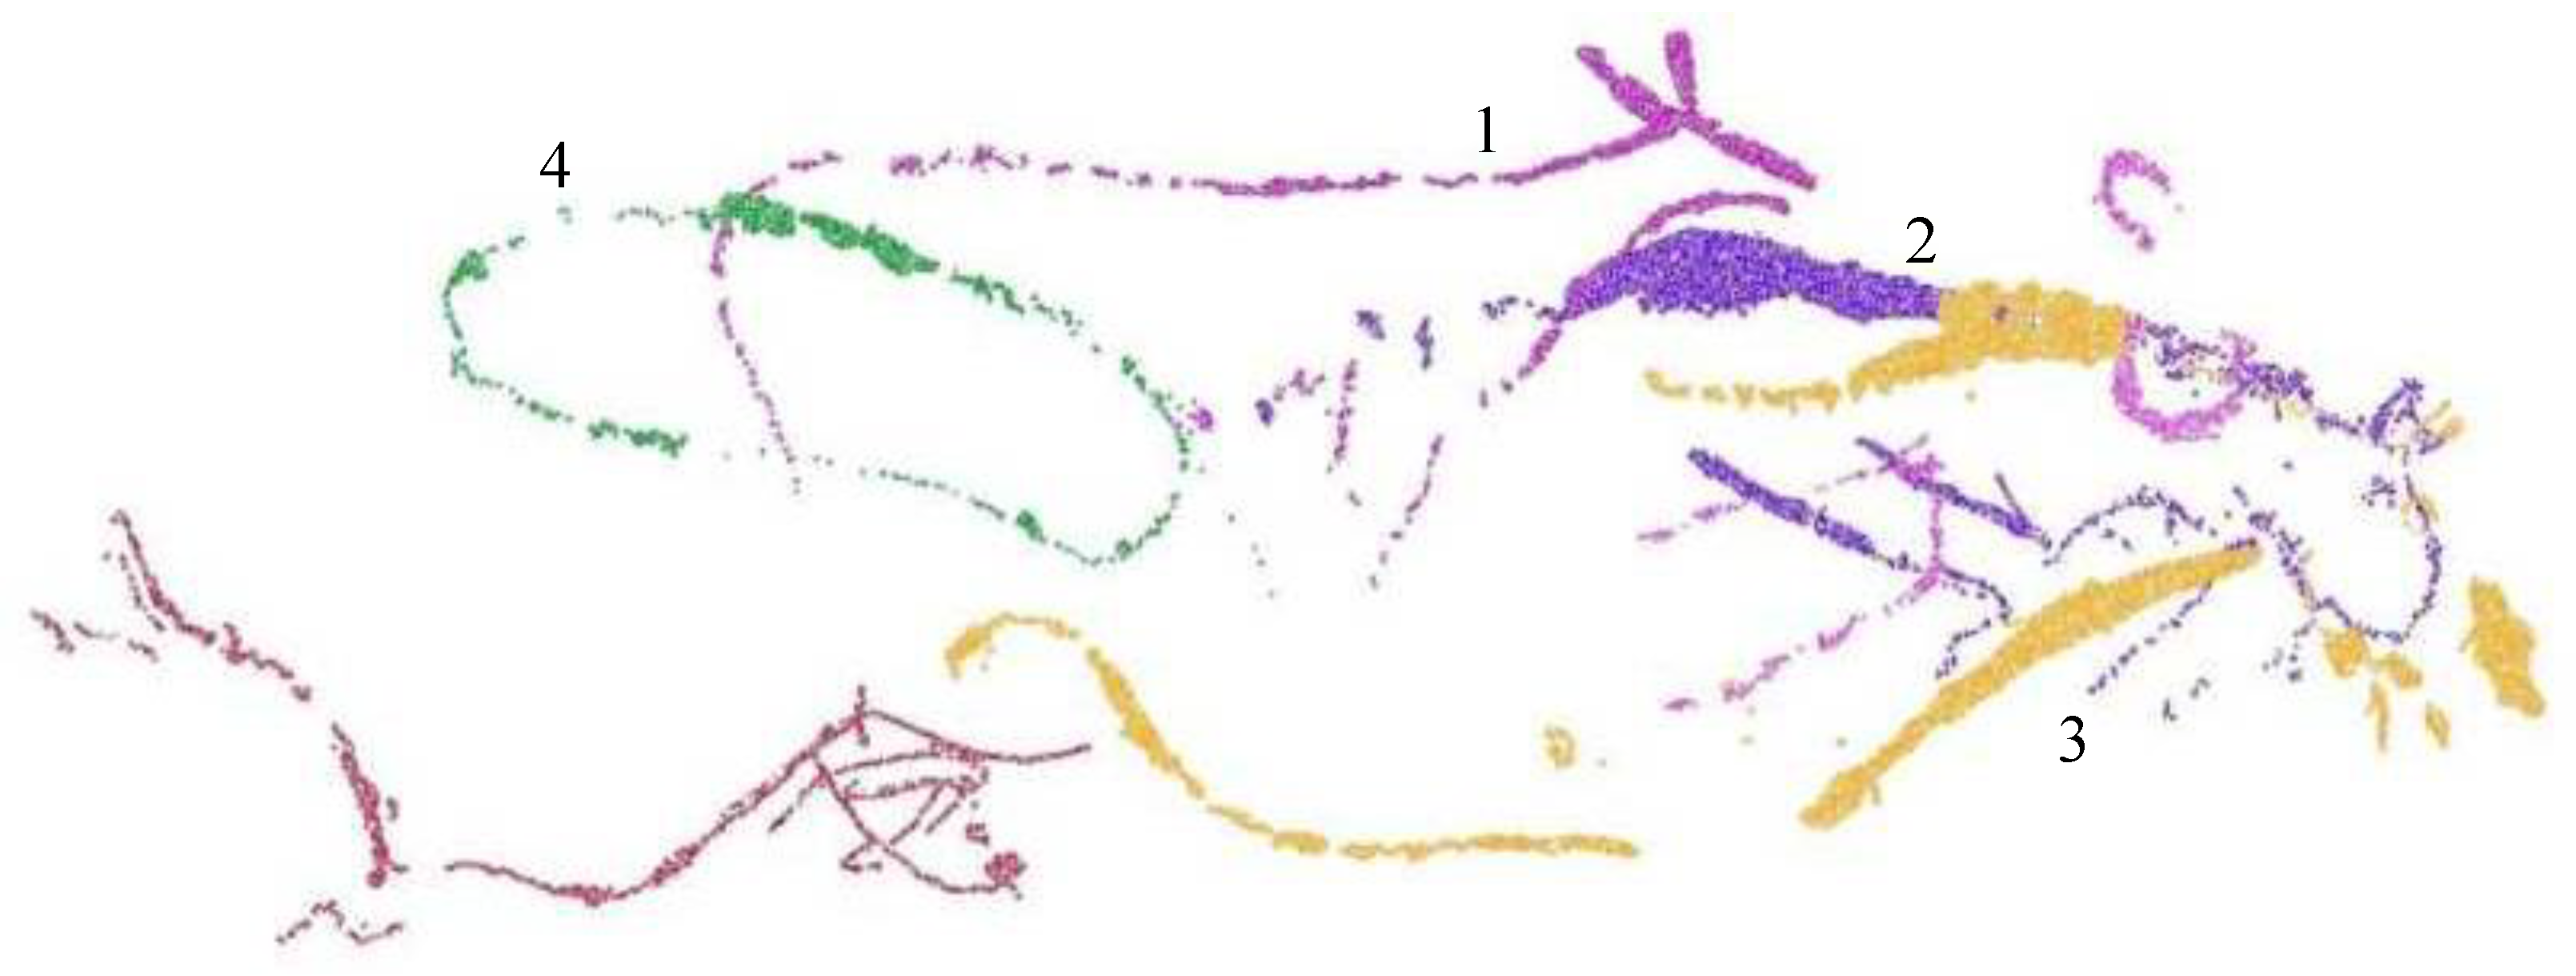
In this panel (Figure 15), above the back of the horse (point 3 in the figure) there is a small figure of a red female deer (1), incomplete and oriented to the right like the horse, with whose back it coincides. There is also a small horse infraposed (2) with the most evident yellow equine. It has a smaller size and is oriented to the right, although the anterior part practically coincides with the infraposition. On the left side there is a single tectiform in the shape of a slightly curved rectangle (4). The support has a very low degree of humidity, and the front part of the animal (especially the head) has a calcite coating. There is a yellow drawing of continuous tracing by means of iron oxide.
After applying the workflow, the following was concluded:
- Areas affected by calcite coating due to lower signal strength were identified.
- Recovery of the pigments: the limits of the contours of the figure were clearly documented and a formal reconstruction of the motif was carried out.
- Study of the execution process: in both images, superpositions between figures were observed, which allowed reconstruction of the stratigraphy and the process of adding motifs.
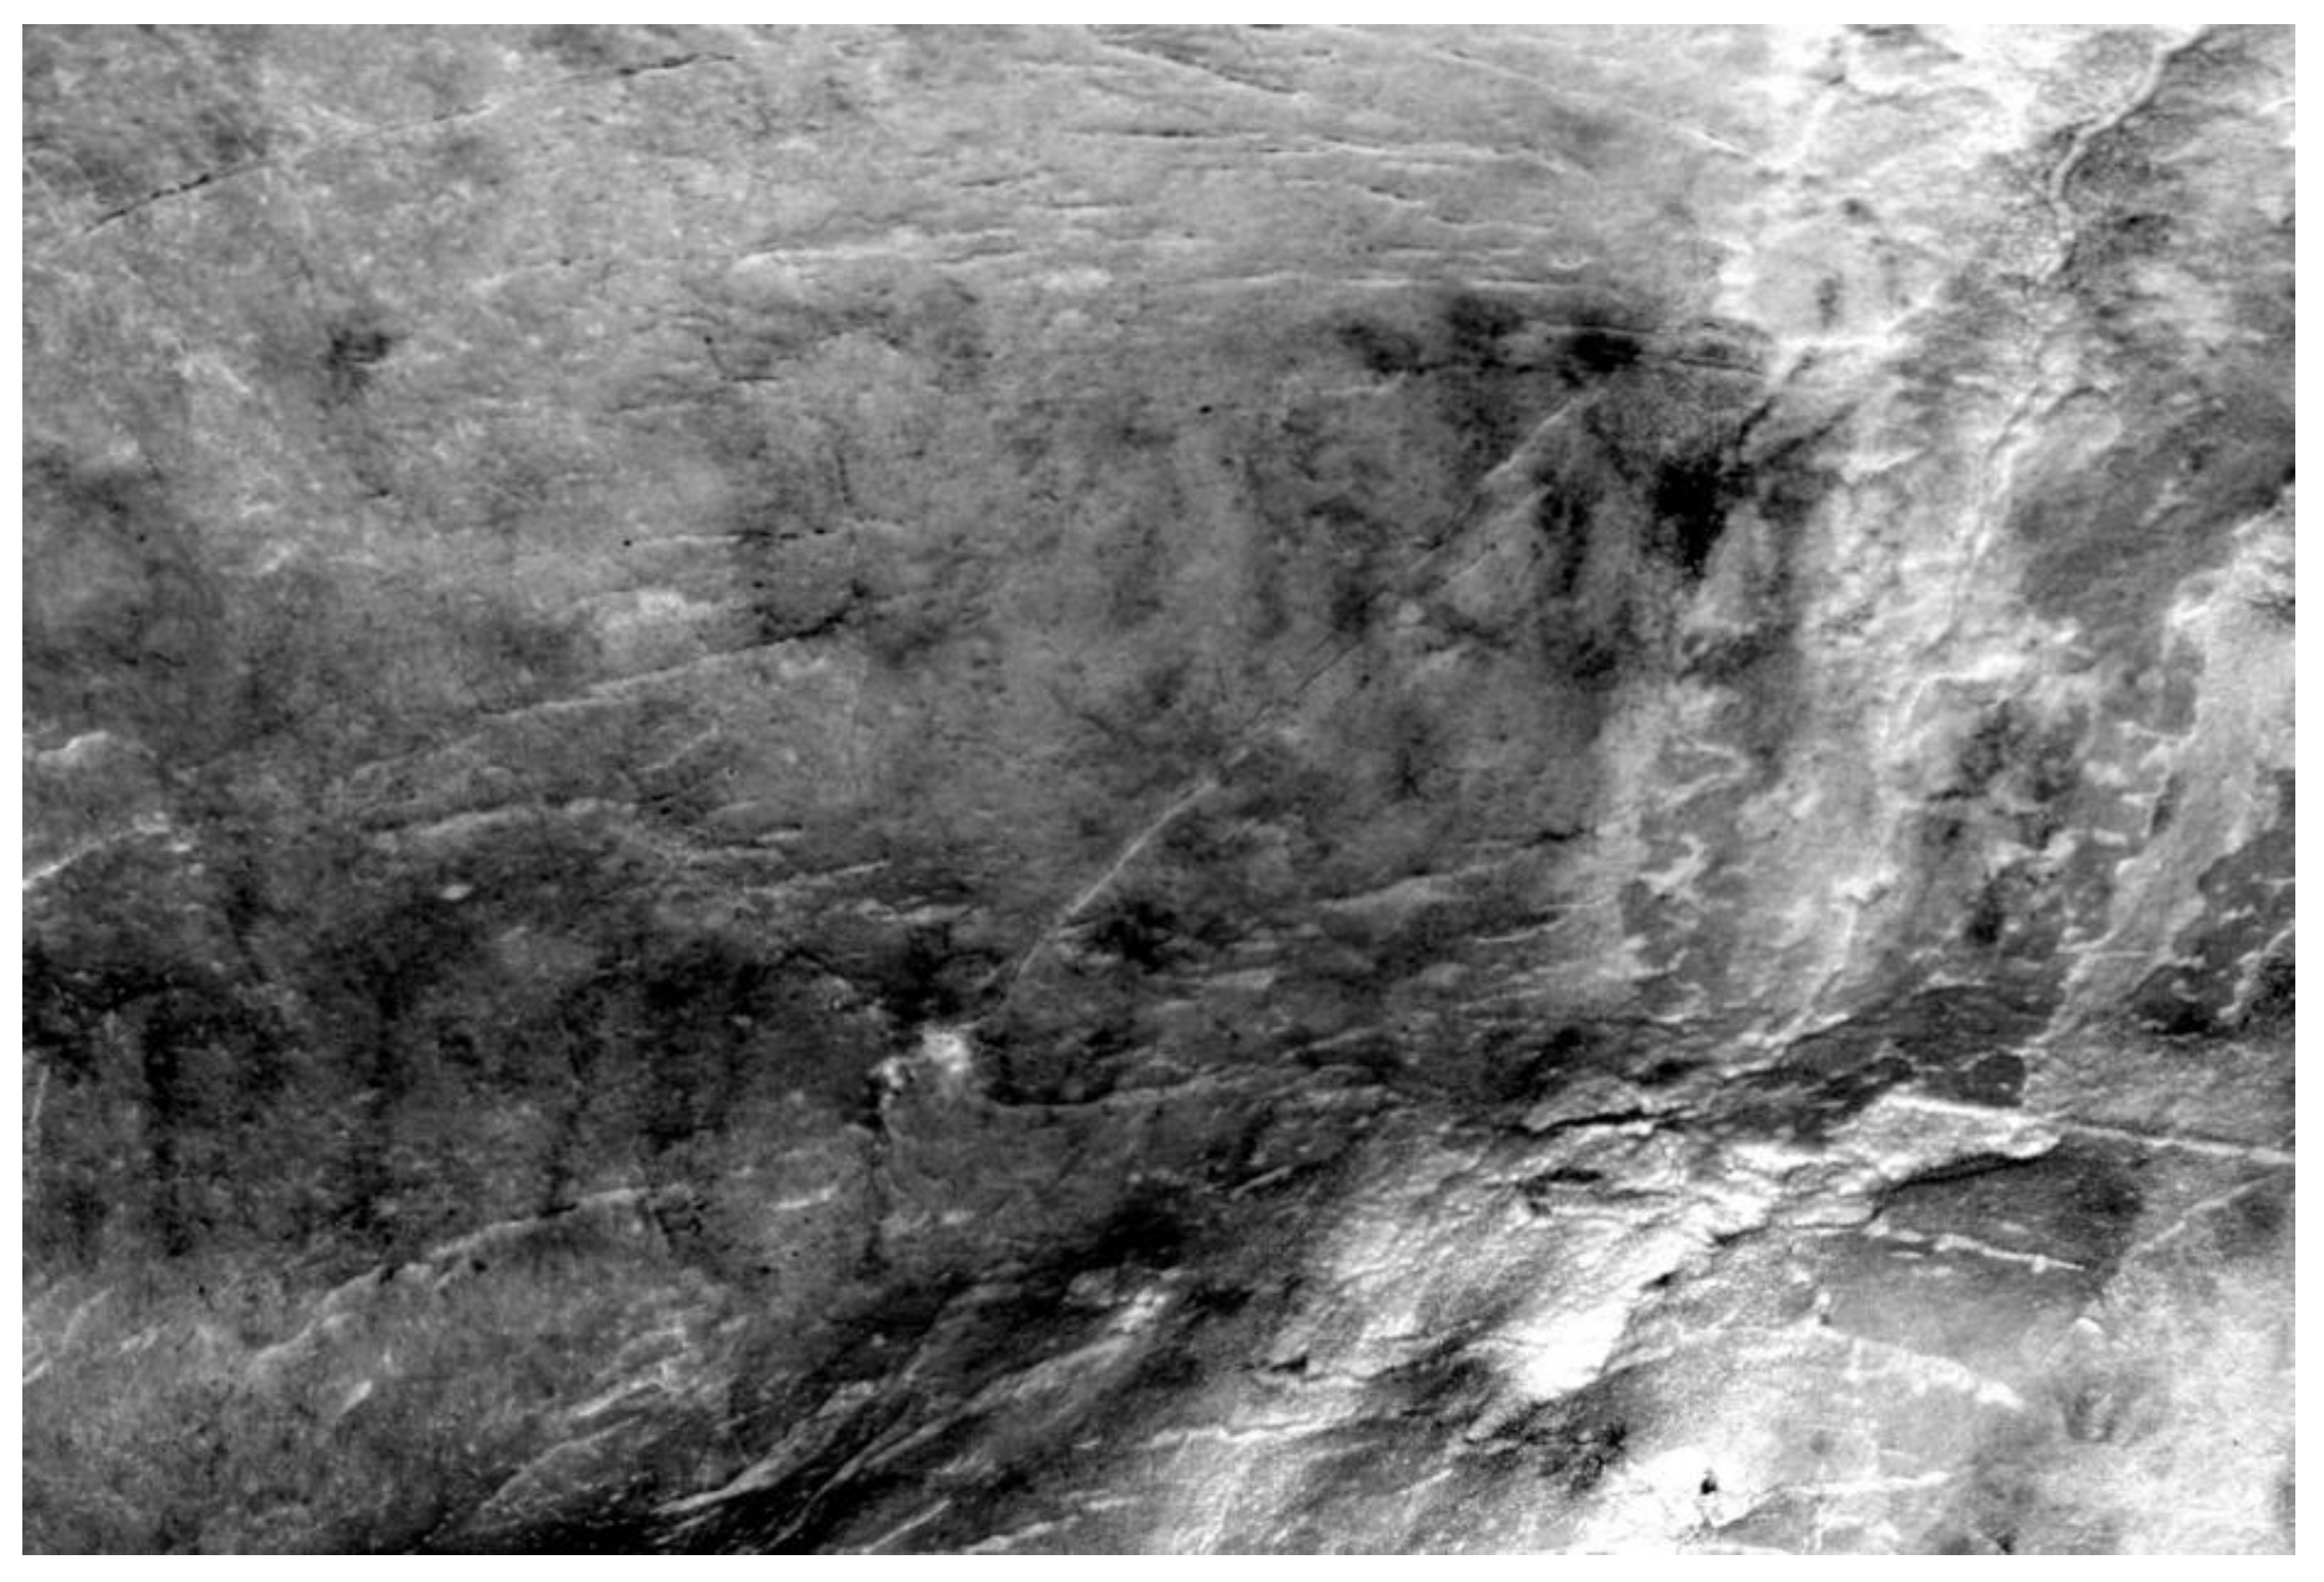
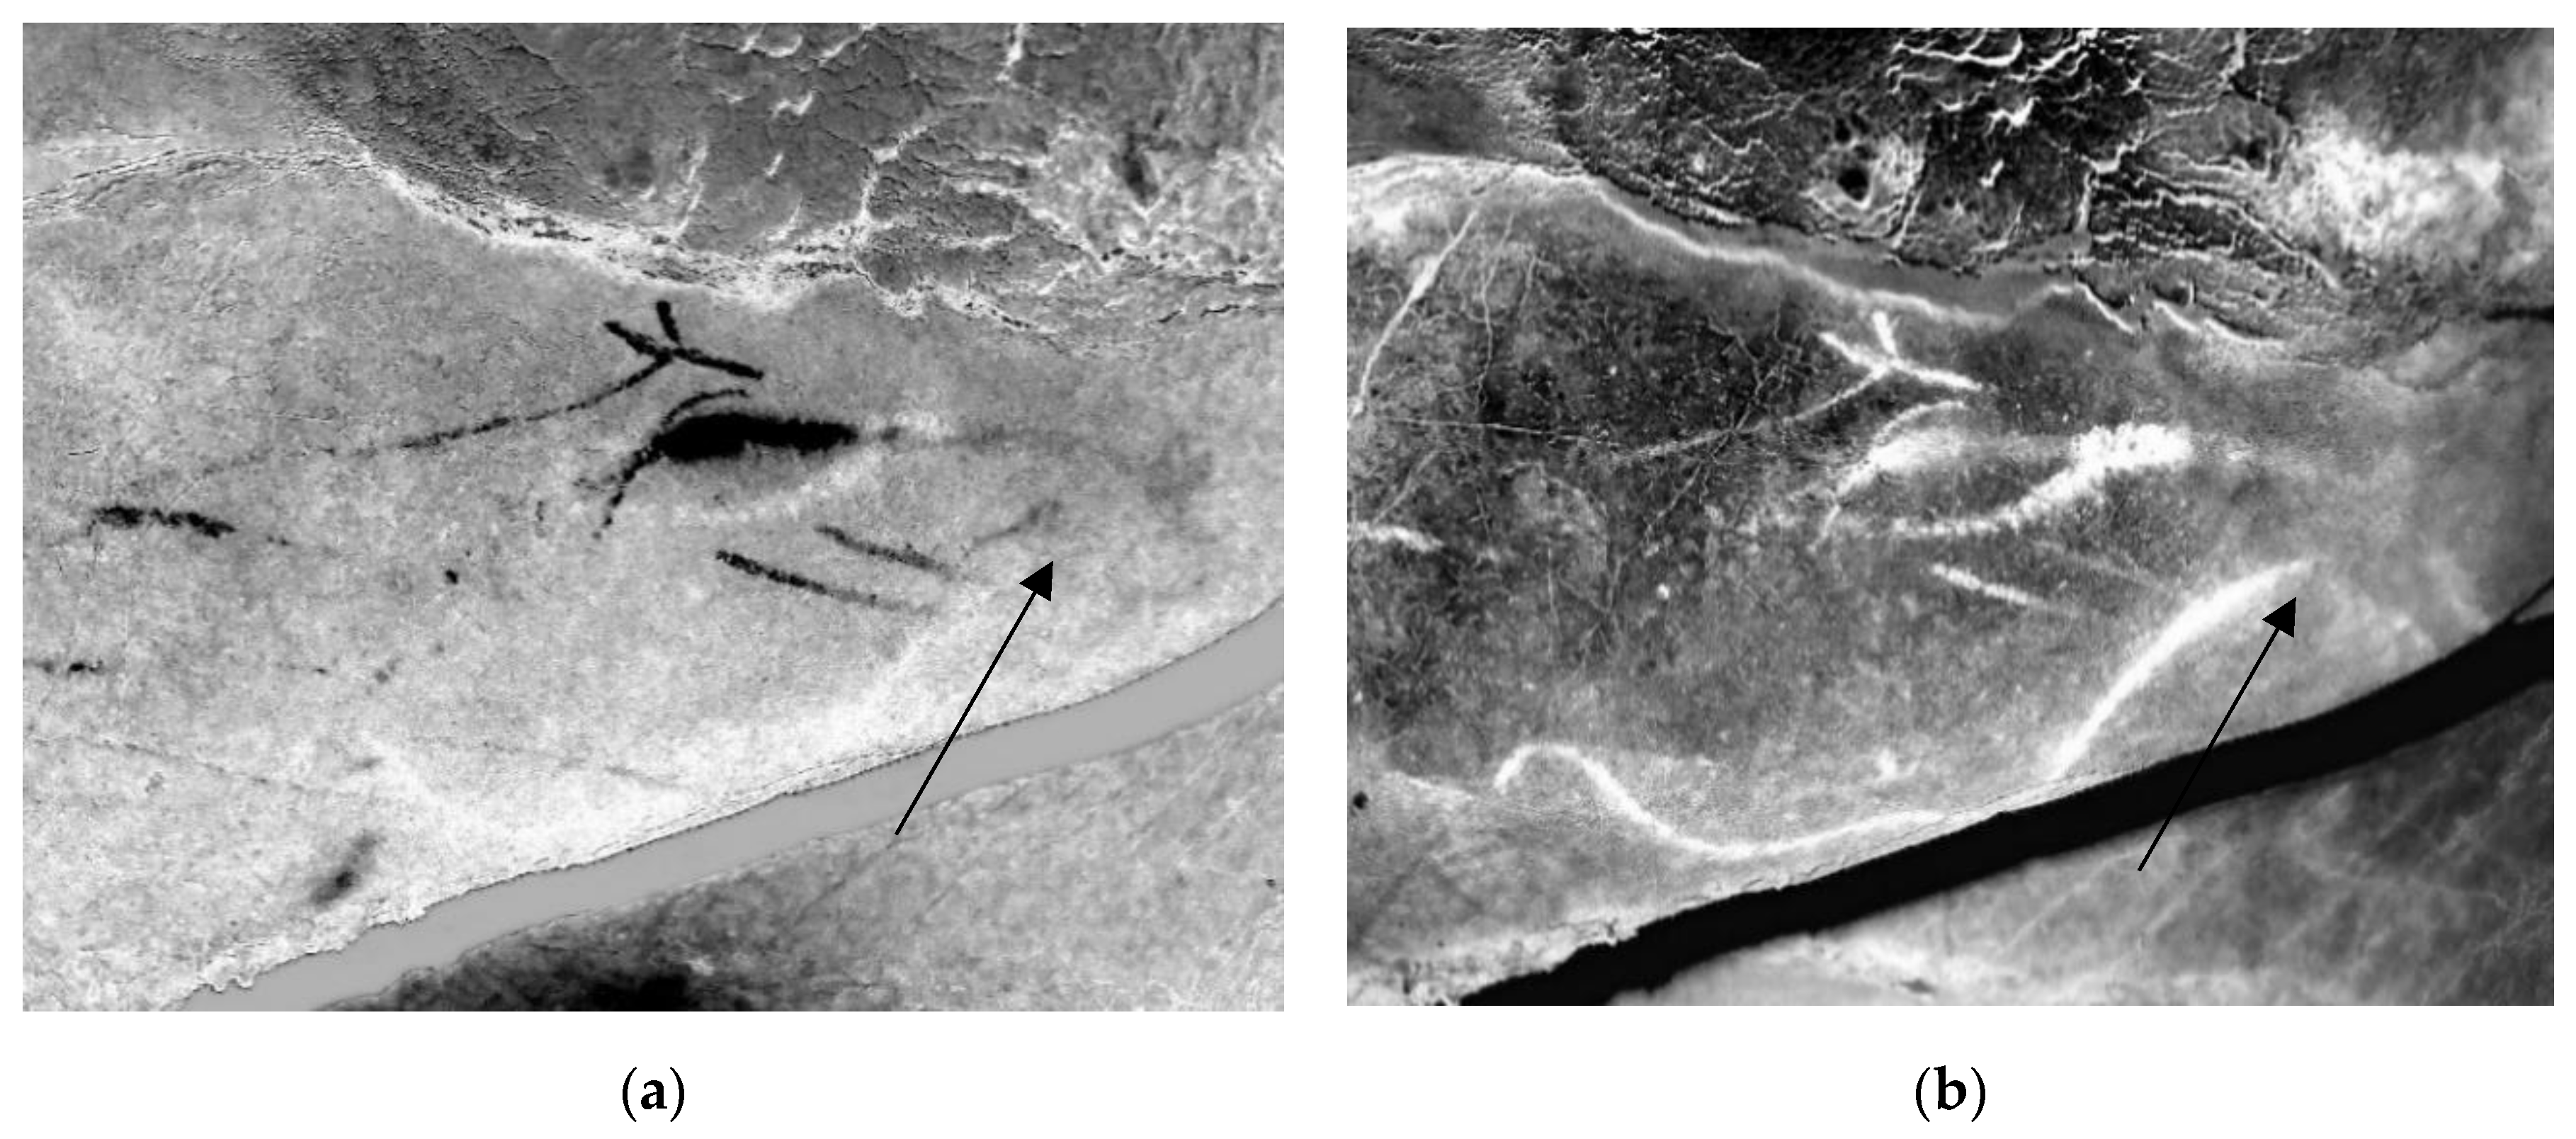
- Reconstruction of the technical process: reading of the image allowed us to study in detail the traceability of the lines that compose the figure, allowing us to approach the analytical reconstruction of the superposition of lines (Figure 16a,b) within the same line and study the means of applying the coloring matter.
- Pigment discrimination: as a result of the SAM classifier, spectrally different areas were documented, which were clearly related to coloring matter of different mineralogical composition.
3.4. Working Area 4
Traditionally, silhouettes of hands are always at the base of pictorial stratigraphs. Those with absolute dates are located between the Gravettian and the beginning of the Solutrean periods. One of the traditional discussions on the panel of the hands is the position of the hands on the stratigraphy, that is, what layers they are above and below.
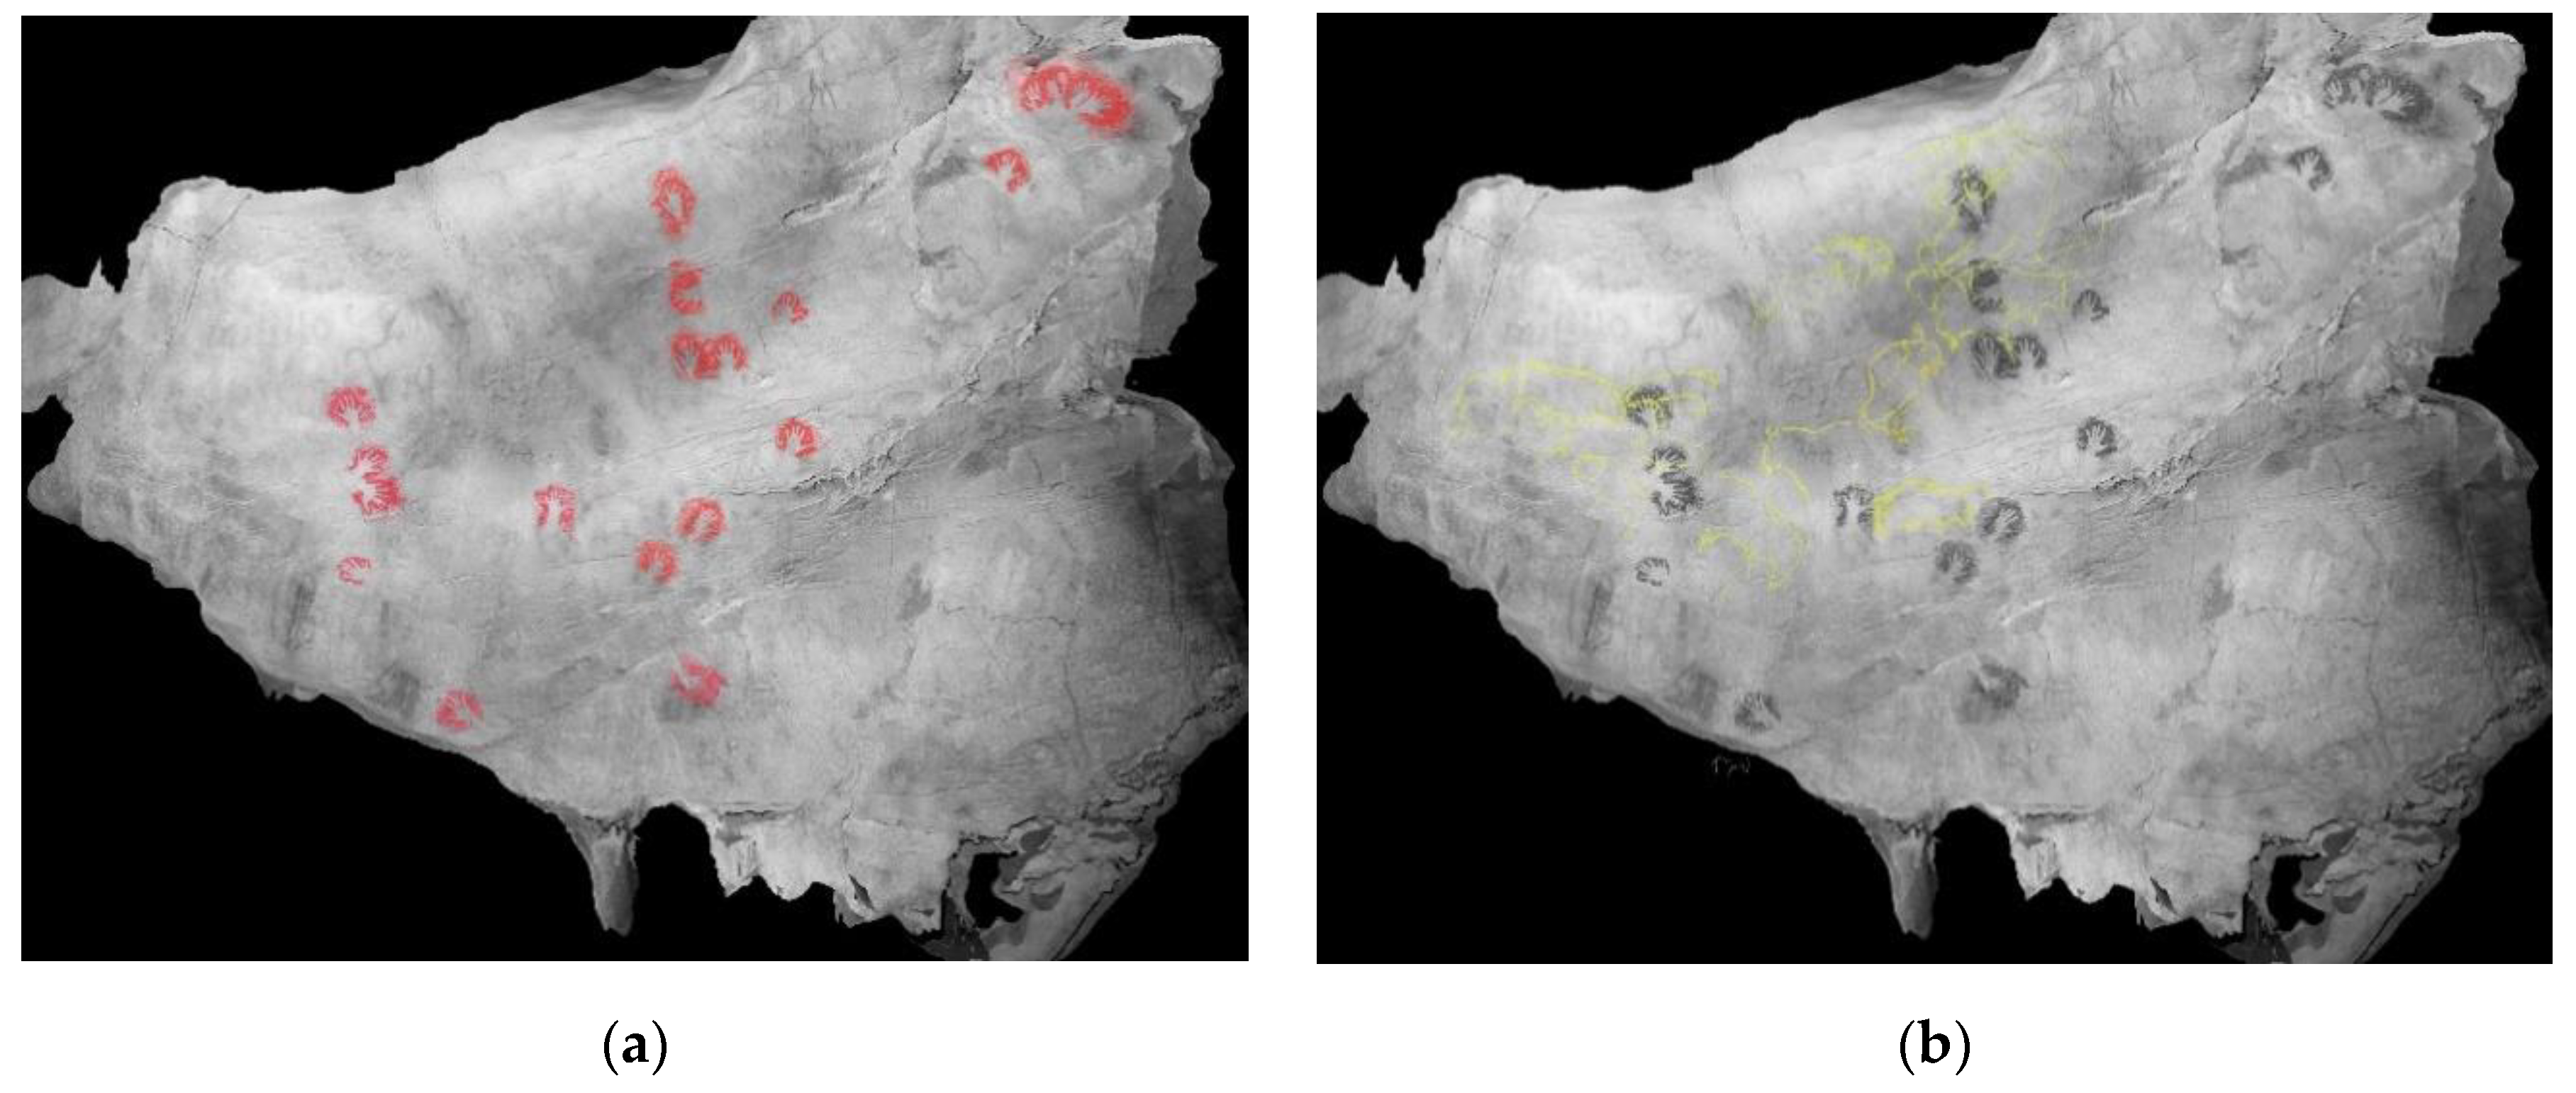
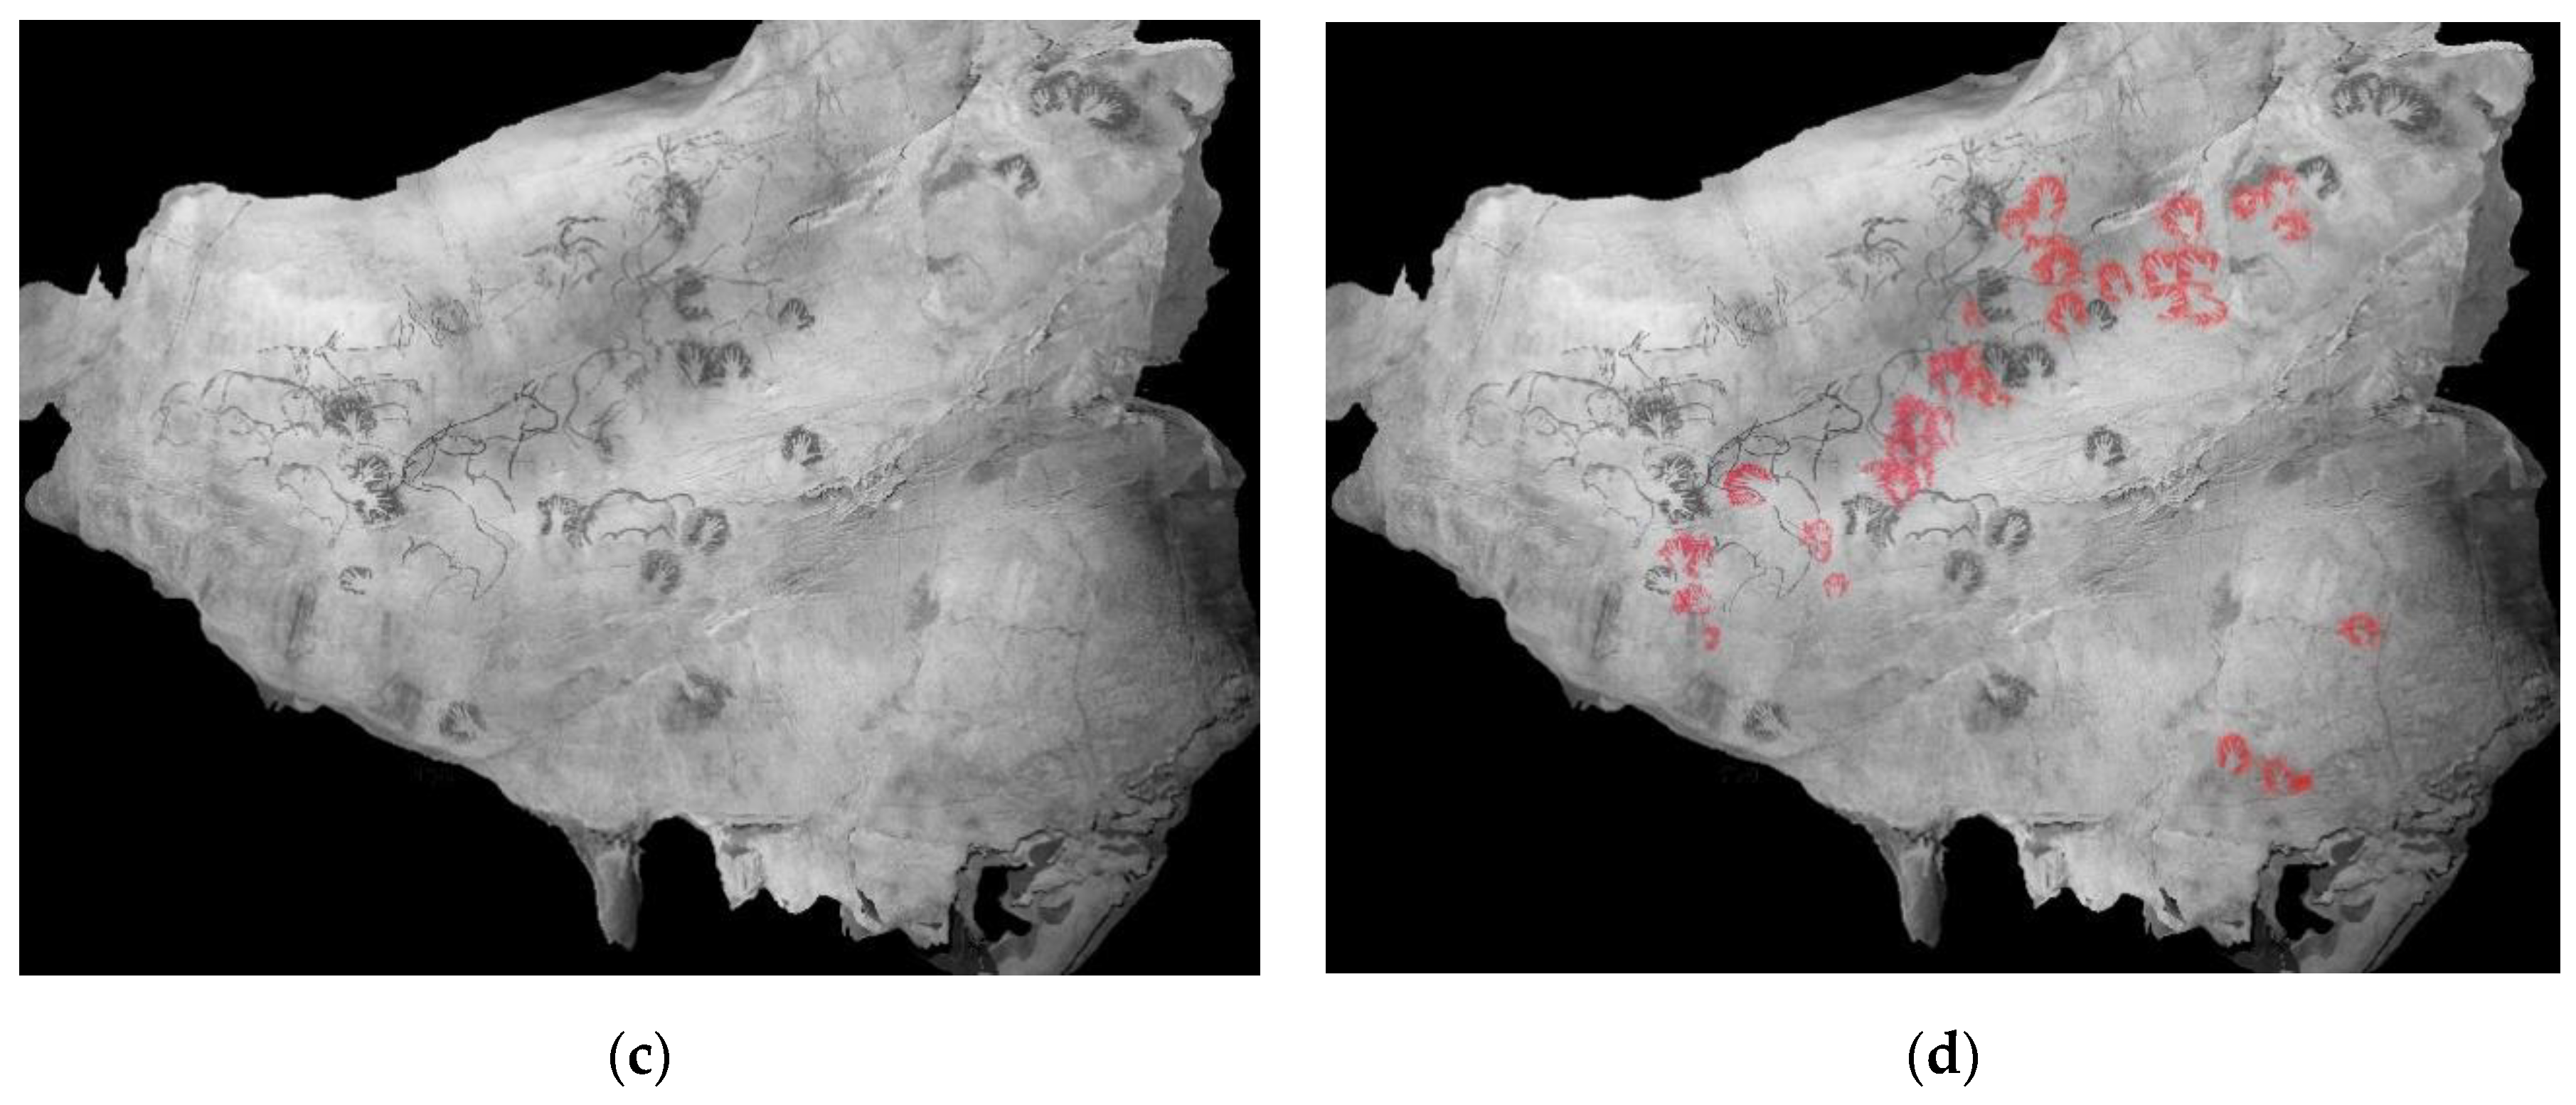
A great contribution of hyperspectral technology was used to differentiate and isolate two phases of hands based on their spectral signatures. Once isolated, by superimpositions it was seen that there are three pictorial layers between them (Figure 17a–d).
4. Discussion
4.1. Working Area 1
This panel has been studied several times throughout history because it is one of the best known of the world’s rock art. If we compare the new results (Figure 18b) with the first publication in 1911 (Figure 18a), we can appreciate the following.
Ruiz-Redondo [18] affirms that all the animals were made in sienna, except for one black and one orange bison, and several of them are superimposed on negative hands. Ripoll [19] reported, based on hyperspectral remote sensing results, that there are two phases of hands and two phases of animals (first in ochre and second in black) between them.
The analysis derived from hyperspectral analysis data for the same area shows not only that it was capable of separating pigments, but also that new figures were emerging.
What has been traditionally represented is a red bison with the back well drawn, but the front part imperfect and confused. Thanks to the techniques employed, it was possible to clearly document the boundaries of the contours of the figure and carry out a formal reconstruction. Spectral differentiation was also performed according to the different mineralogical compositions and the identification of areas affected by leaching and calcite coating due to lower signal intensity.
Below the bison, the silhouette of another one facing to the left can be seen. Crossing the rear extremities of the bison (in yellow) and superimposed on the hand, a bovine silhouette can be seen, arranged to the left and somewhat wild. In addition to the above, new figures such as a horse’s head appear in the central part of the bison.
4.2. Working Area 2
The drawing made in 1911 by Alcalde del Río [12] is shown in Figure 19a and the results of the SAM classification in Figure 19b, showing in yellow the pigments of element 1 that were used to make some of the strokes of element 2. In element 1 and part of element 2 we also saw that the whole contour was engraved with a very characteristic multiple stroke (in black).
4.3. Working Area 3
This panel also has been studied several times. Comparing the new results with the first publication in 1911 [12] (Figure 20), we found the following.
Garate [17] affirms that the horse is represented in a partial way, including the line of the corrected mane and the start of the back, the parallel ears straight, the nose opened by two lines also parallel and with the same stroke in the mouth as in the previous case. It also has the line of the chest and the ventral line with a marked sinuosity, although apparently the rear train was not included.
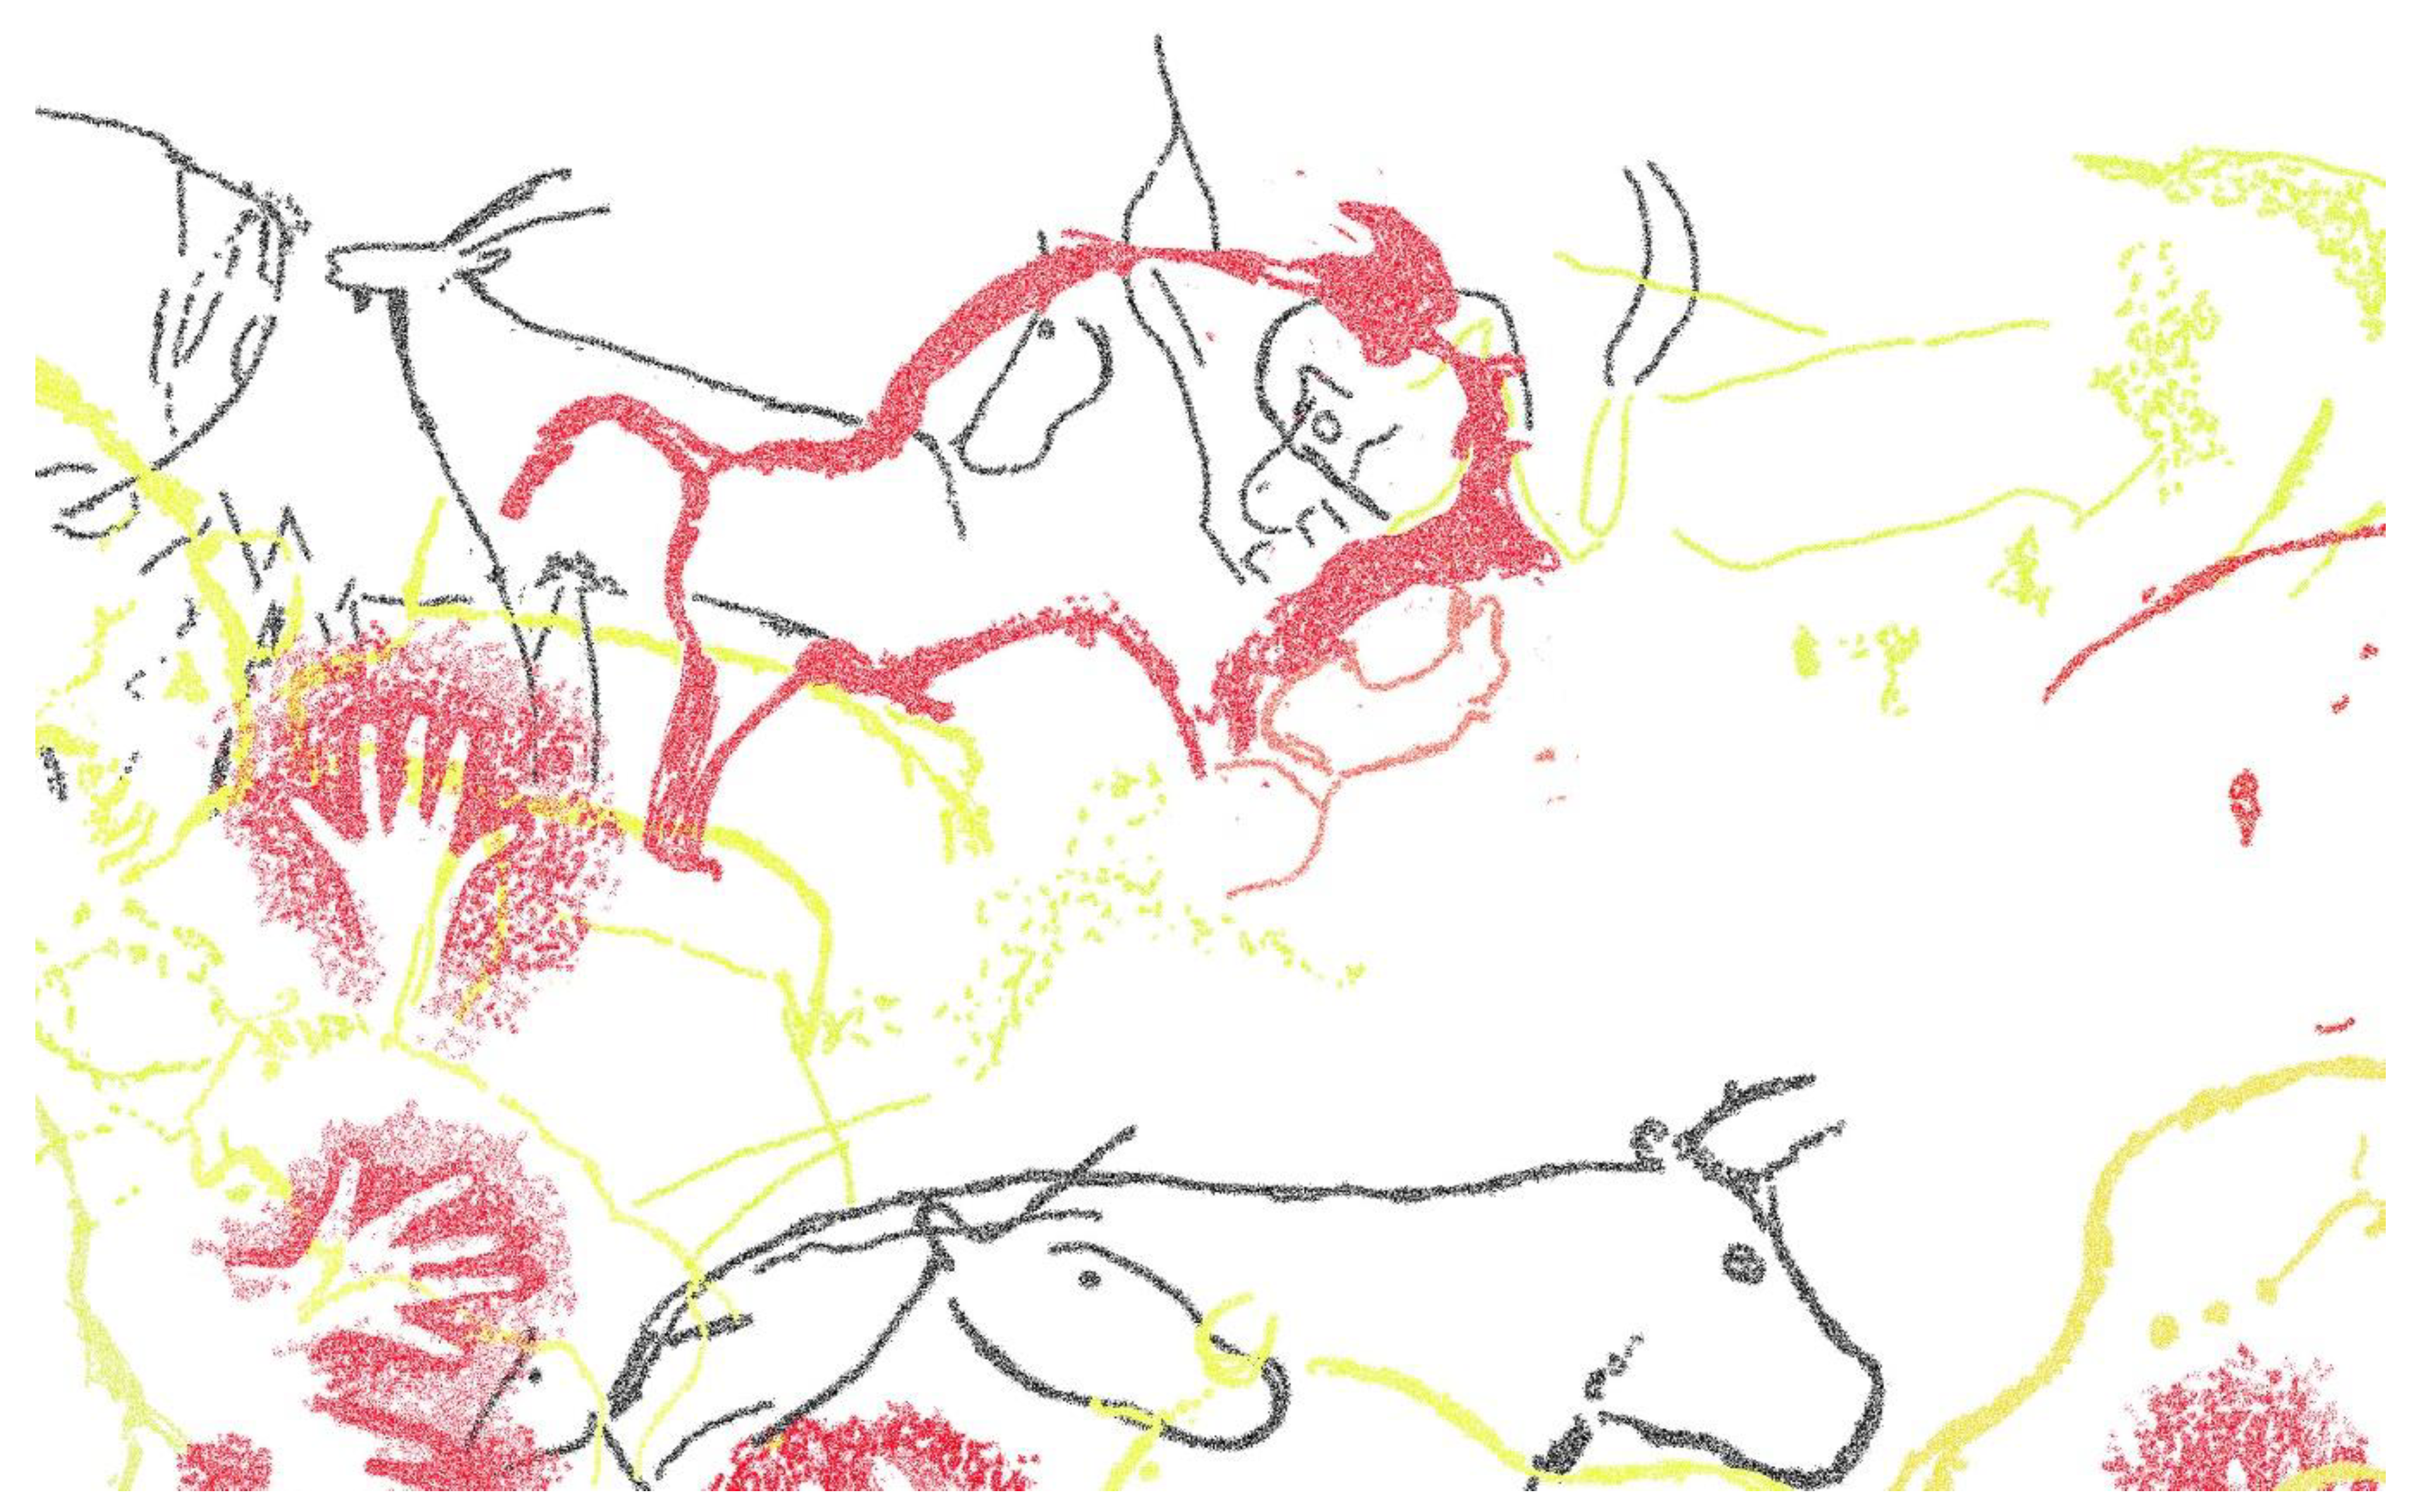
The results of the SAM classification (Figure 21) completed the figures to a great extent and showed everything described above.
- Figure 1: Above the back of the horse is a small figure of red female deer, incomplete and oriented to the right like this horse, with whose back it coincides.
- Figure 2: There is a small horse superimposed on the most obvious yellow equine. It has a smaller size and is oriented to the right, although the anterior part practically coincides with the infraposition. Thanks to hyperspectral analysis, we were able to identify this new figure, which was not seen directly due to the existence of a calcite veil. Recovery of the pigments allowed the contours of the representation to be clearly documented. With this methodology we observed the superpositions and reconstructed the iconographic stratigraphy and the process of addition of the motifs. We also discriminated the different pigments that are documented in spectrally different areas, which can be clearly related to coloring matter with different mineralogical compositions.
- Figure 3: There is another horse of ochre color, arranged to the right with a large belly and without legs. Its ears are upside down. It is above the tectiform. On the left, there is a red stroke and other blacks that have vanished.
- Figure 4: In the area of the rump of the horse, a simple tectiform in the shape of a slightly curved rectangle appears.
The results can be overlaid on the orthoimage since the data are orthocorrected and georeferenced (Figure 22).
5. General Results
Working zones 1, 2 and 3 are part of a larger element known as the panel de las manos in the cave of El Castillo. The integration of techniques such as photogrammetry and remote sensing made it possible to obtain 76% more figures throughout the panel, mainly because they presented problems such as those previously described. The full panel review offered the results shown in Table 1 and graphically shown in Figure 23.
6. Conclusions
Methodology such as that presented for the documentation of rock art is essential in order to acquire knowledge to advance the understanding of cultural heritage and its evolution, and to encourage the interest and participation of people in heritage preservation. The revision of the three panels has resulted in a considerable increase in the number of known figures. In the panel de las manos, we see an increase from 55 to 97 elements (+76%).
Today, recording methodologies should use non-intrusive techniques and should not cause damage to the item being recorded; furthermore, before any data recording, the method to be used in the documentation should be clearly established.
The integration of geomatic methods allows documentation of any industrial or technical heritage in a non-intrusive, rigorous, safe and detailed way. The combined use of photogrammetric techniques supported on a rigorous topographic base makes the documentation of rock art panels more sustainable, as it allows us to reduce the time spent in the cave, which reduces the impact on it; avoid the use of target elements, which leads to better conservation of the cave; increase the accuracy of the support points: 2 mm of one point compared to 5–7 mm of the prismless measuring systems of total topographic stations; have control points throughout the panel to analyze deviations from the photogrammetric model.
Furthermore, these techniques are capable of delivering 2D and 3D results that can be used in any studio.
With the present case study, we sought to cover four areas of work that had high potential in the study of this type of graphic manifestation. The areas of interest were: (a) recognition of the coloring matter; (b) formal recognition of the figures; (c) recognition of the technical process; and (d) documentation of the state of conservation.
Once the work zones have been processed, we can conclude that in recognition of the coloring matter. Most of the techniques applied to the study of the composition of the coloring matter imply taking samples, which entails extractive action and, therefore, deterioration of the cave. Reading images worked at different spectral amplitudes makes it possible to clearly differentiate different compositions from the coloring materials used. This is an important milestone on which further work is undoubtedly needed, as compositions have so far been relatively differentiated, although further experiments with natural pigments will be necessary in order to obtain precise patterns and be able to link certain spectra with precise mineralogical compositions. The development and deepening of this field will make an important contribution, in the medium or long term, to the knowledge, at least relative, of the composition of the pigments without taking samples.
Reconstruction of the cave motifs. Most figures located inside cavities are subject to natural and artificial processes that cause the loss of coloring matter or the erosion of engraved surfaces, implying difficult interpretation of the motifs. The application of the technique has made it possible to precisely define the original morphology of some figures, both engraved and painted in different colors (and very probably of different chemical compositions). In particular, it is possible to precisely define the contours of the figures and precisely recognize anatomical parts or areas of specific figures, and consequently obtain images that involve highly reliable reconstruction of the original painting or engraving. In this way, figures that currently present visualization difficulties can be “reconstructed” and thus allow precise formal studies or even serve as efficient support for the realization of facsimiles.
Recognition of the technical process and the superpositions between figures. In rock art, studies are conditioned by the state of conservation of the figures, and the reading of superimpositions between strokes or figures is one of the fundamental problems. The system used has allowed the recognition of superpositions in at least three areas: (a) between lines of the same figure in cases where the composition of coloring matter is different; (b) between engraving and painting, as each technical action is spectrally discriminated; and, to a lesser extent, (c) superposition between engraved lines of the same figure, which allows reconstruction with a certain reliability of the process of execution of a motif.
Characterization of the state of conservation of cave motifs. The main utility provided by hyperspectral data is the possibility of carrying out exhaustive documentation of the conservation of a motif, perfectly discriminating between veiled areas, leached areas, scaling and any other action of a taphonomic nature to which the figure is subject. For the first time, it is now possible to present “maps” of the figures and the associated conservation problems. Once this long-term methodology has been applied and evaluated for the same reason, it will allow the study of the actions, frequency and intensity of each one, to obtain an exhaustive register that is above subjective and imprecise descriptions.
In conclusion, it can be noted that the application of hyperspectral remote sensing technology to the field of archaeology, and more specifically rock art, has high potential for applications in documentation, technical analysis and conservation of cultural heritage.
Author Contributions
Conceptualization, V.B. and S.R.; methodology, V.B.; software, V.B.; validation, S.R., M.A.S.; formal analysis, M.A.S.; funding acquisition V.B.; investigation, V.B., M.A.S. and S.R.; resources, V.B.; writing—original draft preparation, V.B.; writing—review and editing, V.B. and S.R.; visualization, V.B. and S.R.; supervision, M.A.S. and S.R.
Funding
This research was funded by Consejería de Innovación, Industria, Turismo y Comercio of Cantabrian Government in the context of aid to encourage industrial research and innovation in companies, project “Sistema para la Gestión y Difusión de Arte Rupestre y Parietal (SIGEDARP),” grant number IV07–XX-031.
Acknowledgments
The present paper has been produced within the scope of doctoral activities carried out by the lead author at the International Doctorate School of the Spanish National Distance-Learning University (Escuela Internacional de Doctorado de la Universidad Nacional de Educación a Distancia; EIDUNED). The authors are grateful for the support provided by this institution. The authors of this work would also like to thank the GIM Geomatics company for its support of the project and E. Castillo and R. Ontañón for their advice.
Conflicts of Interest
The authors declare no conflicts of interest.
References
- Ontañon, R.; Bayarri, V.; Herrera, J.; Gutierrez, R. The conservation of prehistoric caves in Cantabria, Spain. In The Conservation of Subterranean Cultural Heritage; CRC Press/Balkema: Boca Raton, FL, USA; Taylor & Francis Group: London, UK, 2014; ISBN1 978-1-138-02694-0 (Hbk). ISBN2 978-1-315-73997-7. [Google Scholar]
- Montero Ruiz, I.; Rodríguez Alcalde, Á.L.; Vicent García, J.M.; Cruz Berrocal, M. Técnicas digitales para la elaboración de calcos de arte rupestre. Trabajos de Prehistoria 2010, 55, 155–169. [Google Scholar] [CrossRef]
- Ghamisi, P.; Yokoya, N.; Li, J.; Li, W.; Liu, S.; Plaza, J.; Rasti, B.; Plaza, A. Advances in Hyperspectral Image and Signal Processing: A Comprehensive Overview of the State of the Art. IEEE Geosci. Remote Sens. Mag. 2018, 5, 34–78. [Google Scholar] [CrossRef]
- Hou, M.; Cao, N.; Tan, L.; Lyu, S.; Zhou, P.; Xu, C. Extraction of Hidden Information under Sootiness on Murals Based on Hyperspectral Image Enhancement Applied Sciences. Appl. Sci. 2019, 9, 3591. [Google Scholar] [CrossRef]
- Cerra, D.; Agapiou, A.; Cavalli, R.M.; Sarris, A. An Objective Assessment of Hyperspectral Indicators for the Detection of Buried Archaeological Relics. Remote Sens. 2018, 10, 500. [Google Scholar] [CrossRef]
- Goetz, A.F.H. Spectroscopic remote sensing for geological applications. Imaging Spectrosc. 1981, 268, 17–21. [Google Scholar]
- Zhang, B. Advancement of hyperspectral image processing and information extraction. J. Remote Sens. 2016, 20, 1062–1090. [Google Scholar] [CrossRef]
- Fischer, C.; Kakoulli, I. Multispectral and hyperspectral imaging technologies in conservation: Current research and potential applications. Stud. Conserv. 2013, 51, 3–16. [Google Scholar] [CrossRef]
- Attas, M.; Cloutis, E.; Collins, C.; Goltz, D.; Majzels, C.; Mansfield, J.R.; Mantsch, H.H. Near-infrared spectroscopic imaging in art conservation: Investigation of drawing constituents. J. Cult. Herit. 2003, 4, 127–136. [Google Scholar] [CrossRef]
- Bayarri, V.; Latova, J.; Castillo, E.; Lasheras, J.A.; De Las Heras, C.; Prada, A. Nueva documentación y estudio del arte empleando técnicas hiperespectrales en la Cueva de Altamira. ARKEOS | perspectivas em diálogo, nº 37. In XIX International Rock Art Conference IFRAO 2015. Symbols in the Landscape: Rock Art and its Context. Conference Proceedings; Instituto Terra e Memória: Tomar, Portugal, 2015; ISBN 978-84-9852-463-5. [Google Scholar]
- Hauke, K.; Kehren, J.; Böhme, N.; Zimmer, S.; Geisler, T. In Situ Hyperspectral Raman Imaging: A New Method to Investigate Sintering Processes of Ceramic Material at High-temperature. Appl. Sci. 2019, 9, 1310. [Google Scholar] [CrossRef]
- Alcalde Del Río, H.; Breuil, H.; Sierra, L. Les Cavernes de la Région Cantabrique (Espagne); Impr. V A. Chêne: Cantabria, Monaco, 1911. [Google Scholar]
- Ripoll Perelló, E. Nota acerca de algunas nuevas figuras rupestres de las cuevas de EL Castillo y La Pasiega (Puente Viesgo, Santander). In Actas del IV Congreso Internacional de Ciencias Prehistóricas y Protohistóricas (Madrid 1954); Pan American Institute of Geography and History: Zaragoza, Spain, 1956; pp. 301–310. [Google Scholar]
- García-Guinea, M.A.; González-Echegaray, J. Nouvelles reprèsentations d´art rupestre dans la grotte del Castillo. Préhistoire et Spéléologie Ariégoises 1966, XXI, 441–446. [Google Scholar]
- Echegaray, J.G.; Romanillo, J.A.M. Figuras rupestres inéditas de la Cueva del Castillo (Puente Viesgo). Boletín del Seminario de Estudios de Arte y Arqueología 1970, 36, 441–446. [Google Scholar]
- Romanillo, J.A.M.; Sainz, C.G. Cronología del arte paleolítico cantábrico: Últimas aportaciones y estado actual de la cuestión. In Actas del 3er Congreso de Arqueología Peninsular; ADECAP: Vila Real, Portugal, 2000; Volume II, pp. 461–473. [Google Scholar]
- Gárate-Maidagán, D. Nuevos datos en torno al inicio del arte parietal cantábrico: La aportación de un caballo inédito en el Panel de Manos de la Cueva del Castillo (Puente Viesgo, Cantabria); Sautuola XII: Instituto de Prehistoria y Arqueología Sautuola: Santander, Spain, 2006; pp. 351–358. [Google Scholar]
- Ruiz-Redondo, A. Una nueva revisión del Panel de las Manos de la cueva de El Castillo (Puente Viesgo, Cantabria). Munibe Antropologia-Arkeologia 61, C. Aranzadi. Z. E. Donostia/San Sebastián. 2010; 17–27. [Google Scholar]
- Ripoll, S.; Bayarri, V.; Muñoz, F.J.; Latova, J.; Gutiérrez, R.; Pecci, H. El arte rupestre de la cueva de El Castillo (Puente Viesgo, Cantabria): Unas reflexiones metodológicas y una propuesta cronológica. In Capítulo en Libro Cien Años de Arte Rupestre Paleolítico Centenario del Descubrimiento de la Cueva de la Peña de Candamo (1914–2014); Ediciones Universidad de Salamanca: Salamanca, Spain, 2014; ISBN 978-84-9012-480-2. [Google Scholar]
- Kruse, F.A.; Lefkoff, A.B.; Boardman, J.W.; Heidebrecht, K.B.; Shapiro, A.T.; Barloon, P.J.; Goetz, A.F.H. The Spectral Image Processing System (SIPS)—Interactive visualization and analysis of imaging spectrometer data. Remote Sens. Environ. 1992, 44, 145–163. [Google Scholar] [CrossRef]
- ICOM. ICOM Guidelines for Loans; International Council of Museums: Paris, France, 1994; Available online: https://icom.museum/wp-content/uploads/2018/07/Loans1974eng.pdf (accessed on 29 October 2019).
- Green, A.A.; Berman, M.; Switzer, P.; Craig, M.D. A transformation for ordering multispectral data in terms of image quality with implications for noise removal. IEEE Trans. Geosci. Remote Sens. 1988, 26, 65–74. [Google Scholar] [CrossRef]
- Rashmi, S.; Swapna, A.; Venkat Ravikiran, S. Spectral Angle Mapper Algorithm for Remote Sensing Image Classification. Int. J. Innov. Sci. Eng. Technol. 2014, 1, 2348–7968. [Google Scholar]
- Sabins, F.F., Jr. Remote Sensing Principles and Interpretation, 2nd ed.; W. H. Freeman and Co: San Francisco, CA, USA, 1986; ISBN 13: 9780716717935. [Google Scholar]
- Richards, J.A. Remote Sensing Digital Image Analysis: An Introduction; Springer: Berlin, Germany, 1999; p. 240. [Google Scholar]
- Loève, M. Probability Theory II, 4th ed.; Graduate Texts in Mathematics. 46; Springer: New York, NY, USA, 1978; ISBN 978-0-387-90262-3. [Google Scholar]
- Hyvärinen, A. Independent component analysis in the presence of gaussian noise by maximizing joint likelihood. Neurocomputing 1998, 22, 49–67. [Google Scholar] [CrossRef]
- Hyvärinen, A. Fast and robust fixed-point algorithms for independent component analysis. IEEE Trans. Neural Netw. 1999, 10, 626–634. [Google Scholar] [CrossRef] [PubMed] [Green Version]
Figure 1.
(a) View of the 3D model of panel de las manos. (b) Orthoimage generated to register all hyperspectral data.
Figure 1.
(a) View of the 3D model of panel de las manos. (b) Orthoimage generated to register all hyperspectral data.

Figure 2.
Overall workflow of the proposed method.

Figure 3.
Spectral signatures of lights at working distance. Vertical axis represents relative spectral power measured and horizontal axis the wavelength in nanometers where it was measured.
Figure 3.
Spectral signatures of lights at working distance. Vertical axis represents relative spectral power measured and horizontal axis the wavelength in nanometers where it was measured.

Figure 4.
Spectral signatures of ochre pigment in hands.

Figure 5.
Locations of four areas of special interest in the study.

Figure 6.
True color composition of hyperspectral image.

Figure 7.
Remains of pigments extracted in the minimum noise fraction (MNF)-6 component.

Figure 8.
Cartography of (a) redder ochre type and (b) a more yellowish one.

Figure 9.
Spectral angle mapper (SAM) classification of pigments.

Figure 10.
True color composition of hyperspectral image showing motifs: (1) is the rectangular geometric pattern and (2) is the complex geometric and linear motif.
Figure 10.
True color composition of hyperspectral image showing motifs: (1) is the rectangular geometric pattern and (2) is the complex geometric and linear motif.

Figure 11.
(a) Pigment represented in white; (b) engravings around the pigment.

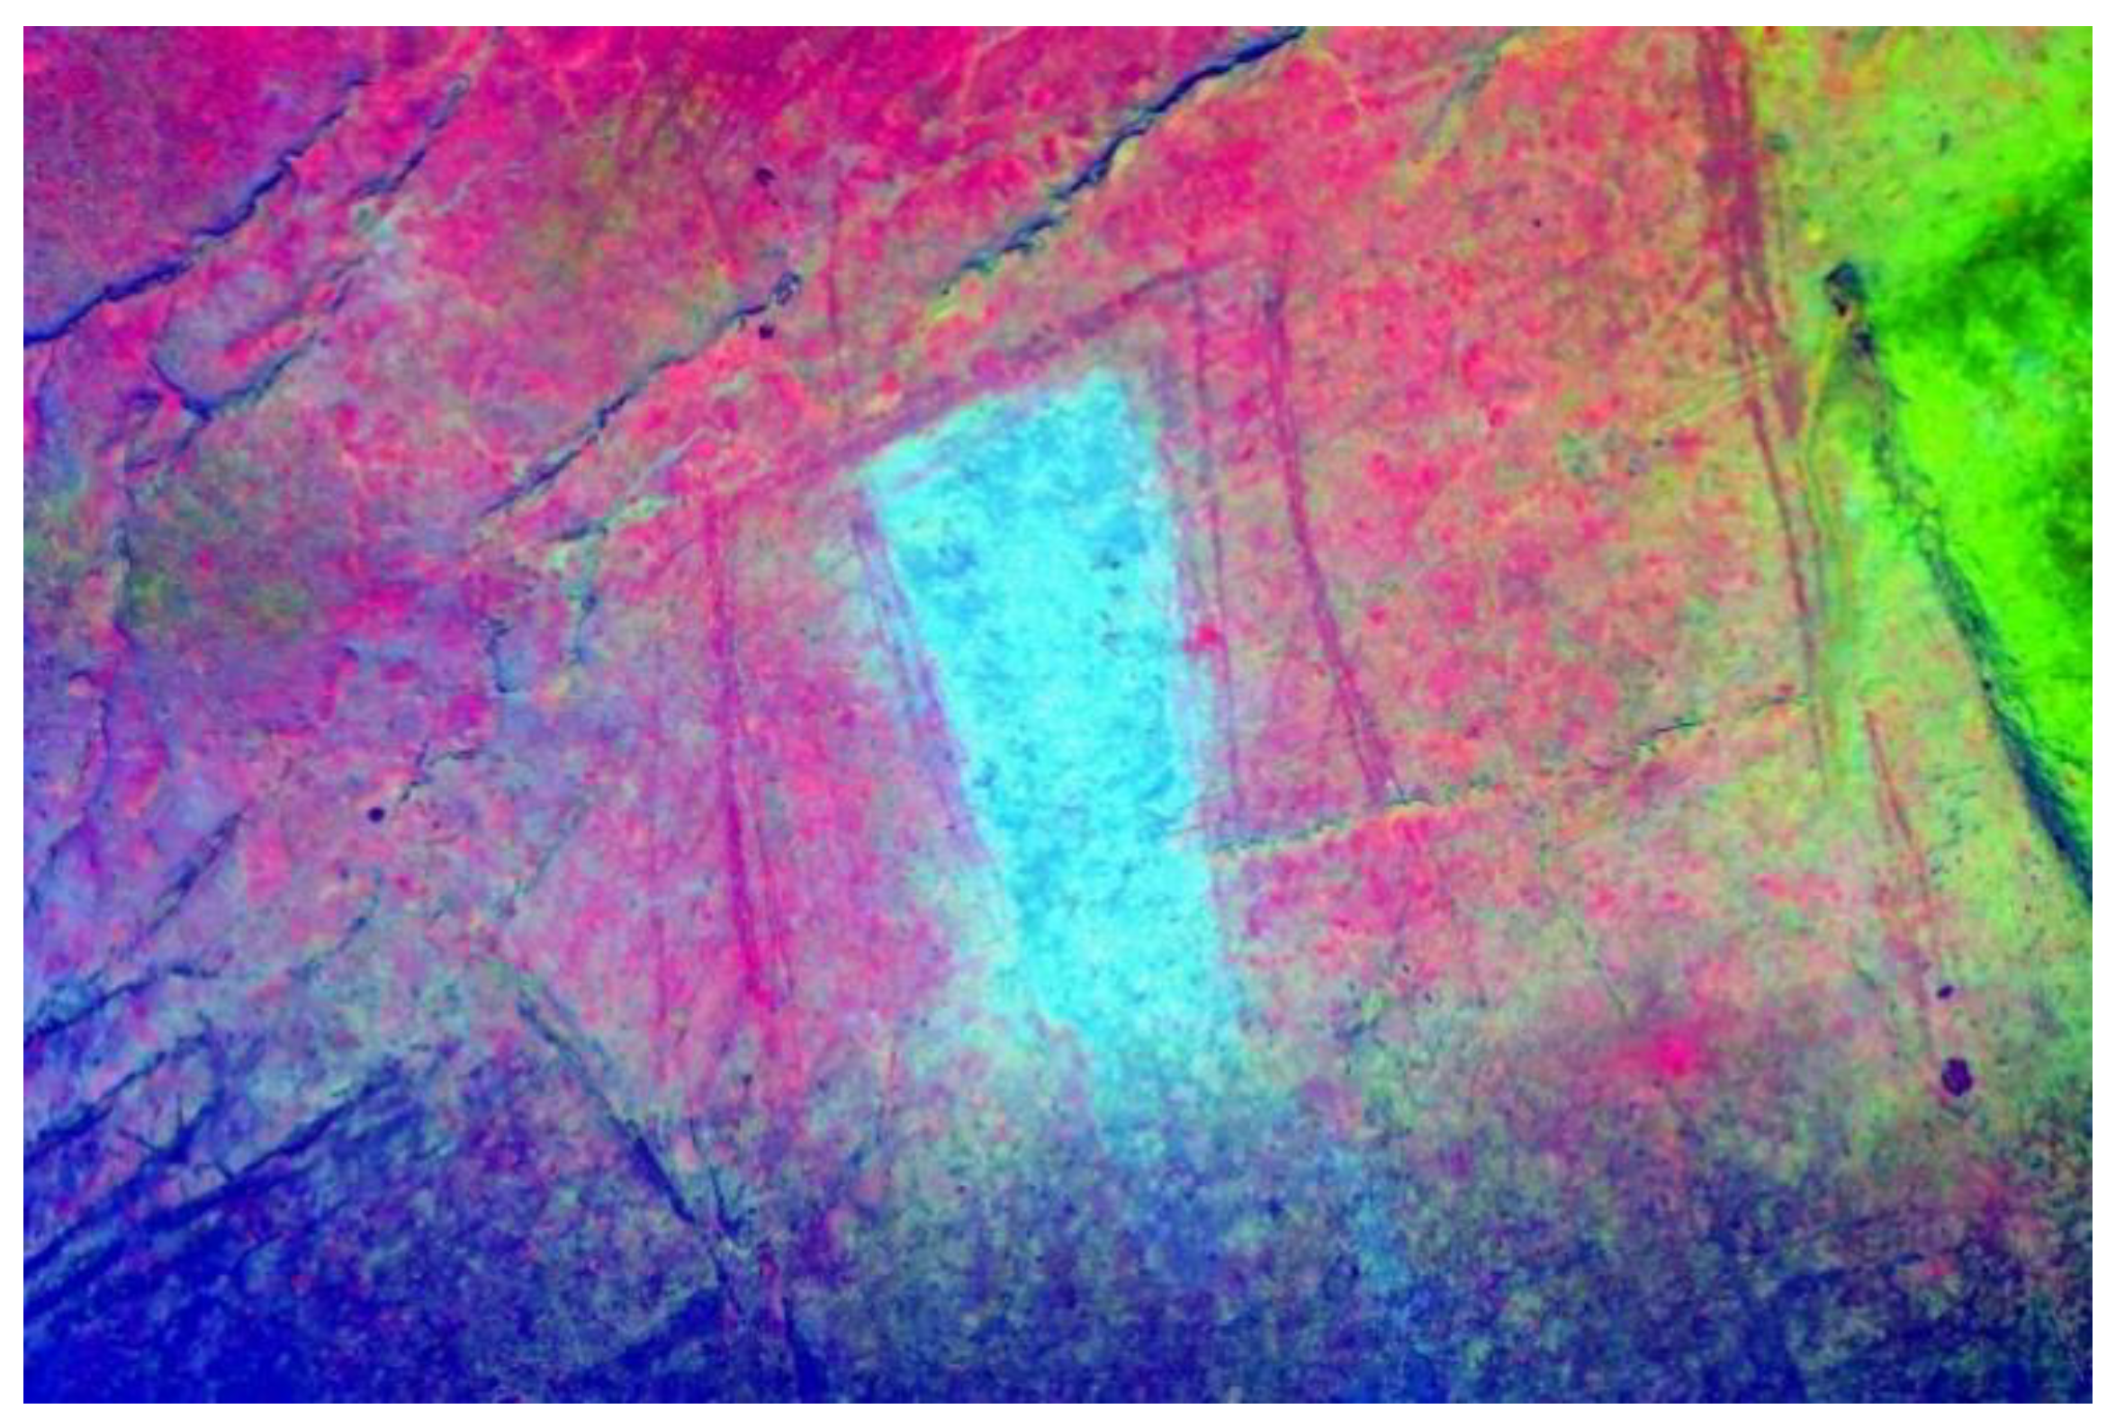
Figure 12.
False color composition showing pigments and engravings.

Figure 13.
(a) Plaster layer represented in black; (b) pigment drawing represented in white.

Figure 14.
(a) Isolation of pigment of part 1 of the panel; (b) eight strokes (in green) made with pigment of part 1 in part 2.
Figure 14.
(a) Isolation of pigment of part 1 of the panel; (b) eight strokes (in green) made with pigment of part 1 in part 2.

Figure 15.
True color composition of hyperspectral image: (1) is the red female deer, (2) small horse infraposed, (3) visible horse and (4) is a single tectiform.
Figure 15.
True color composition of hyperspectral image: (1) is the red female deer, (2) small horse infraposed, (3) visible horse and (4) is a single tectiform.

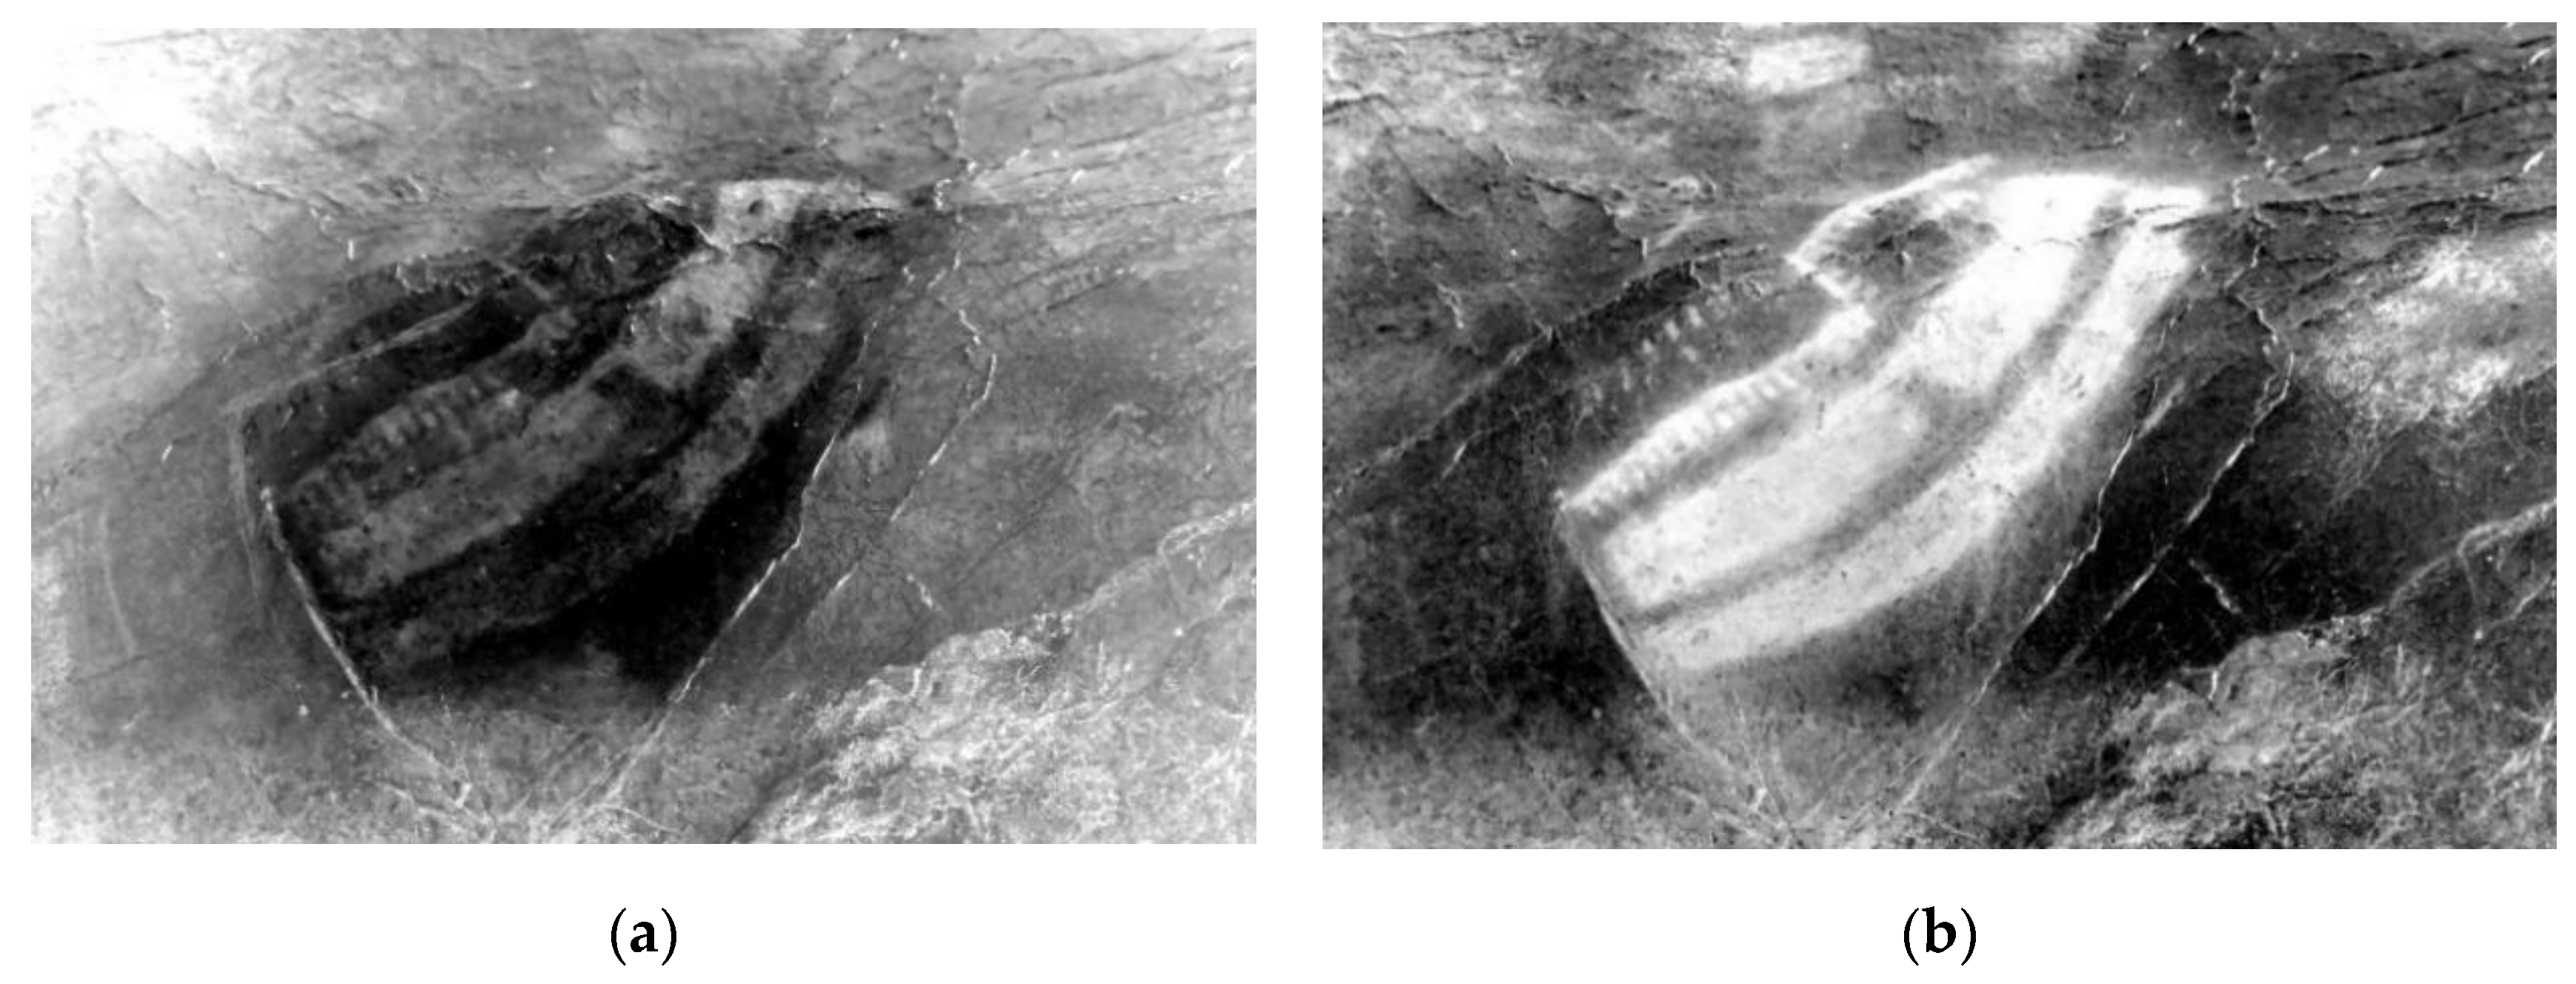
Figure 16.
(a) As shown in black, it is possible to recover a horse below the calcite and yellow horse; (b) horse between calcite and old horse.
Figure 16.
(a) As shown in black, it is possible to recover a horse below the calcite and yellow horse; (b) horse between calcite and old horse.

Figure 17.
Images corresponding to (a) the first phase of hands (in red); (b) the second phase, elaborated with yellow pigment or sienna, very distinguished and centered in the set of aurochs; (c) the third phase with zoomorphic representations and two quadrangular signs or tectiforms painted in yellow pigment (shown in black); and (d) the fourth phase, which corresponds to the second phase of hands.


Figure 18.
(a) Interpretation made in 1911 by Alcalde del Río [12]; (b) fragment of the SAM classification.
Figure 18.
(a) Interpretation made in 1911 by Alcalde del Río [12]; (b) fragment of the SAM classification.

Figure 19.
(a) Interpretation made in 1911 by Alcalde del Río [12]. (b) Eight strokes (in green) made with pigment of part 1 in part 2.
Figure 19.
(a) Interpretation made in 1911 by Alcalde del Río [12]. (b) Eight strokes (in green) made with pigment of part 1 in part 2.

Figure 20.
(a) Interpretation made in 1911 by Alcalde del Río [12]. (b) Detail of the red female deer in [12].

Figure 21.
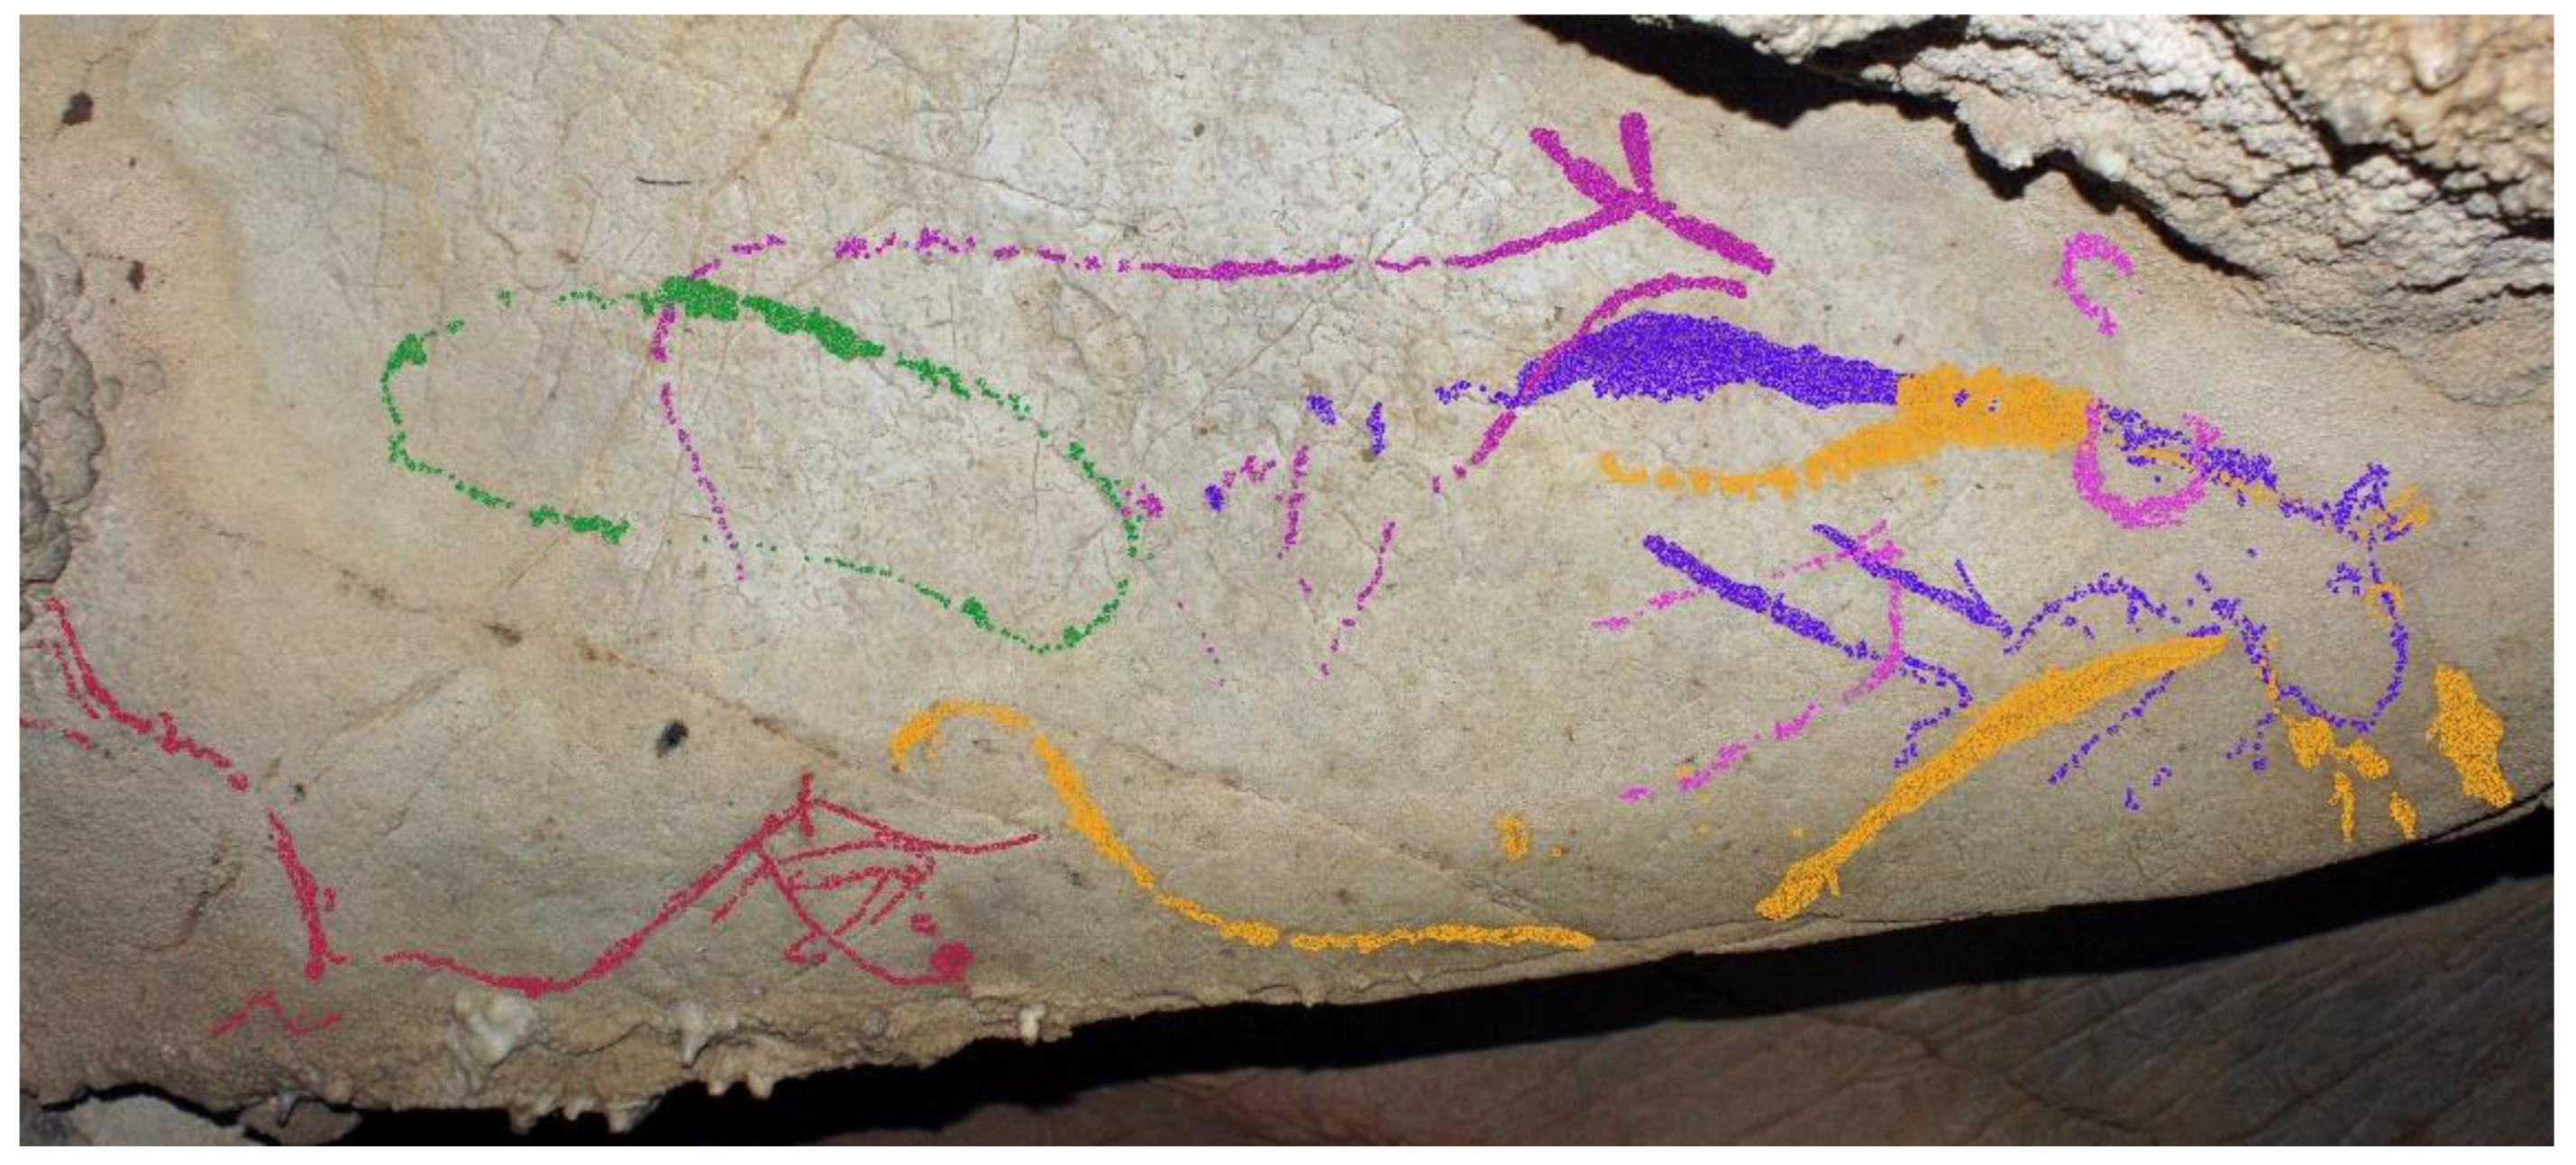
Result of SAM classification of work zone 4.

Figure 22.
Superposition of SAM classification over orthoimage of the panel in working area 3.

Figure 23.
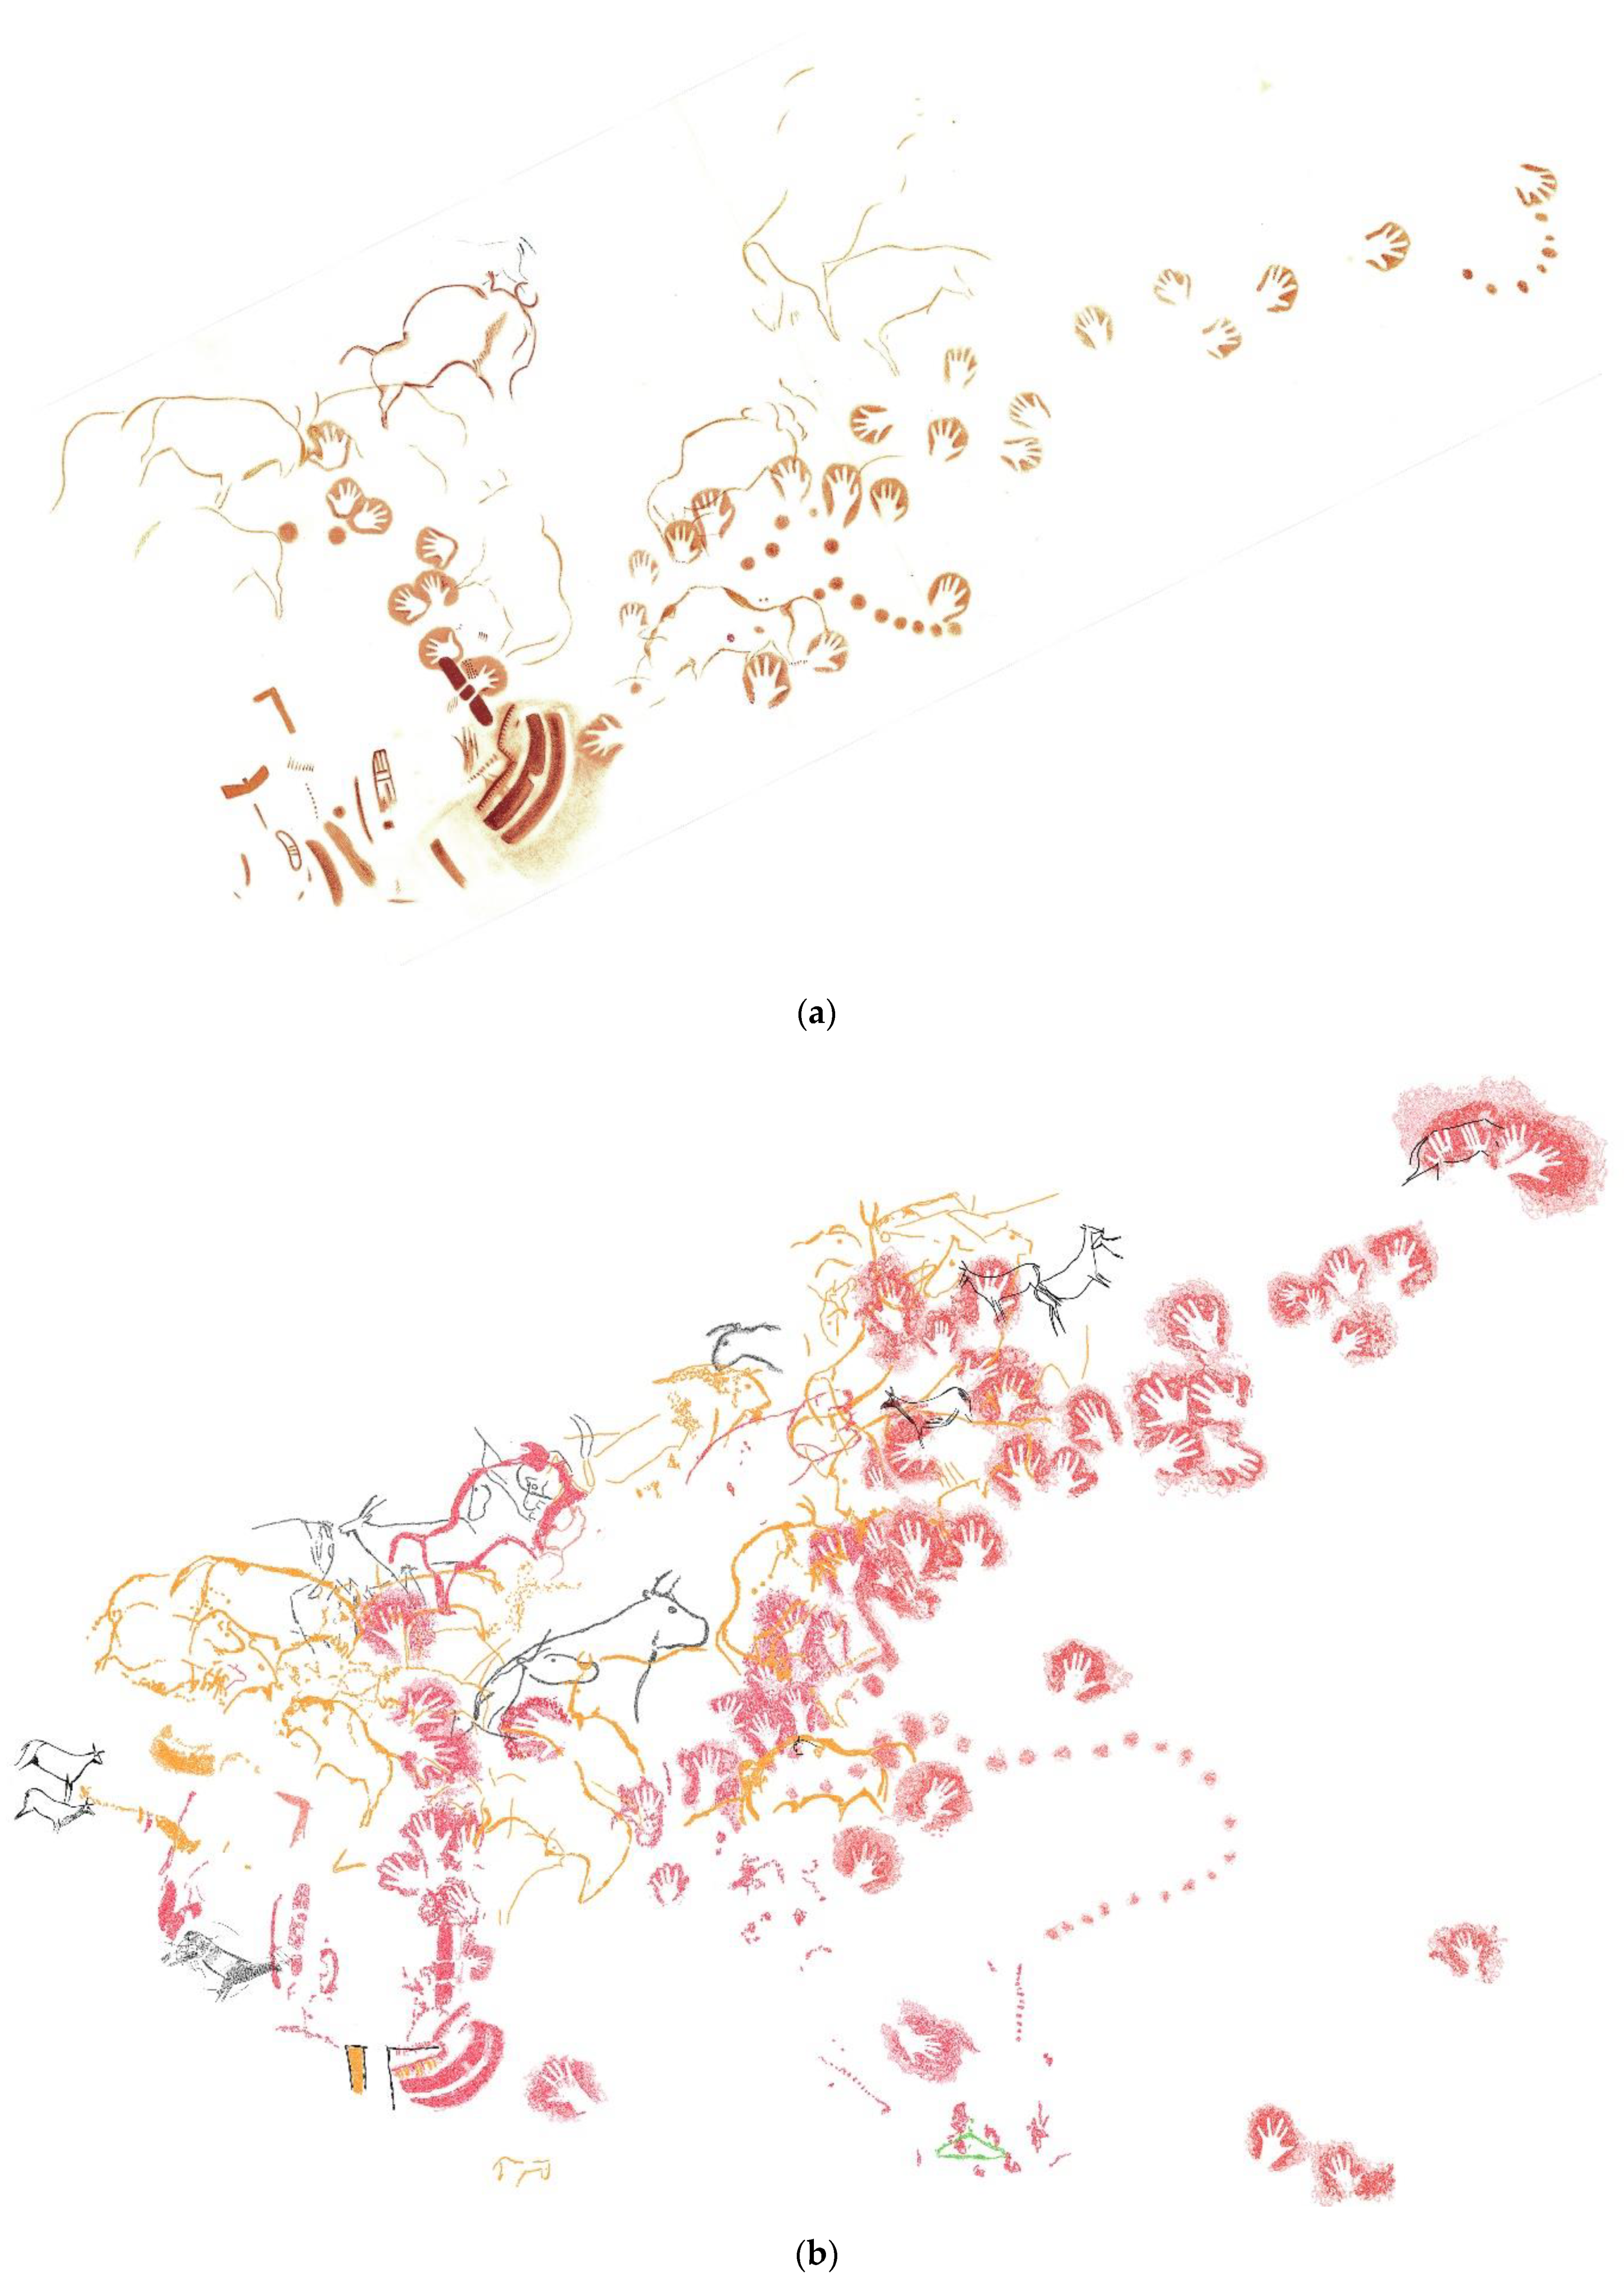
(a) Interpretation made in 1911 by Alcalde del Río [12]. (b) New pigment cartography obtained from hyperspectral data of the panel de las manos.
Figure 23.
(a) Interpretation made in 1911 by Alcalde del Río [12]. (b) New pigment cartography obtained from hyperspectral data of the panel de las manos.


Table 1.
Summary of results in full panel de la manos review.
| Figures | Alcalde del Río et al. [12] | Hyperspectral Review |
|---|---|---|
| Hands | 33 | 56 |
| Bisons | 9 | 17 |
| Aurochs | 3 | |
| Cervids | 3 | |
| Caprids | 3 | |
| Ideomorphs | 11 | |
| Engravings | 6 | 11 |
| Total | 7 | 97 |
Comparison of types of figures detected.
© 2019 by the authors. Licensee MDPI, Basel, Switzerland. This article is an open access article distributed under the terms and conditions of the Creative Commons Attribution (CC BY) license (http://creativecommons.org/licenses/by/4.0/).
Share and Cite
MDPI and ACS Style
Bayarri, V.; Sebastián, M.A.; Ripoll, S. Hyperspectral Imaging Techniques for the Study, Conservation and Management of Rock Art. Appl. Sci. 2019, 9, 5011. https://doi.org/10.3390/app9235011
AMA Style
Bayarri V, Sebastián MA, Ripoll S. Hyperspectral Imaging Techniques for the Study, Conservation and Management of Rock Art. Applied Sciences. 2019; 9(23):5011. https://doi.org/10.3390/app9235011
Chicago/Turabian StyleBayarri, Vicente, Miguel A. Sebastián, and Sergio Ripoll. 2019. "Hyperspectral Imaging Techniques for the Study, Conservation and Management of Rock Art" Applied Sciences 9, no. 23: 5011. https://doi.org/10.3390/app9235011
Note that from the first issue of 2016, this journal uses article numbers instead of page numbers. See further details here.