Synthesis and Encapsulation of a New Zinc Phthalocyanine Photosensitizer into Polymeric Nanoparticles to Enhance Cell Uptake and Phototoxicity

Abstract
:1. Introduction
2. Materials and Methods
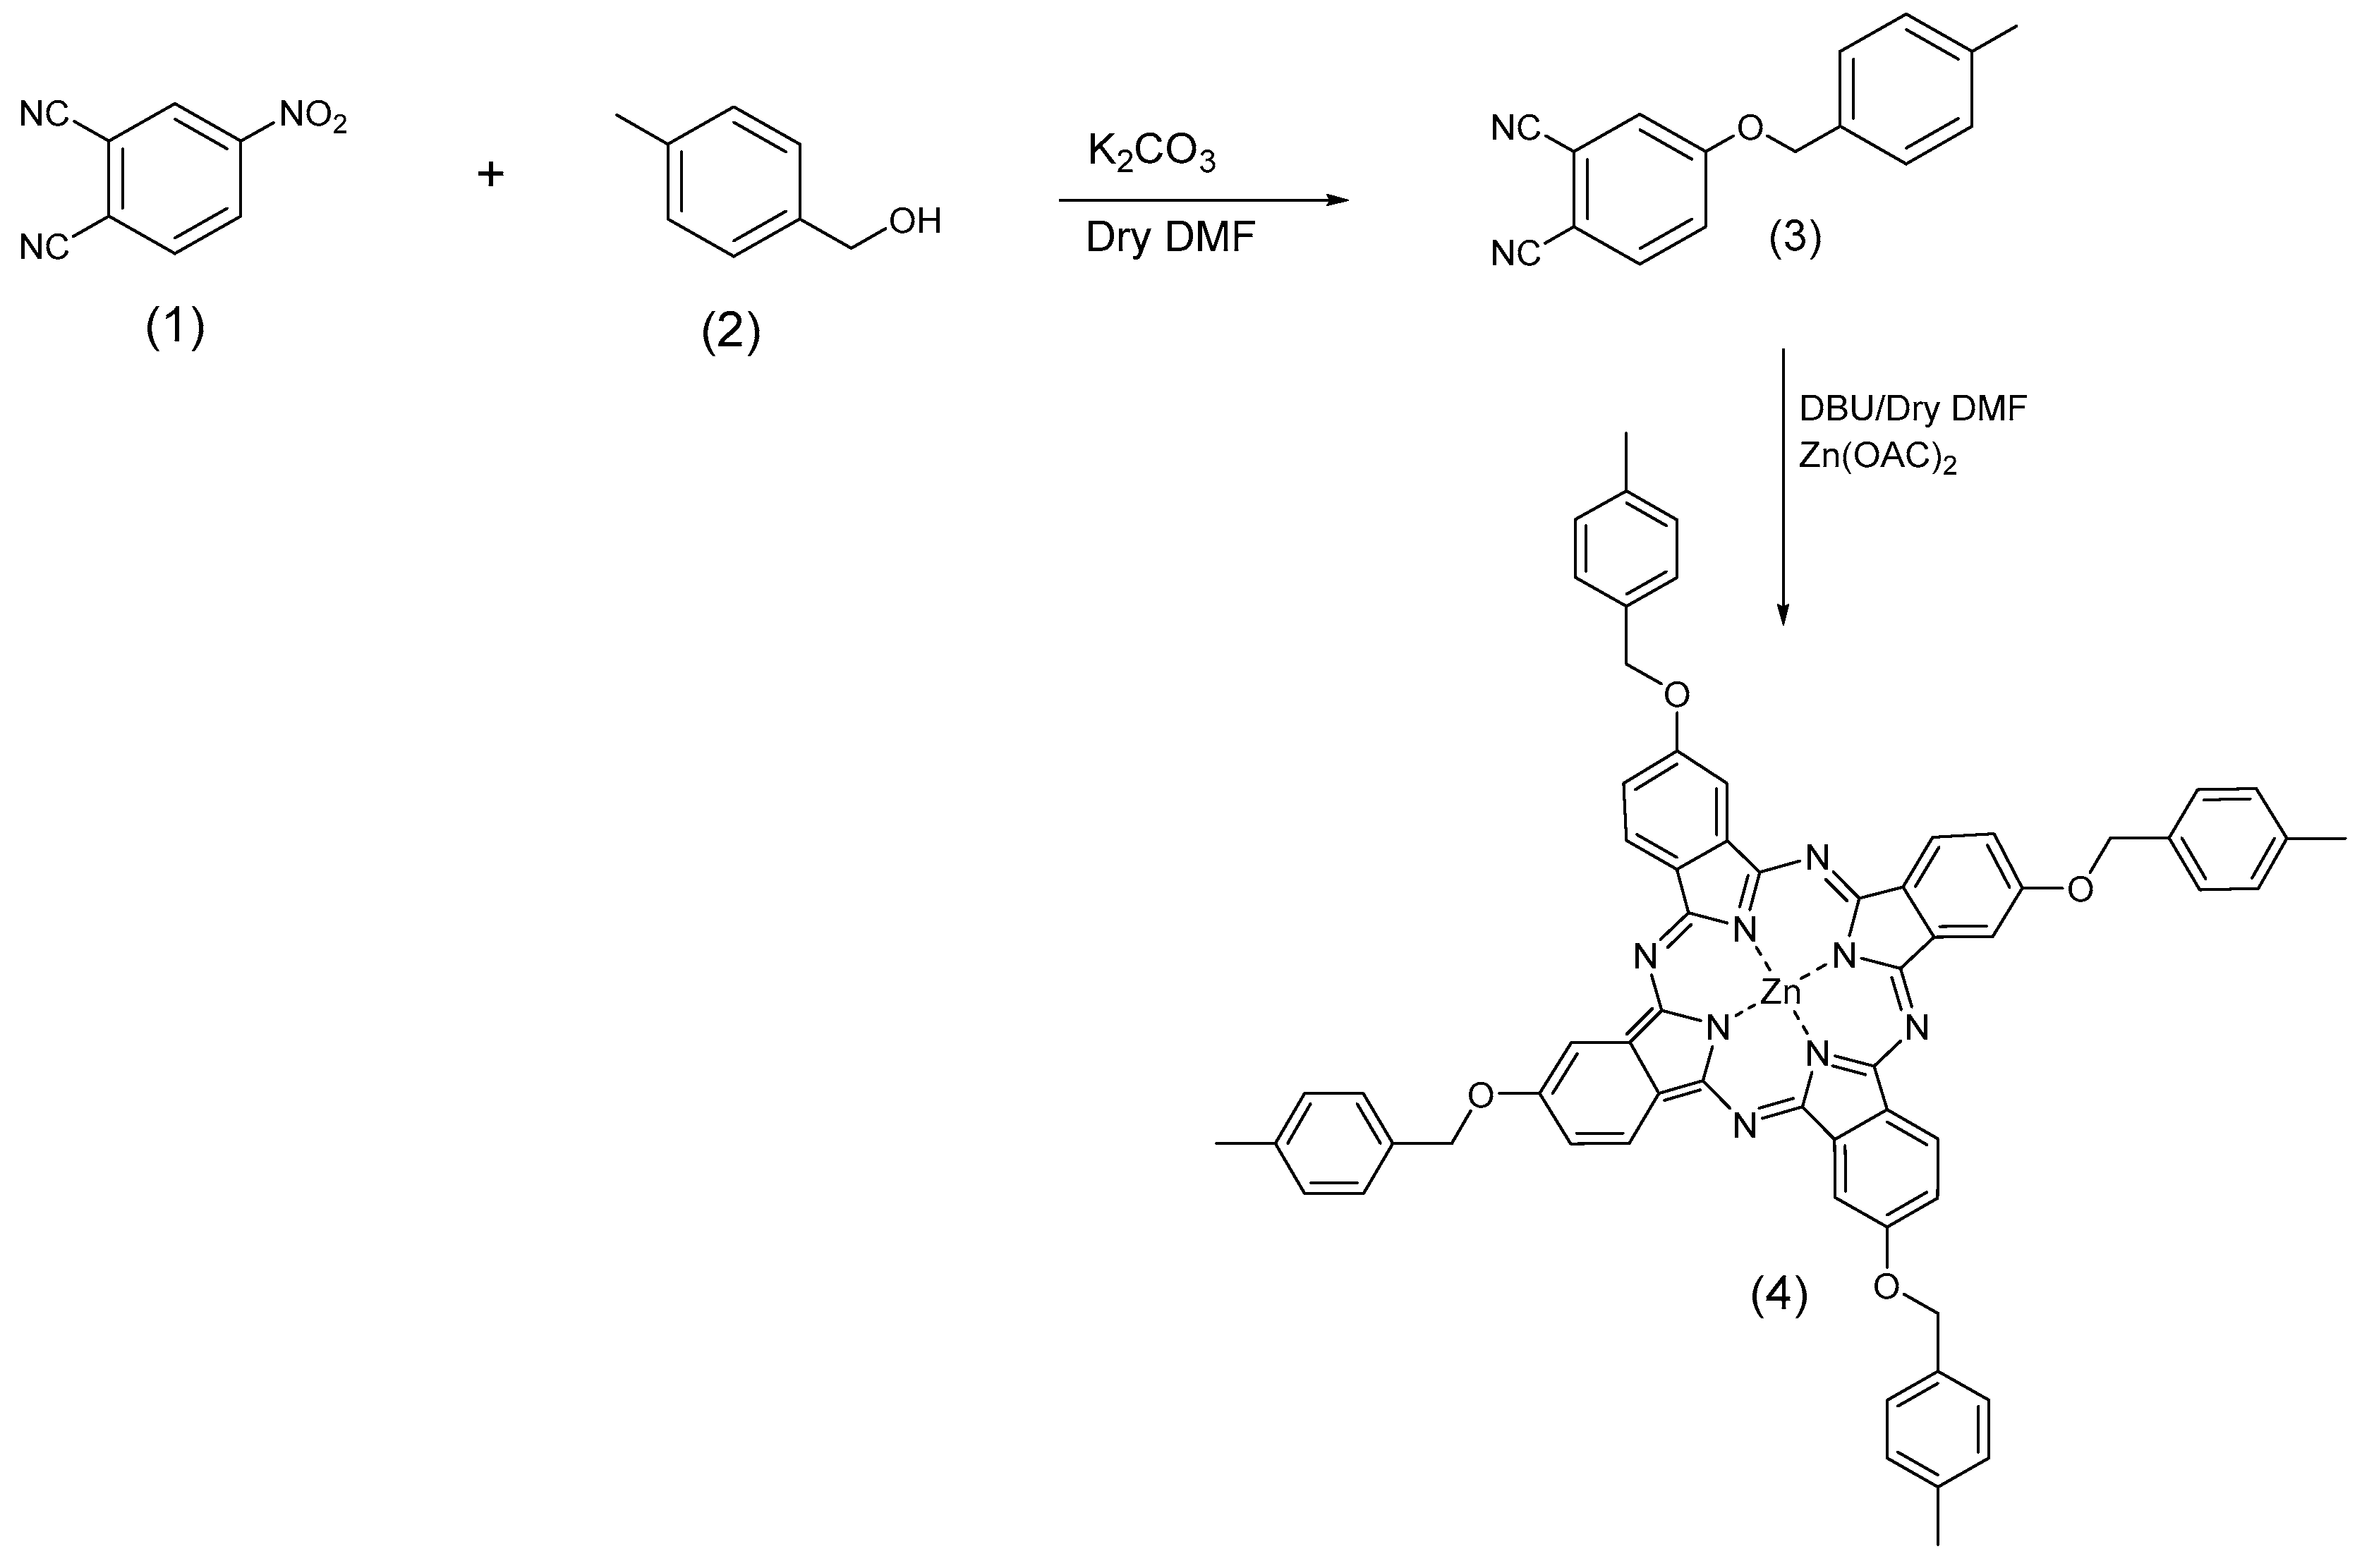
2.1. Dye Synthesis
2.2. Singlet Oxygen Quantum Yield
2.3. Relative Fluorescence Quantum Yield
2.4. Fluorescence Lifetime
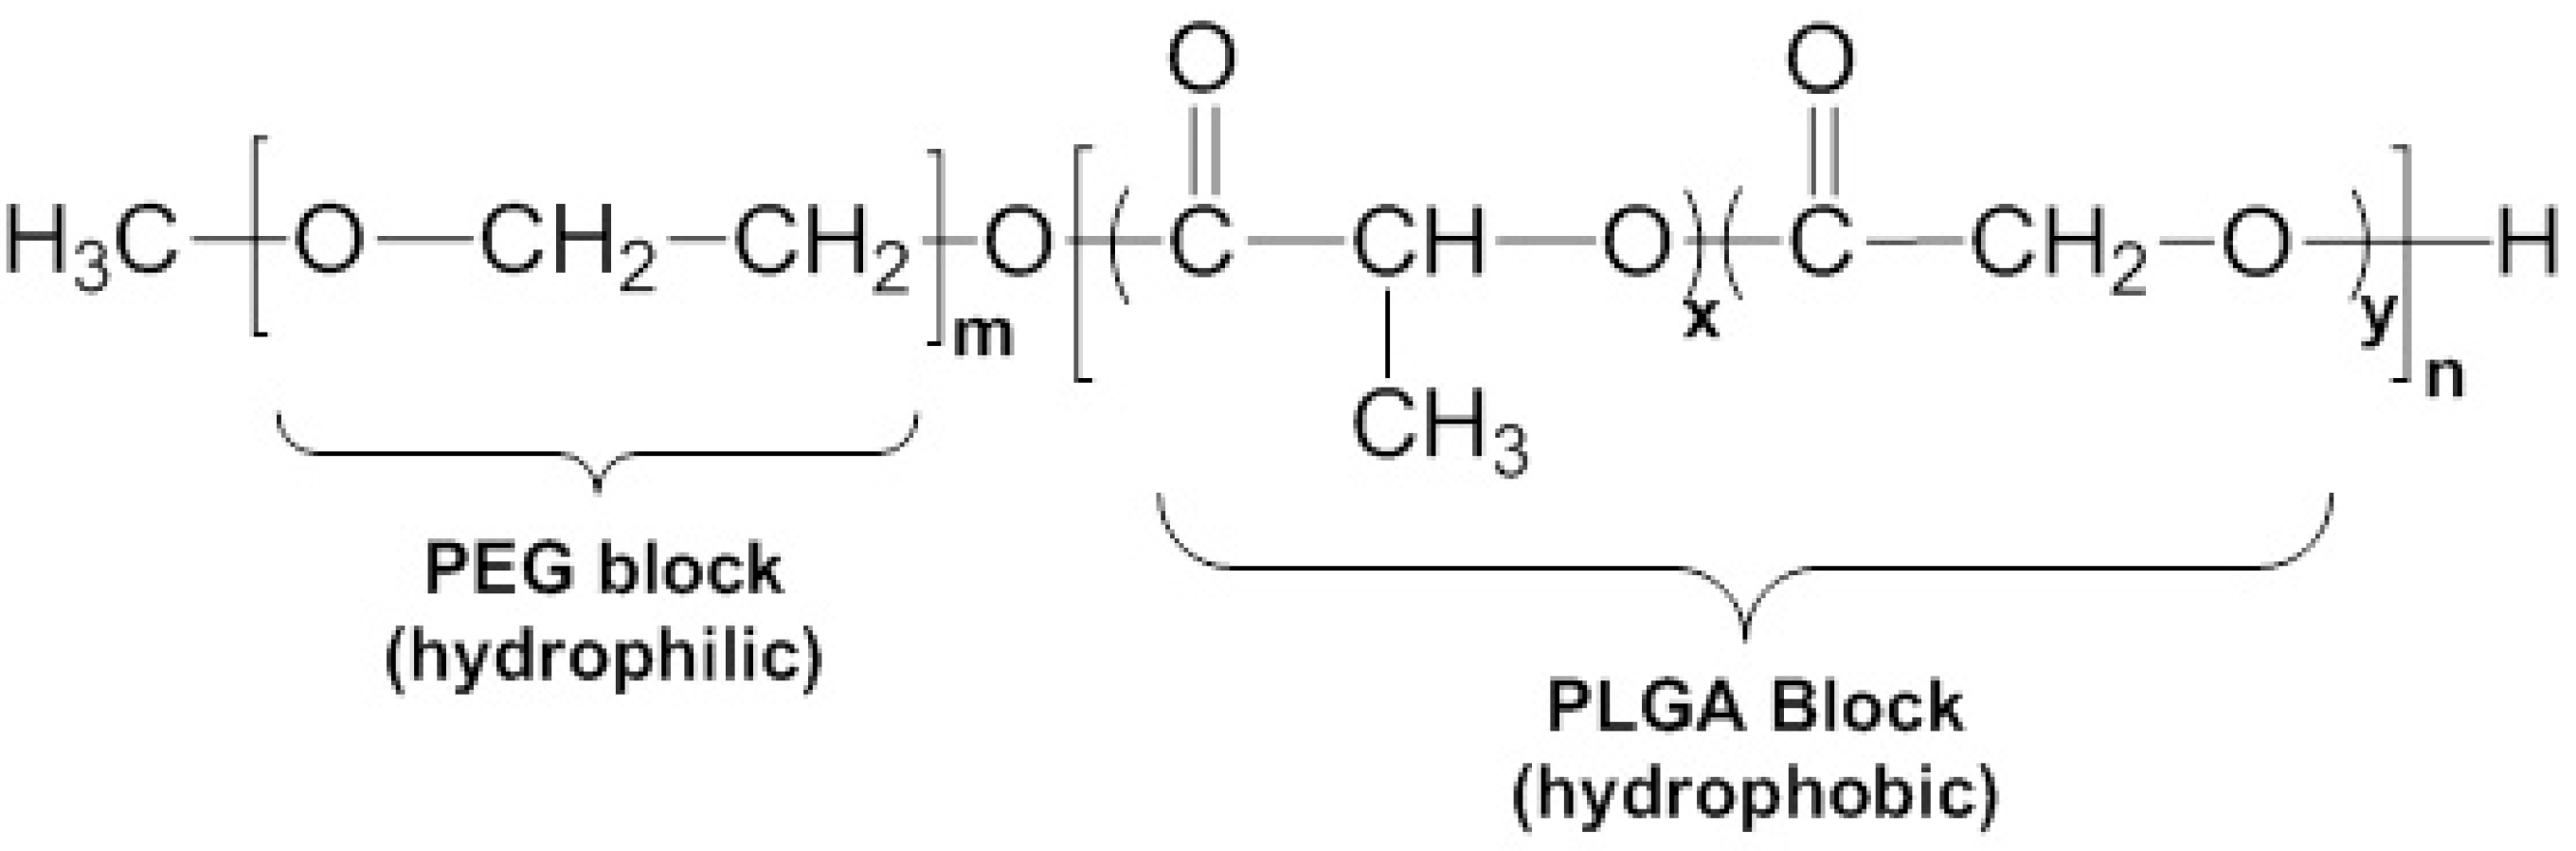
2.5. Polymeric Nanoparticle Preparation
2.6. TEM Measurement
2.7. Dynamic Light Scattering and Zeta Potential
2.8. Sensitizer Load and Entrapment Efficiency
2.9. Qualitative Analysis of Dye Lipophilicity
2.10. Cellular Uptake and Subcellular Distribution of Free and Encapsulated Dyes in A549 Cells
2.11. Dark and PDT Toxicity Assays
2.12. Statistical Analysis
3. Results and Discussion
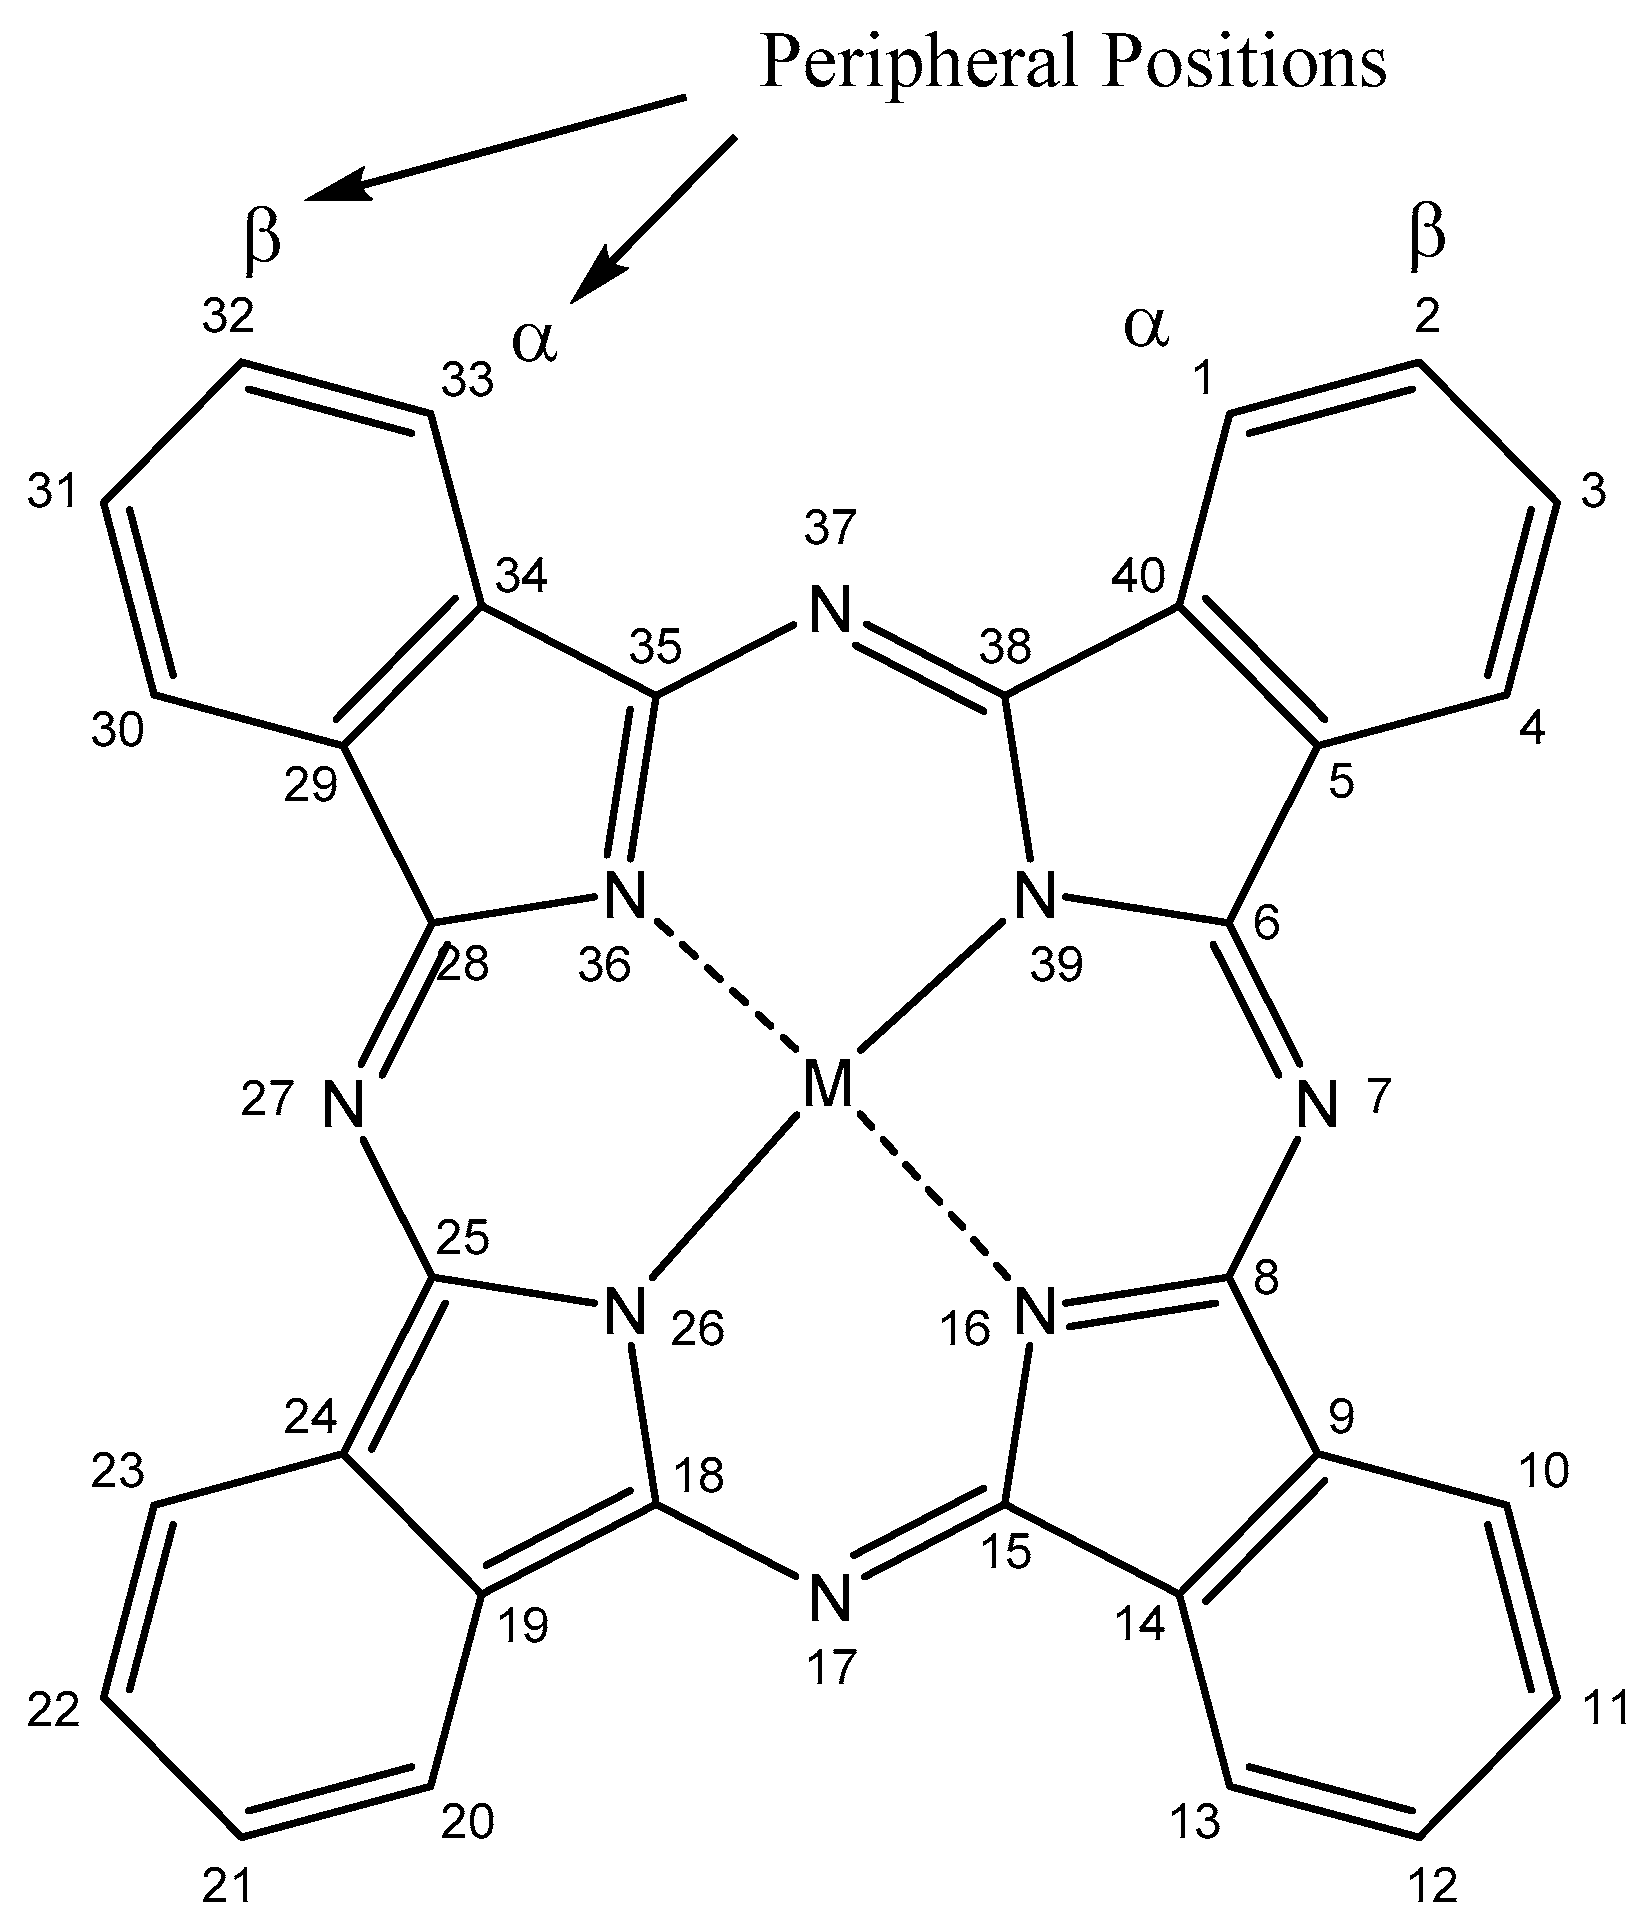
3.1. Synthesis
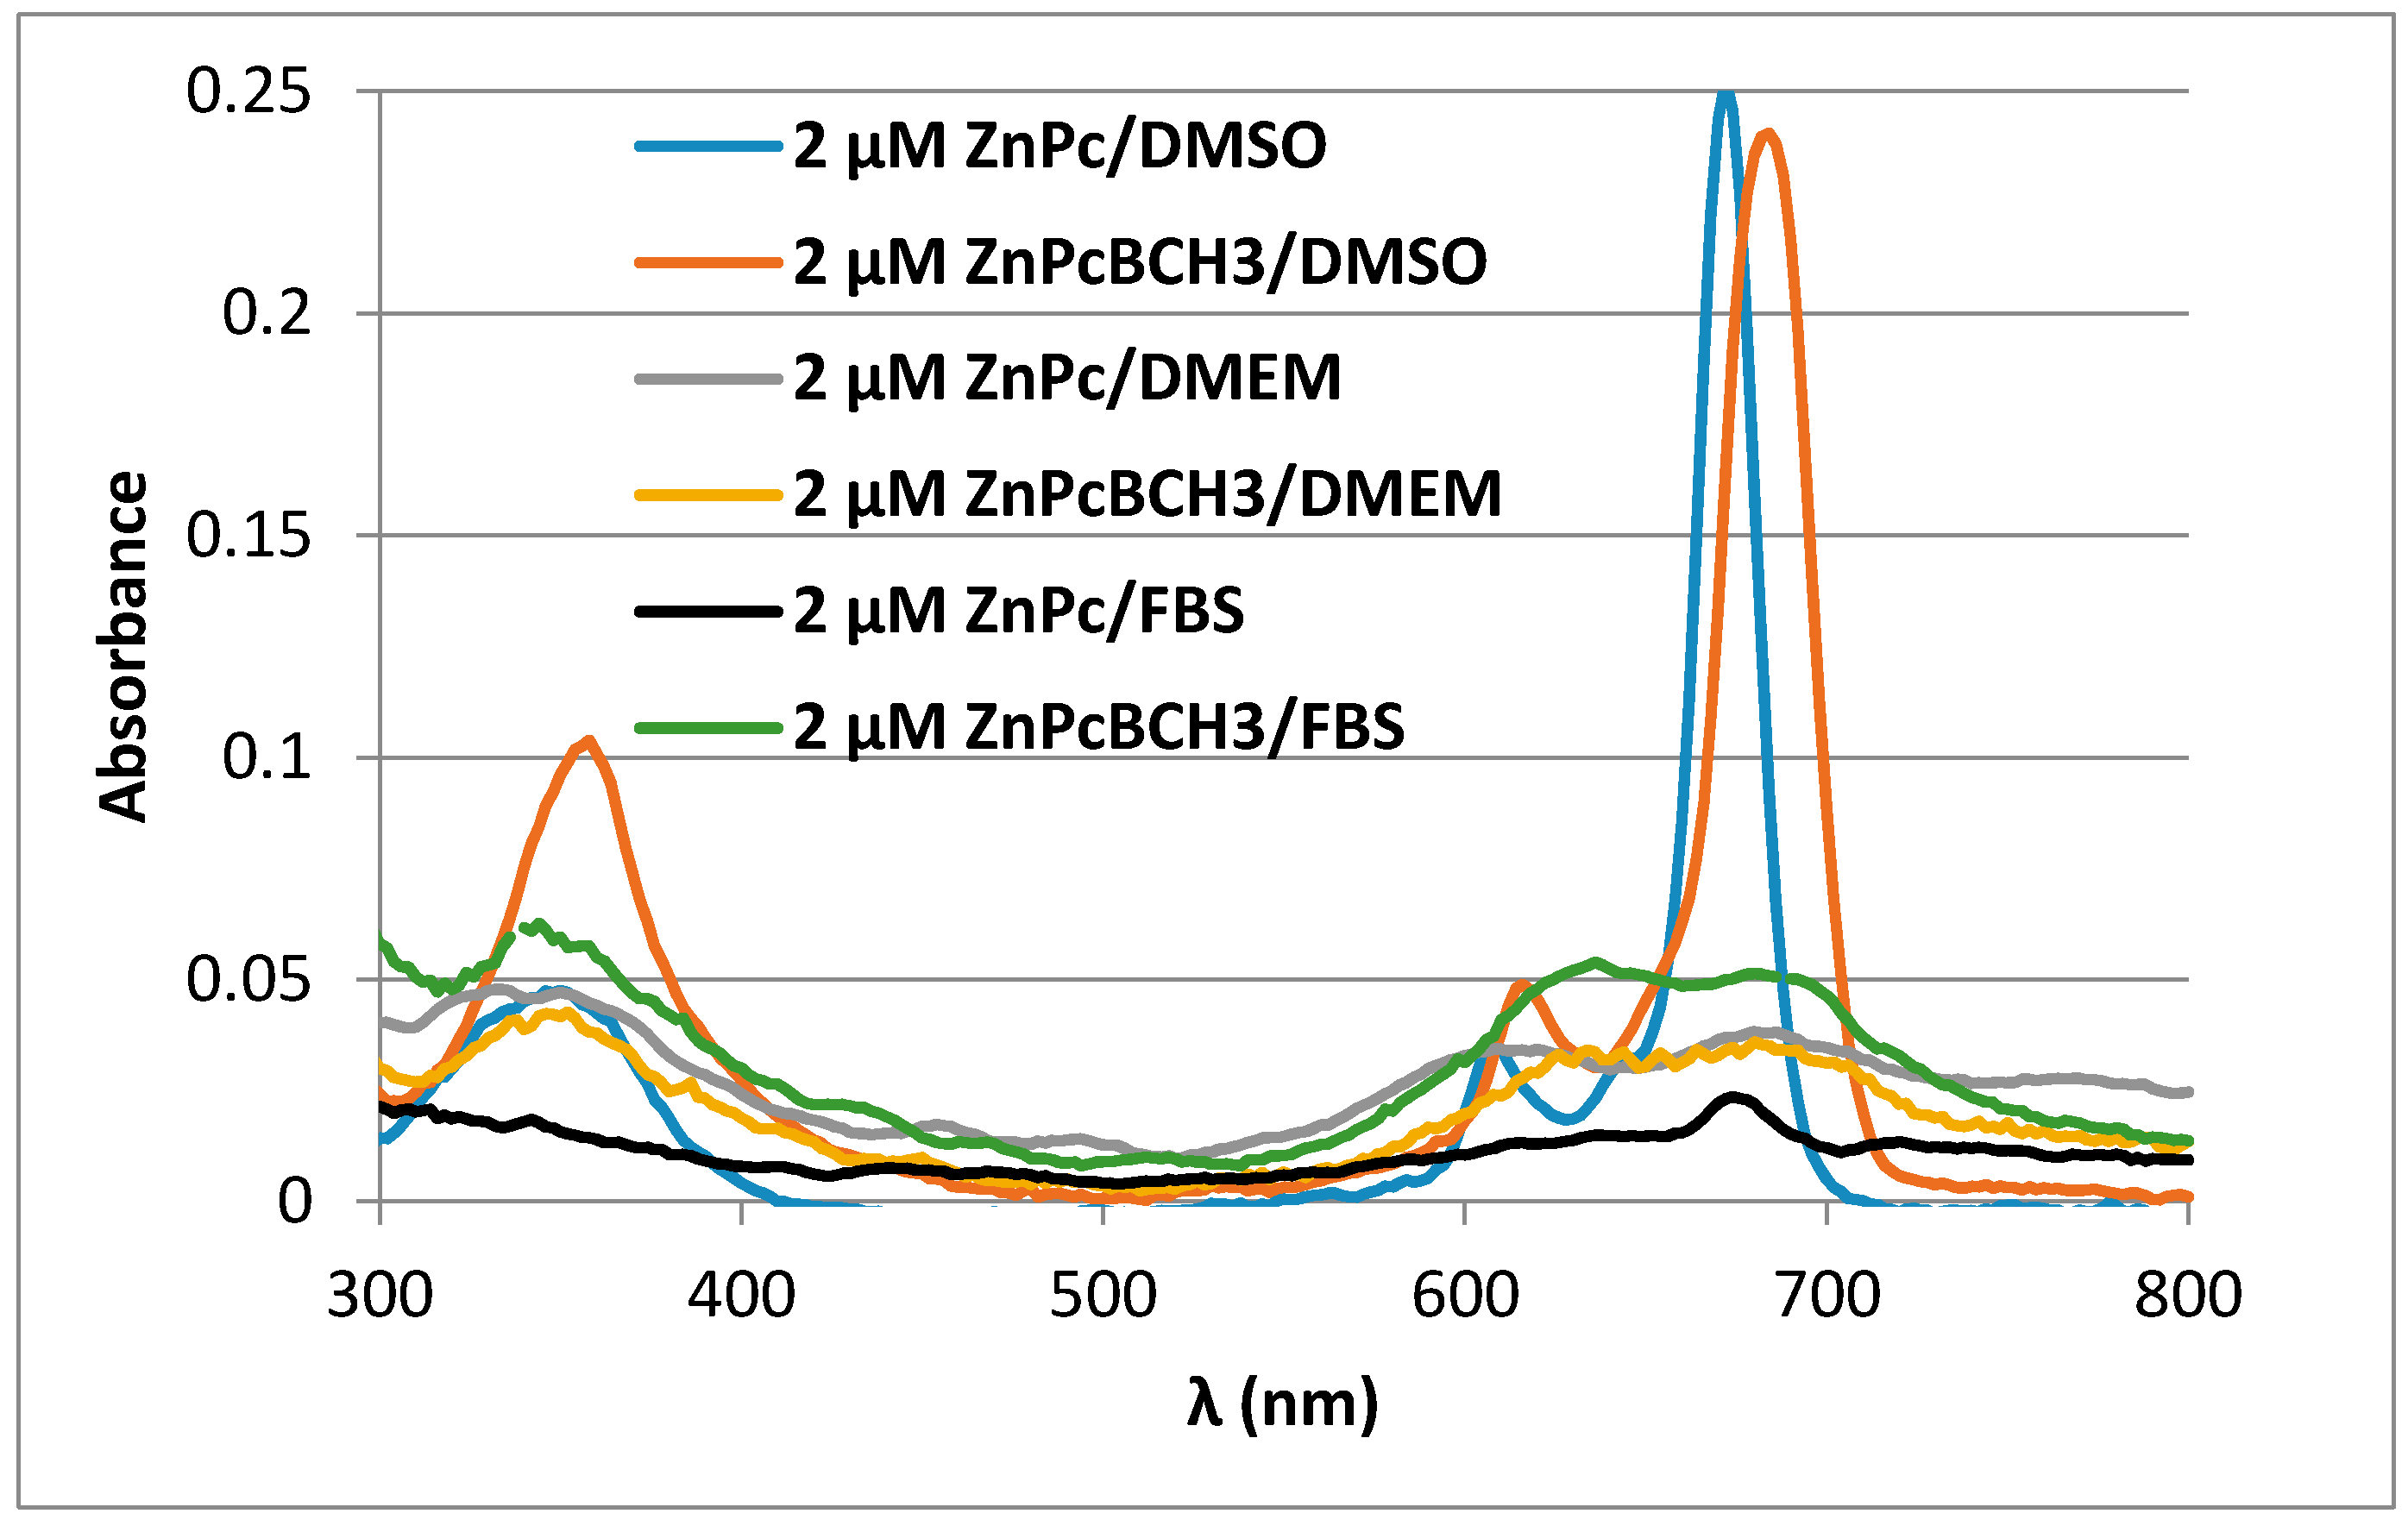
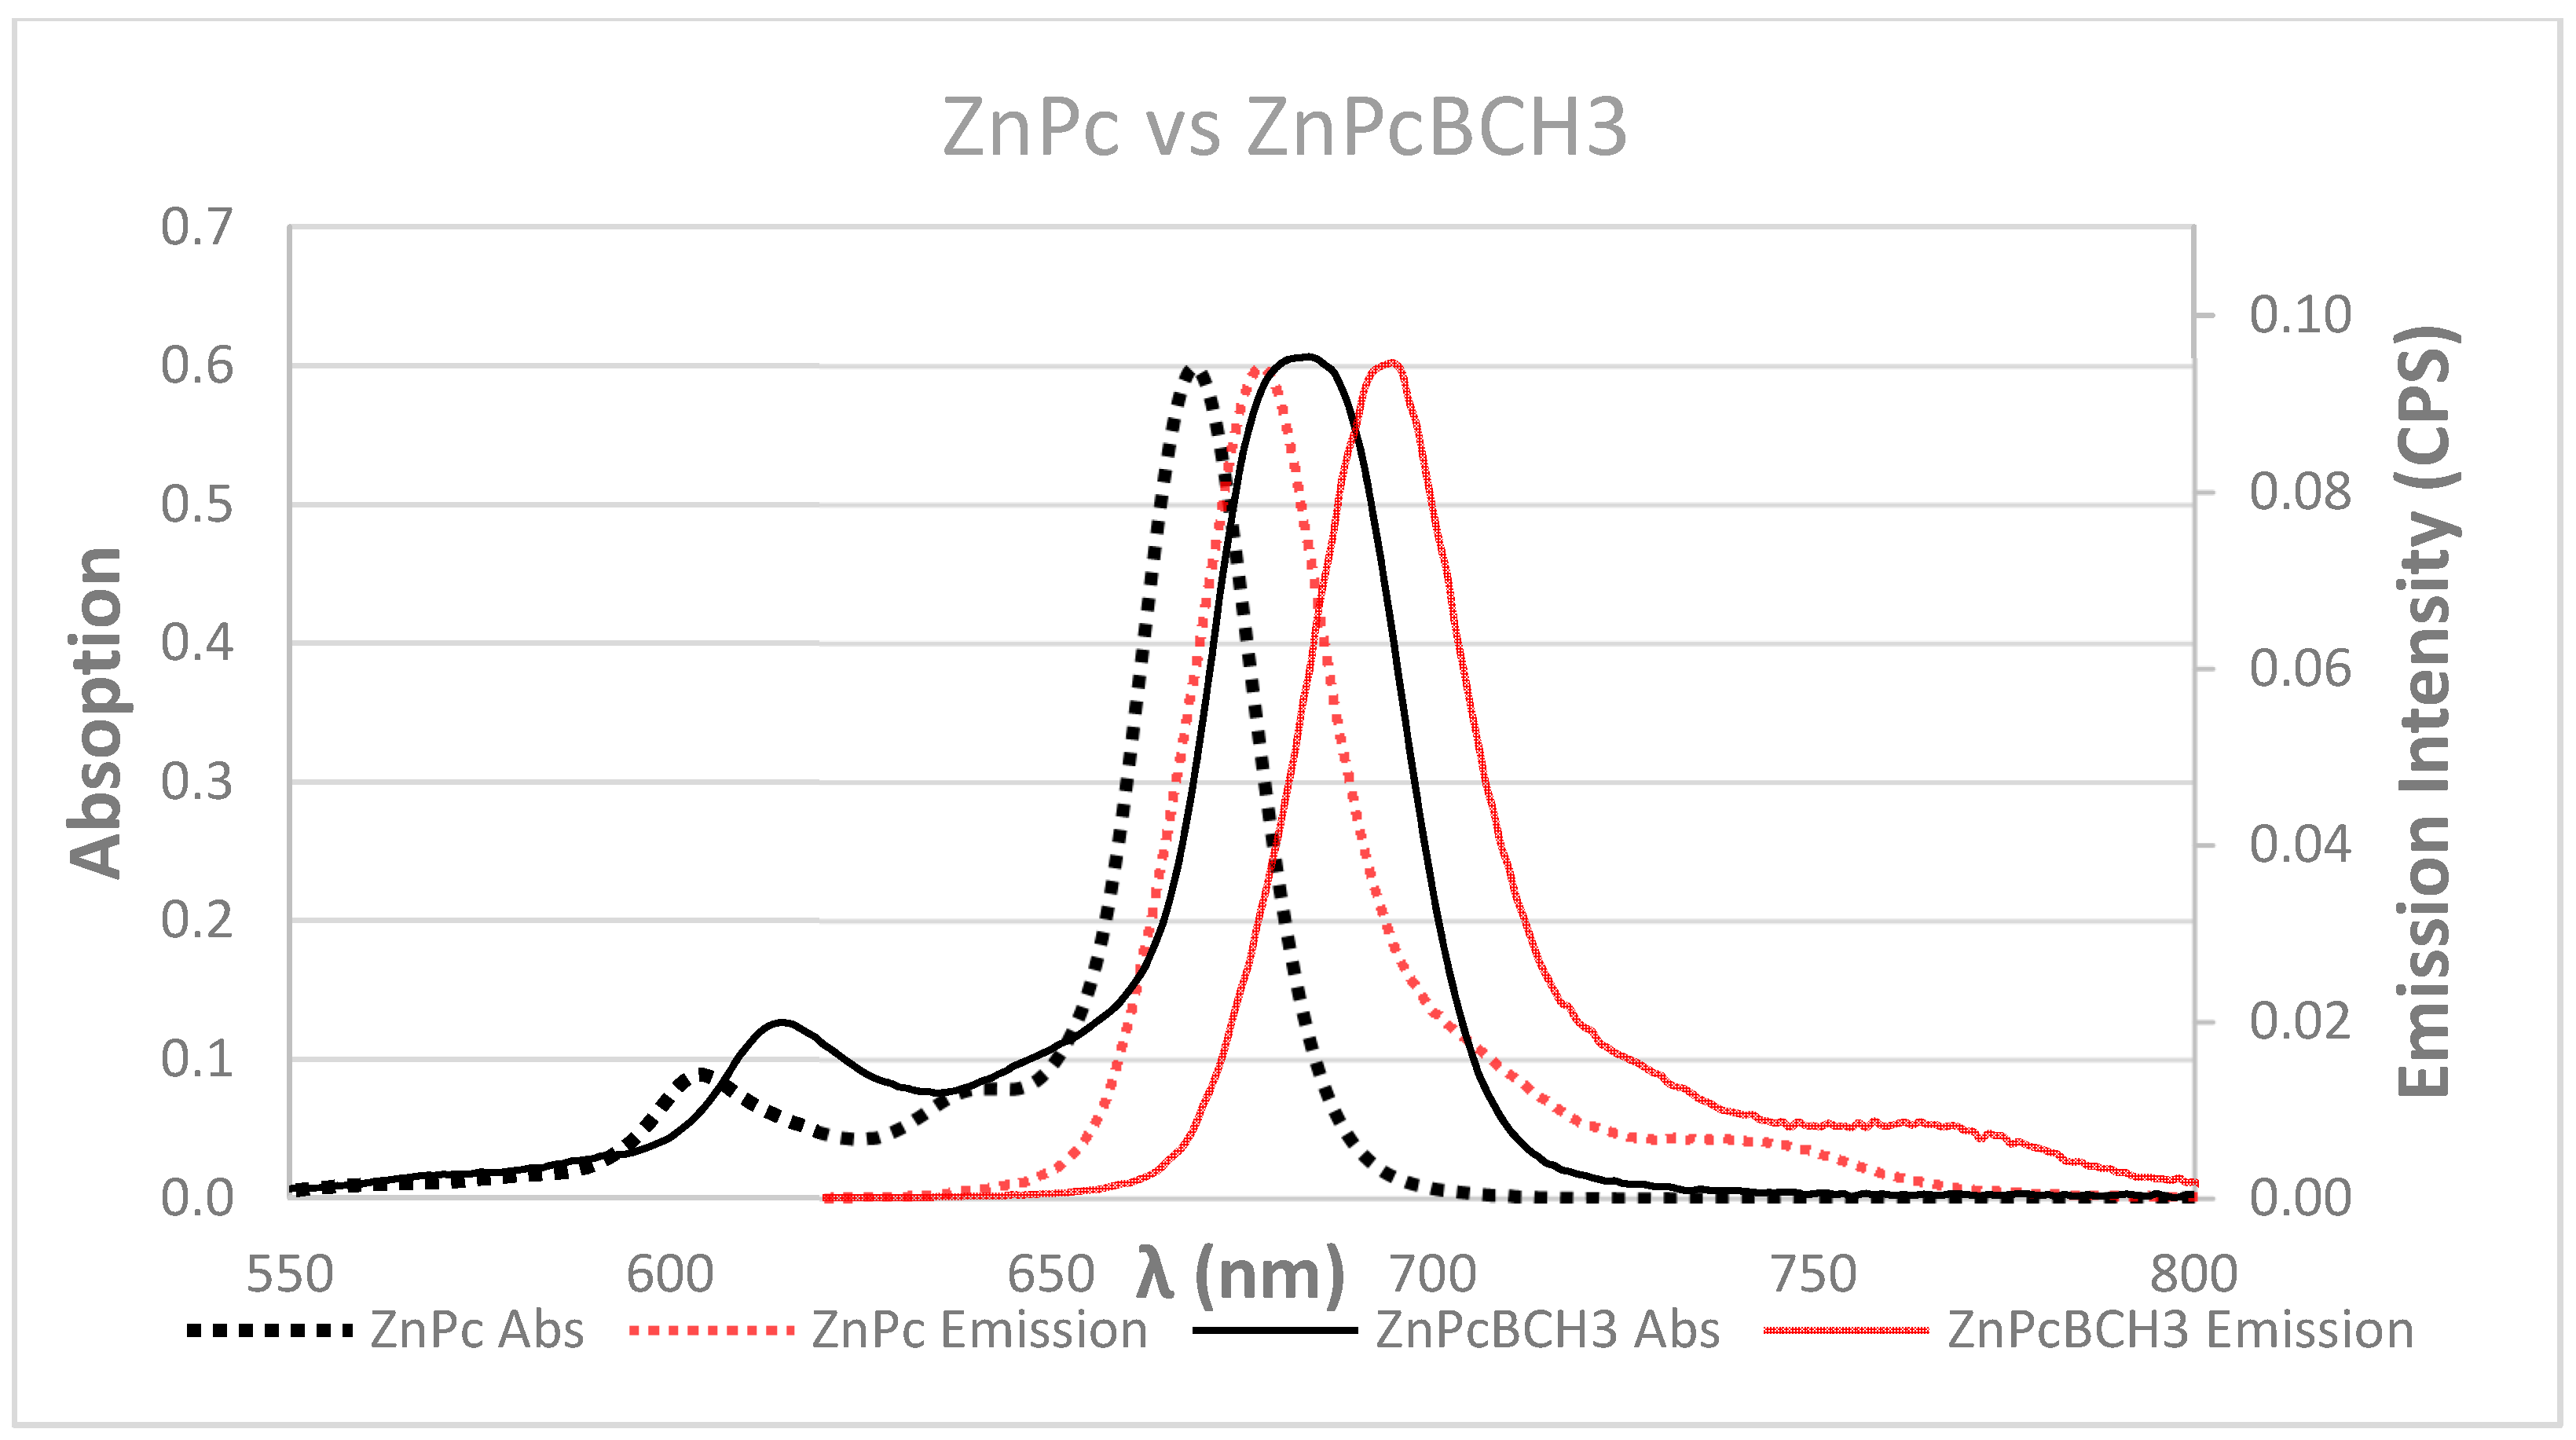
3.2. Photophysical and Photochemical Properties
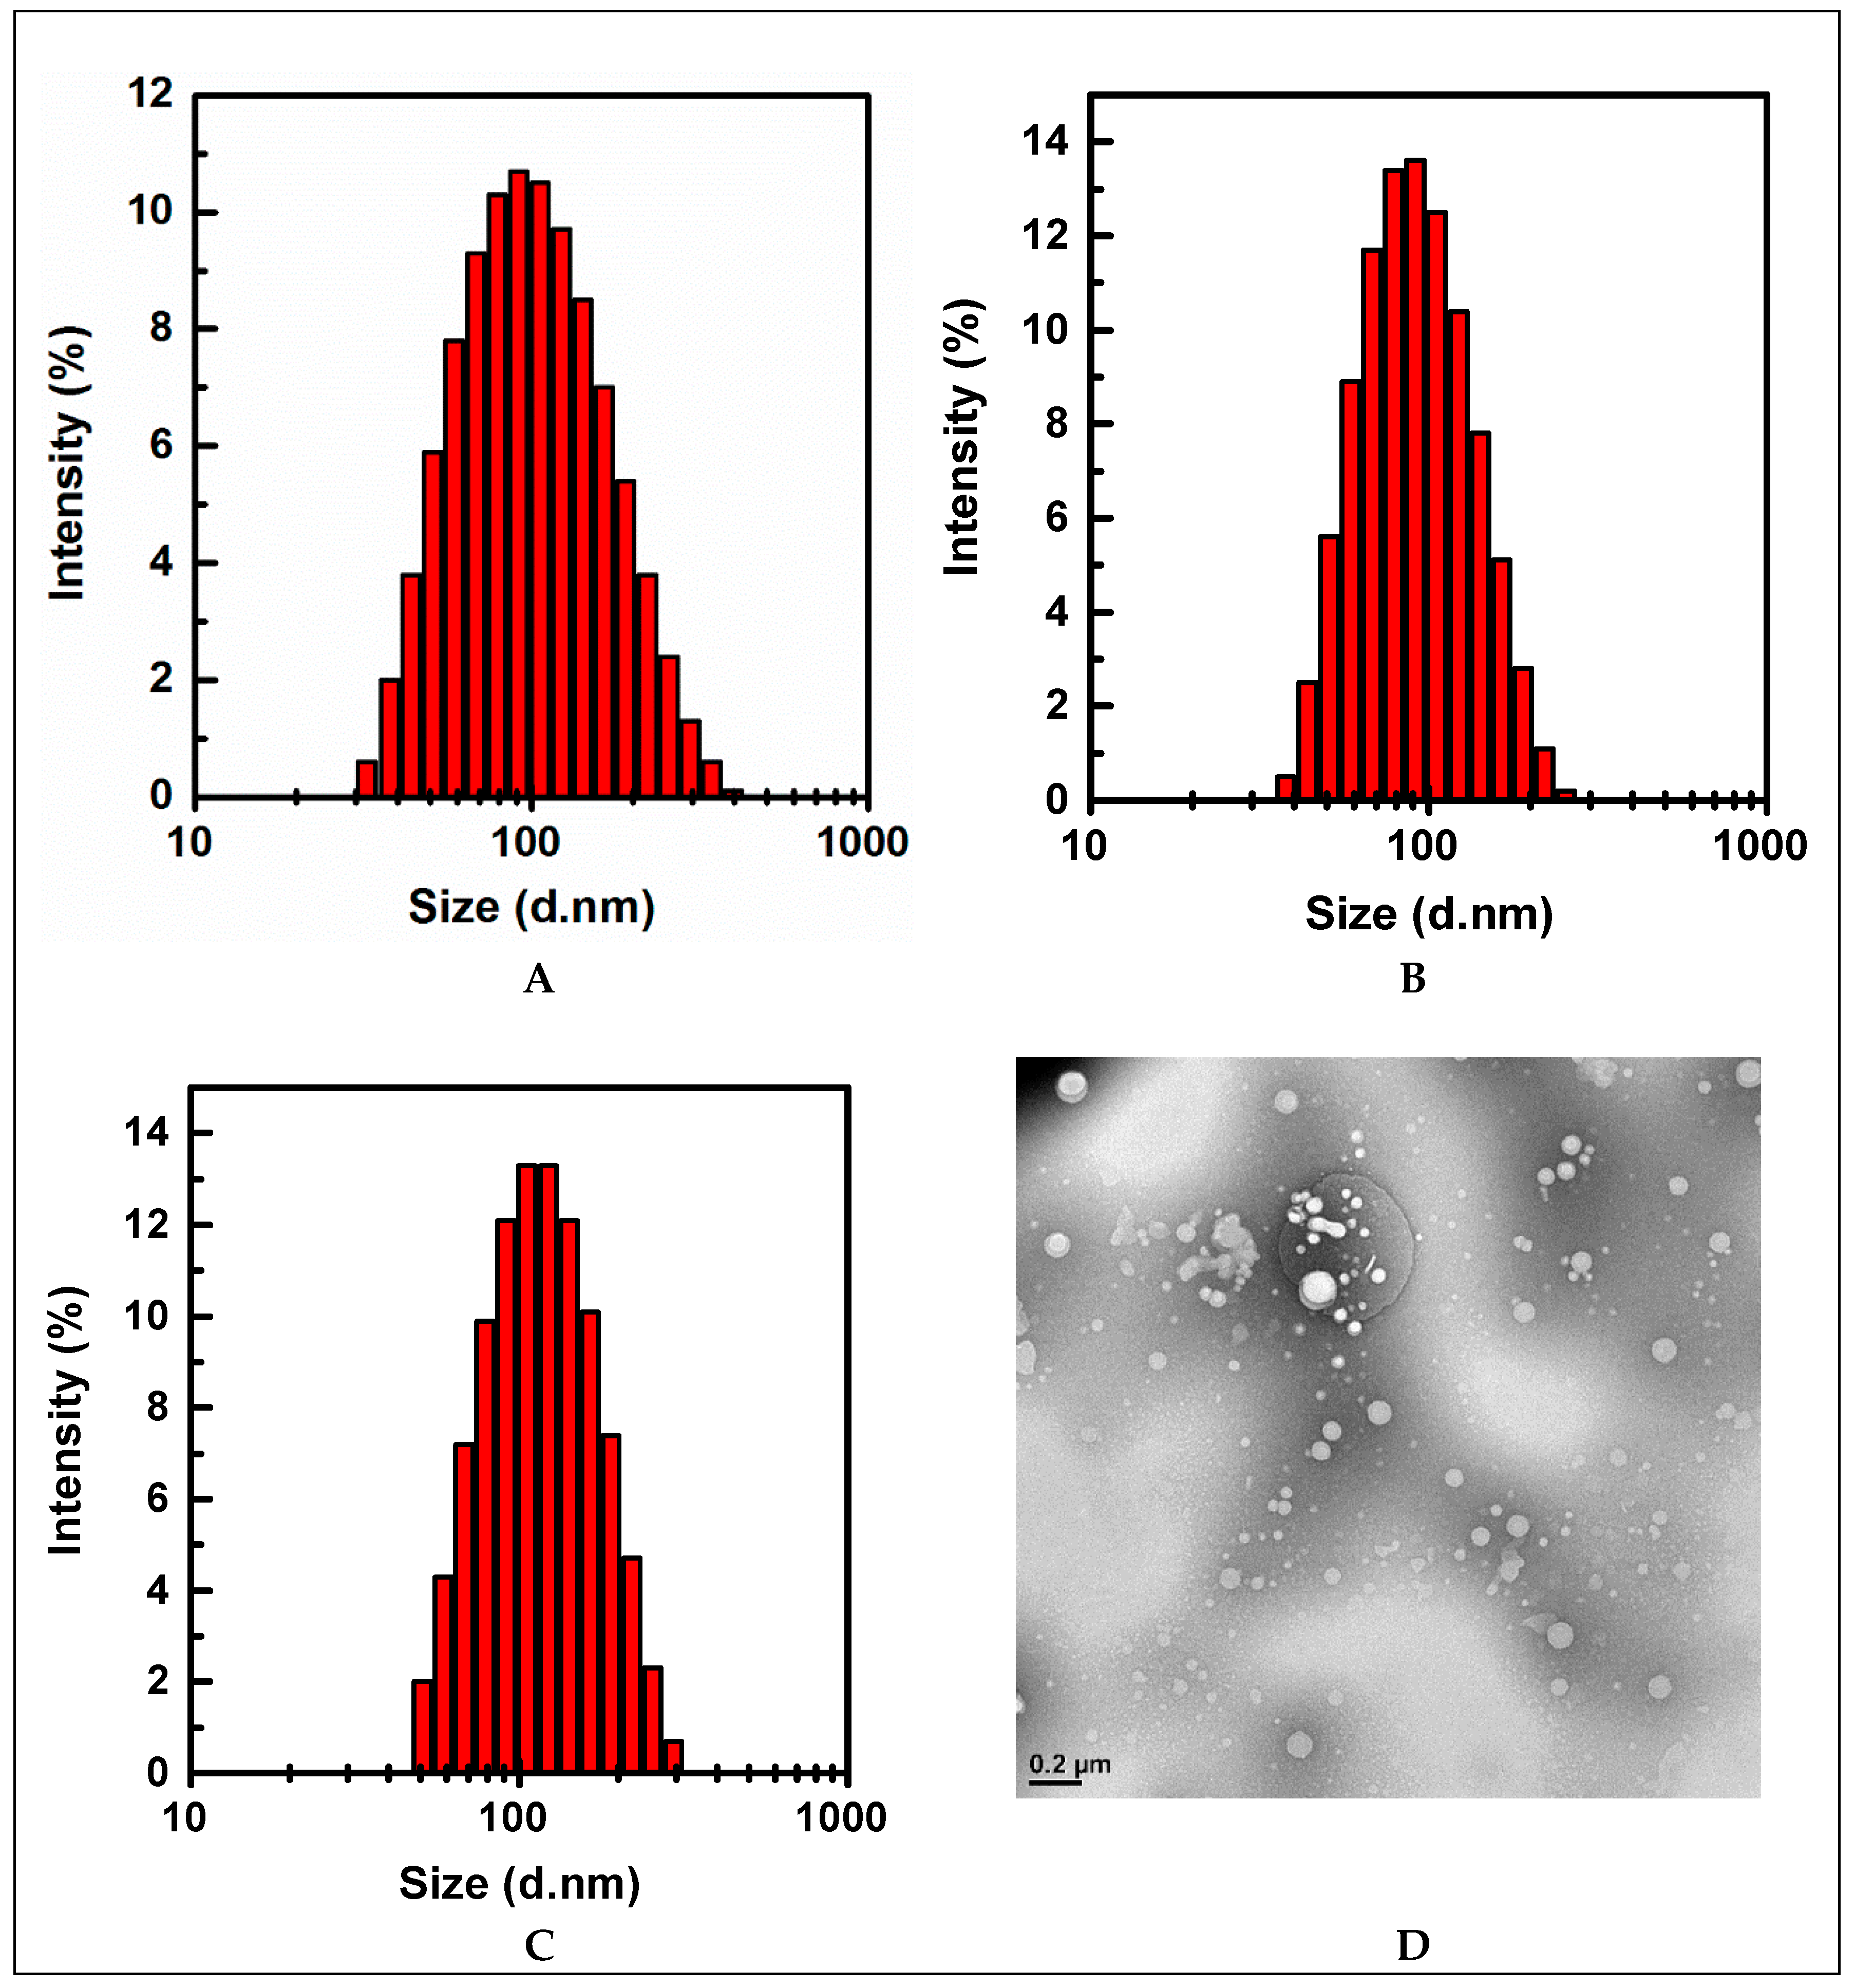
3.3. Characterization of Nanoparticles
3.4. Lipophilicity of ZnPcBCH3 and ZnPc
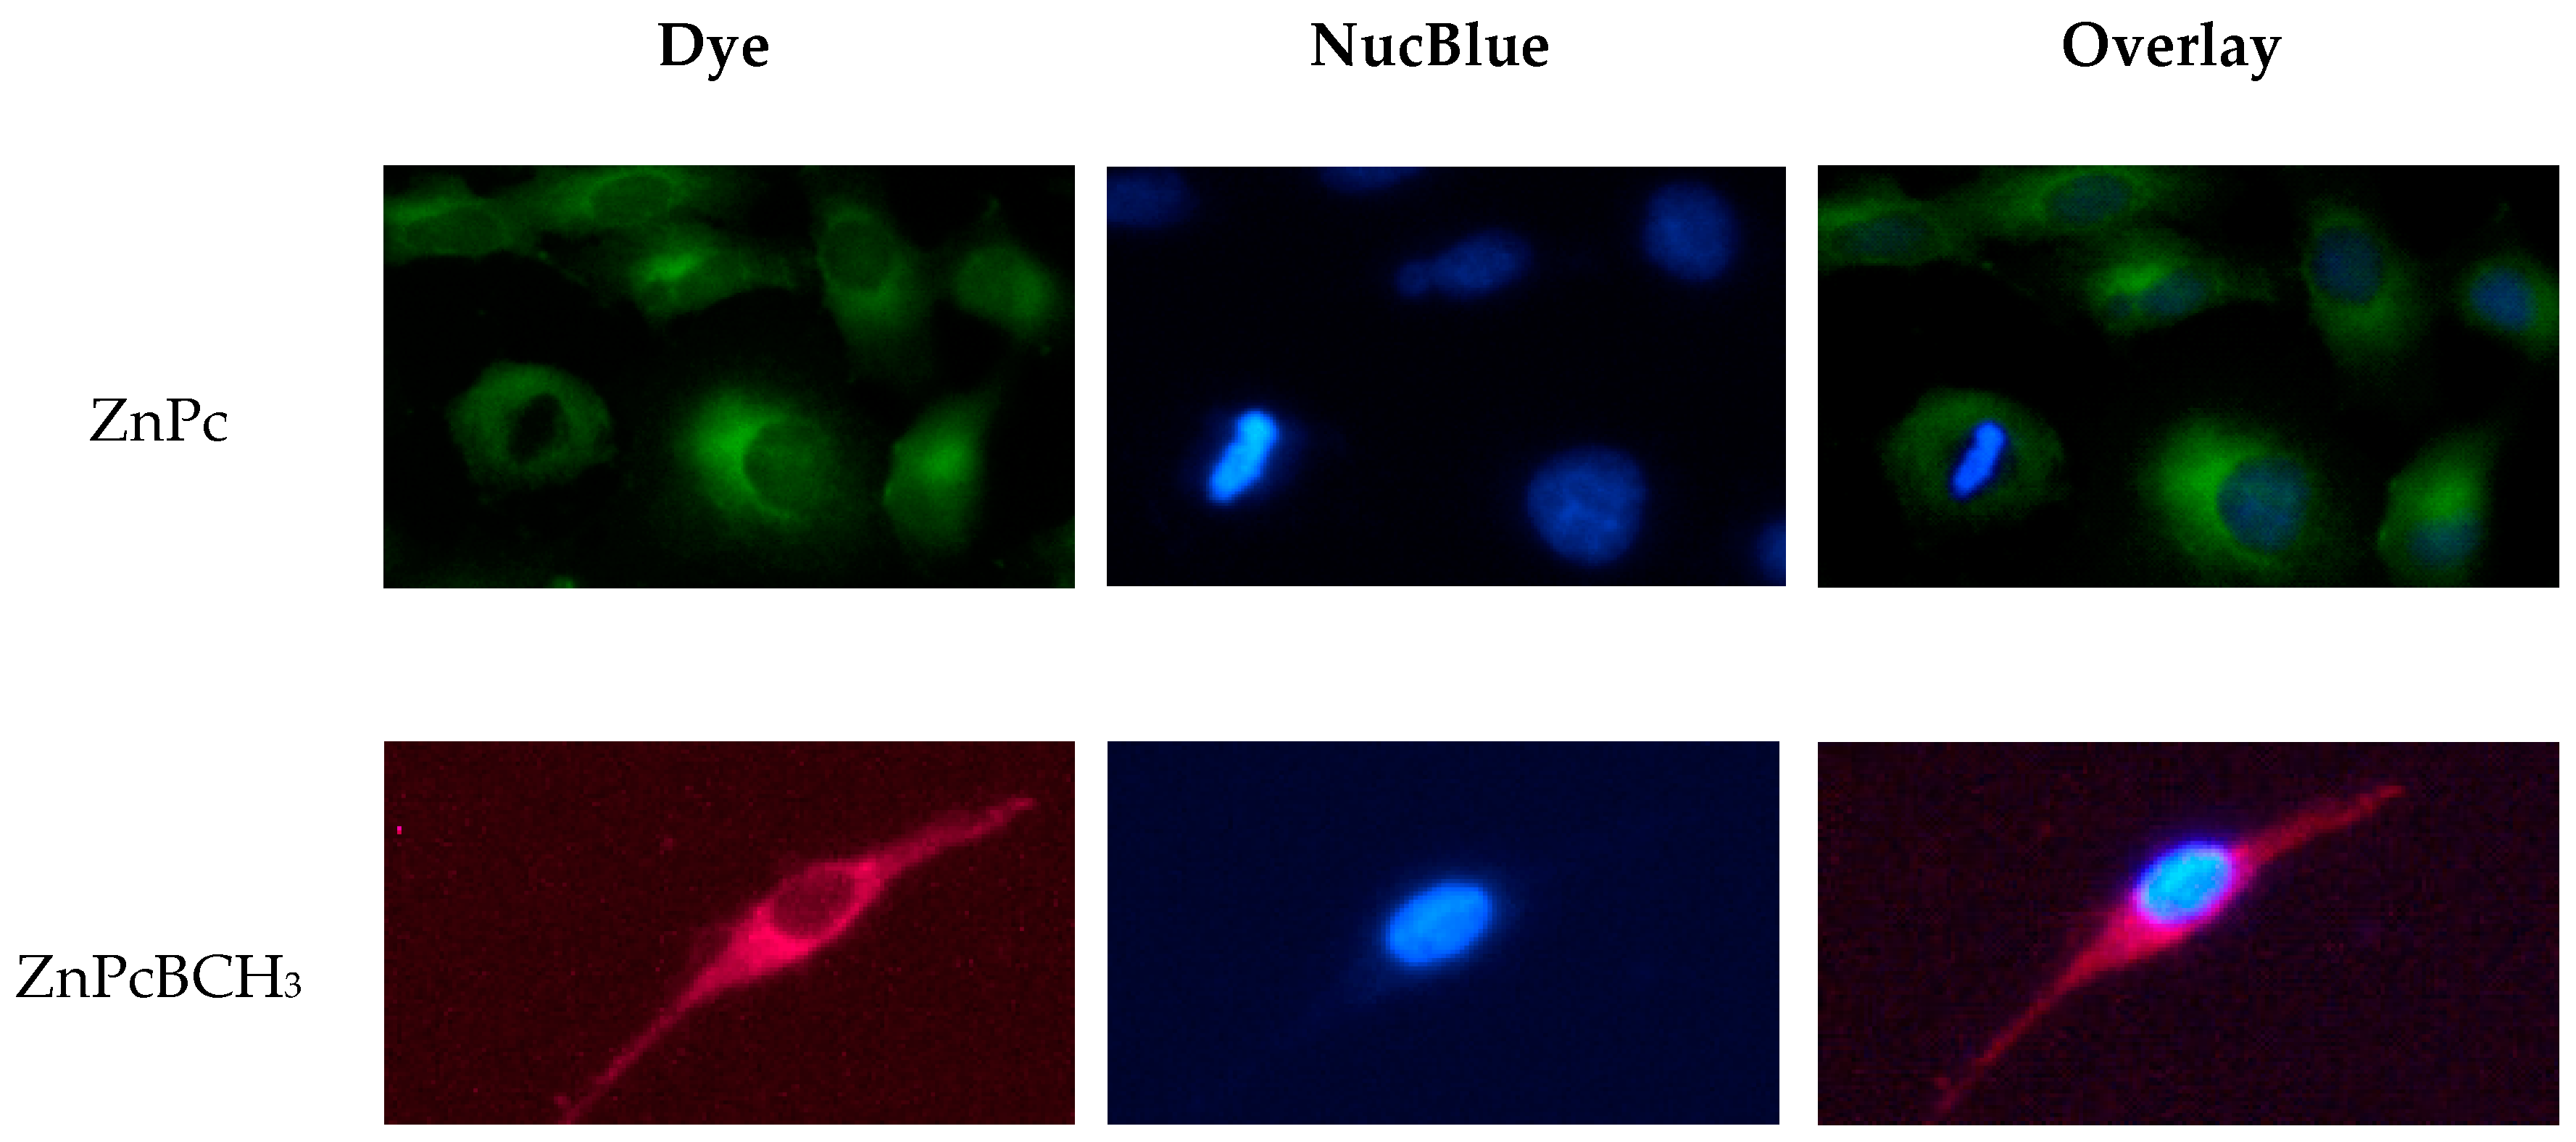
3.5. Localization of ZnPc and ZnPcBCH3 in A549 Cells
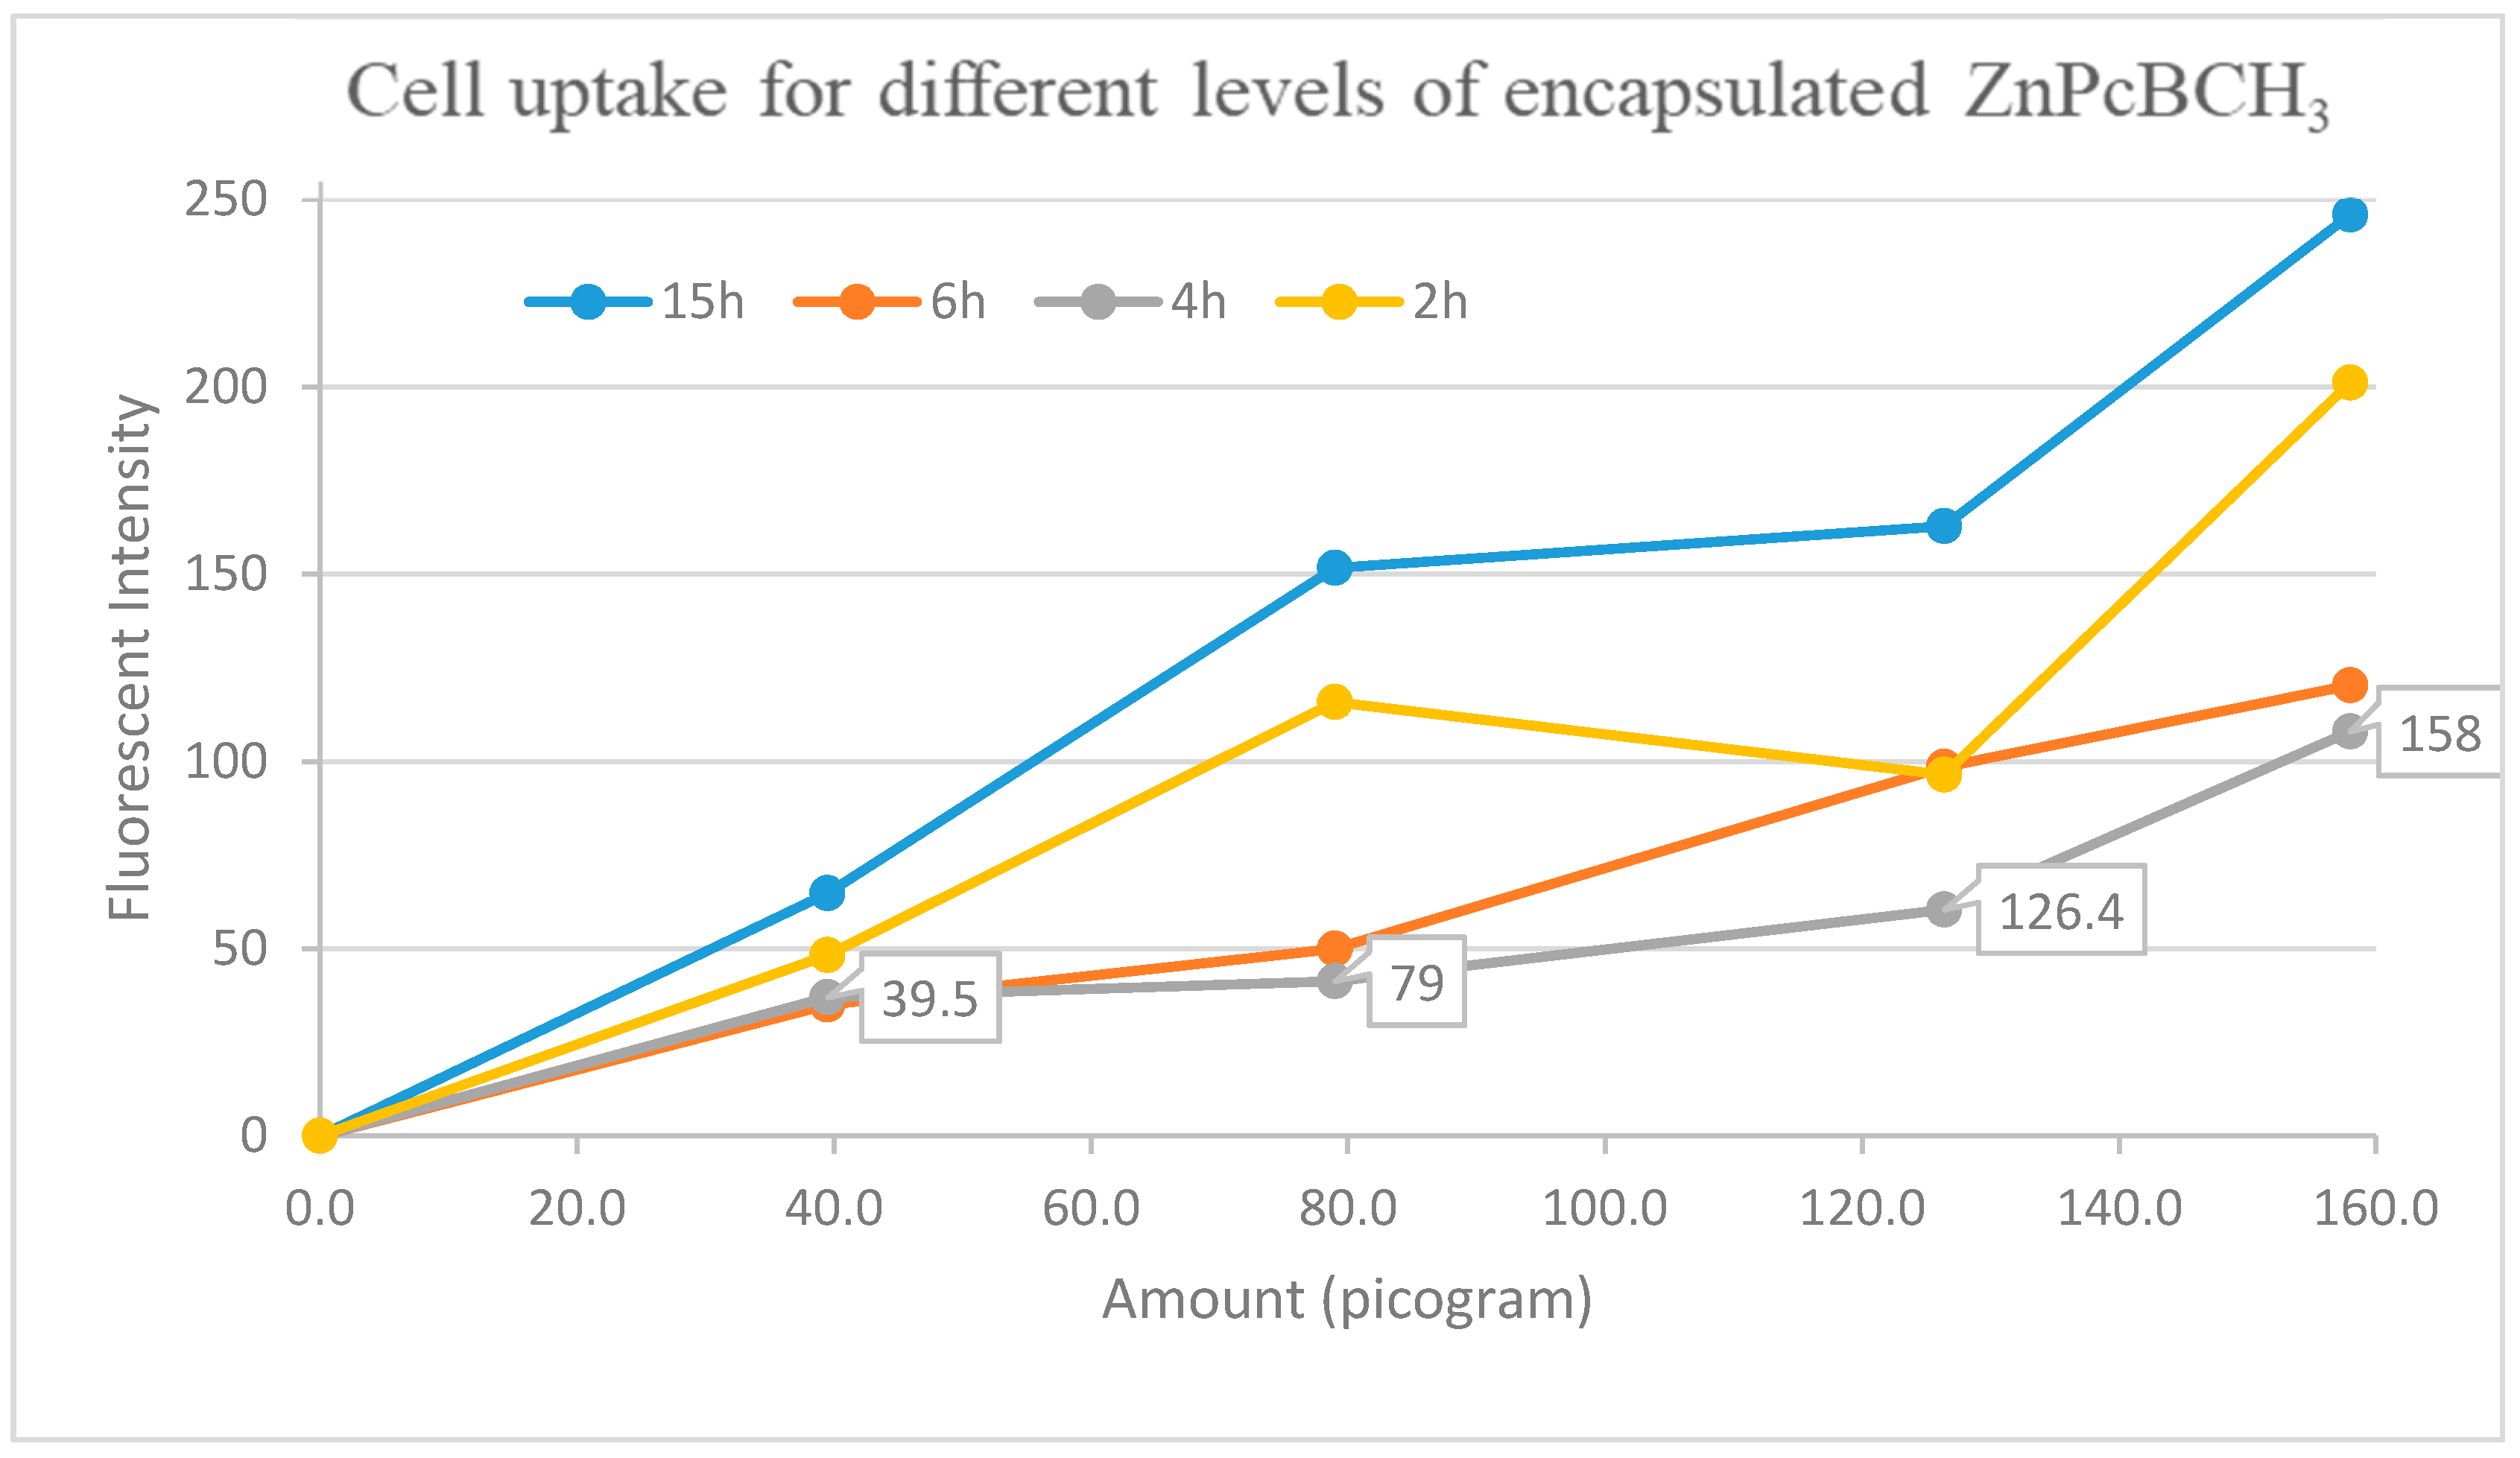
3.6. Cell Uptake
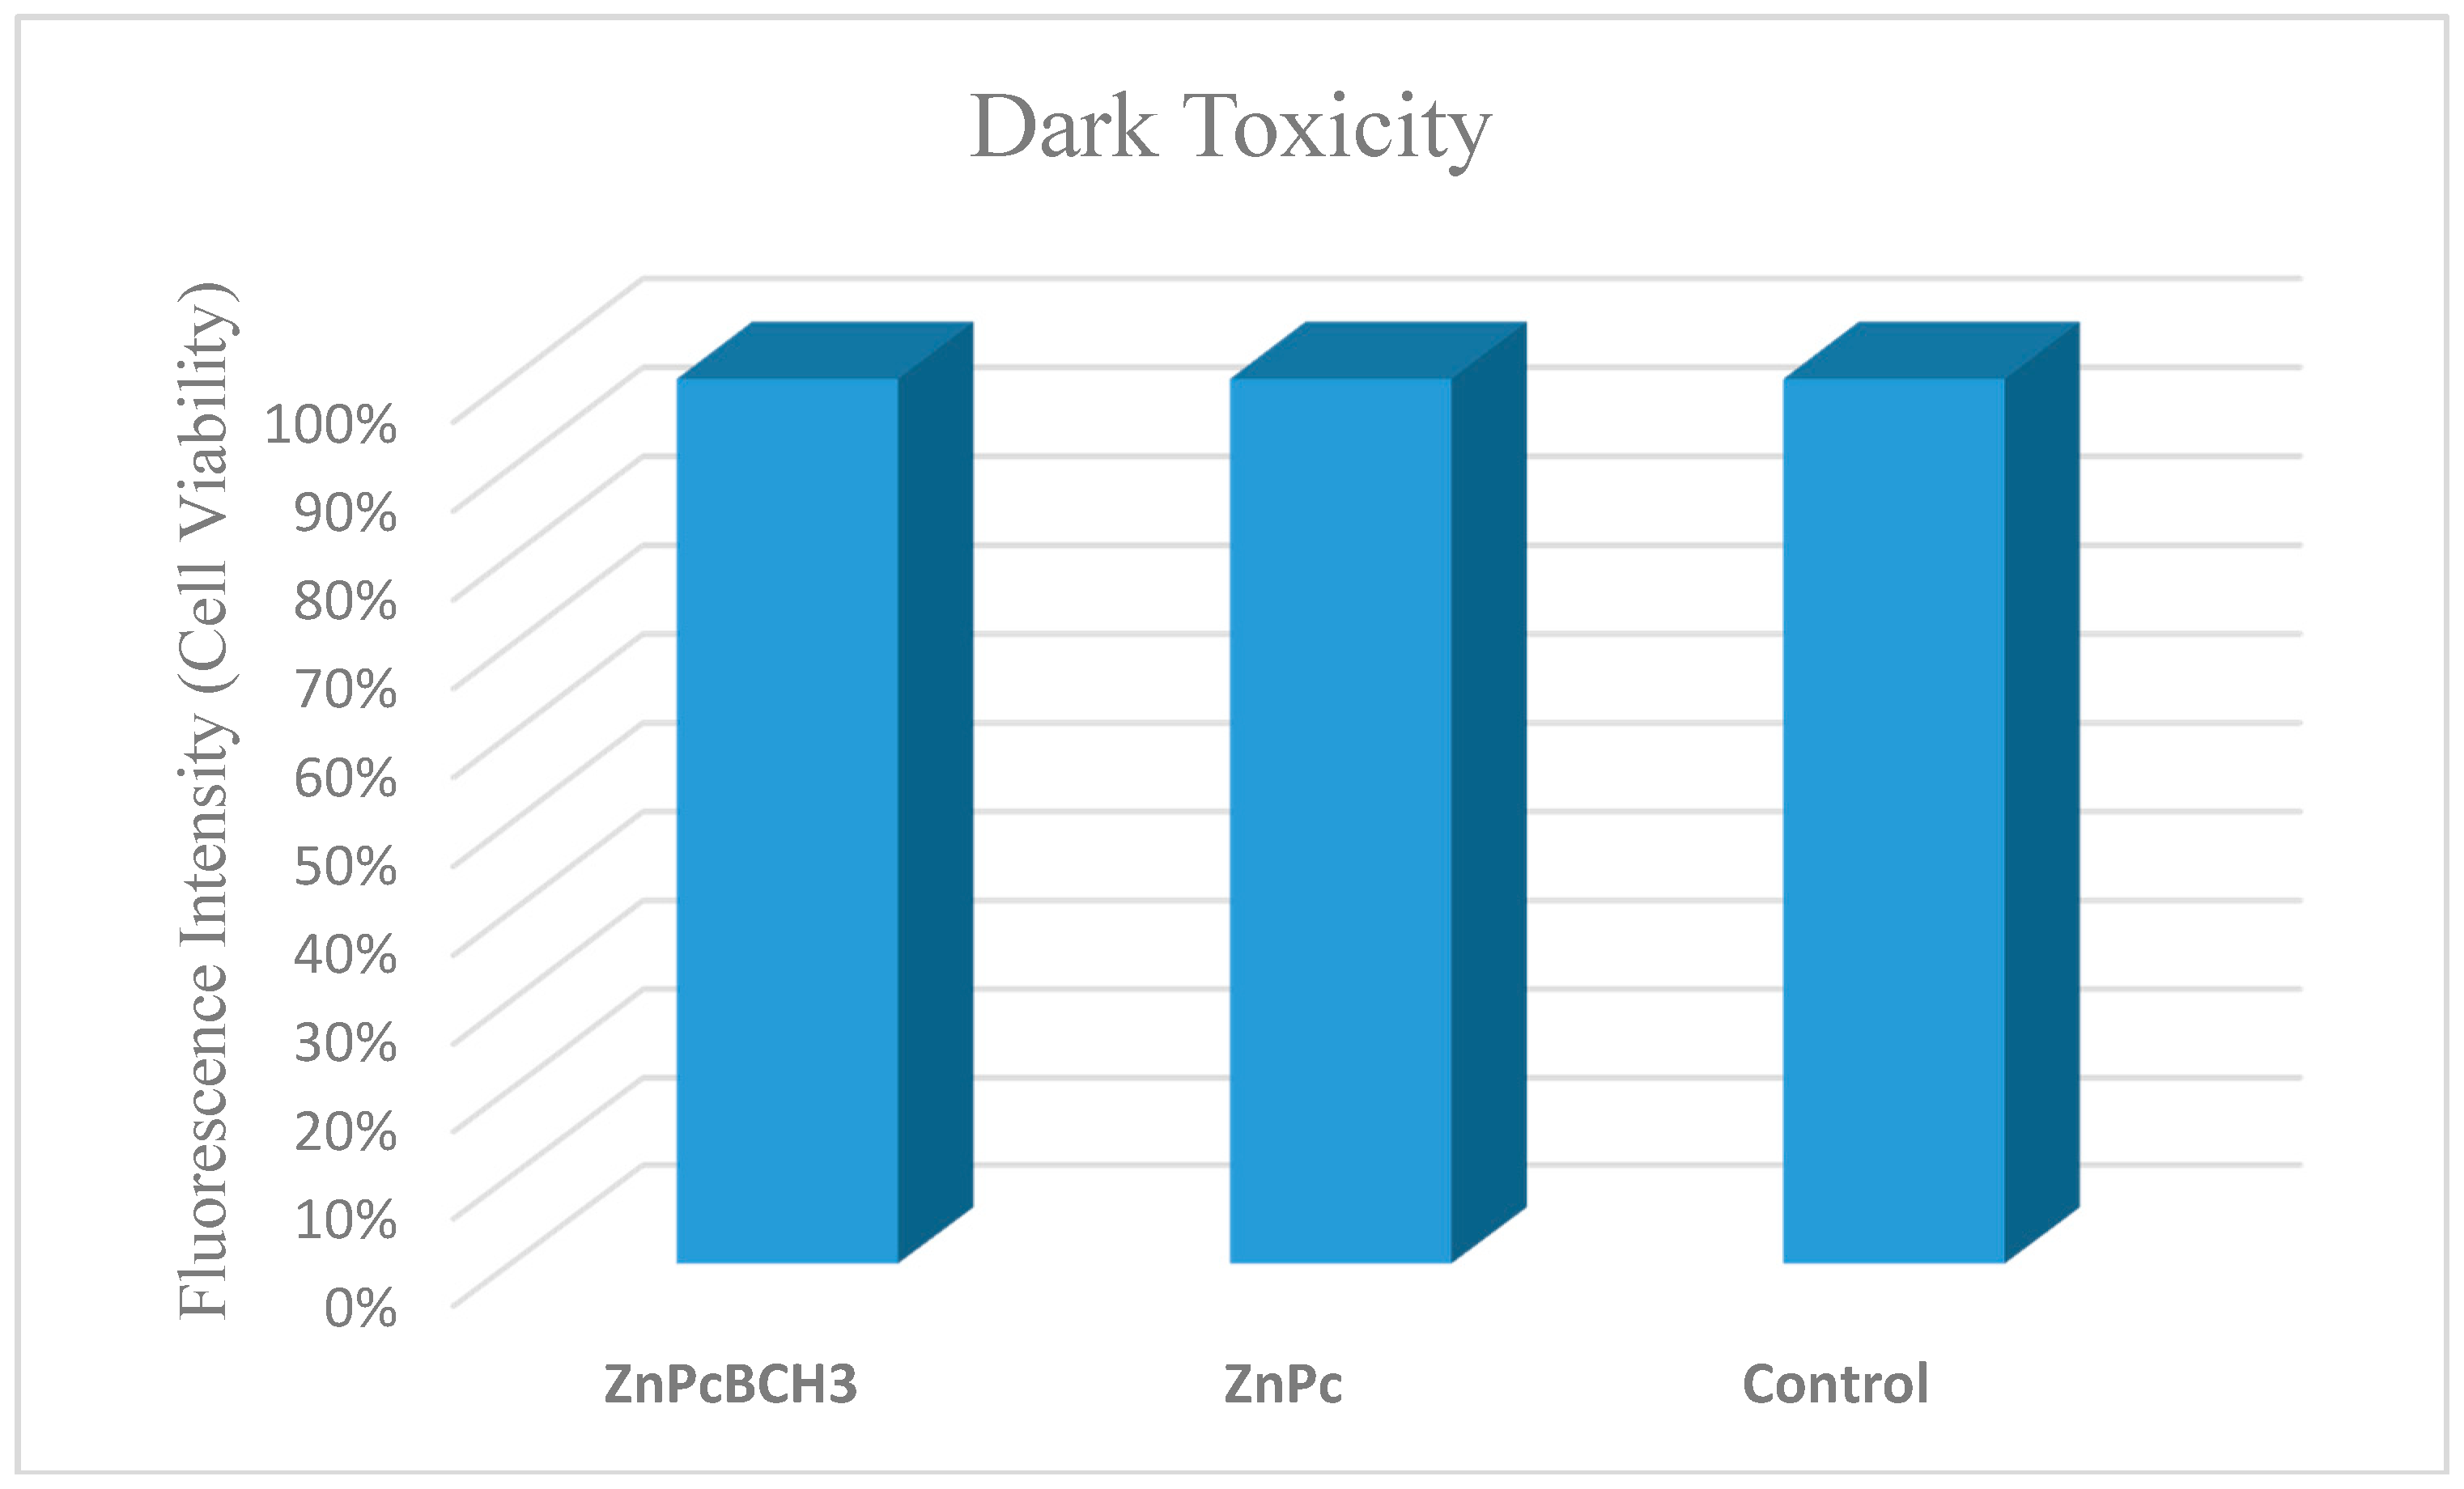
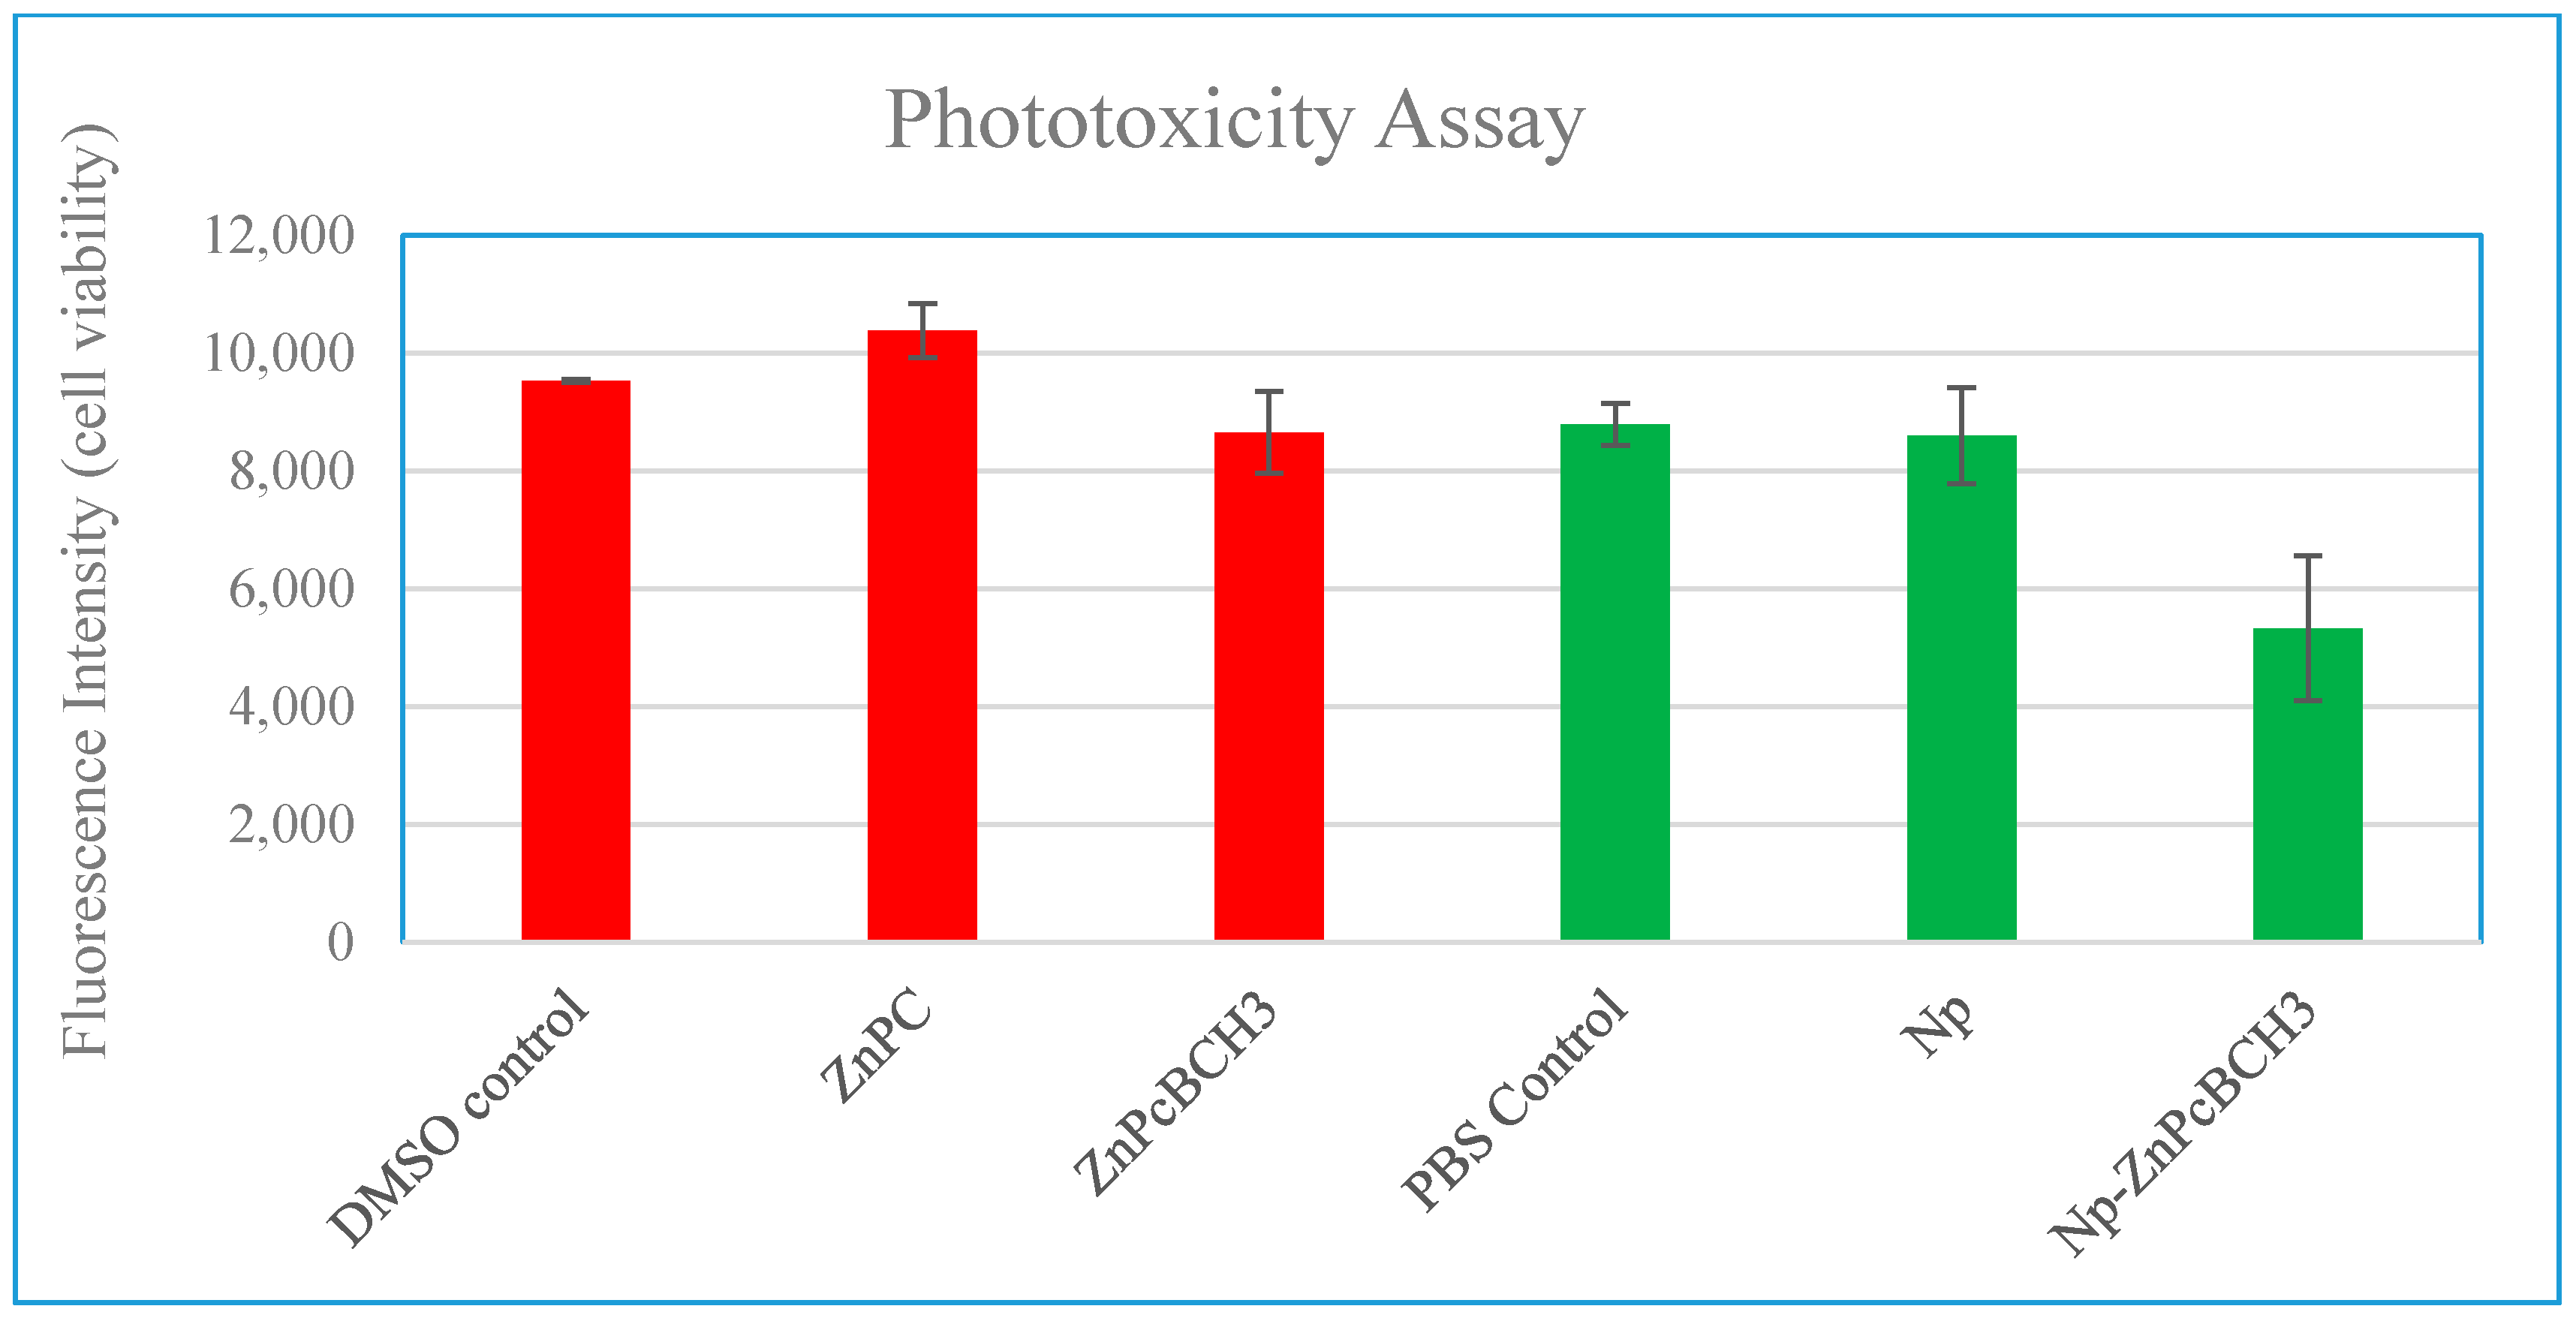
3.7. Dye Toxicity
4. Conclusions
Author Contributions
Funding
Acknowledgments
Conflicts of Interest
References
- Hamblin, M.R.; Hasan, T. Photodynamic therapy: A new antimicrobial approach to infectious disease? Photochem. Photobiol. Sci. 2004, 3, 436–450. [Google Scholar] [CrossRef] [PubMed]
- Gursoy, H.; Ozcakir-Tomruk, C.; Tanalp, J.; Yılmaz, S. Photodynamic therapy in dentistry: A literature review. Clin. Oral Investig. 2013, 17, 1113–1125. [Google Scholar] [CrossRef]
- Alberto, M.E.; De Simone, B.C.; Russo, N.; Sicilia, E.; Toscano, M. Can BODIPY Dimers Act as, Photosensitizers in Photodynamic Therapy? A Theoretical Prediction. Front. Phys. 2018, 6, 143. [Google Scholar] [CrossRef]
- Yogesh, G.; Nagaiyan, S. Investigating the excited state optical properties and origin of large stokes shift in Benz[c,d]indole N-Heteroarene BF2 dyes with ab initio tools. J. Photochem. Photobiol. B Biol. 2018, 178, 472–480. [Google Scholar]
- Klán, P.; Wirz, J. Photochemistry of Organic Compounds: From Concepts to Practice; Wiley: Chichester, UK, 2009. [Google Scholar]
- Mehraban, N.; Freeman, H.S. Developments in PDT sensitizers for increased selectivity and singlet oxygen production. Materials 2015, 8, 4421–4456. [Google Scholar] [CrossRef] [PubMed]
- Rubio, N.; Fleury, S.P.; Redmond, R.W. Spatial and temporal dynamics of in vitro photodynamic cell killing: Extracellular hydrogen peroxide mediates neighbouring cell death. Photochem. Photobiol. Sci. 2009, 8, 457–464. [Google Scholar] [CrossRef]
- Koo, H.; Lee, H.; Lee, S.; Min, K.H.; Kim, M.S.; Lee, D.S.; Choi, Y.; Kwon, I.C.; Kim, K.; Jeong, S.Y. In vivo tumor diagnosis and photodynamic therapy via tumoral pH-responsive polymeric micelles. Chem. Commun. 2010, 46, 5668–5670. [Google Scholar] [CrossRef]
- Knop, K.; Mingotaud, A.; El-Akra, N.; Violleau, F.; Souchard, J. Monomeric pheophorbide (a)-containing poly (ethyleneglycol-b-ε-caprolactone) micelles for photodynamic therapy. Photochem. Photobiol. Sci. 2009, 8, 396–404. [Google Scholar] [CrossRef]
- Rossetti, F.C.; Lopes, L.B.; Carollo, A.R.H.; Thomazini, J.A.; Tedesco, A.C.; Bentley, M.V.L.B. A delivery system to avoid self-aggregation and to improve in vitro and in vivo skin delivery of a phthalocyanine derivative used in the photodynamic therapy. J. Control. Release 2011, 155, 400–408. [Google Scholar] [CrossRef]
- Fadel, M.; Kassab, K.; Fadeel, D.A. Zinc phthalocyanine-loaded PLGA biodegradable nanoparticles for photodynamic therapy in tumor-bearing mice. Laser Med. Sci. 2010, 25, 283–292. [Google Scholar] [CrossRef]
- Da Volta Soares, M.; Mainara Rangel Oliveira, E.P.D.S.; de Brito Gitirana, L.; Barbosa, G.M.; Quaresma, C.H.; Ricci-Júnior, E. Nanostructured delivery system for zinc phthalocyanine: Preparation, characterization, and phototoxicity study against human lung adenocarcinoma A549 cells. Int. J. Nanomed. 2011, 6, 227–238. [Google Scholar]
- Çakır, D.; Göksel, M.; Çakır, V.; Durmus, M.; Biyiklioglu, Z.; Kantekin, H. Amphiphilic zinc phthalocyanine photosensitizers: Synthesis, photophysicochemical properties and in vitro studies for photodynamic therapy. Dalton Trans. 2015, 44, 9646–9658. [Google Scholar] [CrossRef] [PubMed]
- Jin, H.; Zhang, X.; Zhang, B.; Kang, H.; Du, L.; Li, M. Nanostructures of an amphiphilic zinc phthalocyanine polymer conjugate for photodynamic therapy of psoriasis. Colloids Surf. B 2015, 128, 405–409. [Google Scholar] [CrossRef] [PubMed]
- Doshi, M.; Krienke, M.; Khederzadeh, S.; Sanchez, H.; Copik, A.; Oyer, J.; Gesquiere, A.J. Conducting polymer nanoparticles for targeted cancer therapy. RSC Adv. 2015, 5, 37943–37956. [Google Scholar] [CrossRef]
- Lo, P.C.; Huang, J.D.; Cheng, D.Y.Y.; Chan, E.Y.; Fong, W.P.; Ko, W.H.; Ng, D.K. New amphiphilic silicon (IV) phthalocyanines as efficient photosensitizers for photodynamic therapy: Synthesis, photophysical properties, and in vitro photodynamic activities. Chem. Eur. J. 2004, 10, 4831–4838. [Google Scholar] [CrossRef] [PubMed]
- Theodossiou, T.A.; Gonçalves, A.R.; Yannakopoulou, K.; Skarpen, E.; Berg, K. Photochemical internalization of tamoxifens transported by a “Trojan-Horse” nanoconjugate into Breast-Cancer cell lines. Angew. Chem. Int. Ed. 2015, 54, 4885–4889. [Google Scholar] [CrossRef] [PubMed]
- Karaoğlan, G.K.; Gümrükçü, G.; Koca, A.; Gül, A.; Avcıata, U. Synthesis and characterization of novel soluble phthalocyanines with fused conjugated unsaturated groups. Dyes Pigm. 2011, 90, 11–20. [Google Scholar] [CrossRef]
- Tyson, D.S.; Henbest, K.B.; Bialecki, J.; Castellano, F.N. Excited state processes in ruthenium (II)/pyrenyl complexes displaying extended lifetimes. J. Phys. Chem. A 2001, 105, 8154–8161. [Google Scholar] [CrossRef]
- Ogunsipe, A.; Maree, D.; Nyokong, T. Solvent effects on the photochemical and fluorescence properties of zinc phthalocyanine derivatives. J. Mol. Struct. 2003, 650, 131–140. [Google Scholar] [CrossRef] [Green Version]
- Scalise, I.; Durantini, E.N. Synthesis, properties, and photodynamic inactivation of escherichia coli using a cationic and a noncharged zn (II) pyridyloxyphthalocyanine derivatives. Bioorg. Med. Chem. 2005, 13, 3037–3045. [Google Scholar] [CrossRef]
- Ferrari, M. Cancer nanotechnology: Opportunities and challenges. Nat. Rev. Cancer 2005, 5, 161–171. [Google Scholar] [CrossRef] [PubMed]
- Papadimitriou, S.; Bikiaris, D. Novel self-assembled core–shell nanoparticles based on crystalline amorphous moieties of aliphatic copolyesters for efficient controlled drug release. J. Control. Release 2009, 138, 177–184. [Google Scholar] [CrossRef] [PubMed]
- Clogston, J.D.; Patri, A.K. Zeta potential measurement. In Characterization of Nanoparticles Intended for Drug Delivery; McNeil, S., Ed.; Springer: Berlin/Heidelberg, Germany, 2011; pp. 63–70. [Google Scholar]
- Hamilton, J.A.; Era, S.; Bhamidipati, S.P.; Reed, R.G. Locations of the three primary binding sites for long-chain fatty acids on bovine serum albumin. Proc. Natl. Acad. Sci. USA 1991, 88, 2051–2054. [Google Scholar] [CrossRef] [PubMed]
- Majorek, K.A.; Porebski, P.J.; Dayal, A.; Majorek, K.A.; Porebski, P.J.; Dayal, A.; Zimmerman, M.D.; Jablonska, K.; Stewart, A.J.; Chruszcz, M.; Minor, W. Structural and immunologic characterization of bovine, horse, and rabbit serum albumins. Mol. Immunol. 2012, 52, 174–182. [Google Scholar] [CrossRef] [PubMed] [Green Version]
- Dörwald, F.Z. Lead Optimization for Medicinal Chemists: Pharmacokinetic Properties of Functional Groups and Organic Compounds; Wiley-VCH: Weinheim, Germany, 2012. [Google Scholar]
- Ezzeddine, R.; Al-Banaw, A.; Tovmasyan, A.; Craik, J.D.; Batinic-Haberle, I.; Benov, L.T. Effect of molecular characteristics on cellular uptake, subcellular localization, and phototoxicity of Zn(II) N-alkylpyridylporphyrins. J. Biol. Chem. 2013, 288, 36579–36588. [Google Scholar] [CrossRef]
- Coulter, C.V.; Kelso, G.F.; Lin, T.K.; Smith, R.A.; Murphy, M.P. Mitochondrially targeted antioxidants and thiol reagents. Free Radic. Biol. Med. 2001, 28, 1547–1554. [Google Scholar] [CrossRef]
- Kelso, G.F.; Porteous, C.M.; Coulter, C.V.; Hughes, G.; Porteous, W.K.; Ledgerwood, E.C.; Smith, R.A.; Murphy, M.P. Selective targeting of a redox-active ubiquinone to mitochondria within cells: Antioxidant and antiapoptotic properties. J. Biol. Chem. 2001, 276, 4588–4596. [Google Scholar] [CrossRef]


| Compound | λex (nm) (Q) Band | ε (M−1 cm−1) | λex (nm) | ε (M−1 cm−1) | Φf | τf | ΦΔ |
|---|---|---|---|---|---|---|---|
| ZnPc | 672 | 1.7 × 10⁵ | 346 | 8.58 × 10⁴ | 0.28 ± 0.05 | 3.166 × 10⁻⁹ | 0.56 ± 0.04 |
| ZnPcBCH3 | 677 | 1.6 × 10⁵ | 352 | 6.4 × 10⁴ | 0.52 ± 0.08 | 3.132 × 10⁻⁹ | 0.51 ± 0.056 |
| Compound | λabs (DMF) | ε (M−1 cm−1) | λEm | Stokes Shift |
|---|---|---|---|---|
| ZnPcBCH3 | 681 nm 612 nm | 1.60 × 10⁵ 3.41 × 10⁴ | 697 nm | 16 nm |
| Particle Formation Solvent | Zeta Potential (mV) | Average Diameter (nm) | PDI |
|---|---|---|---|
| Acetone | ‒8.93 ± 0.04 | 97.82 ± 0.02 | 0.209 ± 0.003 |
| THF | ‒9.74 ± 0.01 | 90.09 ± 0.10 | 0.202 ± 0.003 |
| Acetonitrile | ‒6.65 ± 0.05 | 106.7 ± 0.07 | 0.207 ± 0.005 |
| Sample | ZnPcBCH3 |
|---|---|
| Nanoparticle yield (%) | 73.76 |
| Dye sensitizer load (%) | 0.37 |
| Entrapment efficiency (%) | 28 |
© 2019 by the authors. Licensee MDPI, Basel, Switzerland. This article is an open access article distributed under the terms and conditions of the Creative Commons Attribution (CC BY) license (http://creativecommons.org/licenses/by/4.0/).
Share and Cite
Mehraban, N.; Musich, P.R.; Freeman, H.S. Synthesis and Encapsulation of a New Zinc Phthalocyanine Photosensitizer into Polymeric Nanoparticles to Enhance Cell Uptake and Phototoxicity. Appl. Sci. 2019, 9, 401. https://doi.org/10.3390/app9030401
Mehraban N, Musich PR, Freeman HS. Synthesis and Encapsulation of a New Zinc Phthalocyanine Photosensitizer into Polymeric Nanoparticles to Enhance Cell Uptake and Phototoxicity. Applied Sciences. 2019; 9(3):401. https://doi.org/10.3390/app9030401
Chicago/Turabian StyleMehraban, Nahid, Phillip R. Musich, and Harold S. Freeman. 2019. "Synthesis and Encapsulation of a New Zinc Phthalocyanine Photosensitizer into Polymeric Nanoparticles to Enhance Cell Uptake and Phototoxicity" Applied Sciences 9, no. 3: 401. https://doi.org/10.3390/app9030401