Smart-Grid-Aware Load Regulation of Multiple Datacenters towards the Variable Generation of Renewable Energy


1
State Key Laboratory of Plateau Ecology and Agriculture, Department of Computer Technology and Applications, Qinghai University, Xining 810016, China
2
Department of Computer Science and Technology, Tsinghua University, Beijing 100084, China
*
Author to whom correspondence should be addressed.
Appl. Sci. 2019, 9(3), 518; https://doi.org/10.3390/app9030518
Submission received: 4 January 2019
/
Revised: 29 January 2019
/
Accepted: 29 January 2019
/
Published: 3 February 2019
(This article belongs to the Special Issue Sustainable Energy Systems Planning, Integration and Management)
Abstract
:Recently, as renewable and distributed power sources boost, many such resources are integrated into the smart grid as a clean energy input. However, since the generation of renewable energy is intermittent and unstable, the smart grid needs to regulate the load to maintain stability after integrating the renewable energy source. At the same time, with the development of cloud computing, large-scale datacenters are becoming potentially controllable loads for the smart grid due to their high energy consumption. In this paper, we propose an appropriate approach to dynamically adjust the datacenter load to balance the unstable renewable energy input into the grid. This could meet the demand response requirements by taking advantage of the variable power consumption of datacenters. We have examined the scenarios of one or more datacenters being integrated into the grid and adopted a stochastic algorithm to solve the problem we established. The experimental results illustrated that the dynamic load management of multiple datacenters could help the smart grid to reduce losses and thus save operational costs. Besides, we also analyzed the impact of the flexibility and the delay of datacenter actions, which could be applied to more general scenarios in realistic environments. Furthermore, considering the impact of the action delay, we employed a forecasting method to predict renewable energy generation in advance to eliminate the extra losses brought by the delay as much as possible. By predicting solar power generation, the improved results showed that the proposed method was effective and feasible under both sunny and cloudy/rainy/snowy weather conditions.
1. Introduction
With the exploitation and usage of green energy, more and more attention has been paid to green energy generation and management issues of the smart grid. It is predicted that the domestic total solar power generation will reach 150 GW by the end of 2020 [1]. Although renewable energy generation is of great importance to environmental sustainability in the future, there are still various problems to widely penetrate renewable energy into the grid due to its instability and intermittency. With the large-scale integration of renewable energy generation, the power flow distribution of the grid will change and the power flow might be reversed. Meanwhile, problems such as voltage fluctuation or over-limit violations will occur, which will affect the safe and reliable operation of the grid. In order to maintain the reliability of the grid, traditional grids usually adopt a passive regulation mode where the power supply changes with power demand. For example, large-scale batteries as an energy storage element, combined with corresponding control strategies, could help achieve the stability of the grid [2,3]. An analysis of three potential future technical regulation systems has been presented [4] in which wind power and small and medium-scale CHP (combined heat and power) units are involved in balancing and grid stabilizing tasks. The results indicated that such systems could improve the ability to integrate renewable energy. Compared to traditional batteries, this system could reduce carbon dioxide emissions effectively. However, such passive methods might result in an increase in grid operations. Moreover, the movement of electricity over distances results in losses, leading to a great amount of economic expense, as reported in Reference [5]. According to statistics, the global electric power transmission and distribution losses account for nearly 8.3% of the output [6], which shows that the power transmission and distribution losses are worthy of consideration due to the possible capital costs they might bring. In other words, the operational costs of the regional grid could be remarkably reduced by a reduction in transmission losses. Hence, it is necessary to adopt a strategy to make full use of loads to realize the demand response to balance the power supply and demand, to improve the efficiency, and to maintain the reliability of the grid with renewable energy sources incorporated.
On the other hand, with the development and wide-spread usage of large-scale datacenters, the power consumption of one datacenter could reach 50 MW or even more. In China, the total power consumption of domestic datacenters has exceeded the annual power generation of the Three Gorges Dam since 2015. Besides, the power of the datacenter is still growing up by 10–20% every year, which is a similar rate to that of renewables [7]. Studies have shown that the power of the datacenters is flexible to adjust, which implies that the datacenter is a potentially controllable load to achieve a demand response. Meanwhile, as a large consumer of electricity, connecting the datacenters into the grid with renewable sources can also reduce energy expenses effectively.
In this paper, we attempted to explore dynamic load adjustment approaches for multiple datacenters, holistically in the smart grid, in order to balance the varying renewable energy input into the grid. By our approach, the total power losses of the whole grid could be reduced, which showed the value of datacenters participating in demand response programs for the balance of power generation and consumption. Furthermore, although the power of the datacenters was flexible to adjust, the actual adjustment actions would have to spend some time, which we called “the action delay” hereafter. By our investigation, this kind of delay would result in extra losses for the grid. Thus, we designed a forecasting method, based on the concept of a neural network, to predict renewable energy generation in advance so as to adjust the power of the datacenters as soon as possible and reduce the extra losses. Moreover, we also considered the impact of the possible adjustment range in practical environments, which we called “the flexibility”. This paper is an extended version of our prior work [8]. The extensions include the results of extended experimental scenarios upon three datacenters, more experiments under both sunny and cloudy weather conditions, a suitable prediction method adopted to forecast renewable energy generation in advance, the analysis and comparison of different forecasting accuracy results on power losses, and discussion of the relationship between forecasting time and accuracy.
The rest of this paper is organized as follows. In Section 2, we present the background of this paper and some relevant work. In Section 3, we describe the system model and the establishment of the problem to be solved later. Section 4 elaborates on the optimization method used to solve the defined problem. Section 5 demonstrates the experimental results of our approach and the analysis of practical details. Concluding remarks and a discussion about the future work are given in Section 6.
2. Background and Related Work
2.1. Datacenters Power Consumption and Renewable Energy Generation
With the rapid development of information technology and the coming of the Internet era, especially the development of cloud computing around the world, the proportion of datacenters with more than 100 racks is increasing year by year. Hence, the problems of high energy consumption, high cost and high pollution are increasingly prominent. For example, for a datacenter with a construction scale of 2000 racks, the electricity consumption per hour will be around 6000 kWh and the annual electricity consumption will be about 52,560 MWh. Then, its total annual cost could reach up to $105 million including the electricity cost, the air conditioning, fresh air, lighting and other power consumption of the datacenter, with a PUE (power usage effectiveness) of 2 [3]. In addition, the impact of datacenters on the environment is attracting increasing attention from the public. According to the current development trends, the average annual electricity consumption of datacenters will account for 1% of the total global value in 2020 as predicted in Reference [9]. The IT industry emits about 35 million tons of carbon dioxide per year, accounting for 2% of global emissions. In order to reduce energy consumption and carbon emissions of datacenters, it is important to maintain sustainable datacenters and make full use of green energy [10,11]. Meanwhile, governments all over the world have also published laws and policies to encourage energy conservation and the reduction of emissions. The cost of deploying equipment to build new energy sources, such as photovoltaic panels and wind turbines, has dropped as manufacturing costs have decreased, along with massive investment and government incentives. More and more IT enterprises and organizations are gradually realizing full or partial new energy-driven datacenters, such as the wind power datacenters that the Green House Data built in Wyoming [12], and the solar datacenters that the Facebook built in Oregon [13]. Early in April 2012, eBay decided to use 30 Bloom Energy fuel cells to power its datacenter in Utah [14]. Apple will utilize 60% power from photovoltaic generation and battery station to drive their datacenters in Southern California [15]. On the other hand, datacenter energy efficiency is usually low, with huge energy waste. According to statistics of the Ministry of Industry and Information Technology, the average PUE value for datacenters in China is between 2.2 and 3.0, while the actual energy consumption may be much higher. For enterprises, electricity for datacenters has become a big expense, greatly eroding the operating profits of enterprises. According to data reported in Reference [3], the total electricity consumption of datacenters all over China was more than 110.8 billion kWh in 2016, and in 2017 it was 120–130 billion kWh, which is more than the total generating capacity of the Three Gorges dam in the whole year of 2017 (97.605 billion kWh) together with the Gezhouba dam power plant (19.05 billion kWh in 2017).
At the same time, with the rapid development of the world’s economy, the demand for energy is enhancing day by day, while traditional energy sources are drying up gradually. People have begun to focus on new types of clean energy, hoping that it could change the current energy structure and realize more sustainable development. In recent years, photovoltaic power generation and wind power generation have developed quickly. By the end of 2015, the total installed capacity of solar cells had reached 20,000 MW all over the world [16]. In 2017, the cumulative installed capacity of photovoltaic generation in China reached 130 million kW with 69% year-on-year growth, accounting for 7.3% of the total power generation capacity of the whole country. Among them, the cumulative installed capacity of centralized photovoltaic is 100 million kW and the distributed photovoltaic is 29.66 million kW. The installed wind power generation capacity in China increased by 53.06 million kW, an increase of 54% year on year, accounting for 40% of the total installed power capacity in the whole country. At the same time, by the end of 2017, the cumulative grid-integration capacity of wind power in China had reached 163.67 million kW, growing 10.1% year on year, among which the cumulative grid-connected capacity of offshore wind power was 2.02 million kW, growing by 37% year on year [8]. On November 20th, 2018, Power Construction Corporation of China opened the tender for the centralized procurement project of 1 GW photovoltaic modules and inverter frames in 2019 [17].
2.2. Power Consumption Adjustment of Datacenters
Recently, the participation of datacenters towards demand response requirements has become increasingly important given their high and increasing energy consumption and their flexibility in demand management compared to conventional industrial facilities. The huge yet flexible power adjustments of datacenters make them promising resources for demand response, which requires a certain amount of power adjustment at a certain time. Datacenters could dynamically adjust the power consumption themselves by leveraging the IT computing knobs such as geographical load balancing [18,19], dynamic capacity provisioning [20], and workload shifting [21], as well as non-IT knobs including batteries and cooling systems [22,23]. One of the most comprehensive studies describing the potential of different hardware components in the datacenters and strategies providing a demand response was released by Lawrence Berkeley National Laboratories [24]. Some of the initial work in the area comes from Urgaonkar et al. [25], which proposed an approach for adjusting the power consumption of datacenters by using energy storage to shift peak demand away from high peak periods. While the design of workload planning algorithms for datacenters has received considerable attention over the recent years [20,26,27,28,29,30,31,32,33,34,35], all of the proposed flexible datacenter workload load planning methods could change the overall power consumption as needed. A more complex approach was presented in Reference [36]. It took advantage of two datacenter flexibility mechanisms—workload shifting and local generation (local diesel generators and local renewable energy). Using these mechanisms, algorithms were developed in order to avoid the coincidental peak and reduce the energy costs. They relied on the prediction of a coincident peak occurrence based on historical data to optimize the workload allocation and local generation and to minimize the expected cost. In Reference [37] a technique was proposed for balancing and keeping the peak power consumption of the datacenter under a given threshold according to the electricity pricing but at the same time allowing the datacenter to respond to the regulation control signals that may request an increase in power consumption. Dan et al in Reference [38], on the basis of real-time electricity price consideration, proposed to reduce the energy consumption cost of datacenters by dynamically adjusting the server capacity and performing workload transfers in each time slot.
Besides, some researches have focused on dynamically controlling the number of active servers based on the load and regard it as an effective means of power control [39,40,41]. In References [20,42,43], dynamic speed/voltage scaling (DVS) could change processor power consumption, which could also adjust the datacenter power consumption on demand by adjusting the frequency based on the instantaneous power demand. Furthermore, our research team also conducted relevant studies to dynamically adjust the power consumption amount according to the variation of the power supply. Zhang et al. [44] designed adaptive scheduling algorithms and deployed renewable energy in the datacenters, aiming at scheduling approximate applications, in order to meet the user demands as well as maximizing the utilization of renewable energy. The main purpose was to appropriately utilize the renewable energy and at the same time aimed at typical approximate applications based on the trade-off of performance and accuracy to schedule and manage these tasks. By running such applications, the power consumption of the computing nodes could follow a trend of changing energy input as much as possible, which showed the effect of adjusting the datacenter power consumption. Xiaoying et al. [45] also considered that the workloads of large-scale datacenters are variable, believing that a coordinated resource management and power management approach could help datacenters to use renewable energy more effectively and proposed a green-power-aware virtual machine migration strategy to manage resources and power in green datacenters powered by mixed supply of both grid and renewable energy. The results illustrated that the holistic power consumption of both IT devices and cooling devices in the datacenter could be controlled towards the variation of the mixed power supply. Based on the above relevant research and also our prior work, we regard datacenters as adjustable and controllable loads in the smart grid, which might help the grid to keep its stability and improve its efficiency.
2.3. Renewable Energy Generation Integrated in the Grid
As renewable energy power stations are being constructed all over the world, the problems resulting from a grid penetrated with renewables have emerged. The photovoltaic power generation will be greatly affected by the change of solar radiation, while the wind generation will be affected by the wind speed variation. This makes renewable power generation intermittent and unstable. To improve the utilization efficiency of interconnected devices, improve the power quality of the renewable energy interconnection grid system, maintain the normal operation of the grid and get good economic profit, Ahamed et al. [46] proposed a hybrid power generation system that connected the photovoltaic power station and batteries in parallel, which absorbed and supplied unbalanced power from the battery and flattened grid-connected power. Zhijiang et al. and Shang et al. [47,48] established a hybrid energy storage system composed of batteries and supercapacitors and optimized the power distribution of the storage equipment through different filtering algorithm controls, which improved the economy of the mixed energy storage equipment. Feng et al. [49] proposed the IP-IQ current detection method of two kinds of control schemes of the photovoltaic grid inverter based on the instantaneous reactive power theory in order to realize the dynamic reactive power compensation and flexible combination of an active filter, while at the same time improving the power quality. In Reference [50], a control strategy of the unified power quality conditioner was proposed to stabilize the power system and increase the utilization ratio of the equipment. Although battery storage systems can effectively increase grid stability after integrating renewable energy, electricity storage is not the optimum solution to integrate the large inflows of fluctuating renewable energy since more efficient and cheaper options can be found by integrating the electricity sector with other parts of the energy system and by creating a smart energy system. Lund et al. in Reference [51] investigated the most efficient and lowest cost storage options as a part of a smart energy systems approach, as defined in Reference [52]. By using this approach, it was explained why the best storage solutions could be found by integrating the individual sub-sectors of the energy system. One of the main reasons why a cross-sector approach could identify more economically viable solutions was that the cheaper and more efficient storage technologies that existed in the thermal and transport sectors, compared to the electricity sector. Lund et al. [53] also made a state-of-the-art description of different single-sector approaches for the transformation towards future sustainable energy solutions within the electricity, gas, building and industrial sectors. They discussed the smart energy systems concept with regard to the issues of the definition of the term, identification of renewable systems design, the integration of holistic storage solutions and the modelling of national energy systems. In addition, some researchers have also studied various kinds of controllable loads. Short et al. [54] put forward the dynamically controllable load-refrigerators. The refrigerator could change its temperature automatically as the grid frequency changed, which meant changing the power of the load. In the case of an increase (or decrease) in power generation, the load power can be increased (or decreased) by effectively controlling the controllable dynamic load. However, a controllable load changing with the frequency of power grid is still relatively rare at present, so it will take some time for large-scale application. Kondoh et al. [55] considered that each customer’s load and each generator’s active and reactive power should be controlled in order to stabilize and optimize the grid, comparing independent and cooperative control techniques as applied to load regulation using electric water heaters. However, both refrigerators and electric water heaters are low-power household appliances and the power control required a large number of such appliances. Besides, on account of the intermittent and unstable power supply, the controllable load should be adjusted frequently, which would affect the normal life of users and the service life of the electrical appliances. Although the strategies mentioned in the above papers could achieve stability after renewable energy is integrated into the grid, they all required some additional devices or even the devices of the user terminal, leading to additional costs.
In view of solving the instability and intermittency of the grid integrating with renewable energy, this paper proposed to add datacenters as electric loads into the grid so as to consume surplus power generated from renewable energy stations. This strategy could help achieve a win-win effect since on the one hand it could help maintain the normal operation of the grid integrating renewable energy through the adjustment of the datacenters and, on the other hand, the datacenter itself, as a big consumer of electricity, could leverage the renewable energy more effectively to further reduce the operational costs.
3. System Model and Problem Statement
Since the power of a datacenter could be dynamically adjusted, it can meet the demand response requirements in a smart grid integrated with renewable energy generation by adjusting the power itself according to the power of renewable energy generation within one day. However, considering the large-scale renewable energy generation integrated into the smart grid, the number, location and the real-time power consumption of datacenters will influence the normal operation and the power losses of the whole grid, which could comprehensively reflect the rationality and efficiency of the grid planning and design, production operation, and management level. This paper studies the smart grid operation with both renewable energy generation and multiple datacenters integrated proposes an optimal load allocation strategy in several different cases and mainly focuses on the total power losses. Meanwhile, considering the delay, an appropriate forecasting method has been adopted to predict the renewable energy generation power, so as to reduce the extra losses caused by the action delay as much as possible. At the same time, we also pay attention to the bus voltage and branch power flow in case they exceed the limitation, which might lead to the instability of the smart grid.
3.1. Power Grid System
In this paper, we focus on the interaction of datacenters and renewable power plants in the transmission network of the smart grid. Take the IEEE 30 Bus system [56] as an example of the transmission network and the topology of case_ieee30 is shown in Figure 1. The case_ieee30 dataset was converted from an IEEE common data format. The data of renewable energy generation is the photovoltaic generation from the Green Power Network [57], which is a third-party monitoring data management service platform for photovoltaic power stations. It realizes intelligent housekeeping services of photovoltaic power stations with high-quality products and technologies.
- Generator model: There are six generators, which are connected to buses 1, 2, 5, 8, 11 and 13 respectively. Specifically, Gen1 is a balancing bus node.
- Branch model: There are 41 branches each connecting two buses in the system. Each branch has its own line capacity limit and the voltage limitation of all branches is 0.95 pu to 1.1 pu. We will check and try to avoid the possible violations based on these limits. Moreover, when power is transmitted along the branches, there will be some losses on the line. We will use the summarized losses as the main metric in the experiments in later sections.
3.2. The Model of Renewable Energy Generation Station
The power generation of the solar station can be obtained as a function, which can be described by Equation (1).
where M is the number of solar photovoltaic panels; Ap is the superficial area of each PV panel; φ is the solar radiant quantity; ηp denotes the efficiency of the PV panel; ηDC denotes the efficiency of the maximum power tracker of the solar PV panel array. In these factors, φ is essentially random, which will be impacted by seasons, solar radiation, temperature and pressure.
When it is decided to construct a renewable energy station at a certain location, we connect it to the bus corresponding to the region.
3.3. The Datacenter Model
In this paper, we regard the datacenter as a large and non-neglectable load for the utility grid system. The capacity of a datacenter is usually described by the power consumption amount when it is running at peak load and thus fully utilized. When we place a datacenter at a certain location, it is connected to the bus corresponding to that area where the datacenter is located. Then the load of this bus should be added to the current load of the datacenter, as follows:
where Pi and Qi denote the active and the reactive power load at bus i respectively; N is the number of buses in the grid and and represents the active load and reactive load of the datacenter respectively.
3.4. Problem Formulation
In the grid system described above, we assume that a large renewable energy generation station is to be connected, which might incur oscillating power input to the grid. In order to consume the extra power generated from renewable sources, multiple datacenters can be established at several different locations and connected to the grid system as controllable loads. The problem here is to determine how much power each datacenter should consume in the case of multiple datacenters and make adjustment accordingly in a real-time manner.
Assume there are n datacenters deployed in the grid. Denote the solar power generated as PS, the load of the i-th datacenter as Li. Then, the total power losses will be impacted by them, denoted as a function Loss (PS, L1, L2, …, Ln). Then, the problem we need to address can be defined as:
wherein is the system nominal voltage; and are the allowable deviation rates specified internationally; is the branch power flowing from bus node i to bus node j, and is the maximum power allowed to pass through the branch (i.e., the branch capacity limit value). As shown, Equations (5) and (6) are both constraints to ensure the stability of the grid by avoiding any over-limit violations across all of the buses and branches. Especially, Equation (5) is the constraint for the bus voltage of each node and Equation (6) gives the limitation of the power flow on each branch.
minimize Loss (PS, L1, L2, …, Ln)
4. Dynamic Load Management of Datacenters Based on Forecasting
4.1. Dynamic Load Adjustment of Datacenters
An imbalance between load and generation might lead to the failure of the normal operation of the power grid. Therefore, facing the special situation of renewable energy integrated into the grid, we selected datacenters as dynamic loads to maintain the basic stability of the smart grid. However, while maintaining stability, we also need to focus on the efficiency of the grid, which can be reflected by the power losses. In the scenario of multiple datacenters integrated into the smart grid, it will be difficult to solve the problem defined in Section 3. Furthermore, the Loss, as described in Section 3.4, is not an explicit function, which means that we cannot use linear or non-linear programming directly to solve this problem. Thus, a stochastic algorithm is proposed to implement an optimal load allocation strategy in order to obtain the minimum loss value.
In computer science and operations research, the genetic algorithm (GA) is a metaheuristic inspired by the process of natural selection that belongs to the larger class of evolutionary algorithms (EA). Genetic algorithms are commonly used to generate high-quality solutions for optimization and search problems by relying on bio-inspired operators such as mutation, crossover and selection [58]. As one of the stochastic algorithms, a genetic algorithm is good at solving global optimization problems and is always used to solve practical problems. In this experiment, we adopt the main concept of the genetic algorithm and use the toolbox ‘Deap’, a novel evolutionary computation framework for rapid prototyping and testing of ideas to get an optimal load allocation strategy, to implement the entire algorithm. The steps of the dynamic load management algorithm can be presented as follows:
- randomly initialize the population
- determine the fitness of the current population
- repeat.
● Select parents from the current population.
In this paper, the tournament selection strategy is adopted, i.e., to select a certain number of individuals from the population each time. In our experiment, we selected three individuals and then choose the best one among the three to enter the child population each time.
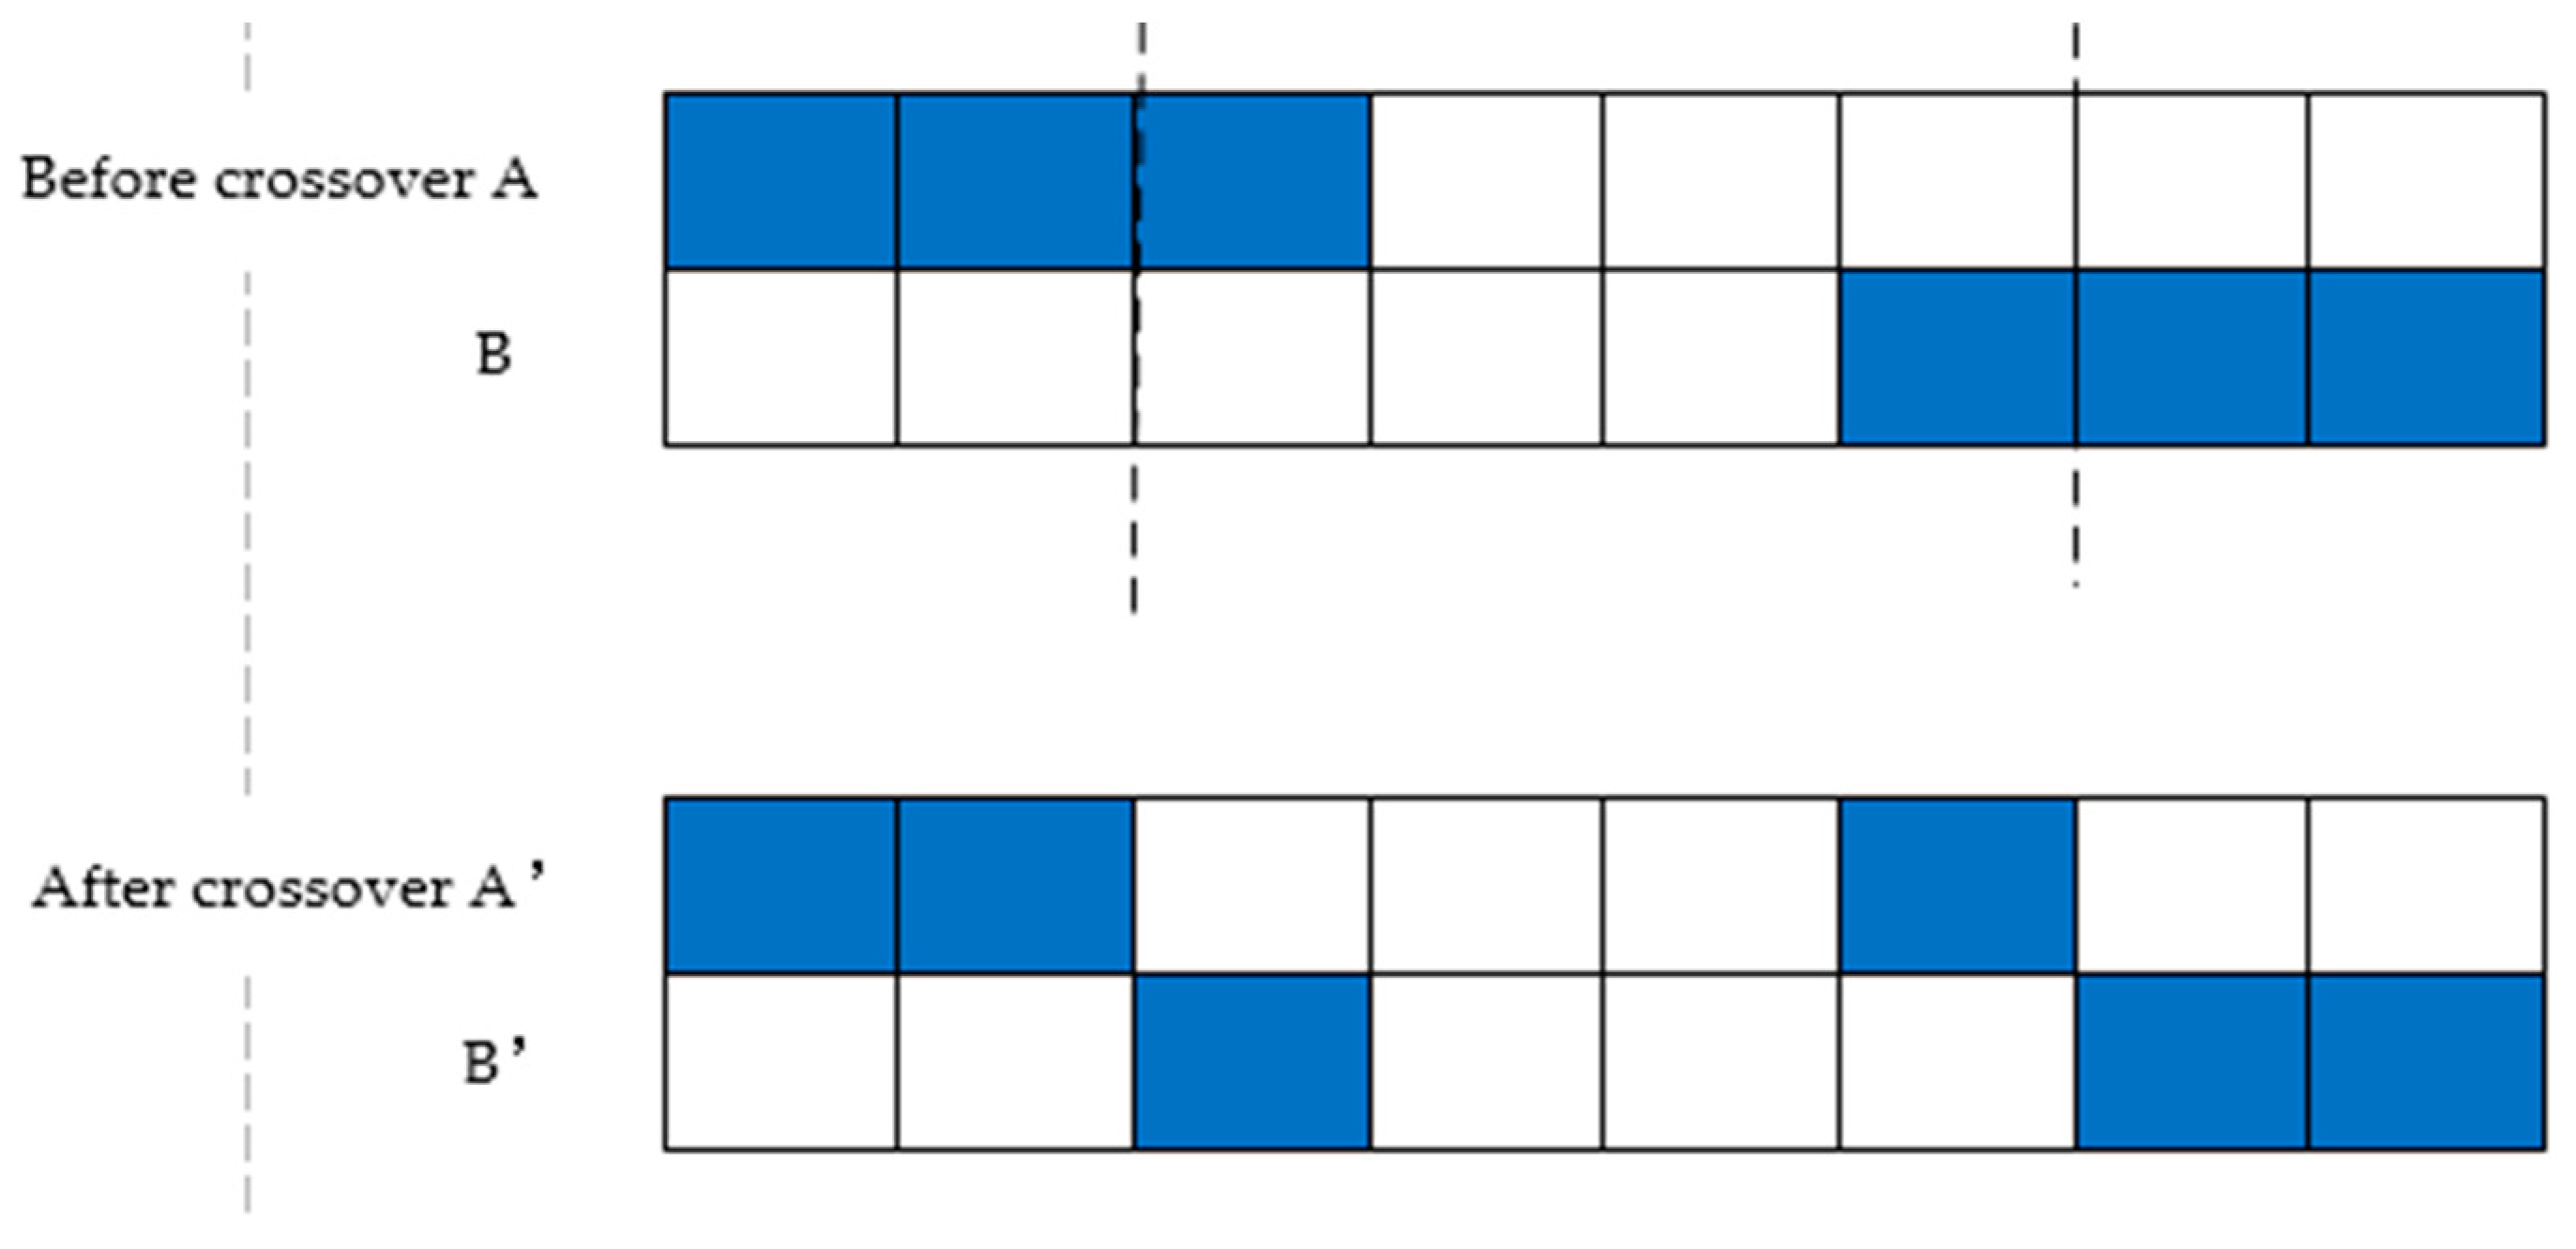
● Perform crossover operations on parents creating the population.
In this paper, we adopted the two-point crossover strategy, which was helpful to create more new individuals. Two-point crossover refers to the random setting of two crossover points in the individual coding string and then the partial genes between the two crossover points will be exchanged. An example of a two-point crossover operation is shown as Figure 2, wherein the dotted lines represent the two crossover points.
● Perform mutation operations of the current population.
Here we adopt the gauss mutation strategy, wherein the mean is 0, the standard deviation is 1, and the independent probability for each attribute to be mutated is 0.1 to enter the child population.
● Determine the fitness of the population until the best individual is good enough.
- 4.
- output the best individual of the final population as the result.
When the iteration times of the evolution reach the maximum value, the individual with the maximum fitness obtained in the evolutionary process will be the output as the optimal solution. In this algorithm, we used vectors to represent the individual and the load capacity of each datacenter at every time interval was denoted as a gene. Then, the load capacity values of all datacenters in the grid at each time interval composed the individual (x1, x2…) and the dimension of the vector could be determined according to the number of added datacenters. When an individual completes coding, a population of a specified size will be created and then we can call the ‘power’ module to calculate the fitness to assess the relative merits of each individual and determine their genetic opportunity.
4.2. Power Generation Forecasting
Renewable energy resource simulation and power prediction technology have always been a hot research direction. In recent years, the influence on large-scale renewable energy integrated into the grid appeared gradually. Renewable energy resource simulation and power prediction technology are developing in the direction of detailed simulation and customized prediction of resources, multi-space-time scale power prediction, probability prediction and event prediction [59].
Under the consideration of datacenter action delay, we adopted the neural network and called the framework “Keras” to forecast renewable energy generation power in advance. Keras is a high-level neural network API (application program interface), written in Python. It was developed with a focus on enabling fast experimentation [60]. In this paper, we selected N-days of historical renewable generation power data as a training set to forecast the renewable generation power of the next day. In the training set, the power data of n time points were used as a group of historical data to obtain the power data of the (n + 1)-th time point for training. We used a sequential model to stack the network layers. Then, the compile () method was used to compile the model. After that, we trained the network with the function fit () under a certain number of iterations, in which the optimization and loss function used were “Adam” and “mean_squared_error” respectively. Adam is an algorithm for the first-order gradient-based optimization of stochastic objective functions, based on adaptive estimates of lower-order moments, which was straightforward to implement and computationally efficient. It has little memory requirements, is invariant to the diagonal rescaling of the gradients, and is well suited for problems that are large in terms of data and/or parameters [61].
5. Experiment Results and Analysis
5.1. Testbed Setup and Parameter Settings
Here, we used MATpower [60] to simulate the operation of the grid in the following experiments. MATpower is a package of MATLAB M-files for solving power and optimizing power flow problems, designed to give the best performance possible while keeping the code simple to understand and modify, which is a simulation tool for researchers and educators.
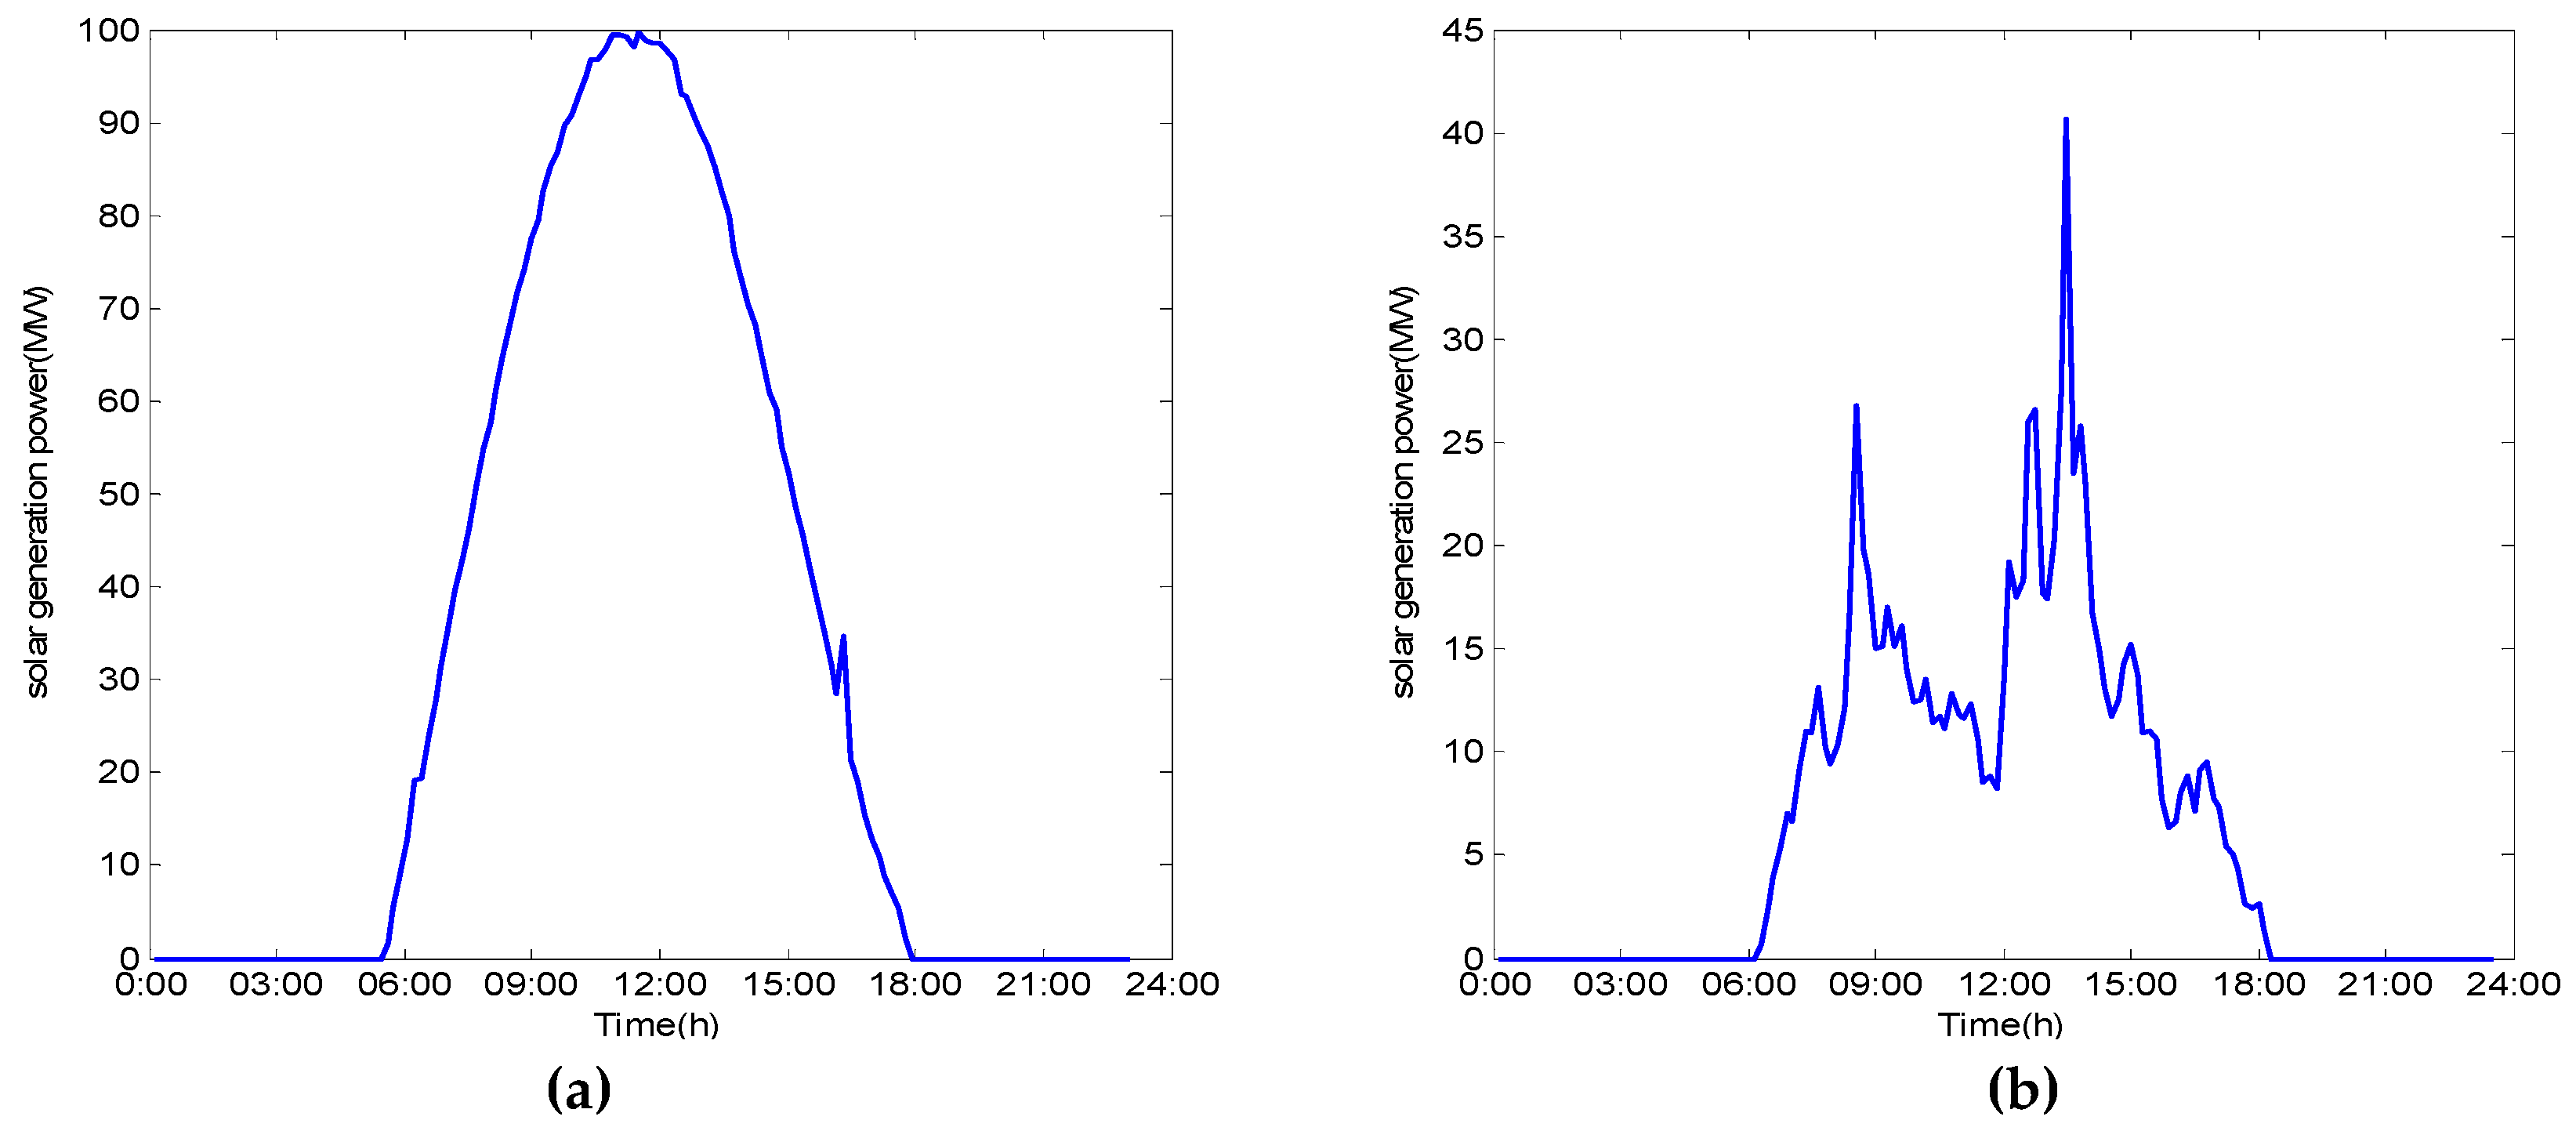
In our experiments, we chose the monitoring power data from the photovoltaic station in Xuhui district (which belongs to the city of Shanghai) government from two typical days on 14 July 2018, and 19 December 2018, corresponding to sunny and cloudy/snowy weather conditions respectively. The monitoring time interval was 10 min and thus 144 data records were collected for one-day simulation.
Here, we simulated three different scenarios of MATpower in the following experiments:
- (1)
- only one datacenter deployed. The datacenter load varied along with the input solar generation power;
- (2)
- multiple datacenters deployed. Here we assume there are multiple distributed datacenters put into the grid and the loads are evenly allocated to them;
- (3)
- multiple datacenters deployed and running with dynamically allocated loads.
We selected bus 9, 15 and 25 to integrate the solar station and datacenters respectively in the tested grid system. As parameter settings of GA, we define both the size of the population and the times of iterations as 100 and the fitness function consists of two parts, as follows:
where loss1 is to guarantee the loss value is small enough, loss2 is to ensure the residual error between the allocated load and the input solar is small enough, and is used to control the two variables. Here, we set . Figure 3 shows the input solar generation power on the two days, where Figure 3a,b correspond to sunny and cloudy/snowy weather conditions respectively.
5.2. Results of Power Losses under Accurate Responses
The experimental results under three scenarios are shown in Figure 4 as a holistic view.
In Figure 4a, the upper curve illustrates the first scenario mentioned in Section 5.1, which means only one datacenter was integrated into the case_ieee30 at bus 15. The power of the datacenter varied along with the input solar generation. As shown in the figure, the peak loss is 25.6 MW. The curve in the middle illustrates the second scenario, in which two datacenters were integrated into case_ieee30 at bus 15 and 25. In this case, the two datacenters consumed an equal amount of power and the sum of the two datacenter’s power was consistent with the input solar generation. Besides, the solar station was still at bus 9. We can find the peak loss value was smaller than in scenario 1, which was 25.25 MW. The lowest curve demonstrates the third scenario mentioned in Section 5.1. In this case, two datacenters were integrated into to case_ieee30 at bus 15 and 25 respectively and the power of the two datacenters was dynamically adjusted according to changes in solar power generation, while the total power consumption of the two datacenters was kept constant. We found that the loss value was smaller than in scenarios 1 and 2, which was 23.93MW at the peak. In Figure 4b, which illustrates that for the results under cloudy/snowy weather conditions, the peak loss values in the same three scenarios were 20.99 MW, 19.82 MW, 18.08 MW respectively and the average value in the third scenario was still the lowest.
From Figure 4 we can see that the curve of the optimal load-allocation strategy was almost always below the other two curves, which means that the dynamic load management methods can help to reduce the power losses of the grid system and thus provide savings in the operational costs. To examine the values more clearly, the corresponding statistical results are listed explicitly in Table 1. We also examined the scenario of putting three datacenters into the grid and the results are shown in Table 2. The datacenters were put at bus 15, 20, and 25 respectively. Here the two tables only give the results on a sunny day since it can be seen from Figure 4 that the other condition exhibited the same comparative trend.
5.3. Considering Practical Factors Including Flexibility and Action Delays
The above experiments are based on the ideal scenario that the datacenter can act as soon as possible to adjust the power consumption of itself to the target value exactly. In a practical environment, the power adjustment range of a datacenter will be constrained, which means that the datacenter cannot vary the power consumption as much as possible to reach the target value. We defined “flexibility” to describe such characteristics of the datacenter. Furthermore, the datacenter has to spend some time (which we defined as “action delay”) to dynamically change its power consumption through the combination of multiple methods, such as load shedding or cooling temperature adjustment. Hereafter, we also conducted a series of experiments to study the impact of practical factors. Since the results of sunny or cloudy scenarios are similar, we have only shown the results of data from the sunny day in this subsection for clarity.
To examine the impact of the flexibility of the datacenter, the adjustable range of the datacenter can be expressed as follows:
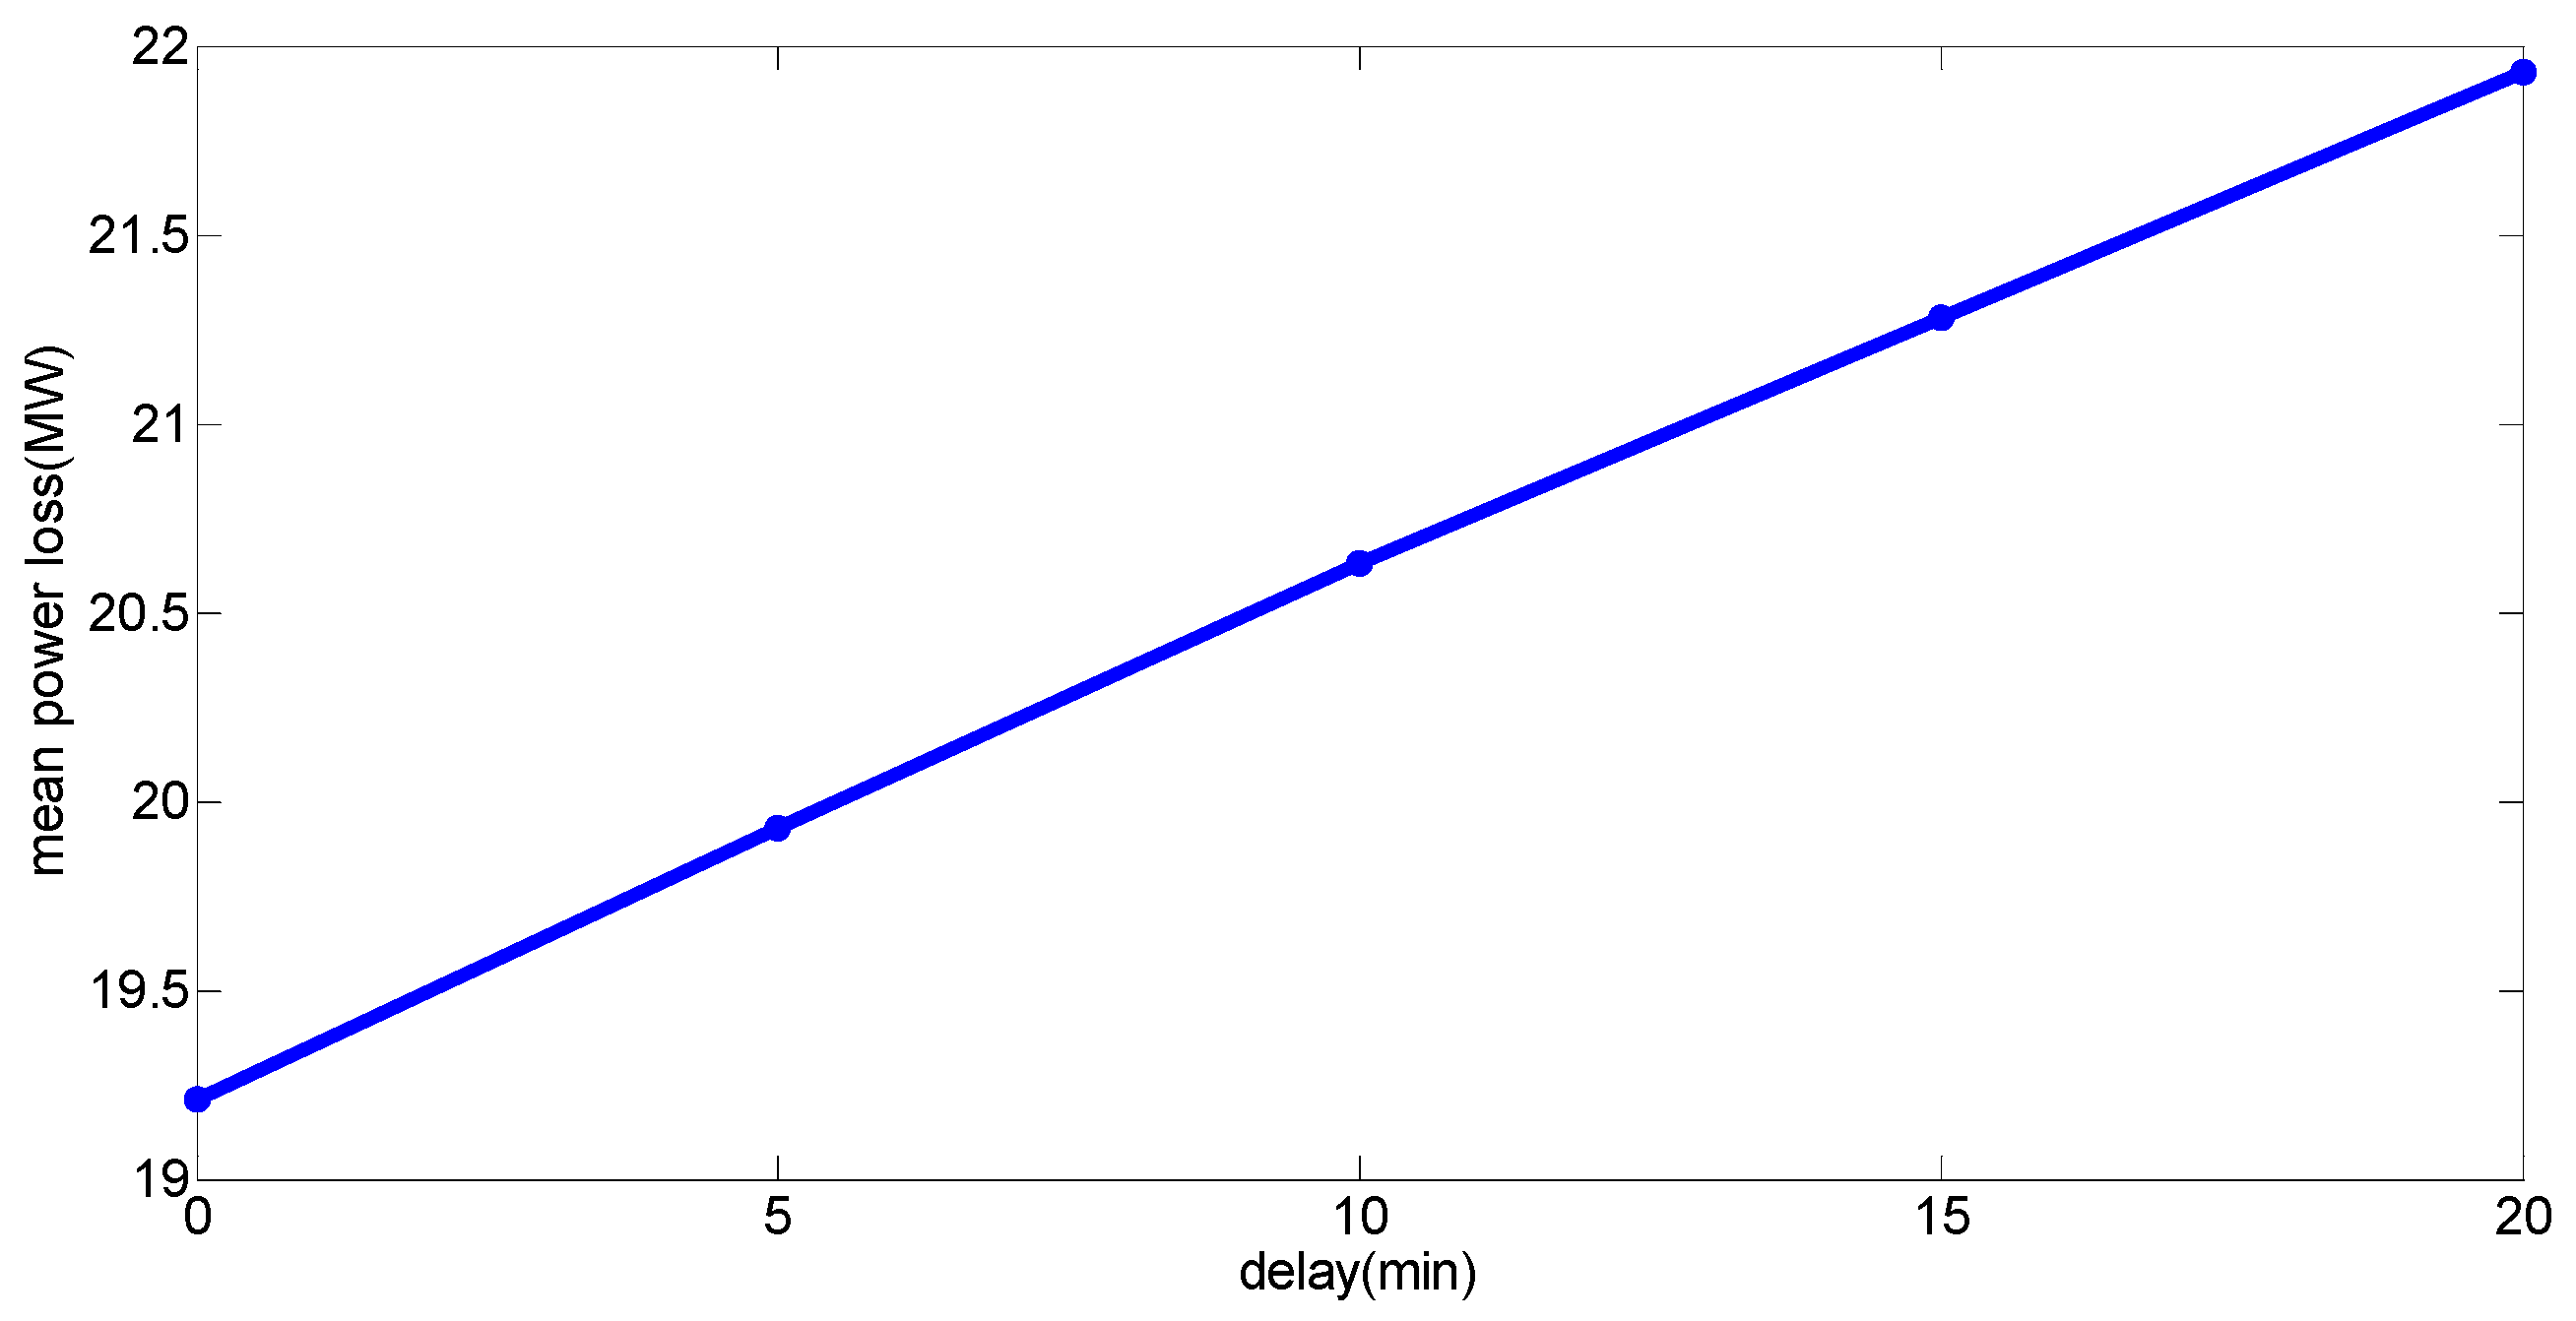
wherein e represents the flexibility of the datacenter, and the p(t) means the power of the datacenter in the last time interval. We specify that if the power of the datacenter in the next interval is out of the allowed range, the upper or lower limits of the adjustable range will be taken as the power of datacenter in the next interval. On the other hand, to evaluate the impact of the action delay, we simulated different scenarios with a delay of 5, 10, 15 and 20 min respectively.
Figure 5 shows the impact of different flexibility values, where the abscissa represents different flexibility values and the ordinate represents the mean power losses (MW). We focused on the average loss under different flexibility values, where e = 0 means the datacenter kept a constant load, and in such scenario, the loss value was remarkably large. This shows that the adjustments made to the datacenter loads can help to effectively reduce the total power losses.
The impact of different action delay times on the total power losses of the grid can be seen in Figure 6. As mentioned, we tested different delay time settings from 0 to 20 min and the average loss values were recorded under each condition. From the figure, we can see that the loss value increases proportionally with the delay, which has a great impact on the action delay on the power loss of the entire grid. Besides, comparing the results with Figure 5, we can see that when the flexibility value is equal to or greater than 0.3, the loss value does not change substantially anymore and the value is close to the result in Figure 6 when there is no delay. This implies that even an adjustable range of ±30% of the datacenter power consumption can lead to fairly satisfactory results.
5.4. Improvement Based on Forecasting Methods
Since we found that the action delay had a great impact on the power losses, in order to eliminate such impact as much as possible, we tried to adopt some forecasting method to help predict the future data as accurately as possible.
We used the neural network to forecast the solar generation power on July 14th and December 19th. Considering that July 14th was a sunny day, in order to improve the accuracy of the prediction, we chose data obtained from June 1st, 14th, 15th, 26th 2018, which were four sunny days, as the training set and the power data of 5 time points were used as a group of historical data to obtain the power data of the next time point for training. Considering that December 19th was a cloudy day, we chose data obtained from Dec 2th, 5th, 7th, 8th, 9th, 10th, 11th, 15th 2018 which were also cloudy/rainy/snowy days as a group of historical data to obtain the power data for the next time point for training. In addition, by adjusting the number of iterations, we obtained the forecasting results of different errors and obtained the loss values of the grid according to different settings of prediction accuracy.
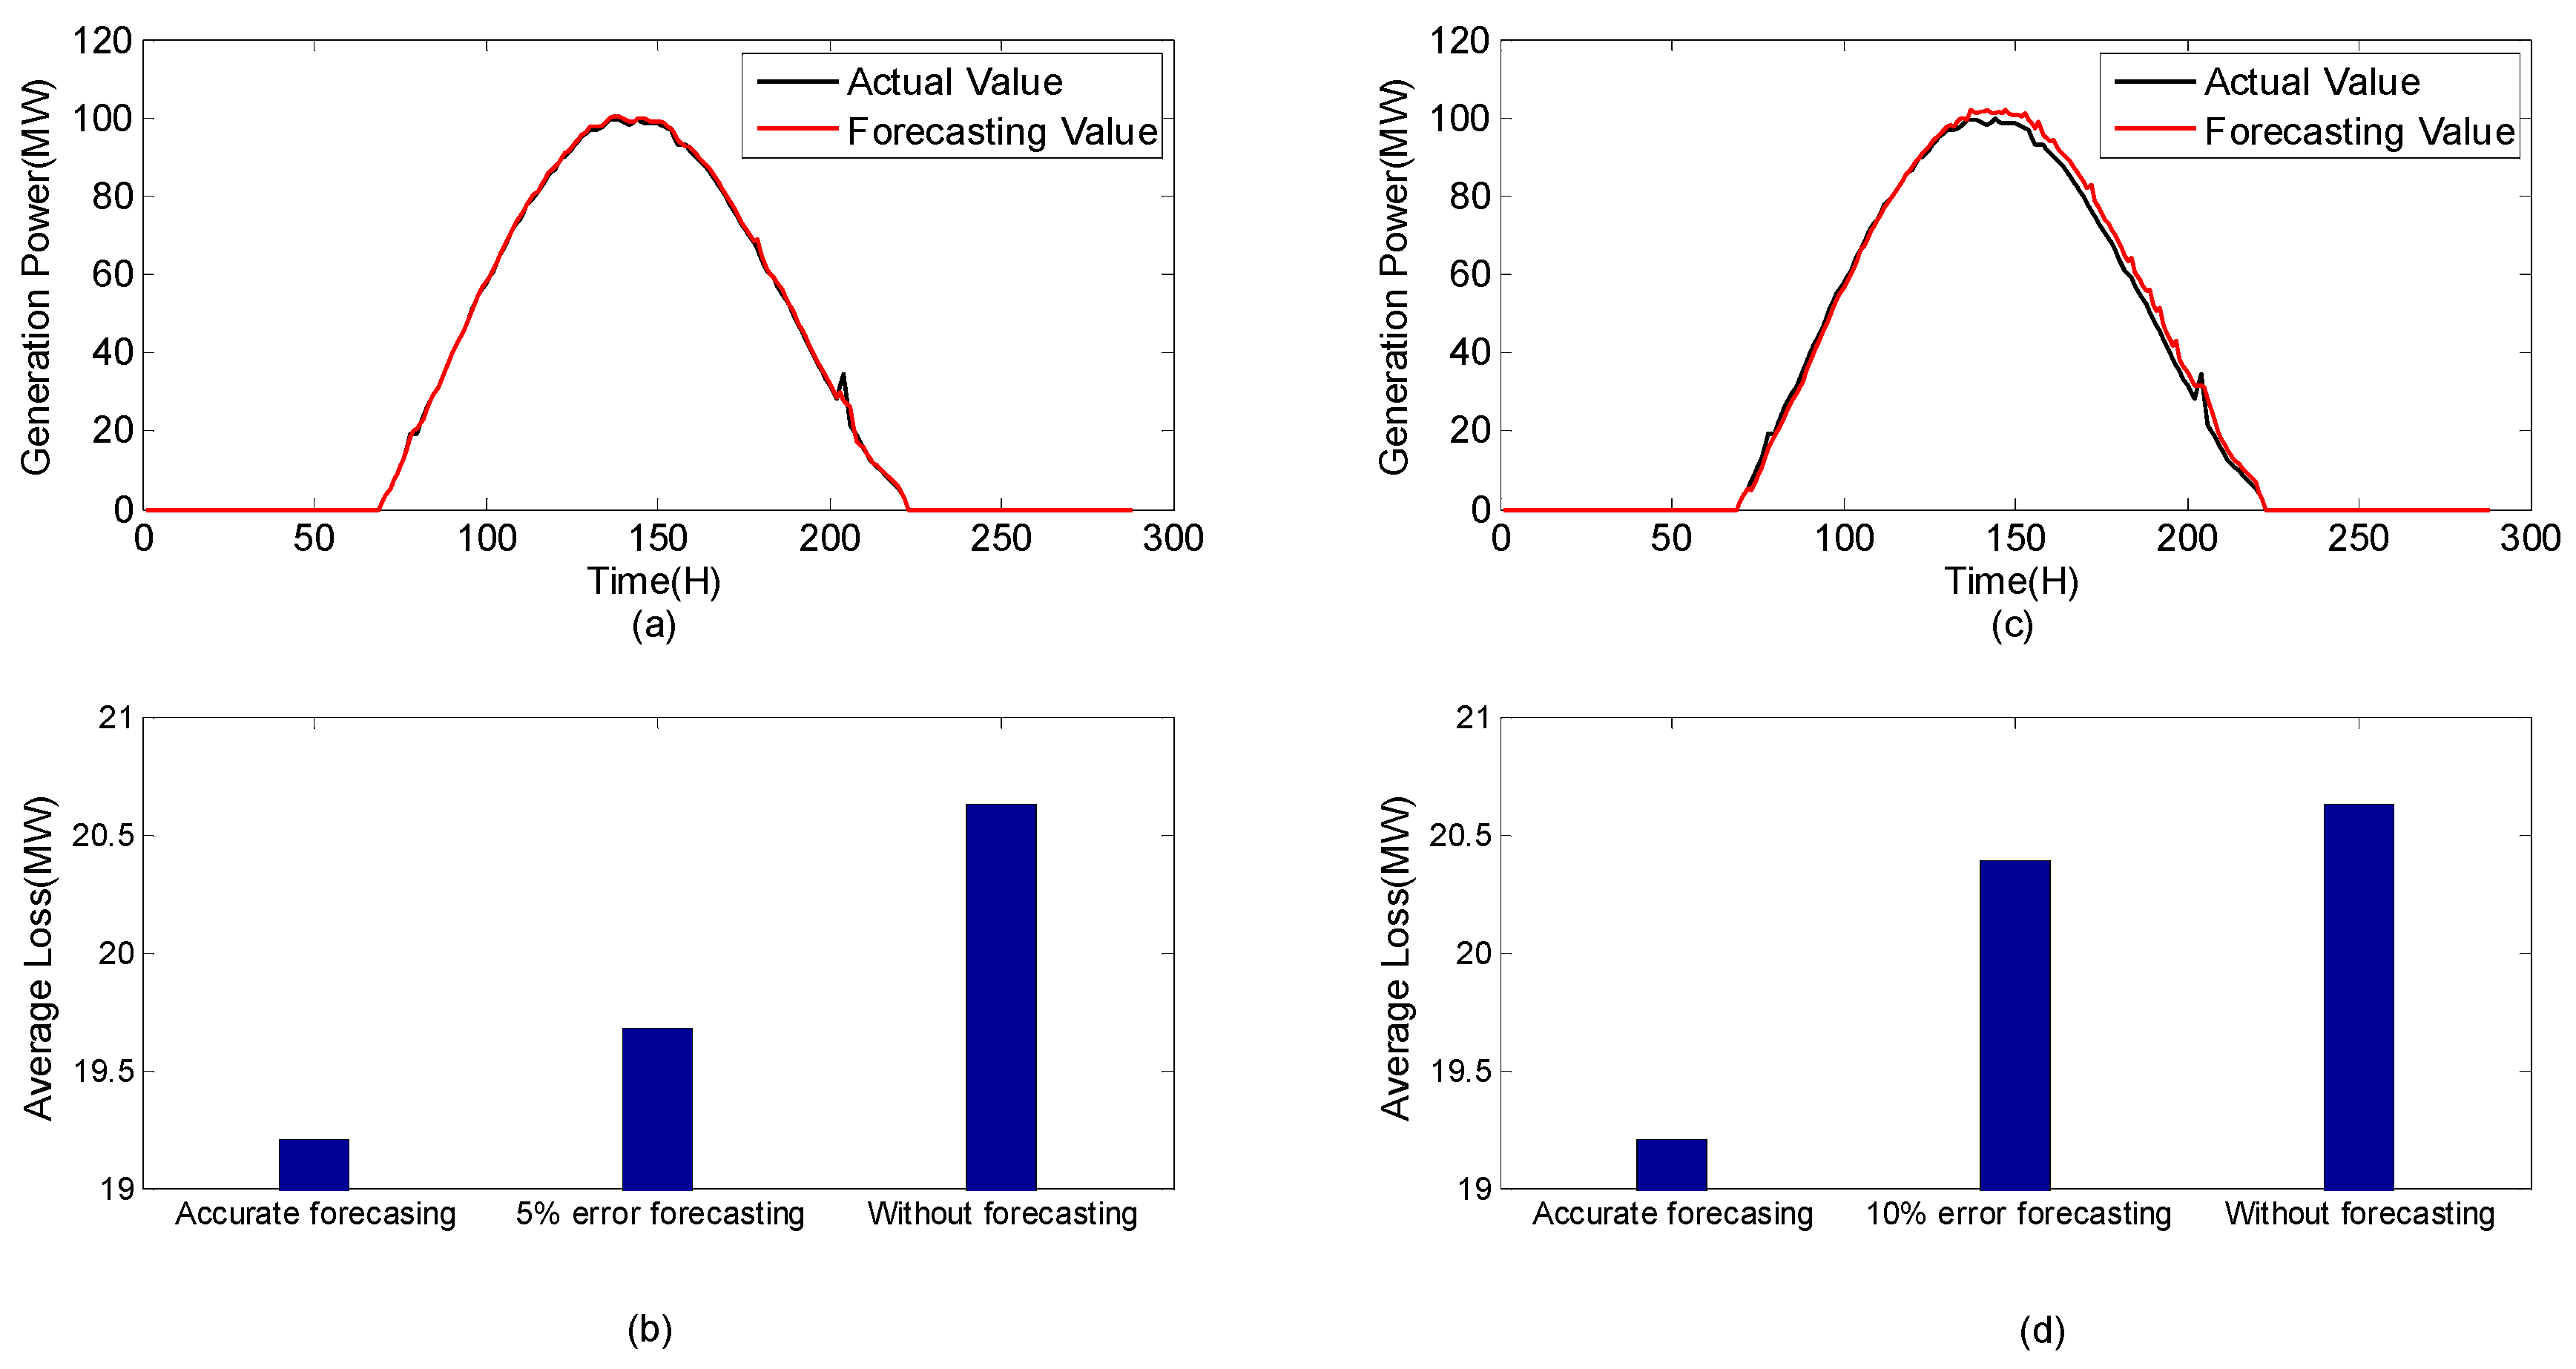
In the following experiments, we adopted the framework “Keras” based on neural networks to forecast the generation of power. Figure 7 shows that forecasting results under sunny weather conditions, in which Figure 7a shows the comparison of the predicted values and the actual values, and Figure 7b shows the average power losses under three different accuracy settings. It can be observed that leveraging forecasting techniques are helpful to eliminate the negative impact of action delay time.
Figure 8 shows the forecasting results under a 10-min action delay of the datacenters, in which the forecasting average error in Figure 8a,c was 5% and 10% respectively. Figure 8b,d show the average power losses under different accuracy settings, including 5%/10% forecasting error, accurate forecasting and without forecasting. From the results in Figure 7 and Figure 8, we can see that improving the forecasting accuracy can effectively reduce the extra power losses.
In order to verify the effectiveness of our prediction method, we also carried out the same experiments under cloudy/snowy weather conditions and the results are shown in Figure 9. The forecasting average error in Figure 9a,c is 10% and 15% respectively. Figure 9b,d shows the average power losses under different accuracy settings, including 10%/15% forecasting error, accurate forecasting and without forecasting. Figure 9 also illustrates that although on cloudy/snowy days the data fluctuations make the forecasting difficult and less accurate, we can still see the advantages of leveraging the forecasting techniques to help reduce extra power losses. To sum up, a reasonable forecasting method can eliminate extra losses from the action delay of the datacenters as much as possible, so it is meaningful to adopt an appropriate forecasting method to improve the impact of datacenter reaction on the grid.
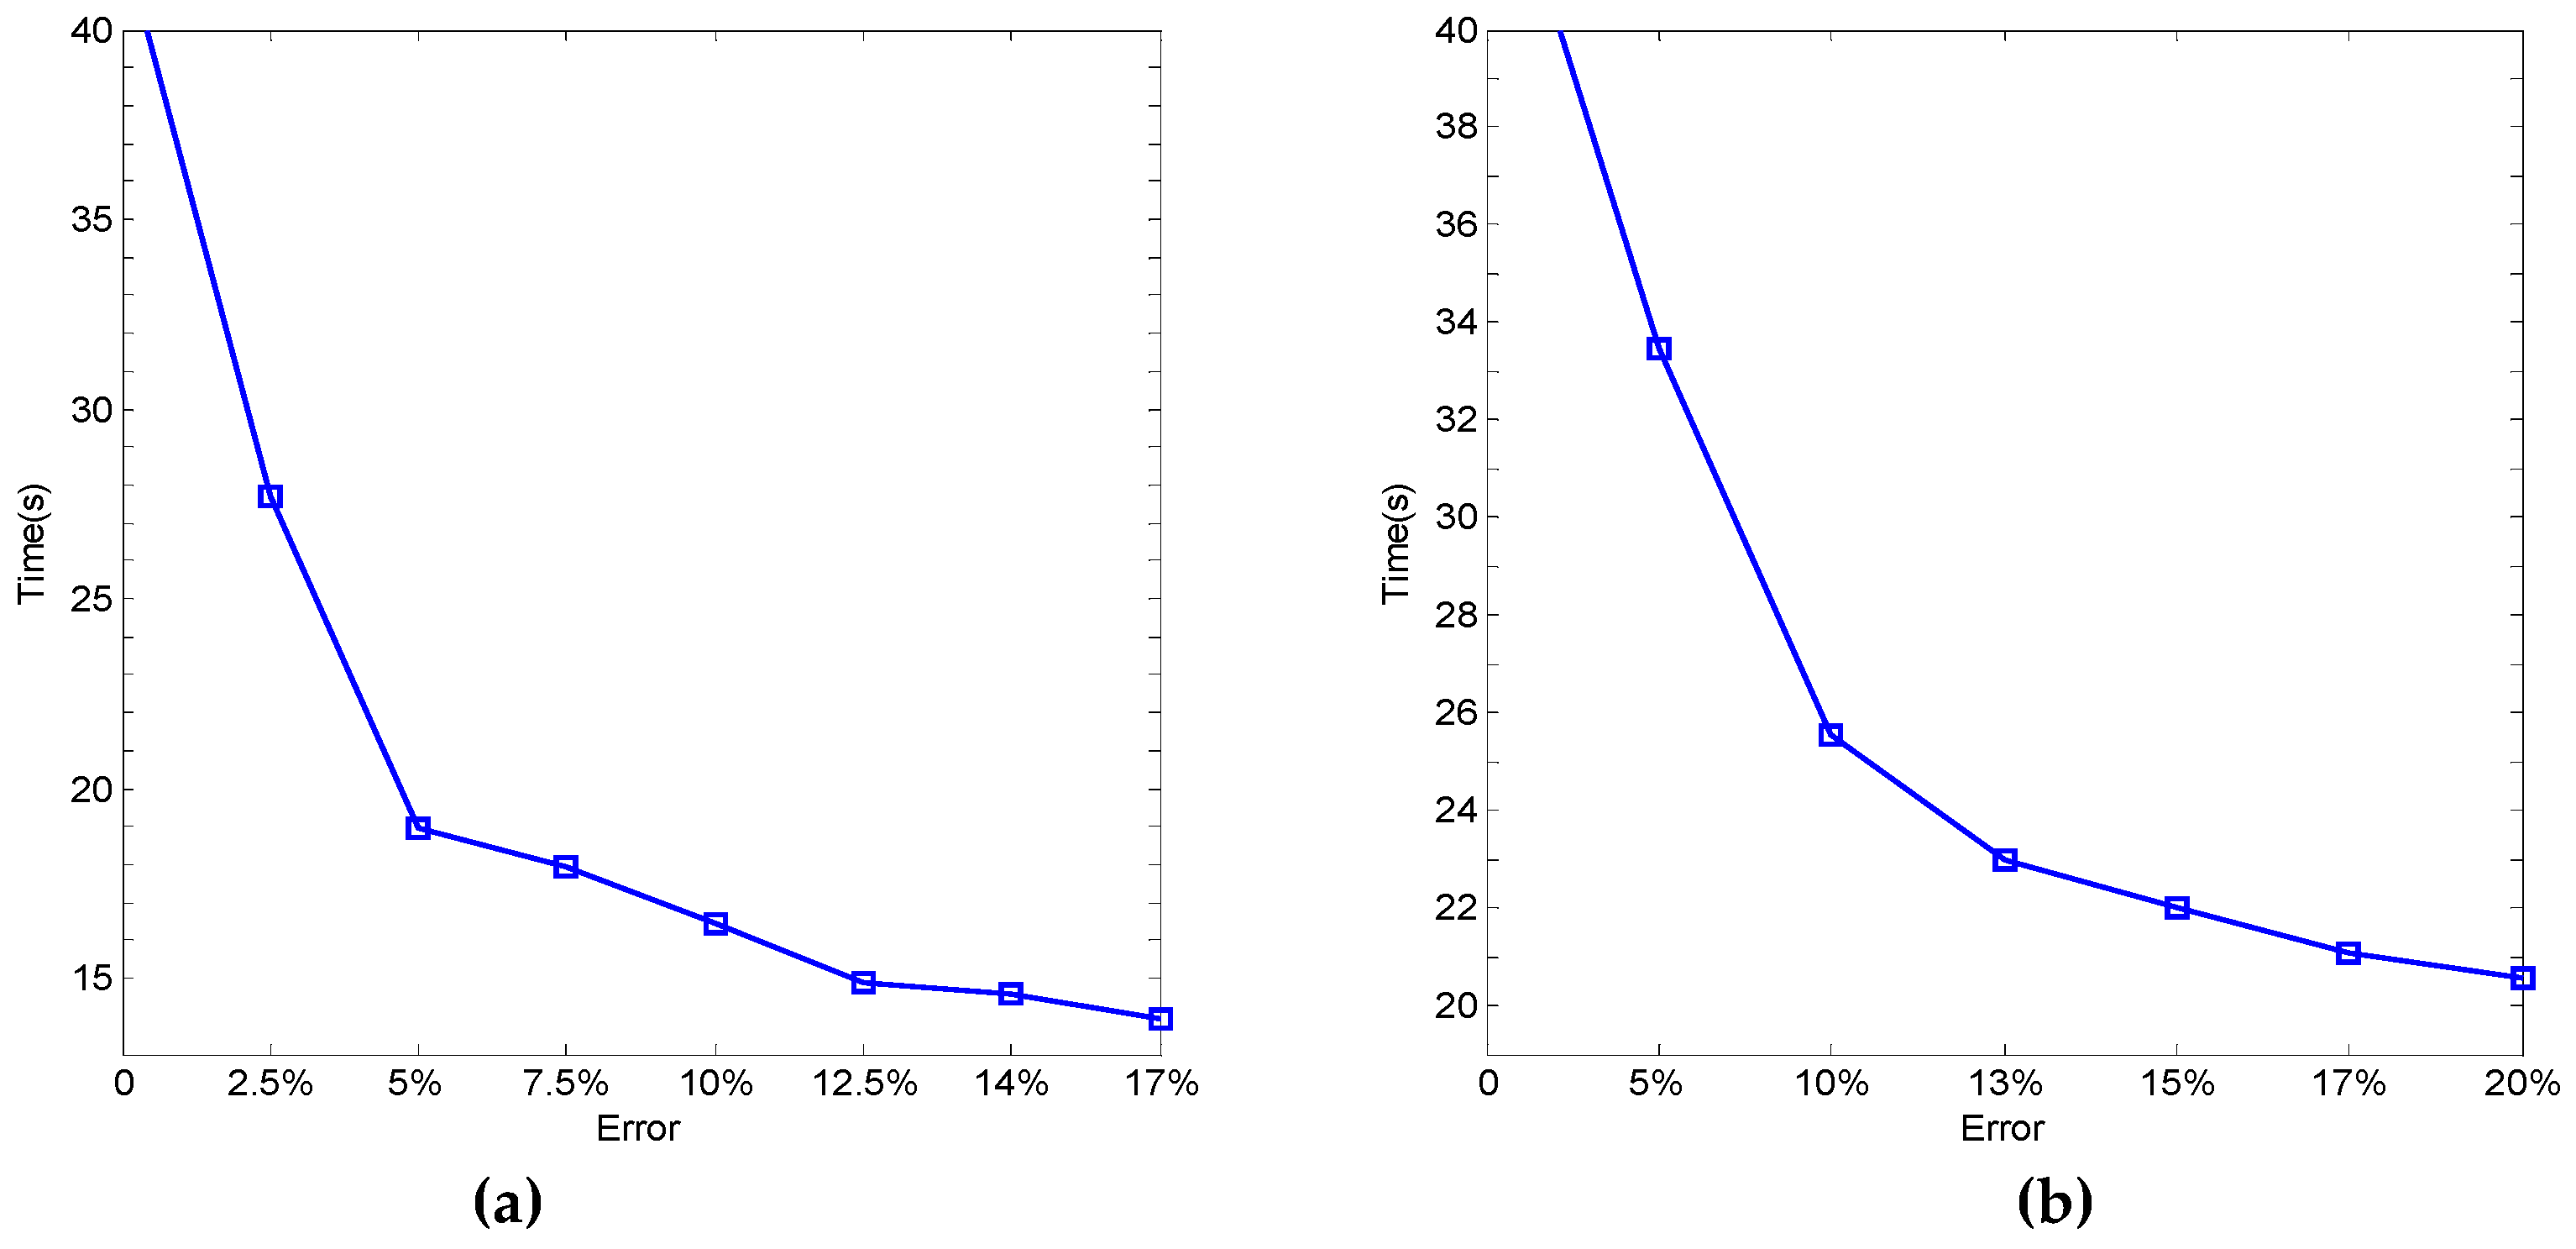
In addition, we also examined the relationship between forecasting accuracy and the computation time. In general, in order to get more accurate prediction results, it has to spend more time on the computation process. Figure 10 illustrates the evaluation results for both the sunny and cloudy/rainy/snowy weather conditions under a 10-min action delay. From Figure 10a we can see that nearly-accurate forecasting takes more than twice the time compared to achieving 95% accuracy, while in contrast, to achieve 95% accuracy only takes 3 s more than to achieve 90% accuracy. Similarly, from Figure 10b we can see that accurate forecasting takes more than twice the time compared to achieving 85% accuracy, while to achieve 90% accuracy only takes 4 s more than to achieve 85% accuracy. This implies it could be practical and helpful to spend a little more time to get better forecasting results. Besides, comparing Figure 10a,b, it can be observed the forecasting time cost of the cloudy/rainy/snowy day is much higher than the sunny day. For example, in Figure 10a it only takes about 17 s to achieve 90% accuracy but in Figure 10b it takes nearly 26 s.
6. Conclusions and Future Work
In this paper, we proposed the idea that putting the datacenters into the grid integrated with renewables as dynamic loads to maintain the normal operation of the grid. In addition, we designed an optimal load allocation strategy based on stochastic searching ideas, which could achieve a reasonable distribution of the load to get the minimum power losses when deploying multiple datacenters in the grid. Our results show that multiple datacenters in the smart grid as dynamic loads can effectively reduce the power losses and especially when adopting the optimal load-allocation scheme obtained by the GA-based method to adjust the power usage of datacenters; the advantages would more obvious. Stability issues of the grid were also considered in the problem we defined and the experiments we conducted, including bus voltage variations and the overloading of transmission lines. Besides, we also incorporated practical factors into the experiments such as the flexibility and action delay during the demand response process of datacenters. Moreover, in order to eliminate the inescapable influence of the action delay when adjusting the power of the datacenters as much as possible, we adopted forecasting techniques to predict the renewable energy generation amount looking ahead, under both sunny and cloudy/snowy weather conditions. Comparing the results under different action delay settings, it can be seen that adopting the forecasting method could reduce the extra power losses effectively. During our experiments, the relationship of computational time and the achieved accuracy was also investigated, which illustrated the feasibility of the proposed method based on forecasting.
From the study about forecasting results and forecasting time, we also found that the time cost of the forecasting method could further be optimized. As the next step, we will focus on the combination of multiple kinds of demand response strategies and approaches in the datacenter towards the requirements of the electricity providers. Besides, we will also pay more attention to the power management and other kinds of reliability issues of the smart grid after integrating renewable energy sources and take frequency and voltage excursion as the knobs to facilitate better demand response in the future work.
Author Contributions
Conceptualization, P.L. and X.W.; methodology, P.L.; software, H.J.; validation, Y.L., X.Y.; formal analysis, P.L.; investigation, H.J.; resources, P.L.; data curation, Y.L.; writing—original draft preparation, P.L.; writing—review and editing, X.W.; supervision, X.W.; project administration, X.W.; funding acquisition, Y.W.
Funding
This paper is partially supported by The National Natural Science Foundation of China (No. 61762074, No. 91847302, No. 61563044 and No. 61862053) and National Natural Science Foundation of Qinghai Province (No. 2019-ZJ-7034, No. 2015-ZJ-725, No. 2017-ZJ-902).
Conflicts of Interest
The authors declare no conflict of interest.
References
- Singh, G.K. Solar power generation by PV (photovoltaic) technology: A review. Energy 2013, 2, 1–13. [Google Scholar] [CrossRef]
- Hill, C.A.; Such, M.C.; Chen, D.; Gonzalez, J.; Grady, W.M. Battery energy storage for enabling integration of distributed solar power generation. IEEE Trans. Smart Grid 2012, 2, 850–857. [Google Scholar] [CrossRef]
- Freitag, M.; Teuscher, J.; Saygili, Y.; Zhang, X.; Giordano, F.; Liska, P.; Hua, J.; Zakeeruddin, S.M.; Moser, J.; Grätzel, M.; et al. Dye-sensitized solar cells for efficient power generation under ambient lighting. Nat. Photonics 2017, 2, 372. [Google Scholar] [CrossRef]
- Lund, H. Electric grid stability and the design of sustainable energy systems. Int. J. Sustain. Energy 2005, 2, 45–54. [Google Scholar] [CrossRef]
- PJM. A Survey of Transmission Cost Allocation Issues, Methods and Practices; Valley Forge: New York, NY, USA, 2010. [Google Scholar]
- Koomey, J. Growth in Data Center Electricity Use 2005 to 2010; Analytics Press: Oakland, CA, USA, 2011. [Google Scholar]
- The Worldbank Data. Available online: https://data.worldbank.org (accessed on 25 January 2018).
- Luo, P.; Wang, X.; Jin, H.; Li, Y.; Yang, X. Load Management for Multiple Datacenters towards Demand Response in the Smart Grid Integrating Renewable Energy. In Proceedings of the 2018 2nd International Conference on Computer Science and Artificial Intelligence (CSAI 2018), Shenzhen, China, 8–10 December 2018. [Google Scholar]
- Chec. Available online: http://www.chec.com.cn (accessed on 26 December 2018).
- Alashkar, A.; Gadalla, M. Thermo-economic analysis of an integrated solar power generation system using nanofluids. Appl. Energy 2017, 2, 469–491. [Google Scholar] [CrossRef]
- Wang, Q.; Xia, C.; Tang, Z. Discussion on Feasibility for Distributed Energy in Internet Data Center. Power Syst. Clean Energy 2013, 87–91. (In Chinese) [Google Scholar]
- Gao, P.X.; Curtis, A.P.; Wong, B.; Keshav, S. It’s not easy being green. In Proceedings of the ACM SIGCOM 2012, Helsinki, Finland, 13–17 August 2012; pp. 211–222. [Google Scholar] [CrossRef]
- Ren, C.-G.; Wang, D.; Urgaonkar, B.; Sivasubramaniam, A. Carbon- aware energy capacity planning for datacenters. In Proceedings of the IEEE International Symposium on Modeling, Analysis and Simulation of Computer and Tele-Communication Systems (MASCOTS2012), Washington, DC, USA, 7–9 August 2012; pp. 391–400. [Google Scholar] [CrossRef]
- Greenpeace. Available online: http://www.greenpeace.org (accessed on 26 December 2018).
- Cook, G.; Horn, J.V. How Dirty Is Your Data? A Look at the Energy Choices That Power Cloud Computing; Greenpeace International Technical Report; Greenpeace International: Amsterdam, The Netherlands, 2011. [Google Scholar]
- Ben, K. The country plans to add 6000MW of distributed photovoltaic power generation capacity next year. East China Electric Power 2013, 10. [Google Scholar]
- POWERCHINA. Available online: http://www.powerchina.cn/col/col382/index.html (accessed on 26 December 2018).
- Qureshi, A.; Weber, R.; Balakrishnan, H.; Guttag, J.; Maggs, B. Cutting the electric bill for internet-scale systems. In Proceedings of the ACM SIGCOMM, Barcelona, Spain, 17–21 August 2009. [Google Scholar]
- Liu, Z.; Lin, M.; Wierman, A.; Low, S.H.; Andrew, L.L. Greening geographical load balancing. In Proceedings of the ACM SIGMETRICS, San Jose, CA, USA, 7–11 June 2011. [Google Scholar]
- Lin, M.; Wierman, A.; Andrew, L.L.; Thereska, E. Dynamic right-sizing for power-proportional data centers. IEEE/ACM Trans. Network. (TON) 2013, 21, 1378–1391. [Google Scholar]
- Liu, Z.; Chen, Y.; Bash, C.; Wierman, A.; Gmach, D.; Wang, Z.; Marwah, M.; Hyser, C. Renewable and cooling aware workload management for sustainable data centers. In Proceedings of the ACM SIGMETRICS, London, UK, 11–15 June 2012. [Google Scholar]
- Guo, Y.; Fang, Y. Electricity cost saving strategy in data centers by using energy storage. IEEE Trans. Parallel Distrib. Syst. 2013, 24, 1149–1160. [Google Scholar] [CrossRef]
- Guo, Y.; Gong, Y.; Fang, Y.; Khargonekar, P.P.; Geng, X. Energy and network aware workload management for sustainable data centers with thermal storage. IEEE Trans. Parallel Distrib. Syst. 2014, 25, 2030–2042. [Google Scholar] [CrossRef]
- Ghatikar, G.; Ganti, V.; Matson, N.; Piette, M.A. Demand Response Opportunities and Enabling Technologies for Data Centers: Findings from Field Studies. 2012. Available online: http:// eetd.lbl.gov/sites/all/files/LBNL-5763E.pdf (accessed on 14 September 2018).
- Urgaonkar, R.; Urgaonkar, B.; Neely, M.; Sivasubramaniam, A. Optimal Power Cost Management Using Stored Energy in Data Centers. In Proceedings of the ACM SIGMETRICS, San Jose, CA, USA, 7–11 June 2011. [Google Scholar]
- Gandhi, A.; Chen, Y.; Gmach, D.; Arlitt, M.; Marwah, M. Minimizing data center sla violations and power consumption via hybrid resource provisioning. In Proceedings of the IGCC, Orlando, FL, USA, 25–28 July 2011. [Google Scholar]
- Chen, Y.; Gmach, D.; Hyser, C.; Wang, Z.; Bash, C.; Hoover, C.; Singhal, S. Integrated management of application performance, power and cooling in data centers. In Proceedings of the NOMS, Osaka, Japan, 19–23 April 2010. [Google Scholar]
- Govindan, S.; Choi, J.; Urgaonkar, B.; Sivasubramaniam, A.; Baldini, A. Statistical profiling-based techniques for effective power provisioning in data centers. In Proceedings of the 4th ACM European Conference on Computer Systems, Nuremberg, Germany, 1–3 April 2009. [Google Scholar]
- Choi, J.; Govindan, S.; Urgaonkar, B.; Sivasubramaniam, A. Profiling, prediction, and capping of power consumption in consolidated environments. In Proceedings of the MASCOTS, Baltimore, MD, USA, 8–10 September 2008. [Google Scholar]
- Heo, J.; Jayachandran, P.; Shin, I.; Wang, D.; Abdelzaher, T.; Liu, X. Optituner: On performance composition and server farm energy minimization application. IEEE Trans. Parallel Distrib. Syst. 2011, 22, 1871–1878. [Google Scholar] [CrossRef]
- Verma, A.; Dasgupta, G.; Nayak, T.; De, P.; Kothari, R. Server workload analysis for power minimization using consolidation. In Proceedings of the USENIX ATC, San Diego, CA, USA, 14–19 June 2009. [Google Scholar]
- Meisner, D.; Sadler, C.; Barroso, L.; Weber, W.; Wenisch, T. Power management of online data-intensive services. In Proceedings of the ISCA, San Jose, CA, USA, 4–8 June 2011. [Google Scholar]
- Zhang, Q.; Zhani, M.; Zhu, Q.; Zhang, S.; Boutaba, R.; Hellerstein, J. Dynamic energy-aware capacity provisioning for cloud computing environments. In Proceedings of the 9th ACM International Conference on Autonomic Computing, San Jose, CA, USA, 18–20 September 2012. [Google Scholar]
- Xu, H.; Li, B. Cost efficient datacenter selection for cloud services. In Proceedings of the IEEE International Conference on Communications, Beijing, China, 15–17 August 2012. [Google Scholar]
- Yao, Y.; Huang, L.; Sharma, A.; Golubchik, L.; Neely, M. Data centers power reduction: A two time scale approach for delay tolerant workloads. In Proceedings of the INFOCOM, Orlando, FL, USA, 25–30 March 2012; pp. 1431–1439. [Google Scholar]
- Liu, Z.; Wierman, A.; Chen, Y.; Razon, B.; Chen, N. Data center demand response: Avoiding the coincident peak via workload shifting and local generation. In Proceedings of the ACM SIGMETRICS/International Conference on Measurement and Modeling of Computer Systems; ACM: New York, NY, USA, 2013; pp. 341–342. [Google Scholar]
- Aksanli, B.; Rosing, T. Providing regulation services and managing data center peak power budgets. In Proceedings of the Design, Automation and Test in Europe Conference and Exhibition (DATE), Dresden, Germany, 24–28 March 2014; pp. 1–4. [Google Scholar]
- Xu, D.; Liu, X.; Fan, B. Efficient server provisioning and offloading policies for internet datacenters with dynamic load demand. IEEE Trans. Comput. 2015, 2, 682–697. [Google Scholar] [CrossRef]
- Chen, Y.Y.; Das, A.; Qin, W.; Sivasubramaniam, A.; Wang, Q.; Gautam, N. Managing Server Energy and Operational Costs in Hosting Centers. In Proceedings of the ACM SIGMETRICS International Conference on Measurement and Modeling of Computer Systems, Banff, AB, Canada, 6–10 June 2005. [Google Scholar]
- Chen, G.; He, W.; Liu, J.; Nath, S.; Rigas, L.; Xiao, L.; Zhao, F. Energy-Aware Server Provisioning and Load Dispatching for Connection-Intensive Internet Services. In Proceedings of the Fifth USENIX Symposium Networked Systems Design and Implementation (NSDI), San Francisco, CA, USA, 16–18 April 2008. [Google Scholar]
- Weiser, M.; Welch, B.; Demers, A.; Shenker, S. Scheduling for Reduced CPU Energy. In Proceedings of the First USENIX Conference Operating Systems Design and Implementation (OSDI), Monterey, CA, USA, 14–17 November 1994. [Google Scholar]
- Yao, F.F.; Demers, A.; Shenker, S. A Scheduling Model for Reduced CPU Energy. In Proceedings of the 36th Annual Symposium Foundations of Computer Science (FOCS), Milwaukee, WI, USA, 23–25 October 1995. [Google Scholar]
- Lorch, J.R.; Smith, A.J. Improving Dynamic Voltage Scaling Algorithms with PACE. In Proceedings of the ACM SIGMETRICS Int’l Conf. Measurement and Modeling of Computer Systems, Cambridge, MA, USA, 16–20 June 2001. [Google Scholar]
- Wang, X.; Zhang, G.; Yang, M.; Zhang, L.A. Green-aware Virtual Machine Migration Strategy for Sustainable Datacenter Powered by Renewable Energy. Simul. Model. Pract. Theory 2015, 58, 3–14. [Google Scholar] [CrossRef]
- Gungor, V.C.; Sahin, D.; Kocak, T.; Ergut, S.; Buccella, C.; Cecati, C.; Hancke, G.P. A Survey on Smart Grid Potential Applications and Communication Requirements. IEEE Trans. Ind. Inform. 2013, 2, 28–42. [Google Scholar] [CrossRef]
- Ahamed, M.H.F.; Dissanayake, U.; De Silva, H.M.P.; Pradeep, H.R.C.G.P.; Lidula, N.W.A. Modelling and simulation of a solar PV and battery based DC microgrid system. In Proceedings of the IEEE International Conference on Electrical, Electronics, and Optimization Techniques (ICEEOT), Chennai, India, 3–5 March 2016; pp. 1706–1711. [Google Scholar] [CrossRef]
- Cheng, Z.; Li, Y.; Xie, Y. Control strategy for hybrid energy storage of photovoltaic generation microgrid system with super capacitor. Power Syst. Technol. 2015, 2, 2739–2745. (In Chinese) [Google Scholar]
- Shang, G.; Xin-Chun, Q.I.; Tao, X.; Zheng, X. Common DC bus based PV-hybrid energy storage power system and optimal control using double filters. Power System Prot. Control 2014, 2, 92–97. (In Chinese) [Google Scholar]
- Zheng, S.C.; Wang, P.Z.; Ge, L.S. Study on Pwm Control Strategy of Photovoltaic Grid-connected Generation System. In Proceedings of the 2006 CES/IEEE 5th International Power Electronics and Motion Control Conference, Shanghai, China, 14–16 August 2006. [Google Scholar]
- Zhang, G.; Zhang, T.; Ding, M.; Su, J.; Wang, H.; Lv, S.; Chen, J. Simulation research on unified power quality conditioner with PV grid connected generation. Proc. CSEE 2007, 2, 82–86. (In Chinese) [Google Scholar]
- Lund, H.; Østergaard, P.A.; Connolly, D.; Mathiesen, B.V. Smart Energy and Smart Energy Systems. Energy 2017, 137, 556–565. [Google Scholar] [CrossRef]
- Lund, H. Renewable Energy Systems—A Smart Energy Systems Approach to the Choice and Modeling of 100% Renewable Solutions. Chem. Eng. Trans. 2014, 39, 1–6. [Google Scholar]
- Lund, H.; Østergaard, P.A.; Connolly, D.; Ridjan, I. Energy Storage and Smart Energy Systems. Int. J. Sustain. Energy Plan. Manag. 2016, 11, 3–14. [Google Scholar]
- Short, J.A.; Infield, D.G.; Freris, L.L. Stabilization of Grid Frequency Through Dynamic Demand Control. IEEE Trans. Power Syst. 2007, 2, 1284–1293. [Google Scholar] [CrossRef]
- Kondoh, J.; Aki, H.; Yamaguchi, H.; Murata, A.; Ishii, I. Consumed power control of time deferrable loads for frequency regulation. In Proceedings of the IEEE Power Systems Conference and Exposition, New York, NY, USA, 10–13 October 2004. [Google Scholar]
- Zimmerman, R.D.; Murillo-Sánchez, C.E.; Thomas, R.J. MATPOWER: Steady-State Operations, Planning and Analysis Tools for Power Systems Research and Education. IEEE Trans. Power Syst. 2011, 26, 12–19. [Google Scholar] [CrossRef]
- SmartPV. Available online: http://www.lvsedianli.com (accessed on 26 December 2018).
- Mitchell, M. An Introduction to Genetic Algorithms; MIT Press: Cambridge, MA, USA, 1998. [Google Scholar]
- Yang, C.; Du, Z.; Shi, T.; Fang, L. Development status and trend of large-scale new energy and renewable energy power friendly access technology. China Acad. J. 2008, 8, 14–17. (In Chinese) [Google Scholar]
- Keras Documentation. Available online: https://keras.io (accessed on 26 December 2018).
- Chow, J.H.; Frederick, D.K.; Chbat, N.W. Discrete-Time Control Problems Using MATLAB and the Control System Toolbox; Thomson-Brooks/Cole: London, UK, 2003; 269p, ISBN 05343847. [Google Scholar]
Figure 1.
Model of the IEEE 30-bus test system.

Figure 2.
Two-point crossover operation. (A) and (B) are two randomly selected individuals, and A’ and B’ are the resultant individuals after the crossover operation.
Figure 2.
Two-point crossover operation. (A) and (B) are two randomly selected individuals, and A’ and B’ are the resultant individuals after the crossover operation.

Figure 3.
Input solar generation power. (a) Sunny day; (b) cloudy/snowy day.

Figure 4.
Comparison of loss values over three scenarios. (a) sunny day; (b) cloudy/snowy day.

Figure 5.
The impact of different flexibility values.

Figure 6.
The impact of datacenter action delays.

Figure 7.
Forecasting results under 5-min action delay on a sunny day. (a) Comparison of the actual generation power and predicted values after 150 iteration times of one day; (b) comparison of the average power losses under different forecasting accuracy.
Figure 7.
Forecasting results under 5-min action delay on a sunny day. (a) Comparison of the actual generation power and predicted values after 150 iteration times of one day; (b) comparison of the average power losses under different forecasting accuracy.

Figure 8.
Forecasting results under a 10-min action delay on a sunny day. (a,c) show the forecasting results by different iteration time, where the iteration time is 150 s in (a) and 125 s in (c). (b,d) show the average power losses under different settings.
Figure 8.
Forecasting results under a 10-min action delay on a sunny day. (a,c) show the forecasting results by different iteration time, where the iteration time is 150 s in (a) and 125 s in (c). (b,d) show the average power losses under different settings.

Figure 9.
Forecasting results under a 10-min action delay. (a,c) show the different iteration time forecasting results, where the iteration time is 150 s in (a), and 120 s in (c). (b,d) show the average power losses under different settings.
Figure 9.
Forecasting results under a 10-min action delay. (a,c) show the different iteration time forecasting results, where the iteration time is 150 s in (a), and 120 s in (c). (b,d) show the average power losses under different settings.

Figure 10.
The relationship between forecasting error and forecasting time. (a) sunny day; (b) cloudy/rainy/snowy day.
Figure 10.
The relationship between forecasting error and forecasting time. (a) sunny day; (b) cloudy/rainy/snowy day.


Table 1.
Statistical results with two datacenters.
| Scenario | (1) | (2) | (3) |
|---|---|---|---|
| Average Total loss (MW) | 19.548 | 19.492 | 19.19 |
| percentage of loss/generation | 8.52% | 8.39% | 8% |
Table 2.
Statistical results with three datacenters.
| Scenario | (1) | (2) | (3) |
|---|---|---|---|
| Average Total loss (MW) | 19.548 | 19.212 | 18.889 |
| percentage of loss/generation | 8.52% | 8.02% | 7.49% |
© 2019 by the authors. Licensee MDPI, Basel, Switzerland. This article is an open access article distributed under the terms and conditions of the Creative Commons Attribution (CC BY) license (http://creativecommons.org/licenses/by/4.0/).
Share and Cite
MDPI and ACS Style
Luo, P.; Wang, X.; Jin, H.; Li, Y.; Yang, X. Smart-Grid-Aware Load Regulation of Multiple Datacenters towards the Variable Generation of Renewable Energy. Appl. Sci. 2019, 9, 518. https://doi.org/10.3390/app9030518
AMA Style
Luo P, Wang X, Jin H, Li Y, Yang X. Smart-Grid-Aware Load Regulation of Multiple Datacenters towards the Variable Generation of Renewable Energy. Applied Sciences. 2019; 9(3):518. https://doi.org/10.3390/app9030518
Chicago/Turabian StyleLuo, Peicong, Xiaoying Wang, Hailong Jin, Yuling Li, and Xuejiao Yang. 2019. "Smart-Grid-Aware Load Regulation of Multiple Datacenters towards the Variable Generation of Renewable Energy" Applied Sciences 9, no. 3: 518. https://doi.org/10.3390/app9030518
Note that from the first issue of 2016, this journal uses article numbers instead of page numbers. See further details here.