Microstructural Investigations of Low Temperature Joining of Q&P Steels Using Ag Nanoparticles in Combination with Sn and SnAg as Activating Material


Abstract
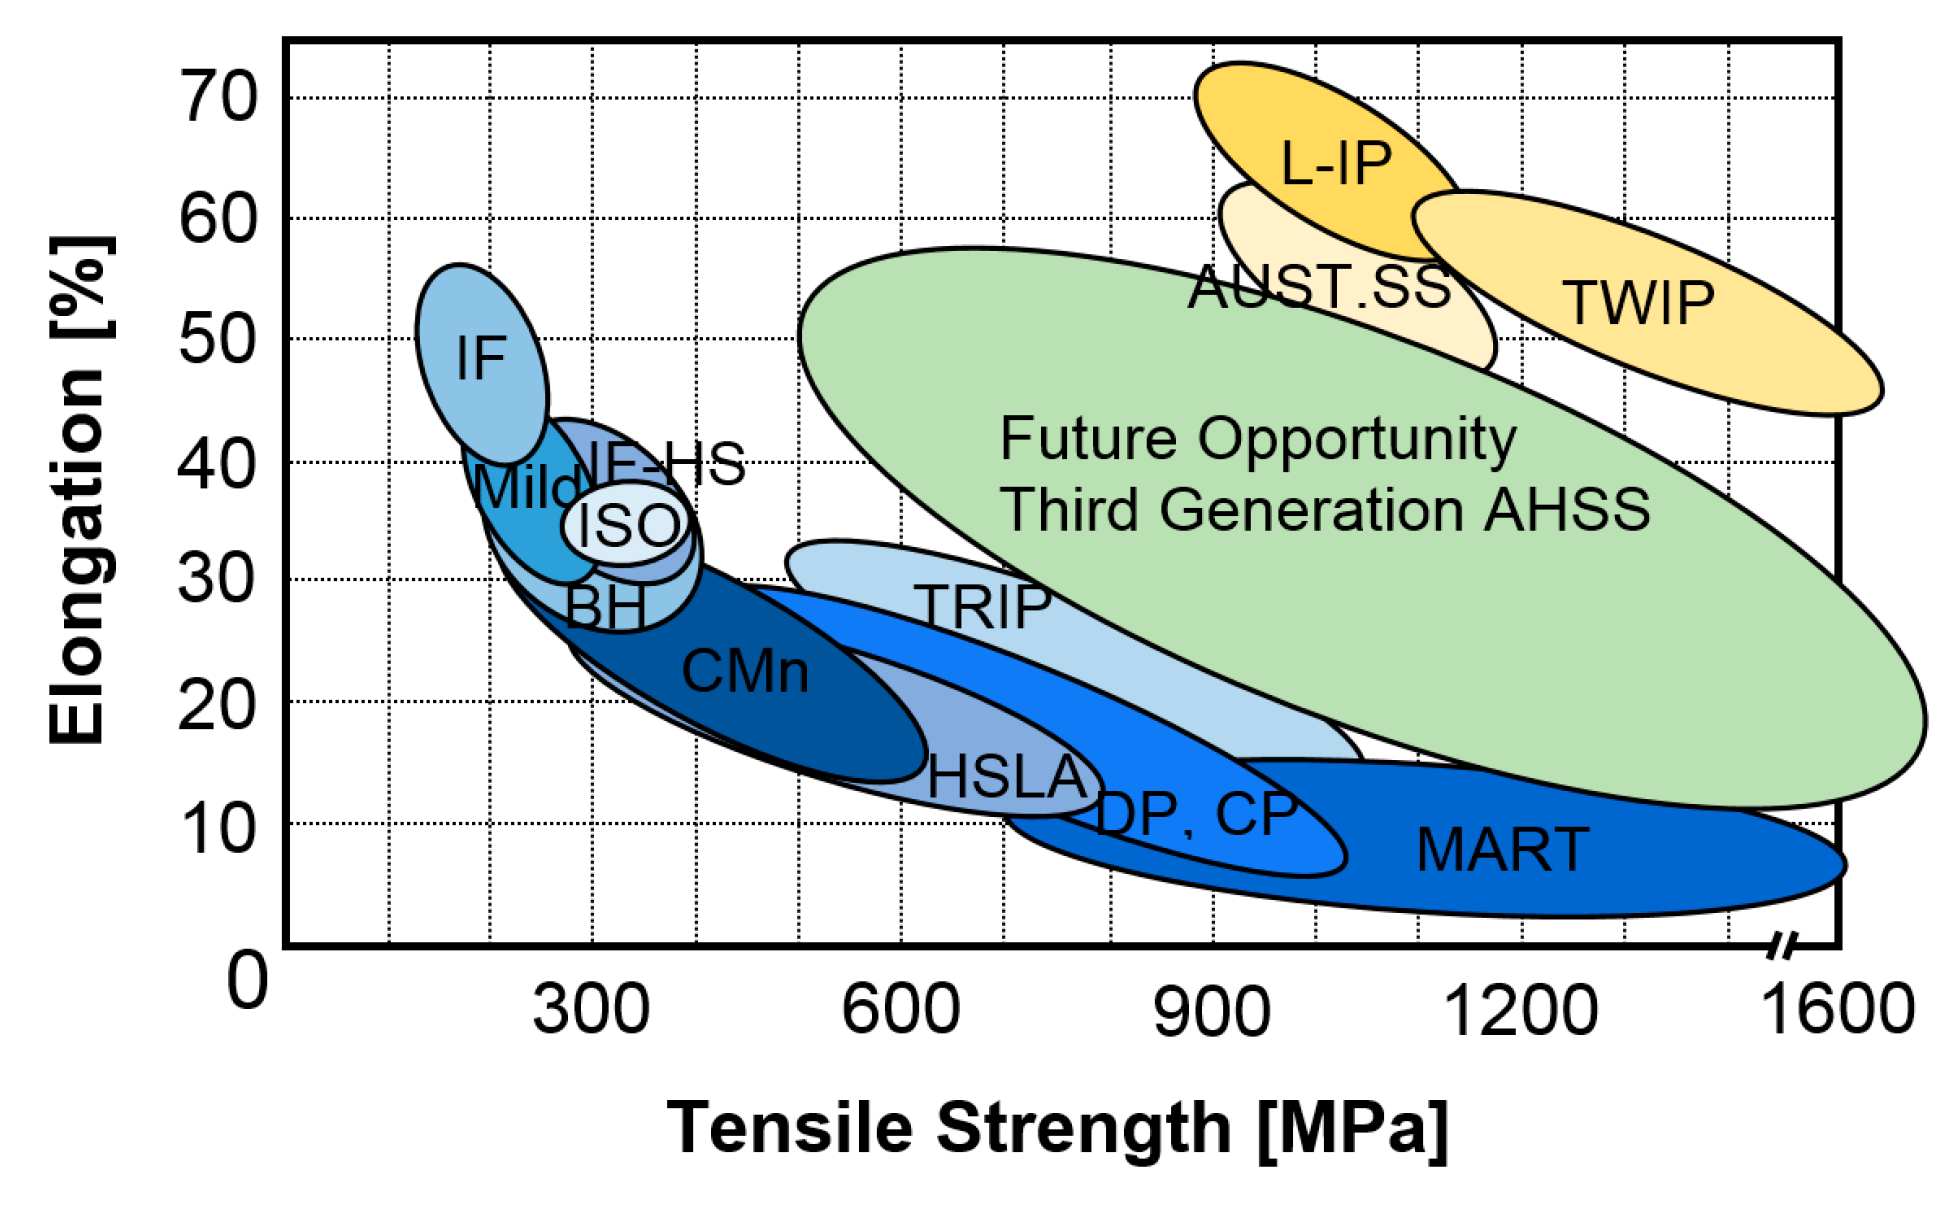
:1. Introduction
2. Materials and Methods
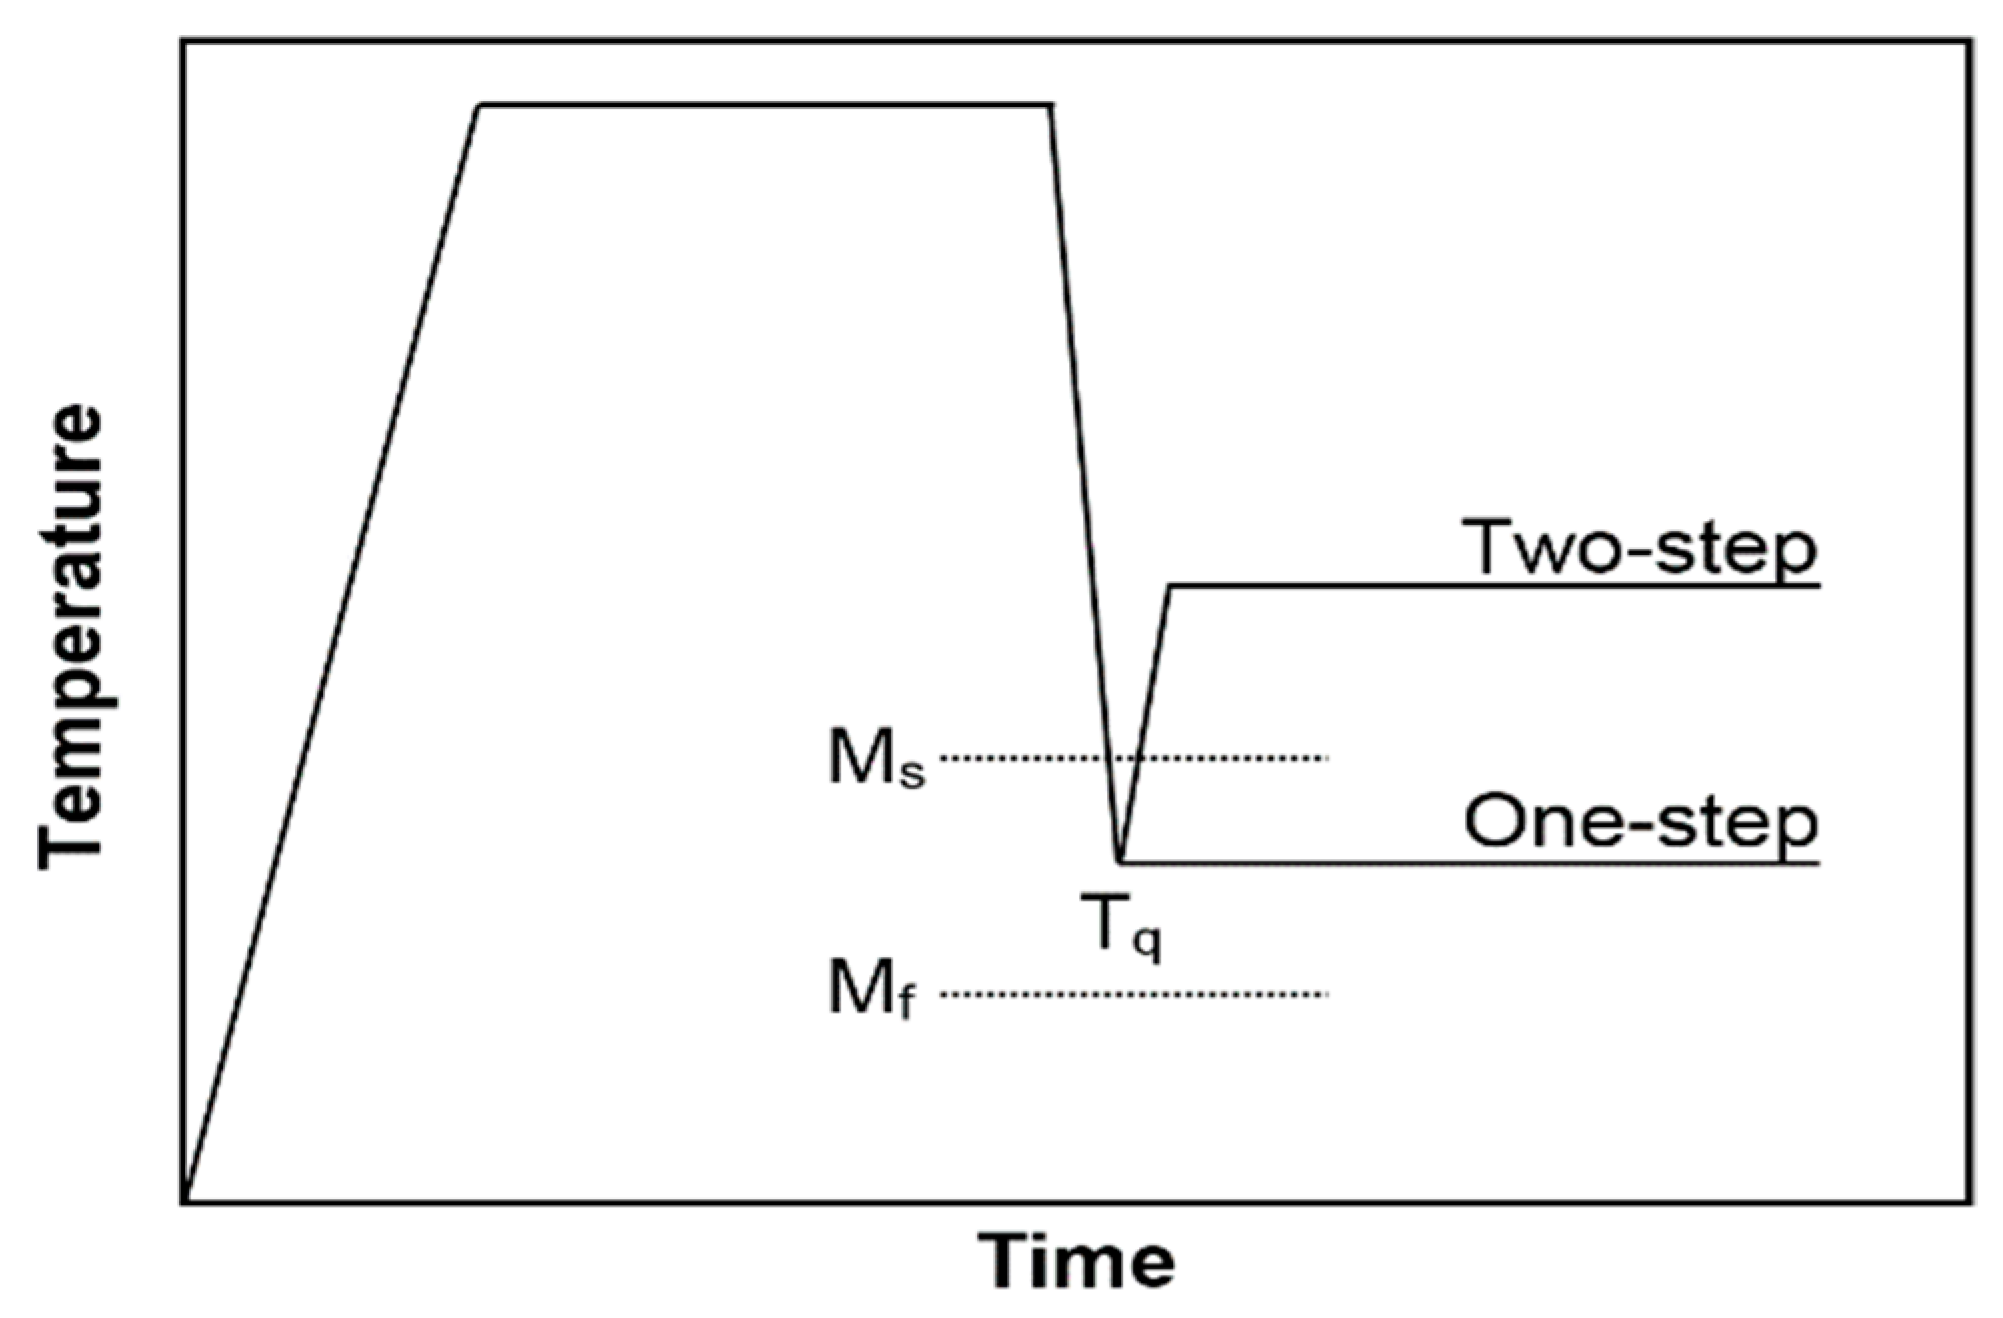
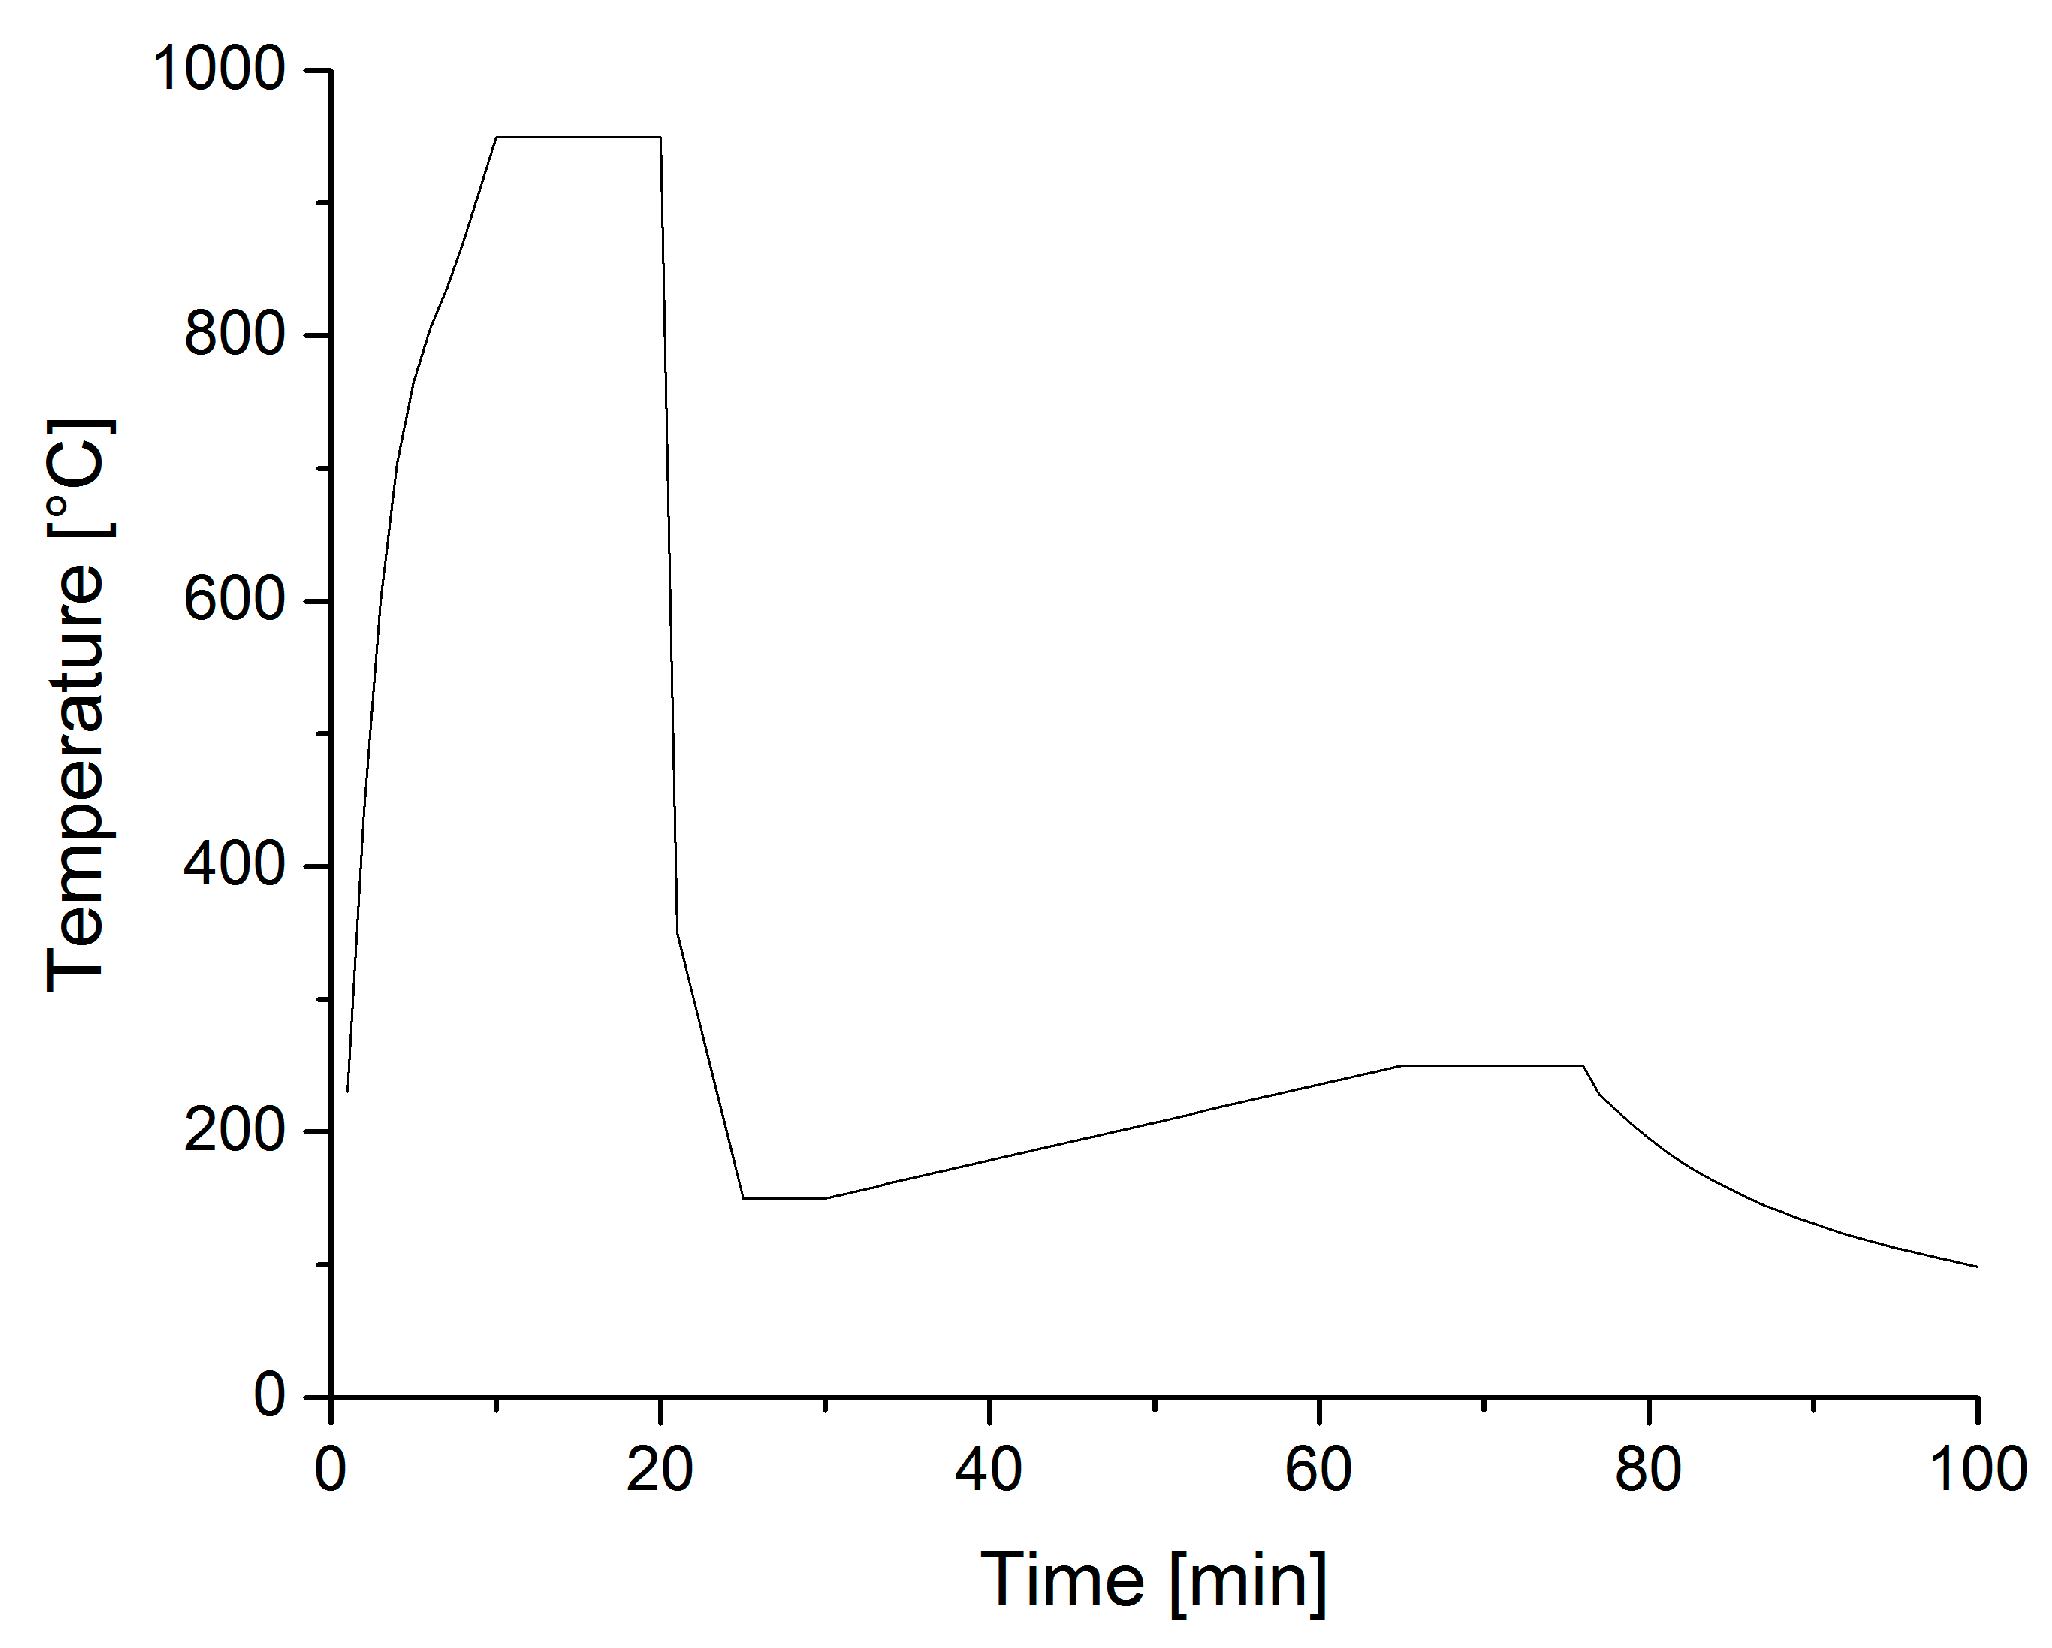
2.1. Steel Composition and Heat Treatment
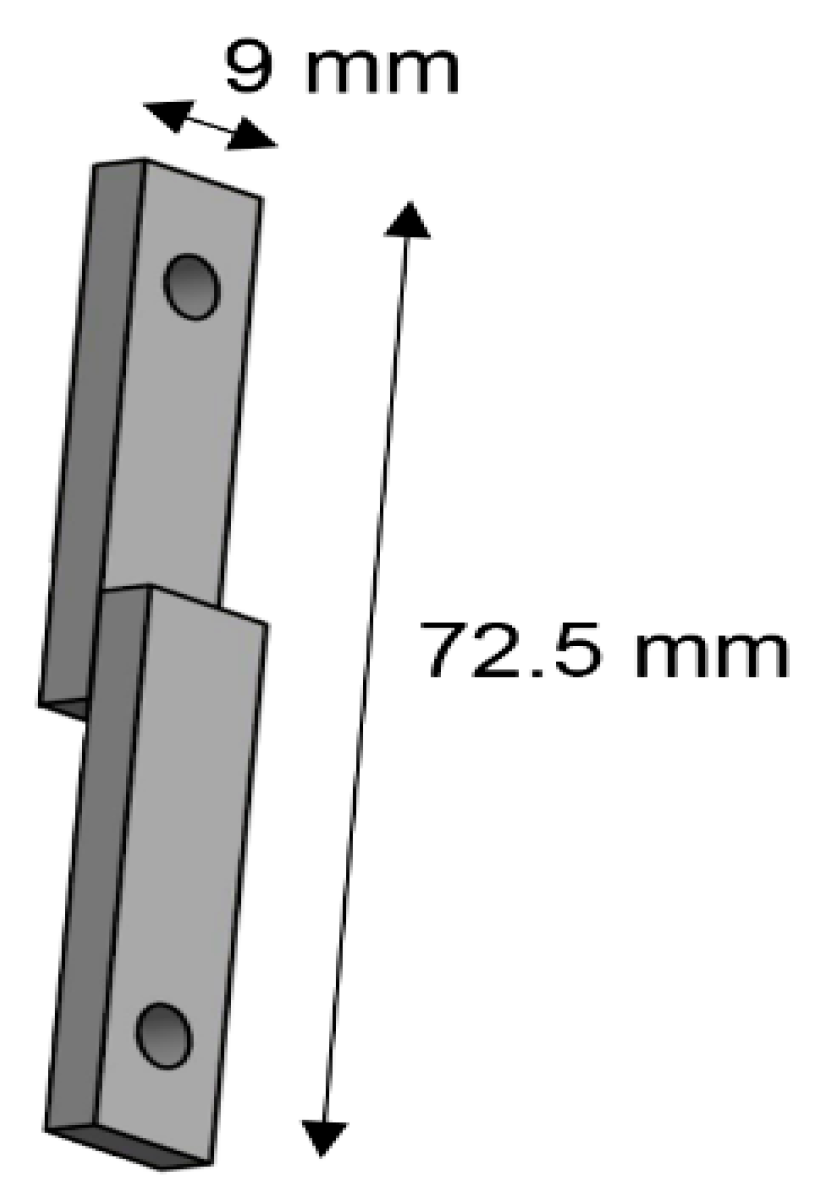
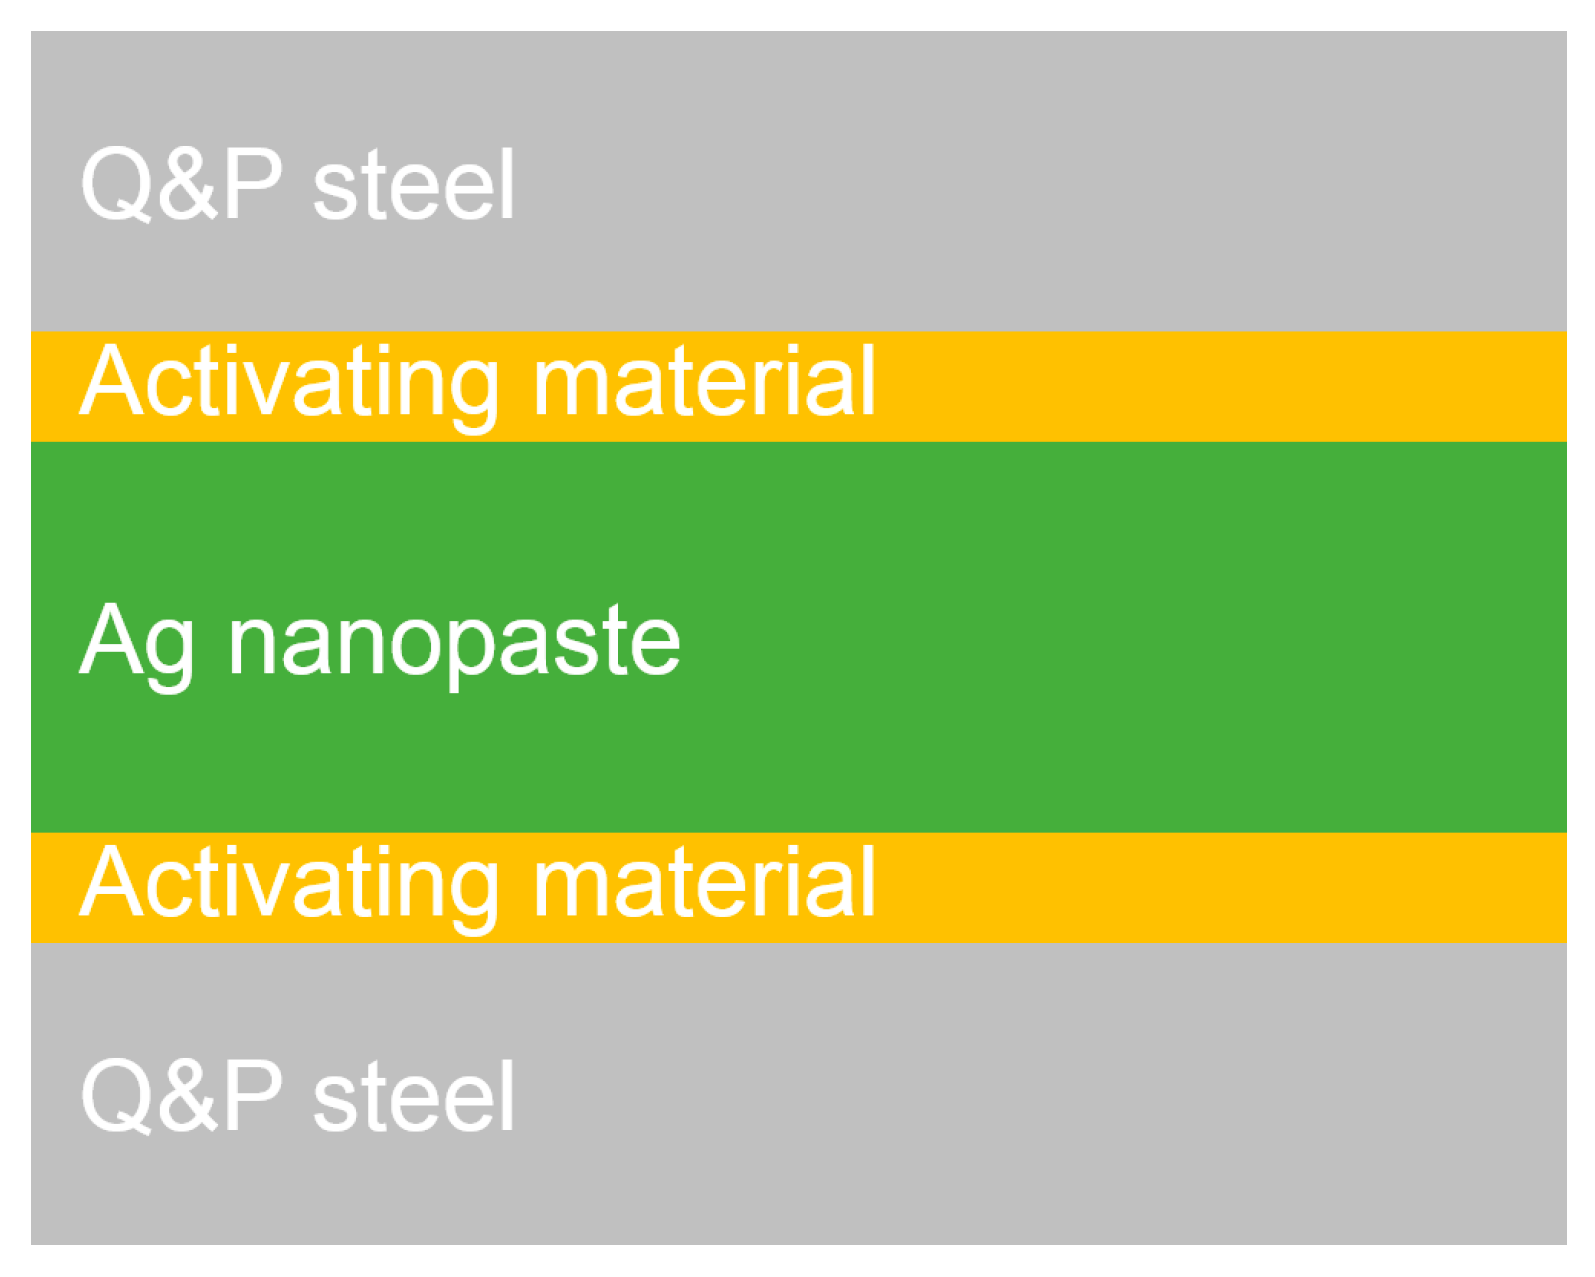
2.2. Joining Experiments
3. Results and Discussion
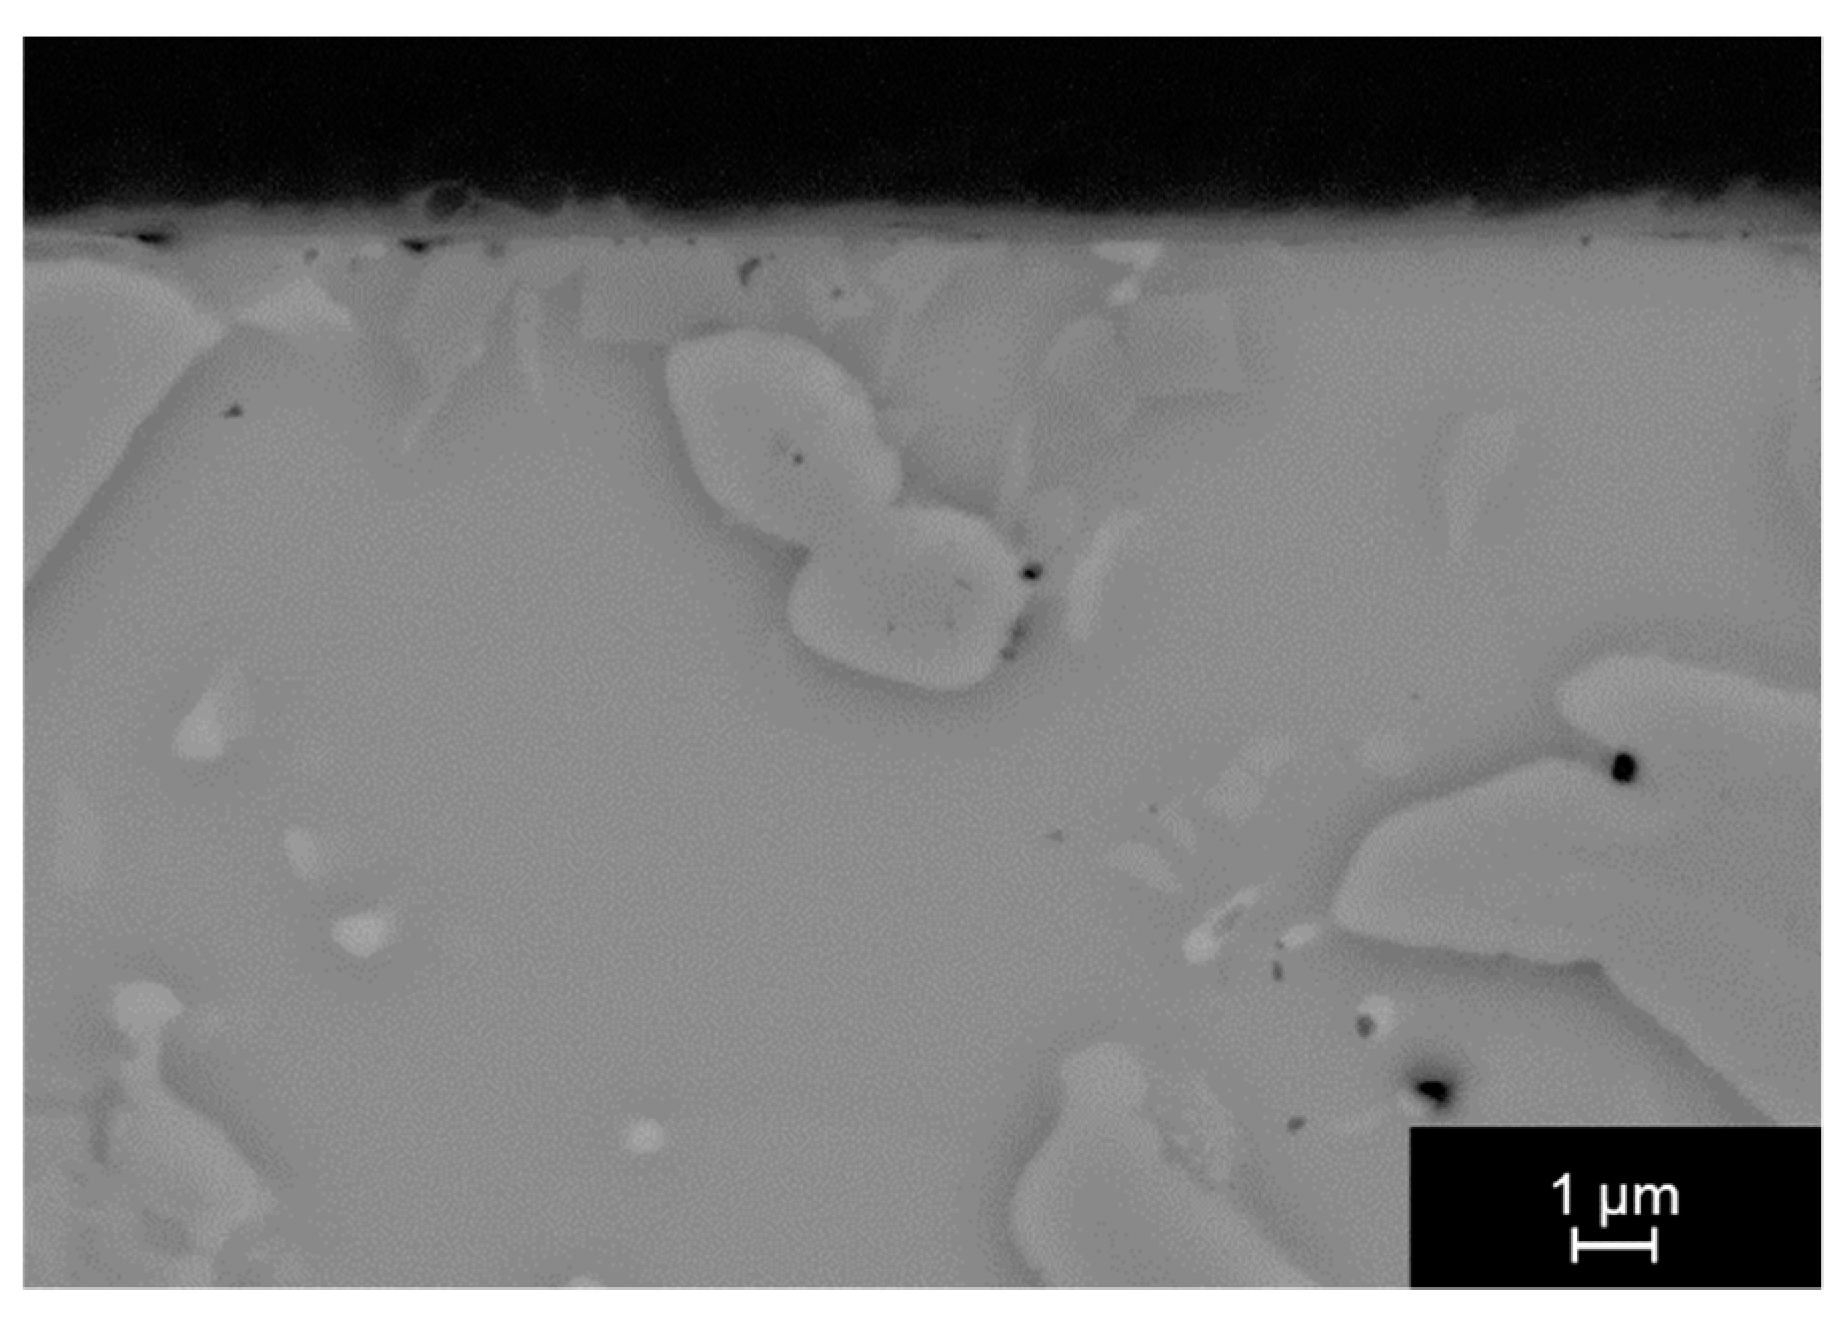
3.1. Joining without Activating Materials
3.2. Joining with Activating Materials
3.2.1. Joining with SnAg Solders as Activating Material
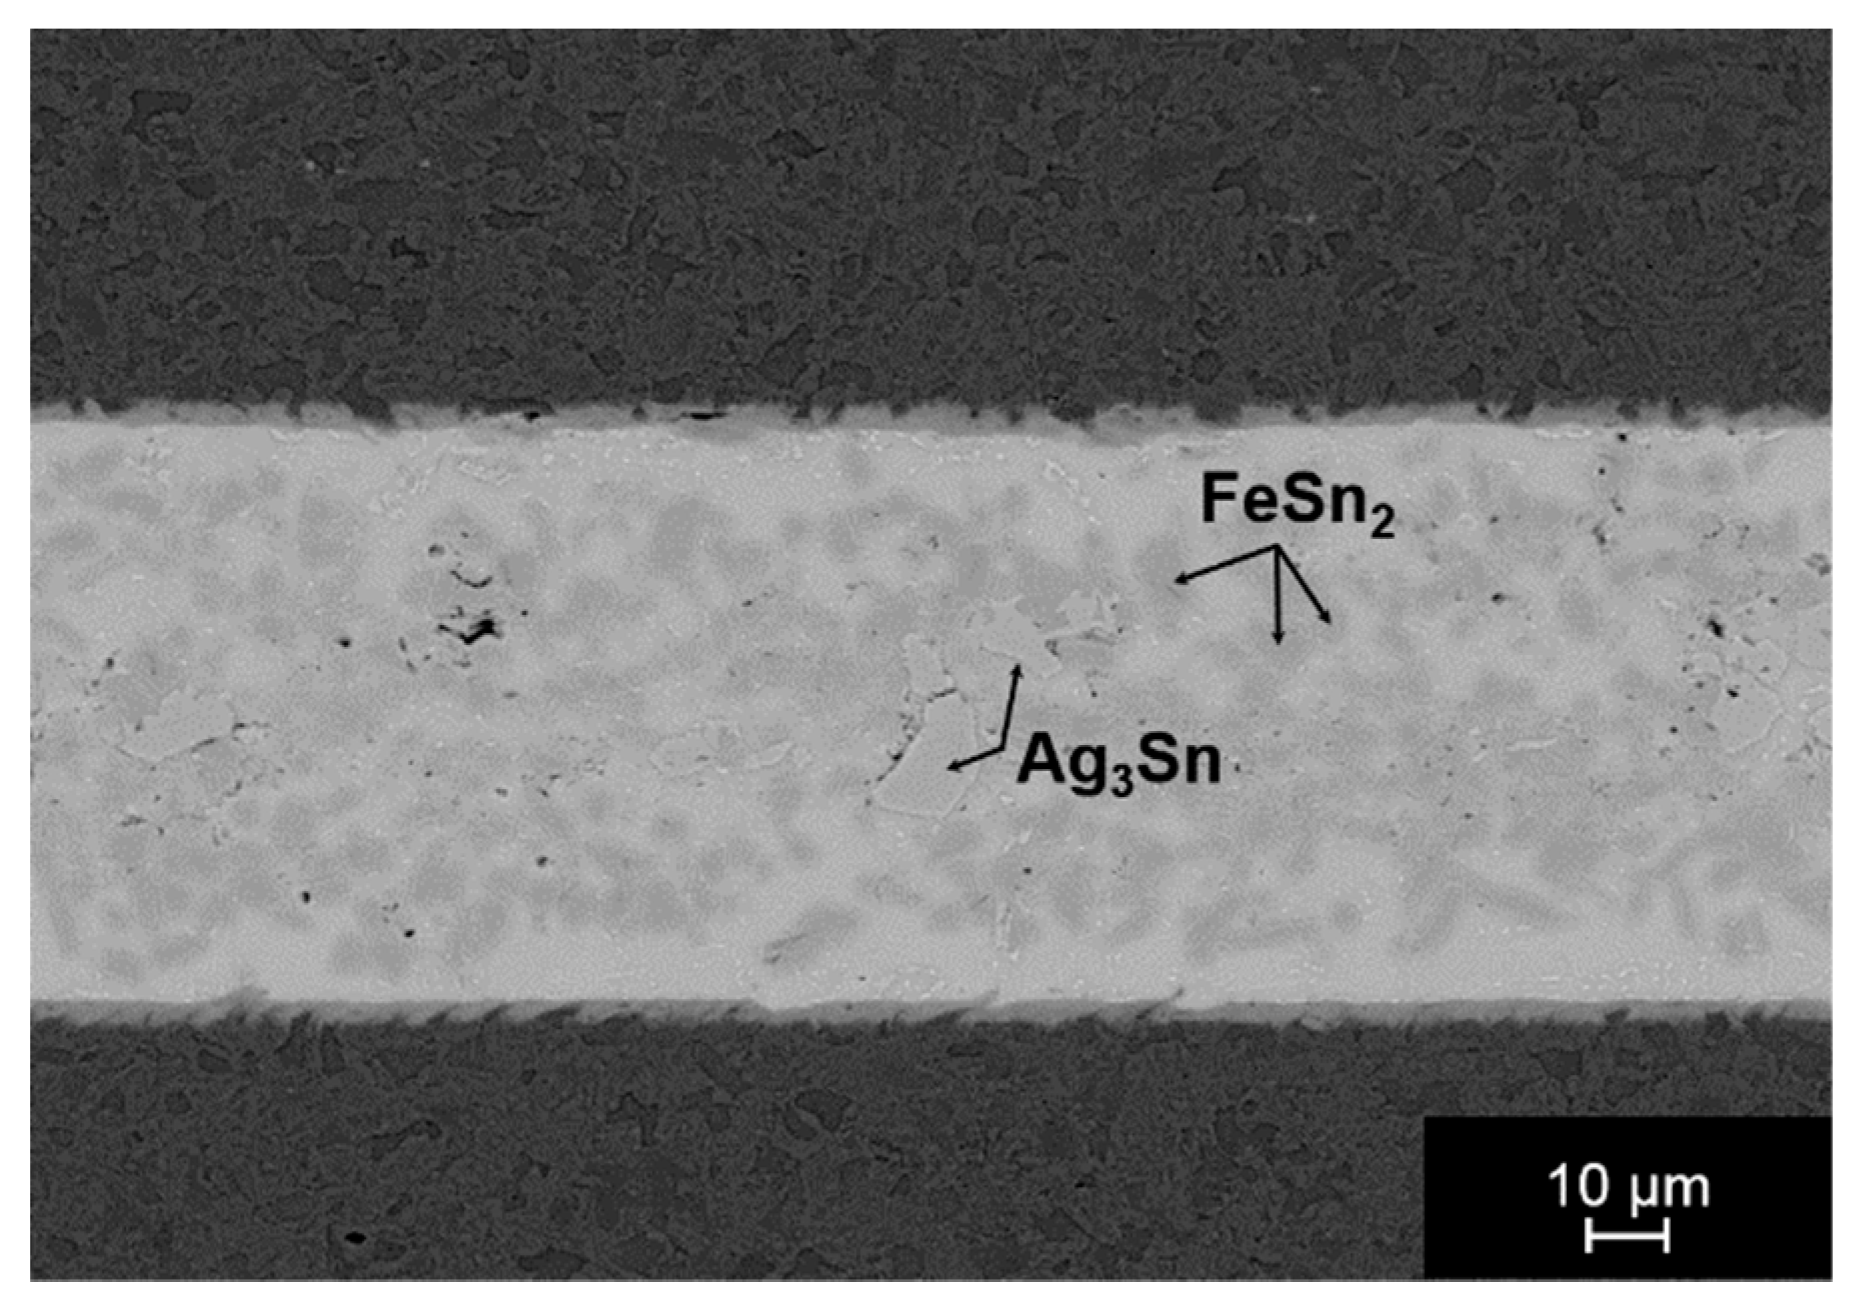
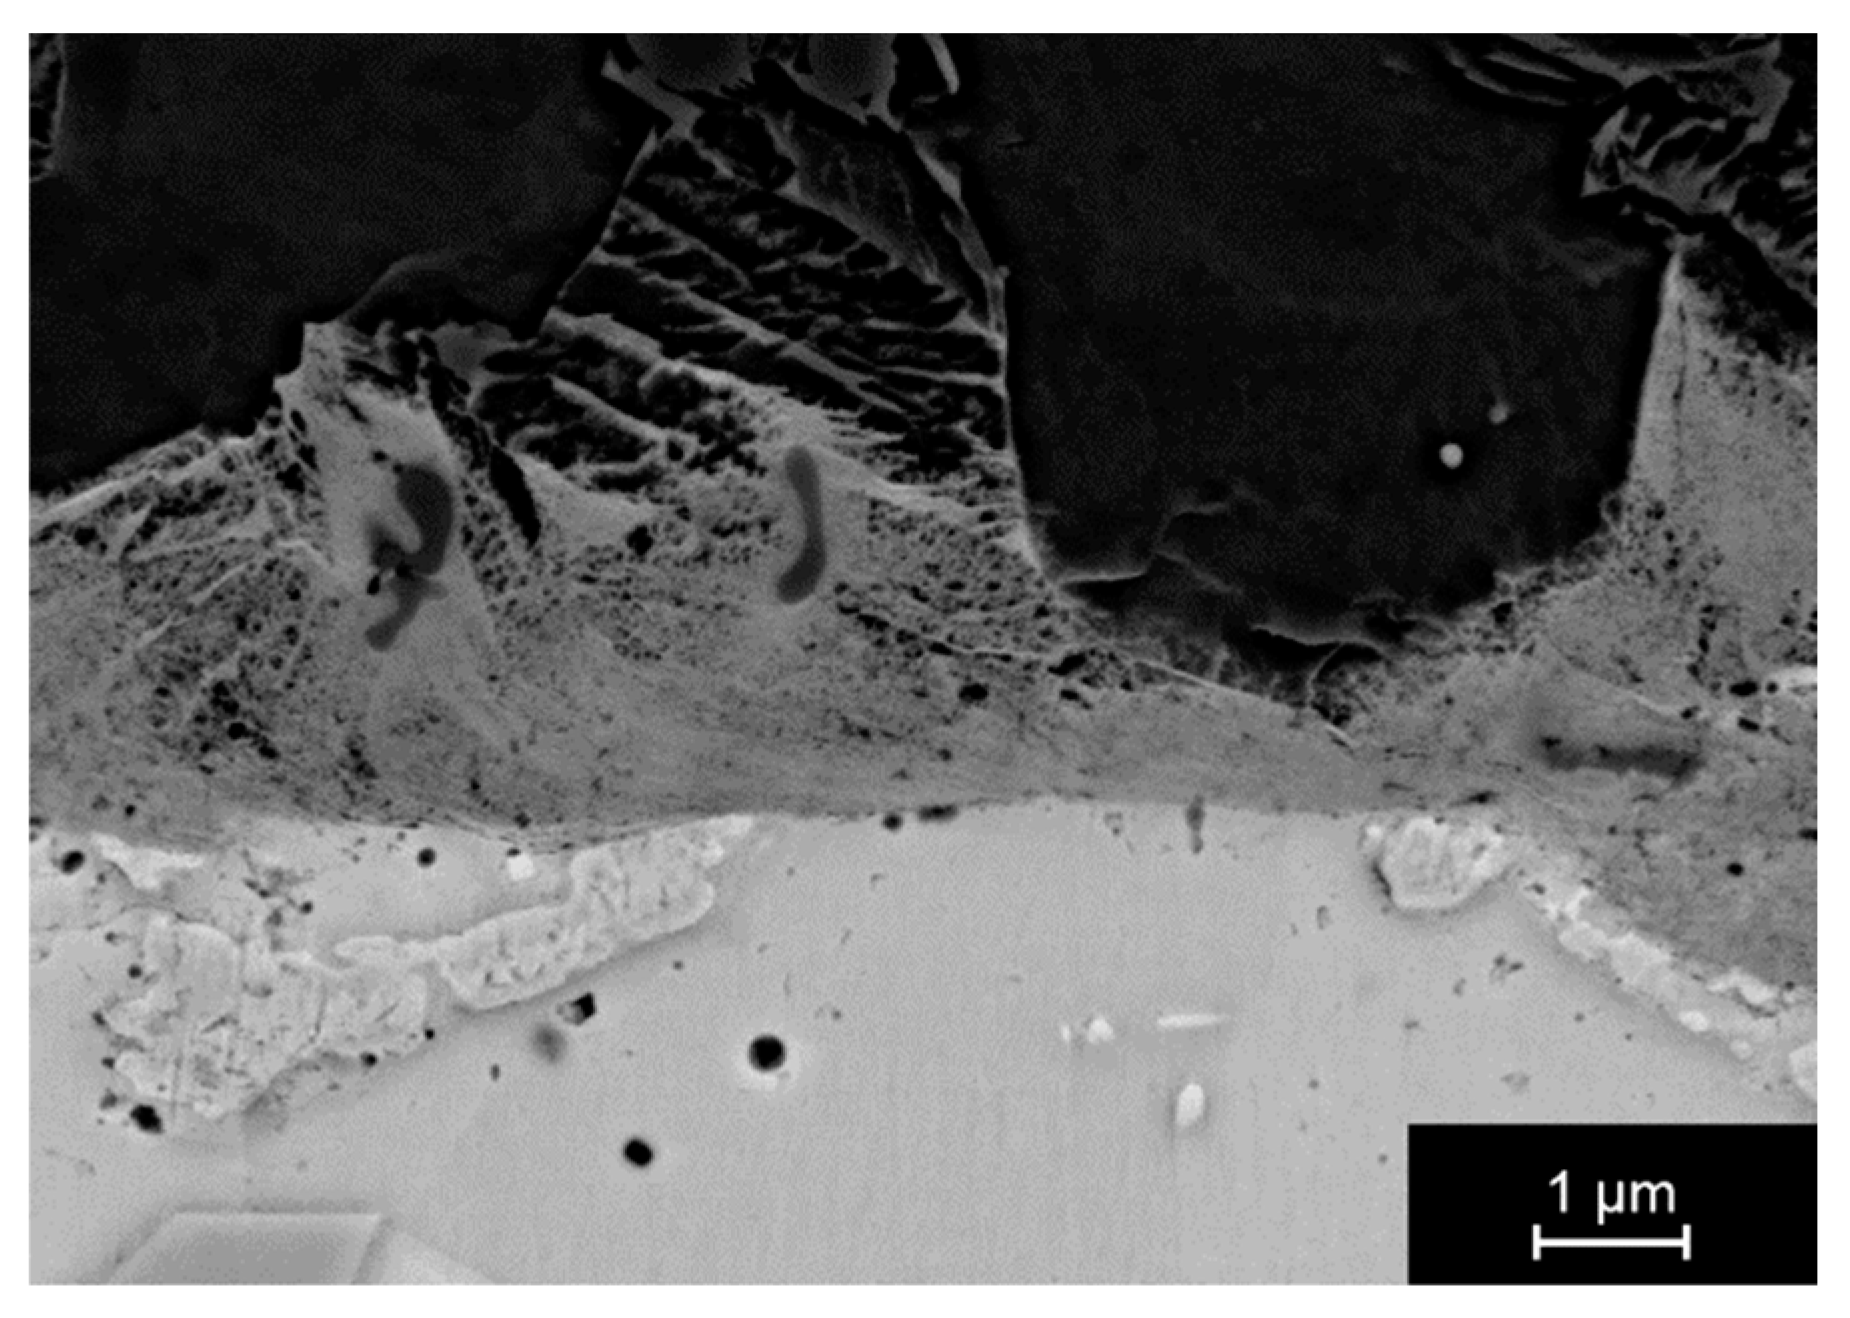
3.2.2. Joining with Sn as Activating Material
4. Conclusions
Author Contributions
Funding
Acknowledgments
Conflicts of Interest
References
- Wang, L.; Feng, W. Development and Application of Q&P Sheet steels. In Advanced Steels, Proceedings of the International Conference on Advanced Steels (ICAS), Guilin, China, 9–11 November 2010; Weng, Y., Dong, H., Gan, Y., Eds.; Springer: Berlin/Heidelberg, Germany, 2011; pp. 255–258. [Google Scholar]
- Speer, J.G.; De Moor, E.; Findley, K.O.; Matlock, D.K.; De Cooman, B.C.; Edmonds, D.V. Analysis of Microstructure Evolution in Quenching and Partitioning Automotive Sheet Steel. Metall. Mater. Trans. A 2011, 42, 3591–3601. [Google Scholar] [CrossRef] [Green Version]
- Matlock, D.K.; Speer, J.G. Third generation of AHSS: microstructure design concepts. In Microstructure and Texture in Steels and Other Materials; Haldar, A., Suwas, S., Bhattacharjee, D., Eds.; Springer: London, UK, 2009; pp. 185–205. [Google Scholar]
- Speer, J.G.; Matlock, D.K.; De Cooman, B.C.; Schroth, J.G. Influence of Interface Mobility on the Evolution of Austenite-Martensite Grain Assemblies during Annealing. Acta Mater. 2003, 51, 2611–2622. [Google Scholar] [CrossRef]
- Speer, J.G.; Edmonds, D.V.; Rizzo, F.C.; Matlock, D.K. Partitioning of carbon from supersaturated plates of ferrite, with application to steel processing and fundamentals of the bainite transformation. Curr. Opin. Solid State Mater. Sci. 2004, 8, 219–237. [Google Scholar] [CrossRef]
- Edmonds, D.V.; He, K.; Rizzo, F.C.; De Cooman, B.C.; Matlock, D.K.; Speer, J.G. Quenching and partitioning martensite—A novel steel heat treatment. Mater. Sci. Eng. A 2006, 438, 25–34. [Google Scholar] [CrossRef]
- Mola, J.; De Cooman, B.C. Quenching and Partitioning (Q&P) Processing of Martensitic Stainless Steels. Metall. Mater. Trans. A 2013, 44, 946–967. [Google Scholar]
- Gallagher, M.F.; Speer, J.G.; Matlock, D.K. Microstructure Development in TRIP-Sheet Steels Containing Si, AI, and P. In Proceedings of the 44th Mechanical Working and Steel Processing (MWSP) Conference, Orlando, FL, USA, 8–11 September 2002; Volume XL, pp. 153–172. [Google Scholar]
- Wang, L.; Speer, J.G. Quenching and Partitioning Steel Heat Treatment. Metallogr. Microstruct. Anal. 2013, 2, 268–281. [Google Scholar] [CrossRef] [Green Version]
- De Moor, E.; Lacroix, S.; Clarke, A.J.; Penning, J.; Speer, J.G. Effect of Retained Austenite Stabilized via Quench and Partitioning on the Strain Hardening of Martensitic Steels. Metall. Mater. Trans. A 2008, 39, 2586–2595. [Google Scholar] [CrossRef]
- Santofimia, M.J.; Zhao, L.; Petrov, R.; Kwakernaak, C.; Sloof, W.G.; Sietsma, J. Microstructural development during the quenching and partitioning process in a newly designed low-carbon steel. Acta Mater. 2011, 59, 6059–6068. [Google Scholar] [CrossRef]
- Sun, J.; Yu, H.; Wang, S.; Fan, Y. Study of microstructural evolution, microstructure-mechanical properties correlation and collaborative deformation-transformation behavior of quenching and partitioning (Q&P) steel. Mater. Sci. Eng. A 2014, 596, 89–97. [Google Scholar]
- Wang, B.; Duan, Q.Q.; Yao, G.; Pang, J.C.; Li, X.W.; Wang, L.; Zhang, Z.F. Investigation on fatigue fracture behaviors of spot welded Q&P980 steel. Int. J. Fatigue 2014, 66, 20–28. [Google Scholar]
- Amirthalingam, M.; Van der Aa, E.M.; Kwakernaak, C.; Hermans, M.J.M.; Richardson, I.M. Elemental segregation during resistance spot welding of boron containing advanced high strength steels. Weld World 2015, 59, 743–755. [Google Scholar] [CrossRef] [Green Version]
- Ruso Spena, P.; De Maddis, M.; Lombardi, F. Mechanical strength and fracture of resistance spot welded advanced high strength steels. Procedia Eng. 2015, 109, 450–456. [Google Scholar] [CrossRef]
- Fan, C.-L.; Ma, B.-H.; Chen, D.-N.; Wang, H.-R.; Ma, D.-F. Spall Strength of Resistance Spot Weld for QP Steel. Chin. Phys. Lett. 2016, 33, 036201:1–036201:5. [Google Scholar] [CrossRef]
- Spena, P.R.; De Maddis, M.; D´Antonio, G.; Lombardi, F. Weldability and Monitoring of Resistance Spot Welding of Q&P and TRIP Steels. Metals 2016, 6, 270:1–270:15. [Google Scholar]
- Guo, W.; Zhang, H.; Zhang, X.; Liu, L.; Peng, P.; Zou, G.; Zhou, Y.N. Preparation of nanoparticle and nanowire mixed pastes and their low temperature sintering. J. Alloys Compd. 2017, 690, 86–94. [Google Scholar] [CrossRef]
- Siow, K.S.; Lin, Y.T. Identifying the Development State of Sintered Silver (Ag) as a Bonding Material in the Microelectronic Packaging Via a Patent Landscape Study. J. Electron. Packag. Trans. ASME 2016, 138, 020804. [Google Scholar] [CrossRef] [Green Version]
- Peng, P.; Li, L.; Guo, W.; Hui, Z.; Fu, J.; Jin, C.; Liu, Y.; Zhu, Y. Room-Temperature Joining of Silver Nanoparticles Using Potassium Chloride Solution for Flexible Electrode Application. J. Phys. Chem. C 2018, 122, 2704–2711. [Google Scholar] [CrossRef]
- Yan, H.; Mei, Y.; Li, X.; Chen, G.; Lu, G.-Q. A phase-leg IGBT module using DBC substrate without Ag finish by pressureless sintering of nanosilver paste. In Proceedings of the IEEE Applied Power Electronics Conference and Exposition (APEC 2017), Tampa, FL, USA, 26–30 March 2017; pp. 3013–3020. [Google Scholar]
- Yao, T.; Matsuda, T.; Sano, T.; Morikawa, C.; Ohbuchi, A.; Yashiro, H.; Hirose, A. In Situ Study of Reduction Process of CuO Paste and Its Effect on Bondability of Cu-to-Cu Joints. J. Electron. Mater. 2018, 47, 2193–2197. [Google Scholar] [CrossRef]
- Zhang, D.; Zou, G.; Liu, L.; Zhang, Y.; Yu, C.; Bai, H.; Zhou, N. Synthesis with glucose reduction method and low temperature sintering of ag-cu alloy nanoparticle pastes for electronic pack-aging. Mater. Trans. 2015, 56, 1252–1256. [Google Scholar] [CrossRef]
- Hausner, S. Potential von Nanosuspensionen zum Fügen bei niedrigen Temperaturen. Ph.D. Thesis, Technische Universität Chemnitz, Chemnitz, Germany, 1 September 2015. [Google Scholar]
- Hausner, S.; Weis, S.; Wielage, B.; Wagner, G. Low temperature joining of copper by Ag Nanopaste: Correlation of mechanical properties and process parameters. Weld World 2016, 60, 1277–1286. [Google Scholar] [CrossRef]
- Hausner, S.; Weis, S.; Wagner, G. Joining of steels at low temperatures by Ni nanoparticles. DVS-Berichte 2016, 325, 278–284. [Google Scholar]
- Mehner, T.; Scharf, I.; Frint, P.; Schubert, F.; Mašek, B.; Wagner, M.F.-X.; Lampke, T. Hydrogen embrittlement of a quenching and partitioning steel during corrosion and zinc electroplating. Mater. Sci. Eng. A 2019, 744, 247–254. [Google Scholar] [CrossRef]
- Jadhav, N.; Chason, E. Sn Whiskers: Causes, Mechanisms and Mitigation Strategies. In Lead-Free Solders: Materials Reliability for Electronics; Subramanian, K.N., Ed.; John Wiley and Sons Ltd.: West Sussex, UK, 2012; pp. 299–321. [Google Scholar]
- Suganuma, K. Tin Whiskers. In Lead-Free Solders: Materials Reliability for Electronics; Subramanian, K.N., Ed.; John Wiley and Sons Ltd.: West Sussex, UK, 2012; pp. 323–335. [Google Scholar]


| Element | C | Si | Mn | P | S | Cr | Ni | Mo | Cu | W | Al | Nb | Fe |
|---|---|---|---|---|---|---|---|---|---|---|---|---|---|
| wt% | 0.41 | 1.95 | 0.68 | 0.01 | 0.006 | 1.34 | 0.036 | 0.04 | 0.003 | 0.008 | 0.009 | 0.068 | Bal. |
| Particle size [nm] | Ni | 10–100 |
| Metal content [wt%] | Ni | 49.0 |
| Content of organic substances [wt%] | α-Terpineol | 24.5 |
| p-Xylene | 24.5 | |
| 1-Tetradecanethiol (CH3(CH2)13SH) | 1.0 | |
| 1-Octadecanethiol (CH3(CH2)17SH) | 1.0 |
| Particle size [nm] | Ag | 8–15 |
| Metal content | Ag | 82.1 |
| Content of organic substances [wt%] | 1-Decanol | 1–2 |
| Petroleum hydrocarbon | 2.5–3.5 | |
| Dispersant A | 6–10 | |
| Dispersant B | 1–3 | |
| Additives A | 2–3 | |
| Additives B | 0.8–1.5 |
| Activating Material | Flux (According to DIN EN ISO 9454-1) | Parameters for Joining | ||
|---|---|---|---|---|
| Temperature | Holding Time | Thickness of Paste Application | ||
| Solder SnAg3.5 | Without flux | 230 °C | 30 min | 20 µm |
| Solder SnAg4 | 2.2.3 | 230 °C | 10 min | 20 µm |
| Solder SnAg5 | 2.2.2 | 230 °C | 10 min | 20 µm |
| Sn (purity: 99.5 wt%) | Without flux | 237 °C | 3 min 5 min | 40 µm 80 µm |
| Thickness of PVD Sn Coating | Joining Temperature | Holding Time | Thickness of Paste Application |
|---|---|---|---|
| 3 µm 10 mm 20 µm | 237 °C | 3 min 5 min | 20 µm |
© 2019 by the authors. Licensee MDPI, Basel, Switzerland. This article is an open access article distributed under the terms and conditions of the Creative Commons Attribution (CC BY) license (http://creativecommons.org/licenses/by/4.0/).
Share and Cite
Hausner, S.; Wagner, M.F.-X.; Wagner, G. Microstructural Investigations of Low Temperature Joining of Q&P Steels Using Ag Nanoparticles in Combination with Sn and SnAg as Activating Material. Appl. Sci. 2019, 9, 539. https://doi.org/10.3390/app9030539
Hausner S, Wagner MF-X, Wagner G. Microstructural Investigations of Low Temperature Joining of Q&P Steels Using Ag Nanoparticles in Combination with Sn and SnAg as Activating Material. Applied Sciences. 2019; 9(3):539. https://doi.org/10.3390/app9030539
Chicago/Turabian StyleHausner, Susann, Martin Franz-Xaver Wagner, and Guntram Wagner. 2019. "Microstructural Investigations of Low Temperature Joining of Q&P Steels Using Ag Nanoparticles in Combination with Sn and SnAg as Activating Material" Applied Sciences 9, no. 3: 539. https://doi.org/10.3390/app9030539