Active Structural Acoustic Control of an Active Casing Placed in a Corner


Institute of Automatic Control, Silesian University of Technology, Akademicka 16, 44-100 Gliwice, Poland
*
Authors to whom correspondence should be addressed.
Appl. Sci. 2019, 9(6), 1059; https://doi.org/10.3390/app9061059
Submission received: 25 January 2019
/
Revised: 8 March 2019
/
Accepted: 10 March 2019
/
Published: 13 March 2019
(This article belongs to the Special Issue Active and Passive Noise Control)
Abstract
:Electric appliances used in workplaces and everyday life often generate a low-frequency noise, which affects human body systems. Passive methods employed to reduce noise are not effective at low frequencies. The classical approach to active noise control practically involves the generation of local zones of quiet, whereas at other areas the noise is reinforced. Moreover, it usually requires a large number of secondary sound sources. Hence, an active casing approach has been developed. The active casing panels’ vibrations are controlled to reduce the device noise emission. Efficiency of this method has been previously confirmed by the authors and the results have been reported in multiple journal publications. However, in the previous research experiments, the active casing was placed at a distance from the enclosure walls. In this research, the active casing is located in a corner and such placement is intentionally used to facilitate the active control system’s operation. The noise reduction performance is investigated at multiple configurations, including a range of distances from the corner and different error microphone arrangements. The analysis of both primary and secondary paths is given. Advantages and drawbacks of different active casing configurations are presented and discussed.
1. Introduction
Nowadays, due to technological progress, noise level enhancement has been observed. Machines and devices commonly used in industry and everyday life generate noise, which may cause health damage. Noise is also one of the factors influencing mental performance [1]. Therefore, high efforts are made to reduce the noise pollution in the human environment.
In general, noise can be divided into high-, mid- and low-frequency noise. Low-frequency noise, considered in the frequency range up to approximately 500 Hz, is most difficult to limit due to passive barriers’ inefficiency at this frequency range (when the noise frequency decreases, the mass, dimensions and cost of passive elements generally increases in order to be effective [2]). As an alternative or complementing solution, active control methods can be employed [3,4,5,6]. They can be used, e.g., to reduce noise entering through open windows [7,8]. Active methods are especially efficient at the low-frequency range, where passive barriers are infeasible [9]. However, when classically employed, they practically result in generating local zones of quiet, whereas at other areas the noise is reinforced. This requires additional care if the users are moving or the noise is nonstationary. Additionally, the number of secondary sound sources needed to make the zones controlled is high, which increases the total cost and highly interferes with the environment, making the solution unacceptable for many applications.
In this research, an active noise-reducing casing is investigated. The active casing encloses a device that generates an excessive noise. The original device casing may be used if it is made of thin walls or the device can be surrounded by an additional casing satisfying such requirement. The control system of the casing operates according to the Active Structural Acoustic Control (ASAC) approach. This means that by actively controlling vibrations of the casing panels, the noise emission to the environment is reduced. The ASAC approach represents several advantages over a typical Active Noise Control (ANC), where loudspeakers are used as the secondary sources [10,11]. The most important feature is that the active casing provides a global noise reduction in a whole room (reduces the noise emission), instead of creating only local zones of quiet and enhancing the noise elsewhere. This is a very desirable property of any active noise-reducing system. Efficiency of this method was previously investigated by the authors and the results have been reported in multiple publications [12,13,14]. However, in the previous research, the active casing was placed distant from the walls of the room the casing was enclosed by.
In this paper, the active casing is located in a corner and such placement is intentionally used to facilitate the active control system’s operation. Moreover, such placement of a device can be commonly encountered in real life. The presented research aims to evaluate the hypothesis that placing the active casing in a corner and appropriately rearranging the microphones can lead to both enhanced noise reduction levels and a wider frequency range of global noise reduction (in the entire room). A proper theoretical justification for such behavior is provided. The noise reduction performance is investigated and compared for multiple configurations, including a range of distances from the corner and different error microphone arrangement. The analysis of both primary and secondary paths is also given. Advantages and drawbacks of different active casing configurations are presented and discussed.
The remainder of the paper is organized in five sections. Section 2 describes the laboratory setup, i.e., the light-weight active casing and utilized actuators and sensors. Section 3 describes research experiment assumptions. The placement of the active casing in the corner is described and error microphones arrangements are depicted. Section 4 provides analysis of primary and secondary paths in terms of the amplitude functions of their frequency response functions. Section 5 introduces briefly the active control algorithm. Section 6 is dedicated to active control performance. Experimental results are presented and discussed. Finally, the conclusions are drawn based on the results.
2. The Laboratory Setup
The employed laboratory setup is presented in Figure 1. It consists of a light-weight active casing placed in the corner of a room and the appropriately arranged microphones: one reference microphone, five error microphones and four room (monitoring) microphones.
The active casing is placed in the corner with its back and right panels. It is built of five steel plates (1 mm thick) bolted together, forming a cuboid of dimensions 630 mm × 800 mm × 500 mm. The active casing is placed on a sound-insulating basis. Inside the casing, a loudspeaker is placed and it is used for the generation of a primary noise. The loudspeaker as a noise source provides a more reproducible environment for control system evaluation as compared to a real device (which is also examined in other studies performed by the authors). The employed active casing itself is described in more detail in [12,14,15]. It is important to emphasise that such a construction of the casing is very challenging from the control point of view. The casing panels are connected to each other directly without using any rigid explicit frame, and such mounting of their edges leads to both vibrational and acoustical couplings between them.
Near the loudspeaker inside the casing, a reference microphone is placed to obtain a reference signal. It can provide information about the primary noise. Five error microphones are placed around the active casing at specific positions, described in detail in Section 3. There are also four room microphones, which are used to evaluate the noise reduction performance (they are not used by the control system). The room microphones are placed in four arbitrarily selected irregular locations in the enclosure, at greater distances from the casing. Each position corresponds to a possible location of a listener [16].
To control vibrations of the active casing, inertial mass actuators EX-1 are used. They are light-weight (115 g) actuators of small dimensions (diameter 70 mm), compared to the size of the casing. They are attached to the inner side of the casing panels. In total, 21 actuators are used (5 actuators are attached to the top panel, 4 actuators are used per each of the remaining panels). The number of actuators and their placement is a result of analysis and optimization process maximizing a measure of the controllability of the system [15].
3. The Experiment Assumptions
The previous research experiments were performed with the active casing placed distantly from the laboratory enclosure walls. In a recent report, [17], primary and secondary paths of a casing placed only at a single wall of the enclosure were preliminarily examined. In this paper, the active casing is placed in the corner and extensive active control experiments are carried out. Hence, this research, besides the primary and secondary paths analysis, also presents a thorough study on active control system performance under such conditions, which is the main contribution of this paper.
3.1. Reflectivity of a Wall Surface
One of the assumptions for the experiment concerns corner walls surfaces, which are assumed to be reflective (like in most real enclosures and rooms, industrial or domestic). The corner walls are dense and smooth. Hence, the absorption coefficient is low, providing considerable sound reflection from the walls [18]. The sound reflection between the active casing and the corner is intentional in this research. The influence of sound reflection on active control performance is investigated. The distance between corner walls and active casing’s back and right panels is small enough to expect that strong resonances may be induced, significantly influencing the primary and secondary paths and finally the control.
3.2. Distance between the Casing and the Corner
If a sound source, e.g., a loudspeaker, is placed in an enclosure, its position is important, because it influences the sound perceived by the recipients. As stated in [19], a corner is the most efficient location for a non-directional source. A low-frequency loudspeaker, i.e., a subwoofer, is most efficient if placed on a solid floor adjacent to a wall or in a corner, and coupled to reflecting surfaces at most one-sixth of the sound wavelength away [19]. In other words:
where is the distance between the loudspeaker and the reflecting surface, is the speed of sound in the air, and is the frequency of sound emitted by the loudspeaker.
The active noise control methods are most efficient at low frequencies up to about 500 Hz, therefore this is the frequency range of interest in this research. This is in agreement with the content of dominating frequencies of most common industrial devices and domestic appliances. Hence, to investigate the aforementioned phenomenon, the examined distances between the active casing and the corner should be in the range from about 0.1 m to 1.0 m. However, the maximum distance chosen for the experiment was 0.8 m due to dimensions of the laboratory enclosure. Hence, eight distances , , between two active casing panels and the corner walls in the room are examined, where m, m, …, m.
3.3. Placement of Error Microphones
The active casing is placed in the corner with its back and right panels. These casing panels are equally distant from both corresponding corner walls with distance , as marked in the scheme presented in Figure 2. Error microphone locations corresponding to the left, top and front active casing panels are marked with symbols , and , respectively. They are located at a distance equal to 0.5 m from the corresponding panels’ centers. Error microphones corresponding to back and right casing panels are placed in two different ways.
In the first approach, referred to as Setup 1, error microphones corresponding to back and right active casing panels are placed between the casing and the corner. Back error microphone location is noted by symbol and is half the distance between the back casing panel’s center and the corresponding corner wall (the distance is equal to ). Analogously, right error microphone location is noted by symbol and is half the distance between the right casing panel’s center and the corresponding corner wall (the distance is also equal to ).
In the second approach, referred to below as Setup 2, error microphones corresponding to back and right active casing panels are moved from the gap between the casing and the corner to arbitrarily selected locations among error microphones corresponding to front, left and top active casing panels, based on results of preliminary control experiments. The new back error microphone location is noted by symbol and is placed at the same height as the top error microphone, above the active casing’s corner (see Figure 2b). The new right error microphone location is noted by symbol and is placed at the same height as both left and front error microphones, and its distance from active casing’s edge is equal to 0.5 m. In such arrangement, distances between error microphones become smaller, which affects the performance of active control. Both setups are examined to compare their influence.
It is noteworthy that when the distance between the casing panels and corner walls changes, all of the error microphones have to be moved, following the casing position. On the other hand, room microphones are always at the same locations.
4. Primary and Secondary Paths
Active control is employed to reduce noise in this research, hence knowledge of the dynamic properties of primary and secondary paths in the frequency range of interest for active control will facilitate the control system development and implementation [12]. Their analysis is provided in this section.
Primary and secondary paths’ models in the form of Finite Impulse Response (FIR) filters of length were obtained experimentally. During the real system identification experiment, each path was excited with a optimized multi-tonal signal of 4096 samples. The signal was reproduced and the response was recorded eight times for each path. Afterwards, the correlation method was used to estimate the average impulse response of the considered path. The identified models were used both in the control system, e.g., for the Filtered-x part of the FxLMS algorithm, and for the paths’ analysis presented in this section. The amplitude function of the identified impulse response estimate is referred to as amplitude response.
4.1. Primary Paths Analysis
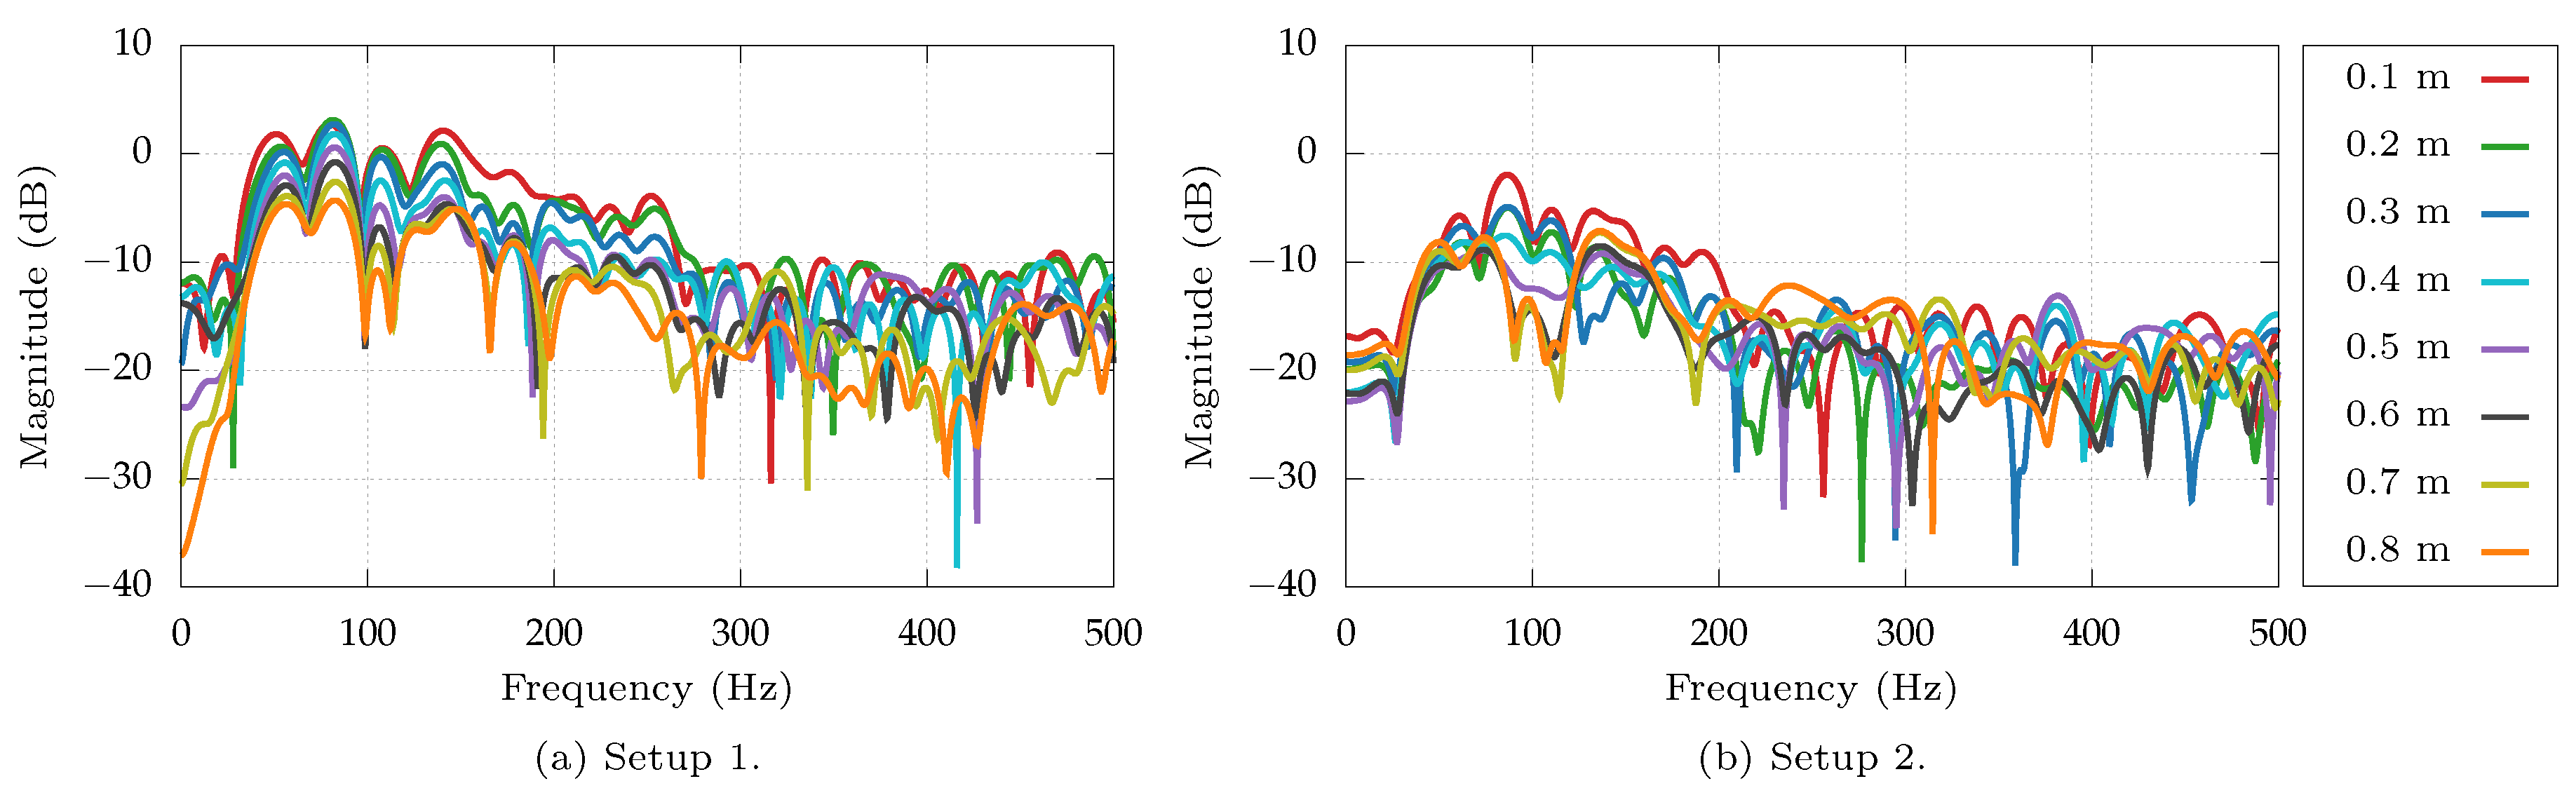
The primary path is considered as a path between the input signal to the primary noise source, i.e., the loudspeaker inside the active casing, and the signal acquired by one of the error microphones. The amplitude functions of the frequency functions of the impulse response estimates for the primary paths for both setups are presented side by side. The paths are presented in frequency range up to 500 Hz, in which active noise control methods are effective. In each figure, primary path frequency response functions for all distances (0.1–0.8 m) are presented.
The loudspeaker used as a noise source starts to transmit sound for frequencies above 40 Hz, which can be observed in Figure 3, Figure 4 and Figure 5. In Figure 3, the primary paths for the error microphone corresponding to right casing panel are presented (locations and ). The amplitude responses in Setup 1 (Figure 3a) are distinctly different comparing to the amplitude responses obtained for Setup 2 (Figure 3b). Maximum magnitudes in Figure 3a are substantially greater than in Figure 3b. A general trend observed in Figure 3a is an increase of magnitude for decreasing distance between the casing and the corner. Such effect is not evident in Figure 3b. This means that when decreasing distance , the primary noise starts to resonate in the gap between the casing and the wall. Hence, if an error microphone is placed in such a gap, the signal it measures becomes less representative of the general noise emitted by the given casing panel and it more represents a specific resonant effect, which may be misleading for the adaptation of the control algorithm. For the evaluated laboratory setup, this is the case for 0.4 m.
In Figure 4, the primary paths for the error microphone corresponding to back casing panel in both setups are presented (locations and ). Analogous behavior can be observed as in primary paths presented for the right error microphone in Figure 3, hence, for the sake of brevity, it is no further discussed.
In Figure 5, the primary paths for the error microphone corresponding to top casing panel in both setups are presented (the location ). The top error microphone placement is the same for both setups, and hence, amplitude responses are very similar for them. This confirms consistency of obtained results. On the other hand, when the distance changes, the sound emission pattern in the room also changes. It is noteworthy that in the frequency range up to about 125 Hz, an effect of magnitude increase for decreasing distance is observed. Above 125 Hz, such effect is not clearly visible. The effect observed below 125 Hz indicates that moving the casing closer to the corner causes slightly stronger emission of low frequencies in the laboratory enclosure, as it could be expected, based on the theory recalled in Section 3.2.
The paths between the primary noise source and one of the room microphones are given in Figure 6. The magnitudes are in general lower than the ones obtained for error microphones, as the distances from the noise source to the room microphones are larger. Similarly as for the top error microphone, the paths are consistent for both setups. However, it is noteworthy that in the frequency range up to about 125 Hz, a slight effect of magnitude increase for decreasing distance is observed again. It confirms that moving the casing closer to the corner causes stronger excitation of low frequencies in the whole laboratory enclosure, as used for the sound reproducing systems in audio engineering.
4.2. Secondary Paths Analysis
The secondary path is a path between the input signal to one of the actuators (exciters) mounted on the inner side of the active casing panels, and the signal acquired by one of the error microphones. Selected secondary paths amplitude responses are presented.
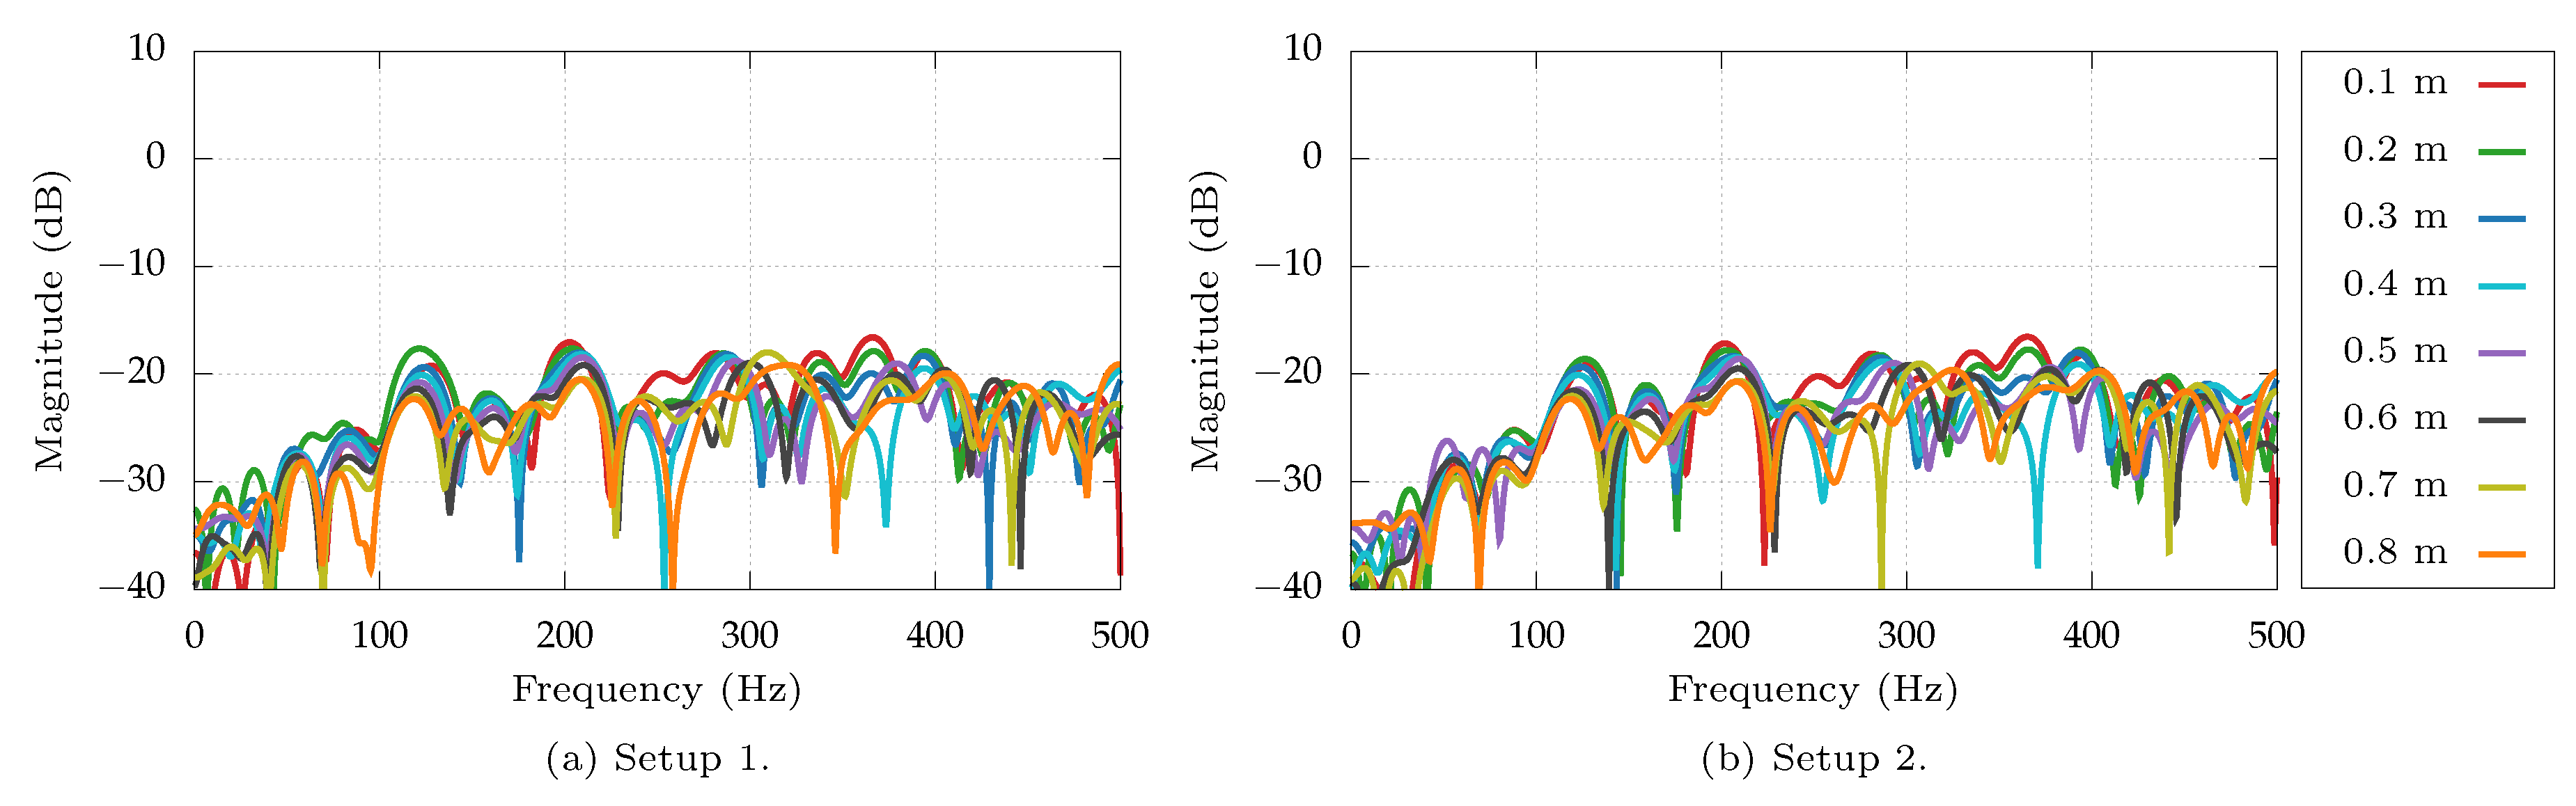
In Figure 7, secondary paths between the selected five actuators (one per casing panel), and the error microphone corresponding to right casing panel are presented. The casing was placed at a distance 0.1 m. It is the smallest considered distance of , where there are significant differences in paths’ magnitudes, depending on chosen setup (right error microphone placed at location or ). In Setup 1 (location ), magnitudes are much greater than in Setup 2 (location ). As it could be expected, the actuator mounted to the right panel contributes the most to the signal obtained with the right error microphone when placed at location . However, other secondary paths are also stronger when the error microphone is placed at location (Setup 1) compared to location (Setup 2). This means that the narrow gap between the casing panel and the corner wall causes a resonance, amplifying sound generated by any actuator, mounted to any of the casing panels.
In Figure 8, secondary paths between the selected actuator mounted to the right panel and the right error microphone are presented for all distances . Magnitudes are in general greater in Setup 1 (Figure 8a), especially when 0.4 m. In nearly the whole considered frequency range, magnitude increases as the distance decreases. In Setup 2 (Figure 8b) such effect is not visible.
Similar observations can be drawn from Figure 9, which presents responses of secondary paths between back casing panel’s selected actuator and the back error microphone at all distances. In Setup 1 magnitude increases as the distance decreases. On the other hand, in Setup 2 such effect is also visible, but only in a frequency range up to about 200 Hz. This shows that the narrow gap amplifies most of the considered frequencies if a microphone is placed in the gap (location ). However, the actual emission (sound field excitation in the laboratory enclosure) can be slightly enhanced, due to casing placement in the corner, only in a limited range of low frequencies (as the measurement at location shows).
In Figure 10, secondary paths between top casing panel’s selected actuator and the top error microphone are presented at all distances. Amplitude responses for both setups (Figure 10a,b) are similar, confirming the consistency of obtained results. Similarly as for the back microphone placed at location , slight enhancement of magnitude for low frequency range up to approximately 180 Hz can be observed when the distance decreases.
In Figure 11 and Figure 12, the paths between selected actuators and one of the room microphones are presented. The room microphones are in constant locations during all experiments. The paths are compared in the same manner as before. In Figure 11 and Figure 12, the selected actuators are mounted to the back and right casing panel, respectively. Once again, the magnitude increases for decreasing distance in a frequency range up to approximately 200 Hz. These paths also confirm, that placing the casing in a corner increases the magnitude of paths in the low frequency range (these frequencies are better excited in the enclosure). However, it is also noteworthy that both primary and secondary paths’ magnitudes increase in a similar manner, hence the balance between them should be sustained and the noise reduction capabilities should not be impeded.
5. Active Control Algorithm
In the active control systems, the FxLMS algorithm is frequently implemented [20,21]. Its advantages are, e.g., simplicity of implementation, robustness and low complexity of computations [22]. A scheme of basic FxLMS algorithm is presented in Figure 13, where is the primary path, is the secondary path, is a control filter adapted by the LMS algorithm, and is a model of secondary path . The algorithm name FxLMS (Filtered-x Least Mean Squares) follows from usage of model—the reference signal usually noted as is passed through the secondary path estimate to obtain a filtered reference signal [2]. It is also passed through the primary path , which outputs signal —the primary disturbance. Adaptive filter output is passed through secondary path to obtain a signal that is summed with the primary disturbance . The summation results in signal , which is a residual error signal. The control system attempts to minimize the sum of squares of the error signal over the length of filter .
The scheme presented in Figure 13 depicts a single-channel control system, however, if the plant is controlled by multiple inputs and returns multiple outputs, the control system can be generalized to a Multiple-Input Multiple-Output (MIMO) FxLMS, as described in [23], and such is used for this research. However, this paper is focused more on the investigation of the control system performance for specific configurations, rather than on introducing the control algorithm itself. Hence, the reader is referred to previous publications, where a more detailed description of the control system with a switched-error modification employed for the active casing is given [12,24].
It is noteworthy that varying the selected control algorithm may impact active control performance, e.g., the convergence rate or the final noise reduction levels. However, the preliminary experiments have shown that such an impact is similar for all evaluated experimental setups (it is independent of the particular configuration). Hence, it has been assumed that by employing the unchanged control algorithm through the whole research, the drawn conclusions also remain valid for altered or different control algorithms.
6. Active Control System Performance
In this section, experimental evaluation of the investigated active control system is presented. The loudspeaker placed inside the active casing generates a tonal primary noise of frequency incremented by 5 Hz in the range from 1 Hz to 350 Hz. The considered frequency range includes the low frequencies where the speaker starts to transmit sound. To achieve the goal of global noise reduction, instantaneous square values of error signals are minimized by feedforward adaptive control system (introduced in the previous Section), controlling together 21 inertial actuators. The error signals are obtained by the error microphones (their arrangement is discussed in Section 3.3). The control performance is evaluated as noise reduction levels observed by the room microphones. Performance of the control system is tested in multiple configurations, including a range of distances from the corner and different error microphones’ arrangement (Setup 1 or Setup 2).
For each frequency of the primary disturbance, a 60 s experiment was performed. In its initial 5 s, the active control was off, and variance of signals acquired by different sensors was estimated as the reference point. Then, the active control was turned on. When the adaptive control algorithm converged, the final 5 s of the experiment were used to estimate the variance of signals acquired by corresponding sensors.
In Figure 14 and Figure 15, frequency characteristics for the active control experiments are presented. Time plots of signals obtained by individual sensors are not shown in this paper, as such insight into the control system behavior has been previously presented, e.g., in [12]. In the previous experiments, the active casing was placed distant from the enclosure walls and several control approaches were examined and described, e.g., in [12,14]. In the previous research, the maximum global noise reduction evaluated by mean noise reduction measured at all room microphones exceeded 15 dB. In this research, even higher performance has been achieved and the maximum global noise reduction level often exceeded even 25 dB, although these results rely on the specific circumstances of the experimental settings, which evolved over time. Hence, such direct comparison of noise reduction levels obtained for different settings is unjustified. However, that is not the aim of this research. The purpose of this paper is to evaluate the overall control performance of the active casing placed in a corner. Hence, the main point of investigation is the mean global noise reduction affected solely by the distance and the error microphone arrangement (Setup 1 or Setup 2). The other experimental settings remained unchanged.
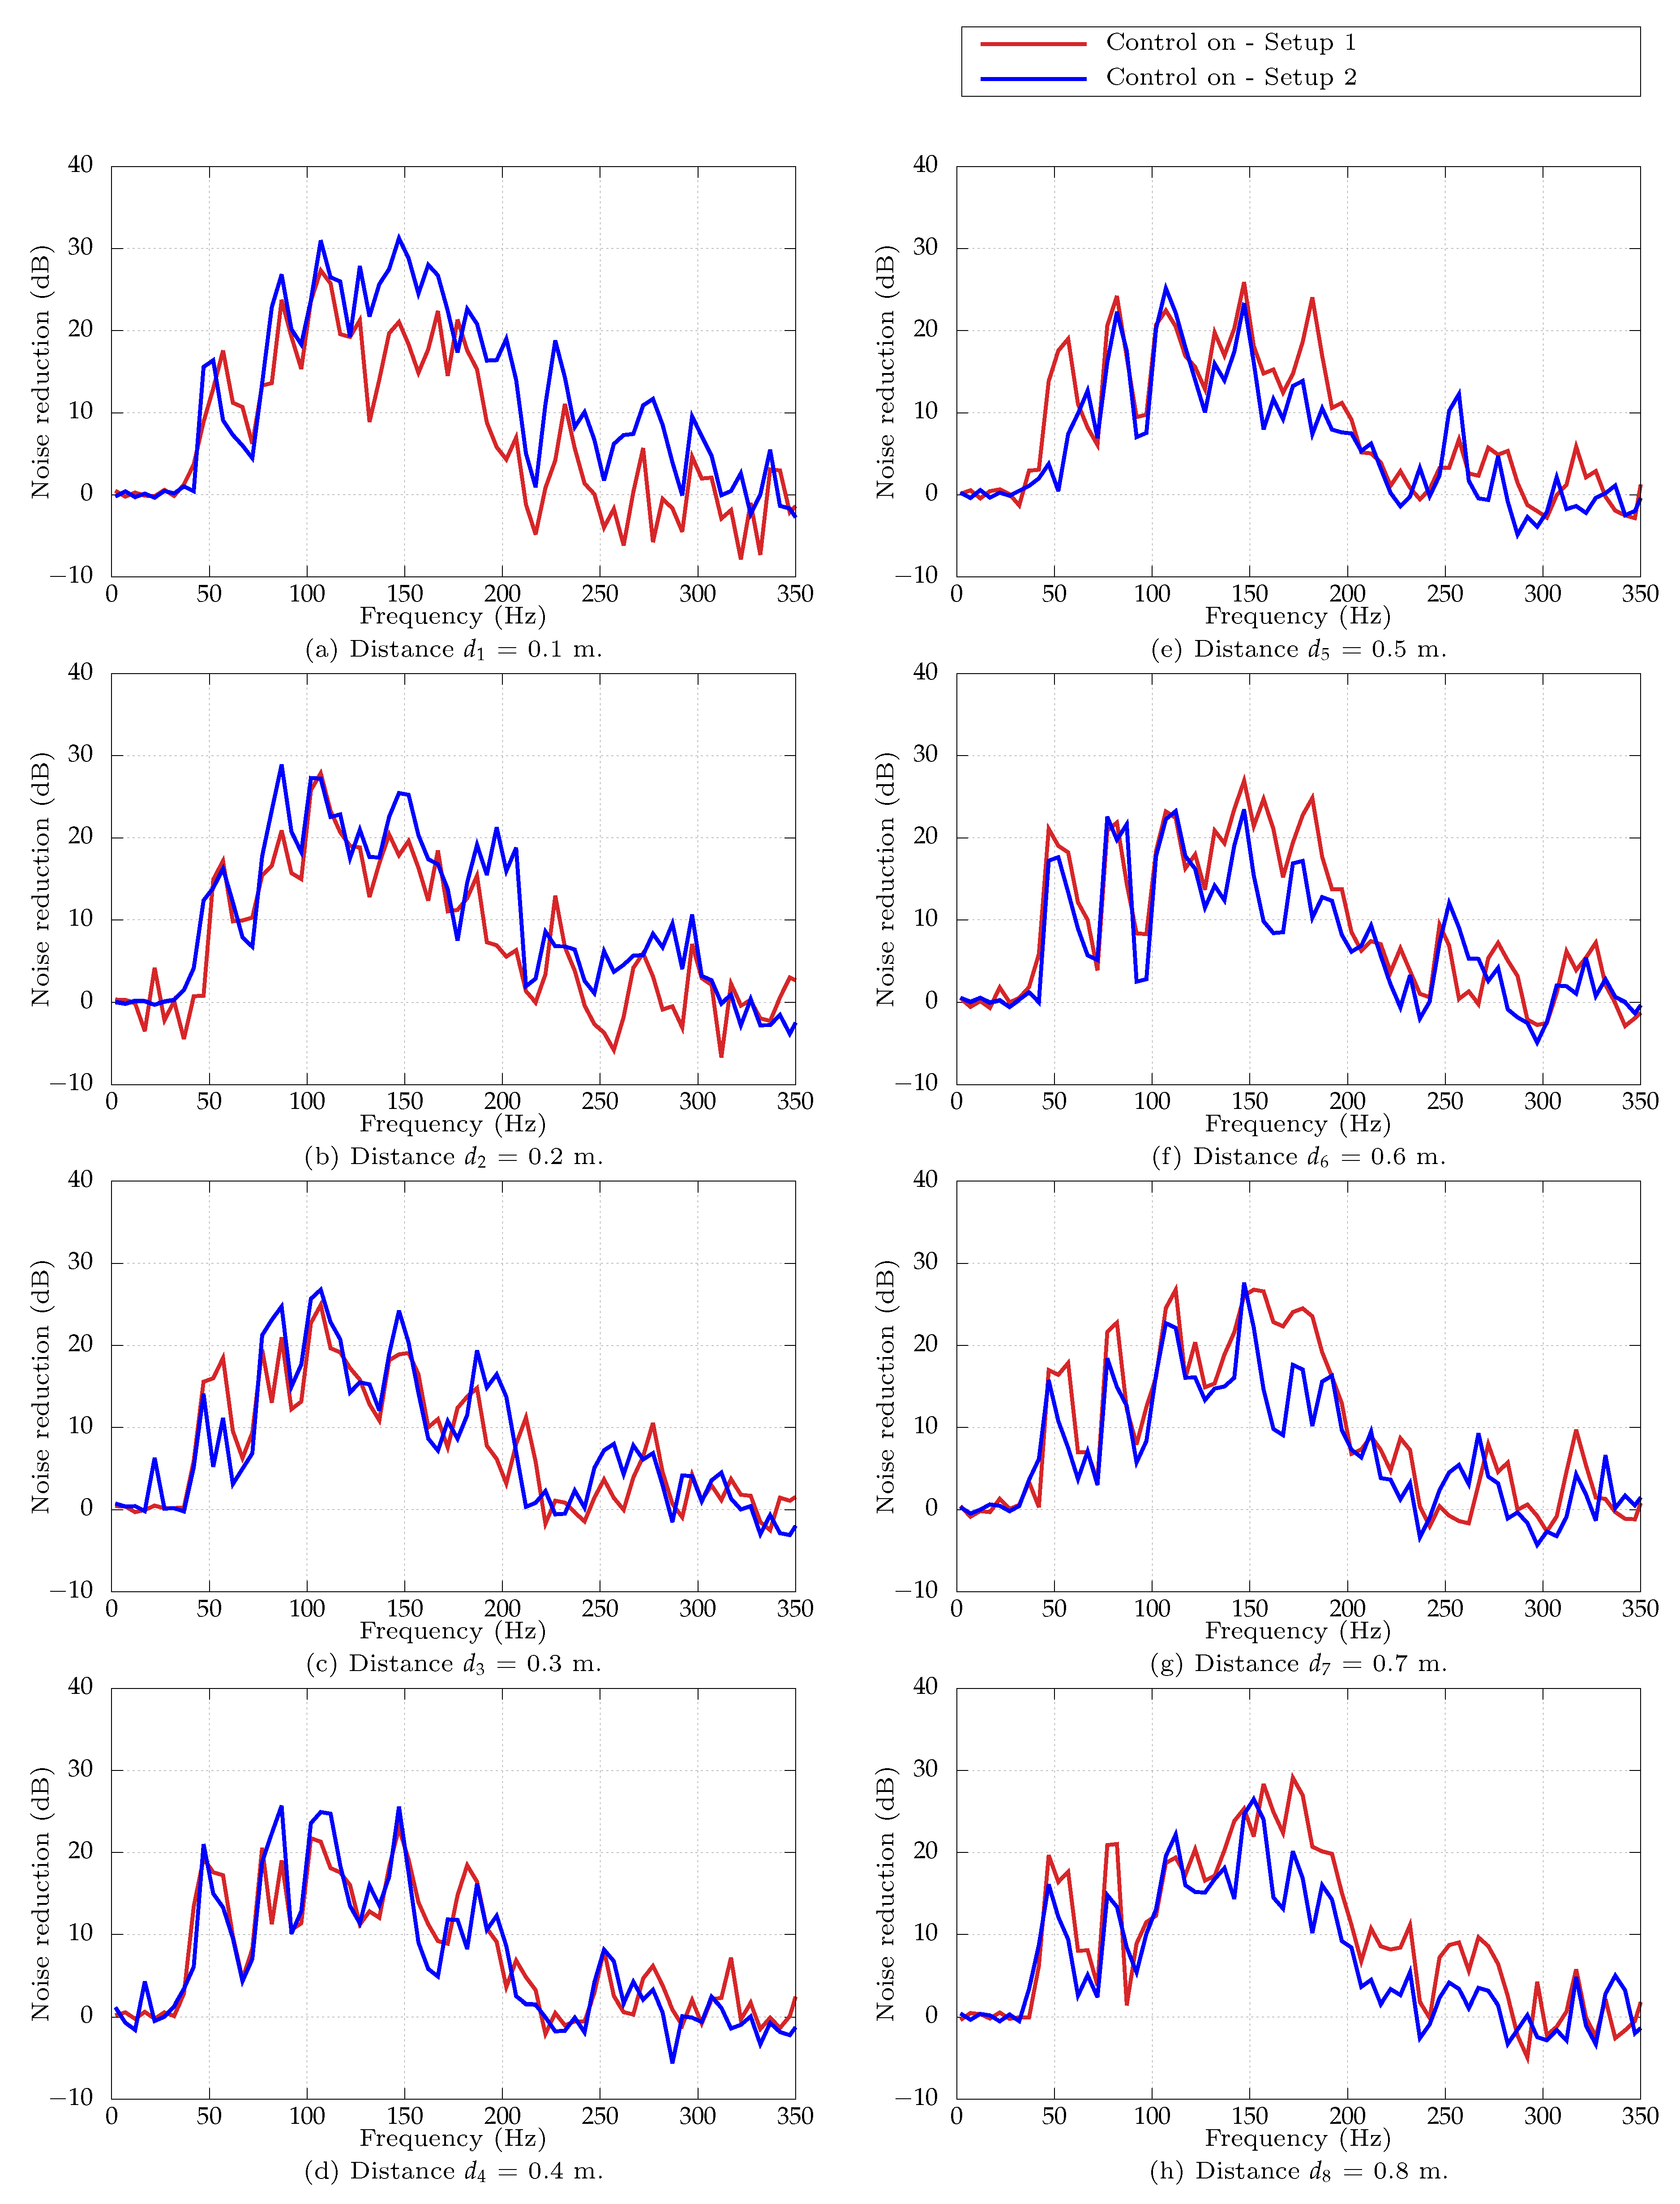
In Figure 14, the mean variance estimated based on the room microphones measurements is given for different distances , ranging from 0.1 m to 0.8 m. For each distance a plot is given, where black color represents primary noise without active control; red and blue colors represent residual noise when active reduction is turned on with error microphones arranged in Setup 1 and Setup 2, respectively. To facilitate the comparison of control performance obtained for different configurations, in Figure 15 the noise reduction characteristics are also given, calculated as a difference between noise level without and with control (reduction for Setup 1 and Setup 2 is marked with red or blue color, respectively).
It follows from the analysis of Figure 14 and Figure 15 that the error microphone arrangement affects strongly the overall performance of the control system. The major conclusion is that when the active casing is distant from the corner, the Setup 1 with error microphones surrounding the casing performs better than the Setup 2, where error microphones are moved away from the corner. On the other hand, when the active casing is placed close to the walls in the corner ( = 0.1 m), it is the other way around—Setup 2 provides substantially better results. This leads to a conclusion that when the casing approaches the corner, there is a threshold distance when it is beneficial to move the error microphones out from the gap between the casing and the corner, and place them on the other side of the casing, complementing the error microphones there. For the studied setup the threshold distance seems to be = 0.4 m, although, the general conclusion is to expect such threshold value.
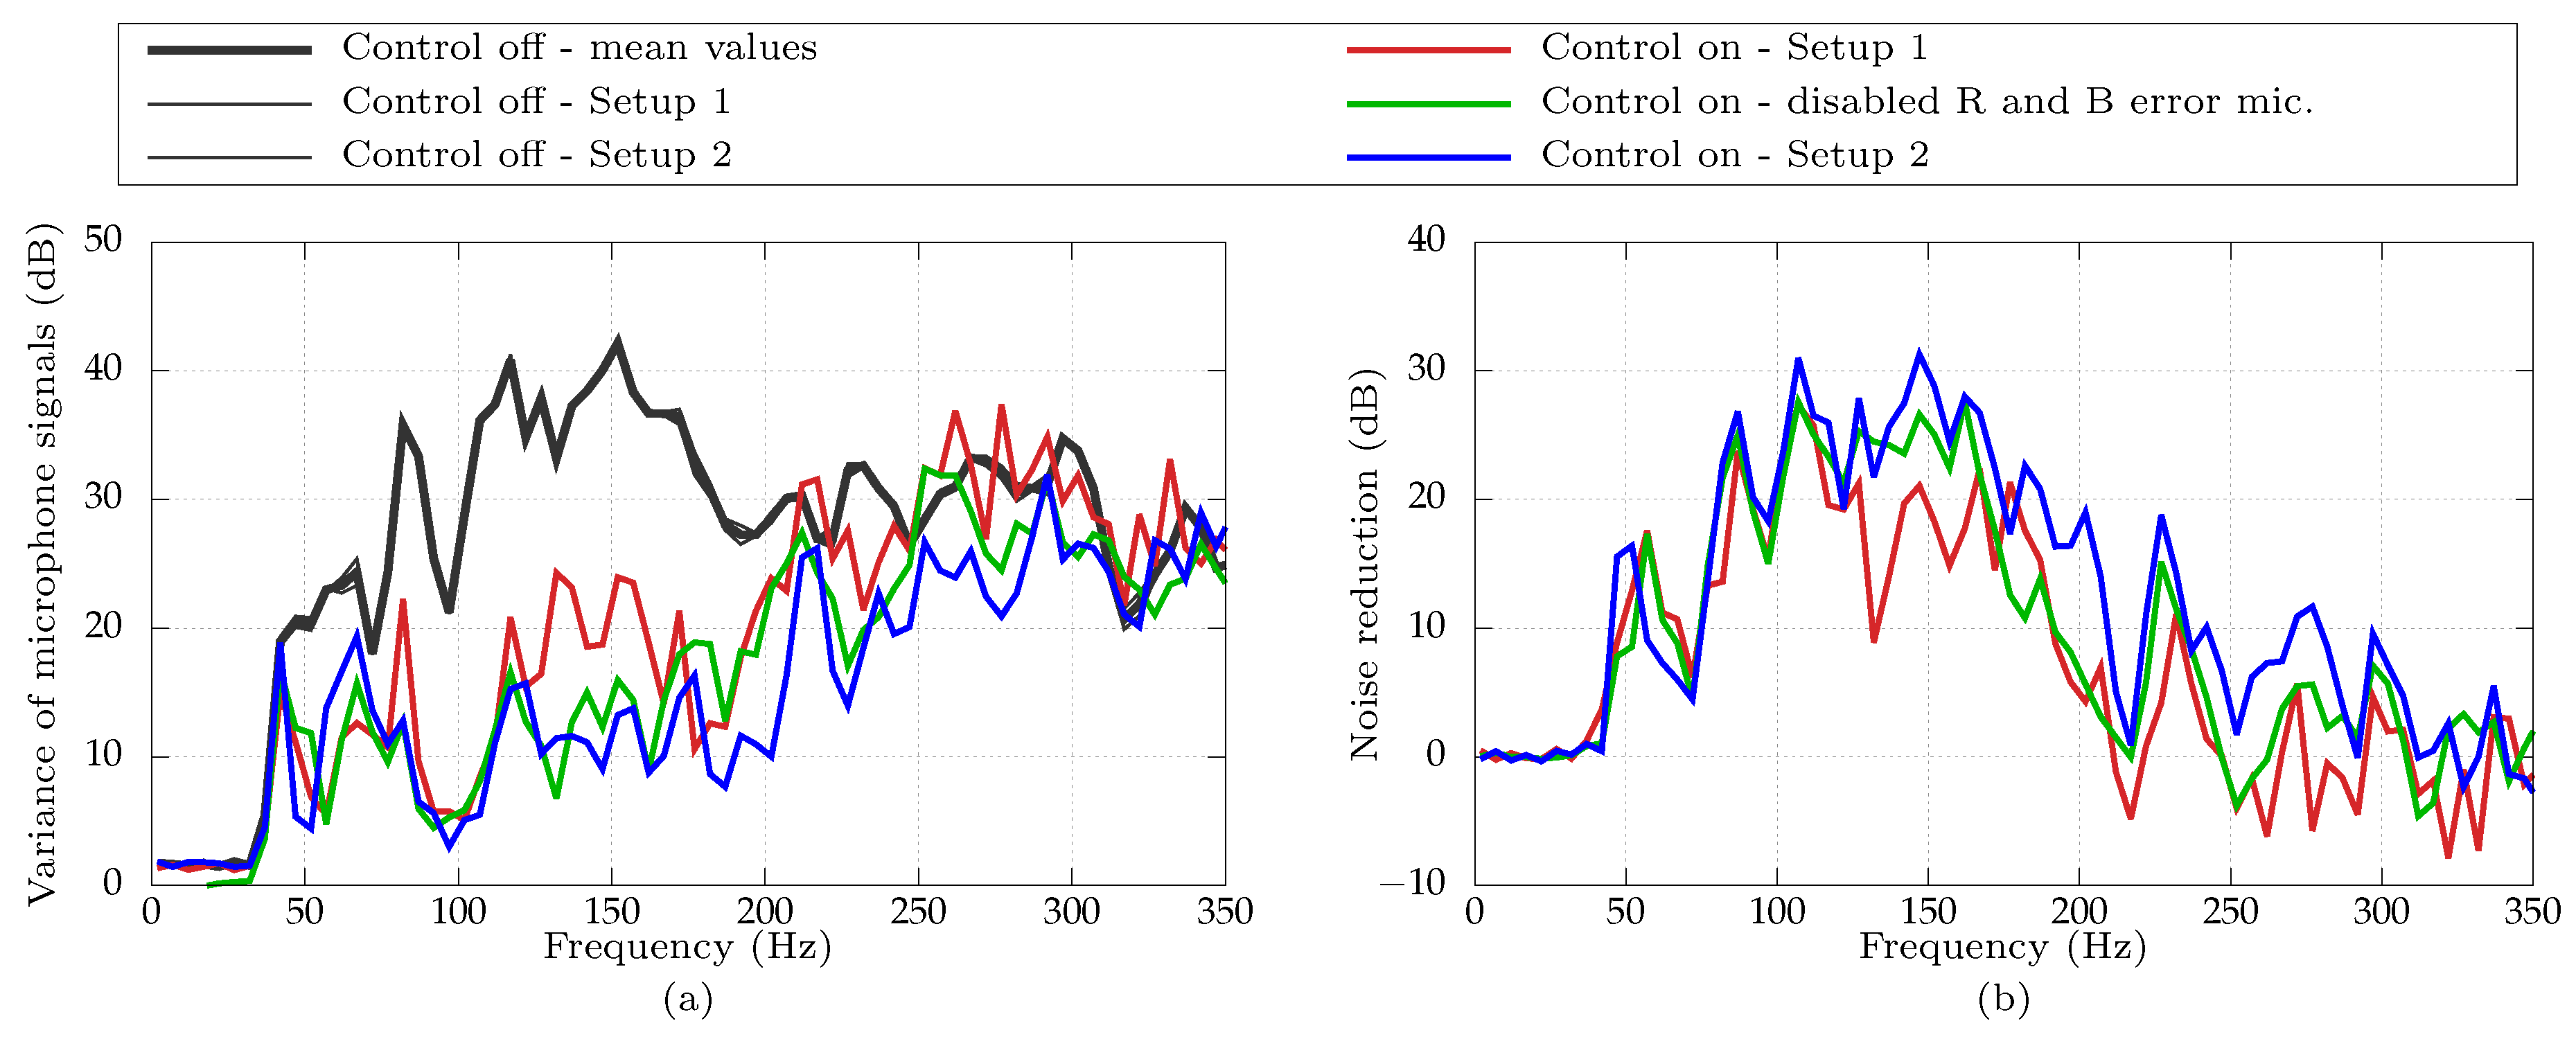
Moreover, it is worth mentioning that when the active casing is placed close to the walls in the corner ( = 0.1 m), the error microphones placed in the gap at locations and in Setup 1 actually impede the correct adaptation of the control system. Even unplugging them, leaving only three error microphones operating, improves the control performance, as shown in Figure 16 (the specific configuration with disabled and error microphones is marked with green color). It is important to keep this conclusion in mind, when an obstacle with reflecting surface is in the proximity of an active casing, as such location between the casing and the obstacle may be disadvantageous for error microphones.
Another conclusion follows from a comparison of control performance for the casing placed at the distance = 0.1 m in Setup 2, and placed at the distance = 0.8 m in Setup 1. Both of these two opposite scenarios provide very satisfying performance, reaching very high mean reduction levels. However, the reduction levels observed for the casing placed in the corner are higher and are over a wider frequency band. Although the difference is not high, it is clearly visible and leads to a conclusion that placing the active casing in a corner can be beneficial compared to being placed at locations distant from enclosure walls. At least, such configuration, if technically feasible, should provide results of the same quality. Moreover, it follows from the research that such configuration, which for many applications is more realistic, is not less efficient. These conclusions are some of the major contributions of this paper, as such configuration of the active casing has not yet been evaluated.
In addition, one more test has been done to check how much the actuators mounted to the casing panels facing the corner contribute to the overall noise reduction. Hence, in addition to secondary paths investigation, a control experiment has been performed with specific actuators disabled. Firstly, the actuators mounted to the left and front panels were disabled. Then, the actuators mounted to the right and back panels were disabled. Obtained results compared with results for all actuators operating are shown in Figure 17. What is interesting is that no significant difference can be noticed between disabling front and left panels, or back and right panels (the same number of actuators were operating). This proves that the actuators actually excite the whole casing with such efficiency that even placing them at panels facing the corner is equally beneficial as placing them at panels facing the enclosure interior. This can be explained by very strong coupling between casing panels, which was studied in detail in [12]. It is also noteworthy that disabling eight of 21 actuators did not affect heavily the overall noise reduction by the active casing. In the lower frequency range, where the inertial actuators lack efficiency, the superiority of using more actuators is visible (lesser number of actuators lacks power to control the lowest frequencies). However, for frequencies above approximately 100 Hz, very comparable results have been obtained for all evaluated configurations (with all actuators operating, and some of them disabled). This shows a robustness of the proposed active noise reducing casing.
7. Conclusions
The active casing approach has been proven in previous research of the authors to provide significant global noise reduction. However, the active casing was placed at a distance from the enclosure walls. In this paper, the active casing was located in a corner and such placement is intentionally used to facilitate the active control system operation. On the other hand, such arrangement is common for many applications. Extensive active control experiments were carried out and a thorough study on control system performance was presented, which is the main contribution of this paper. In the opinion of the authors, the presented research confirms the hypothesis that placing the active casing in a corner and appropriately rearranging the microphones can lead to both enhanced noise reduction levels and a wider frequency range of global noise reduction. The analysis of both primary and secondary paths was also given as an additional insight into the investigated plant.
The following conclusions can be drawn from the presented results. When the active casing approaches the corner, there is a threshold distance when it is beneficial to move the error microphones out from the gap between the casing and the corner, and place them on the other side of the casing, supporting the error microphones there (change from the Setup 1 to Setup 2). Then, the distance between the error microphones becomes smaller and the frequency range, in which acoustic emission is properly observable, becomes greater [25]. This results in higher mean reduction levels and in a wider frequency band, where the global noise reduction is achieved.
For better representation of this behavior, let us assume that the noise source is surrounded by a sphere, at which a limited number of error microphones are placed. The effectiveness of the global noise reduction is limited in the frequency range by the distance between the error microphones—it should be smaller than the wavelength of noise to avoid spatial aliasing and to provide a proper observability of the emitted noise. In the previous research, when the active casing was distant from the enclosure walls, the introduced sphere was actually limited to a hemisphere, as the casing was placed on the floor. However, when the active casing is placed in a corner, the hemisphere is further reduced to approximately one-eighth of the sphere. Therefore, the remaining spherical surface which has to be covered with error microphones is smaller, hence the same number of microphones can be more densely distributed. This leads to smaller distances between error microphones, facilitating the operation of the active control system.
Besides this major conclusion, two more observations are worth emphasizing. Firstly, an error microphone placed in a narrow gap between the casing and a sound-reflecting obstacle may not only be useless, but it may even impede the adaptation of the control system. Secondly, if the cross couplings between casing panels are strong, placing the actuators at panels facing the corner walls is as beneficial as placing them at panels facing the interior of the enclosure. This may be important when actuators placement is decided, and the surface available for actuators can be limited due to the device occupying most of the space inside the casing. This research also shows that placing the casing at the corner does not limit the performance in terms of globally reducing noise generated by the enclosed source.
The authors believe that the presented research provides more insight into the operations of the active casing and helps to extend the applicability of the proposed active casing approach, as an efficient way to reduce noise generated by devices.
Author Contributions
Conceptualization, A.C., S.W. and M.P.; methodology, A.C. and S.W.; software, S.W. and K.M.; validation, A.C., S.W., J.R., K.M. and M.P.; formal analysis, A.C. and S.W.; investigation, A.C. and S.W.; resources, A.C., S.W., J.R., K.M. and M.P.; data curation, A.C. and S.W.; writing–original draft preparation, A.C.; writing–review and editing, A.C., S.W., J.R., K.M. and M.P.; visualization, A.C. and S.W.; supervision, M.P.; funding acquisition, M.P.; project administration, M.P.
Funding
The research reported in this paper has been supported by the National Science Centre, Poland, decision no. DEC-2017/25/B/ST7/02236.
Acknowledgments
The authors are indebted to two anonymous reviewers for their precious comments and suggestions, which helped improve the paper.
Conflicts of Interest
The authors declare no conflict of interest. The funders had no role in the design of the study; in the collection, analyses, or interpretation of data; in the writing of the manuscript, or in the decision to publish the results.
References
- Alimohammadi, I.; Ebrahimi, H. Comparison Between Effects of Low and High Frequency Noise on Mental Performance. Appl. Acoust. 2017, 126, 131–135. [Google Scholar] [CrossRef]
- Kuo, S.M.; Morgan, D. Active Noise Control Systems: Algorithms and DSP Implementations; John Wiley & Sons, Inc.: Hoboken, NJ, USA, 1996; pp. 1–3. [Google Scholar]
- Elliott, S.J.; Cheer, J.; Bhan, L.; Shi, C.; Gan, W. A Wavenumber Approach to Analysing the Active Control of Plane Waves with Arrays of Secondary Sources. J. Sound Vib. 2018, 419, 405–419. [Google Scholar] [CrossRef]
- Antoñanzas, C.; Ferrer, M.; de Diego, M.; Gonzalez, A. Blockwise Frequency Domain Active Noise Controller over Distributed Networks. Appl. Sci. 2016, 6, 124. [Google Scholar] [CrossRef]
- Wrona, S.; Pawelczyk, M. Active Reduction of Device Narrowband Noise by Controlling Vibration of Its Casing Based on Structural Sensors. In Proceedings of the 22nd International Congress on Sound and Vibration, Florence, Italy, 12–16 July 2015; pp. 1–8. [Google Scholar]
- Loiseau, P.; Chevrel, P.; Yagoubi, M.; Duffal, J. Robust Active Noise Control in a Car Cabin: Evaluation of Achievable Performances with a Feedback Control Scheme. Control Eng. Pract. 2018, 81, 172–182. [Google Scholar] [CrossRef]
- Murao, T.; Shi, C.; Gan, W.; Nishimura, M. Mixed-Error Approach for Multi-Channel Active Noise Control of Open Windows. Appl. Acoust. 2017, 127, 305–315. [Google Scholar] [CrossRef]
- Lam, B.; Shi, C.; Shi, D.; Gan, W. Active Control of Sound Through Full-Sized Open Windows. Build. Environ. 2018, 141, 16–27. [Google Scholar] [CrossRef]
- Fahy, F.J.; Gardonio, P. Sound and Structural Vibration: Radiation, Transmission and Response; Academic Press: Cambridge, MA, USA, 2007; pp. 521–523. [Google Scholar]
- Mao, Q.; Pietrzko, S. Control of Noise and Structural Vibration; Springer: London, UK, 2013; pp. 3–4. [Google Scholar]
- Pietrzko, S. Contributions to Noise and Vibration Control Technology; AGH University of Science and Technology: Cracow, Poland, 2009. [Google Scholar]
- Wrona, S.; Pawelczyk, M. Feedforward Control of a Light-Weight Device Casing for Active Noise Reduction. Arch. Acoust. 2016, 41, 499–505. [Google Scholar] [CrossRef]
- Mazur, K.; Wrona, S.; Pawelczyk, M. Design and Implementation of Multichannel Global Active Structural Acoustic Control for a Device Casing. Mech. Syst. Signal Process. 2018, 98, 877–889. [Google Scholar] [CrossRef]
- Mazur, K.; Pawelczyk, M. Internal Model Control for a Light-Weight Active Noise-Reducing Casing. Arch. Acoust. 2016, 41, 315–322. [Google Scholar] [CrossRef]
- Wrona, S.; Pawelczyk, M. Optimal Placement of Actuators for Active Structural Acoustic Control of a Light-Weight Device Casing. In Proceedings of the 23rd International Congress on Sound and Vibration, Athens, Greece, 10–14 July 2016; pp. 1–8. [Google Scholar]
- Wiora, J.; Wrona, S.; Pawelczyk, M. Evaluation of Measurement Value and Uncertainty of Sound Pressure Level Difference Obtained by Active Device Noise Reduction. Measurement 2017, 96, 67–75. [Google Scholar] [CrossRef]
- Chraponska, A.; Wrona, S.; Rzepecki, J.; Mazur, K.; Pawelczyk, M. Secondary Paths Analysis of an Active Casing Placed at a Wall. In Proceedings of the 2018 Joint Conference-Acoustics, Ustka, Poland, 11–14 September 2018; pp. 48–52. [Google Scholar]
- Kuttruff, H. Room Acoustics; Spon Press: New York, NY, USA, 2009; pp. 35–42. [Google Scholar]
- Long, M. Architectural Acoustics; Elsevier Academic Press: New York, NY, USA, 2006; p. 615. [Google Scholar]
- Bismor, D.; Czyz, K.; Ogonowski, Z. Review and Comparison of Variable Step-Size LMS Algorithms. Int. J. Acoust. Vib. 2016, 21, 24–39. [Google Scholar] [CrossRef]
- Nelson, P.A.; Elliott, S.J. Active Control of Sound; Academic Press: Cambridge, MA, USA, 1992. [Google Scholar]
- Barkefors, A.; Sternad, M.; Brännmark, L. Design and Analysis of Linear Quadratic Gaussian Feedforward Controllers for Active Noise Control. IEEE/ACM Trans. Audio Speech Lang. Process. 2014, 22, 1777–1791. [Google Scholar] [CrossRef]
- Elliott, S.; Stothers, I.; Nelson, P. A Multiple Error LMS Algorithm and Its Application to the Active Control of Sound and Vibration. IEEE Trans. Acoust. Speech Signal Process. 1987, 35, 1423–1434. [Google Scholar] [CrossRef]
- Wrona, S.; Mazur, K.; Pawelczyk, M. Internal Model Control of a Washing Machine Casing for Active Noise Reduction. In Proceedings of the 24th International Congress on Sound and Vibration, London, UK, 23–27 July 2017; pp. 1–8. [Google Scholar]
- Mazur, K.; Wrona, S.; Pawelczyk, M. Placement of Microphones for an Active Noise-Reducing Casing. In Proceedings of the 25th International Congress on Sound and Vibration, Hiroshima, Japan, 8–12 July 2018; pp. 1–8. [Google Scholar]
Figure 1.
The laboratory setup.
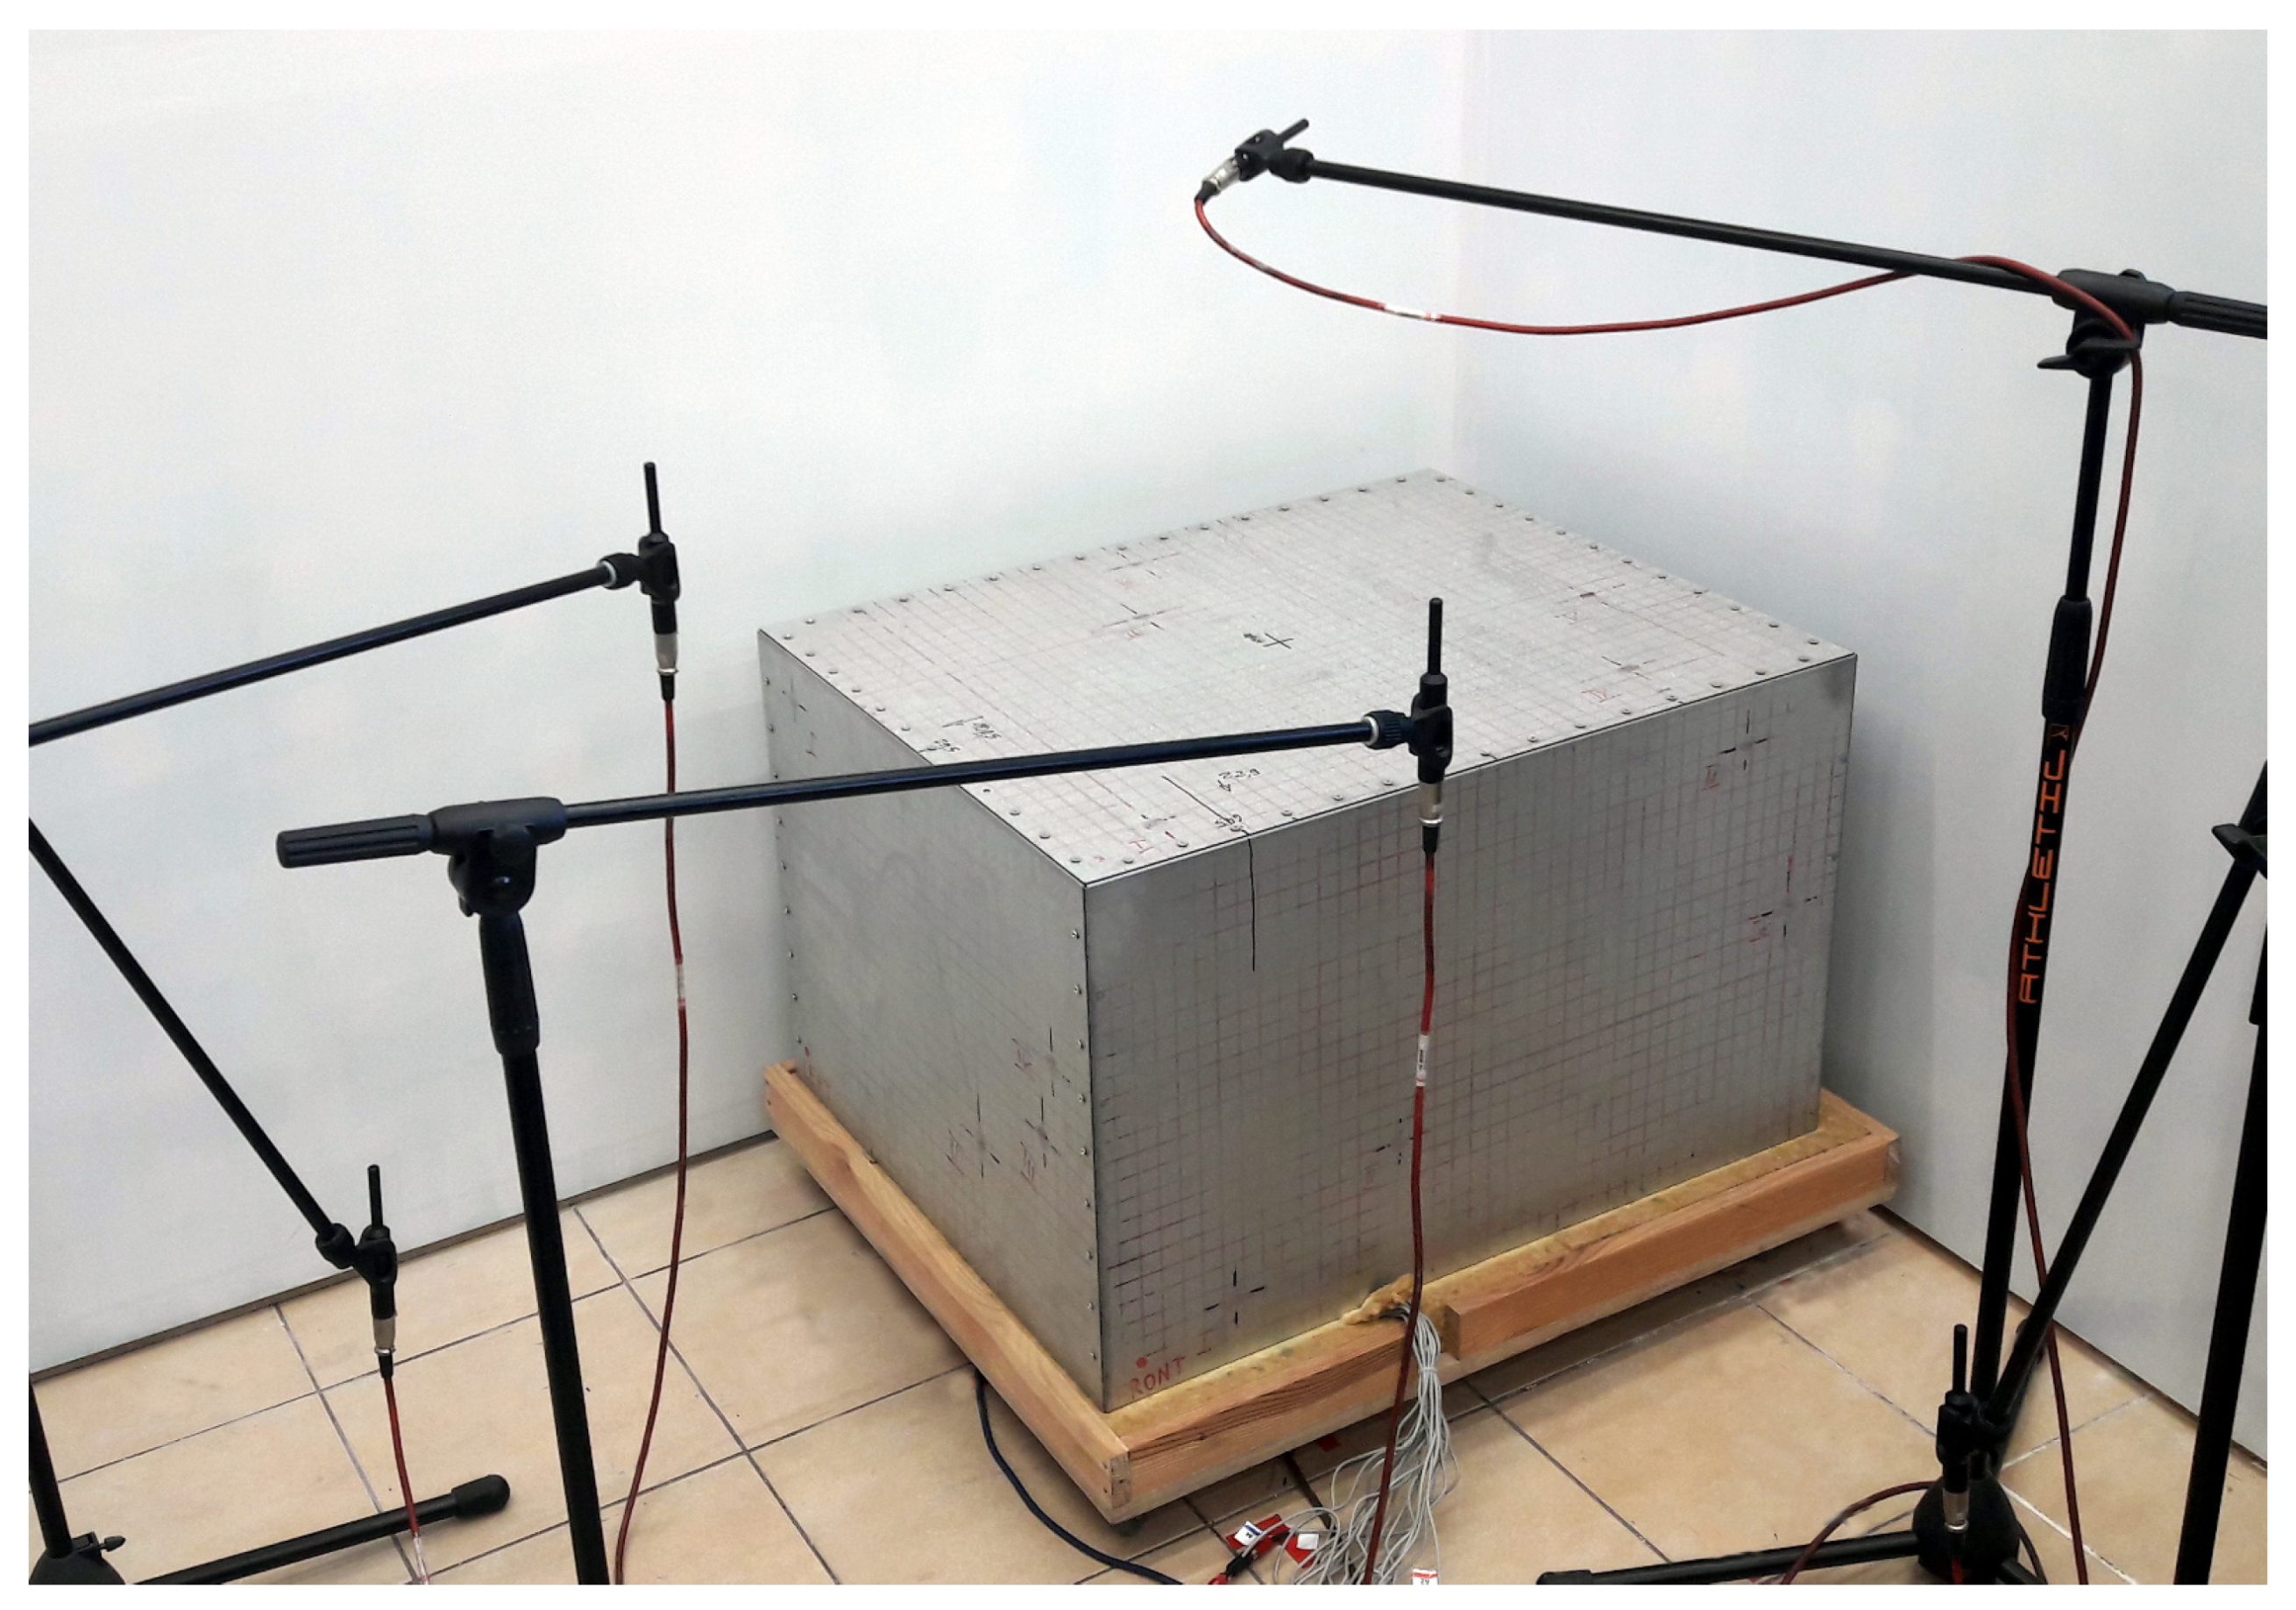
Figure 2.
The schematic representation of the laboratory setup (all dimensions are given in mm).

Figure 3.
The amplitude functions of the frequency functions of the impulse response estimates for the primary paths with the error microphone adjacent to the right casing panel.
Figure 3.
The amplitude functions of the frequency functions of the impulse response estimates for the primary paths with the error microphone adjacent to the right casing panel.

Figure 4.
The amplitude functions of the frequency functions of the impulse response estimates for the primary paths with the error microphone adjacent to the back casing panel.
Figure 4.
The amplitude functions of the frequency functions of the impulse response estimates for the primary paths with the error microphone adjacent to the back casing panel.

Figure 5.
The amplitude functions of the frequency functions of the impulse response estimates for the primary paths with the error microphone adjacent to the top casing panel.
Figure 5.
The amplitude functions of the frequency functions of the impulse response estimates for the primary paths with the error microphone adjacent to the top casing panel.

Figure 6.
The amplitude functions of the frequency functions of the impulse response estimates for the paths between one of the room microphones and the primary source for the eight different distances between the active casing and the wall.
Figure 6.
The amplitude functions of the frequency functions of the impulse response estimates for the paths between one of the room microphones and the primary source for the eight different distances between the active casing and the wall.

Figure 7.
The amplitude functions of the frequency functions of the impulse response estimates for the secondary paths between each casing panel’s selected actuator and the error microphone adjacent to the right casing panel, at a distance of 0.1 m, in both setups.
Figure 7.
The amplitude functions of the frequency functions of the impulse response estimates for the secondary paths between each casing panel’s selected actuator and the error microphone adjacent to the right casing panel, at a distance of 0.1 m, in both setups.

Figure 8.
The amplitude functions of the frequency functions of the impulse response estimates for the secondary paths between right casing panel’s selected actuator and the error microphone adjacent to the right casing panel, at all distances, in both setups.
Figure 8.
The amplitude functions of the frequency functions of the impulse response estimates for the secondary paths between right casing panel’s selected actuator and the error microphone adjacent to the right casing panel, at all distances, in both setups.

Figure 9.
The amplitude functions of the frequency functions of the impulse response estimates for the secondary paths between back casing panel’s selected actuator and the error microphone adjacent to the back casing panel, at all distances, in both setups.
Figure 9.
The amplitude functions of the frequency functions of the impulse response estimates for the secondary paths between back casing panel’s selected actuator and the error microphone adjacent to the back casing panel, at all distances, in both setups.

Figure 10.
The amplitude functions of the frequency functions of the impulse response estimates for the secondary paths between top casing panel’s selected actuator and the error microphone adjacent to the top casing panel, at all distances, in both setups.
Figure 10.
The amplitude functions of the frequency functions of the impulse response estimates for the secondary paths between top casing panel’s selected actuator and the error microphone adjacent to the top casing panel, at all distances, in both setups.

Figure 11.
The amplitude functions of the frequency functions of the impulse response estimates for the paths between back casing panel’s selected actuator and one of the room microphones, at all distances, in both setups.
Figure 11.
The amplitude functions of the frequency functions of the impulse response estimates for the paths between back casing panel’s selected actuator and one of the room microphones, at all distances, in both setups.

Figure 12.
The amplitude functions of the frequency functions of the impulse response estimates for the paths between right casing panel’s selected actuator and one of the room microphones, at all distances, in both setups.
Figure 12.
The amplitude functions of the frequency functions of the impulse response estimates for the paths between right casing panel’s selected actuator and one of the room microphones, at all distances, in both setups.

Figure 13.
The scheme of the FxLMS algorithm [2].
Figure 13.
The scheme of the FxLMS algorithm [2].

Figure 14.
The average variance of the room microphone signals for each of the primary noise tones in the range 1 Hz to 350 Hz with a step of 5 Hz, with and without active control, for both Setup 1 and Setup 2.
Figure 14.
The average variance of the room microphone signals for each of the primary noise tones in the range 1 Hz to 350 Hz with a step of 5 Hz, with and without active control, for both Setup 1 and Setup 2.

Figure 15.
The averaged noise reduction for the noise sensed by the room microphones for each of the primary noise tones in the range 1 Hz to 350 Hz with a step of 5 Hz, for both Setup 1 and Setup 2.
Figure 15.
The averaged noise reduction for the noise sensed by the room microphones for each of the primary noise tones in the range 1 Hz to 350 Hz with a step of 5 Hz, for both Setup 1 and Setup 2.

Figure 16.
(a) The average variance of the room microphone signals for each of the primary noise tones with and without active control and (b) the averaged noise reduction for the noise sensed by the room microphones for each of the primary noise tones. For Setup 1, Setup 2 and Setup 1 with the error microphones B and R disabled, m.
Figure 17.
(a) The average variance of the room microphone signals for each of the primary noise tones with and without active control and (b) the averaged noise reduction for the noise sensed by the room microphones for each of the primary noise tones. Observe, only active control with Setup 2, Setup 2 with the actuators on the left and the front panel disabled and Setup 2 with the actuators on the right and the back panel disable, m.

© 2019 by the authors. Licensee MDPI, Basel, Switzerland. This article is an open access article distributed under the terms and conditions of the Creative Commons Attribution (CC BY) license (http://creativecommons.org/licenses/by/4.0/).
Share and Cite
MDPI and ACS Style
Chraponska, A.; Wrona, S.; Rzepecki, J.; Mazur, K.; Pawelczyk, M. Active Structural Acoustic Control of an Active Casing Placed in a Corner. Appl. Sci. 2019, 9, 1059. https://doi.org/10.3390/app9061059
AMA Style
Chraponska A, Wrona S, Rzepecki J, Mazur K, Pawelczyk M. Active Structural Acoustic Control of an Active Casing Placed in a Corner. Applied Sciences. 2019; 9(6):1059. https://doi.org/10.3390/app9061059
Chicago/Turabian StyleChraponska, Anna, Stanislaw Wrona, Jaroslaw Rzepecki, Krzysztof Mazur, and Marek Pawelczyk. 2019. "Active Structural Acoustic Control of an Active Casing Placed in a Corner" Applied Sciences 9, no. 6: 1059. https://doi.org/10.3390/app9061059
Note that from the first issue of 2016, this journal uses article numbers instead of page numbers. See further details here.