An AC/DC Distribution Network DG Planning Problem: A Genetic-Ant Colony Hybrid Algorithm Approach


1
School of Electrical Engineering, Southeast University, Nanjing 210096, China
2
College of Energy and Electrical Engineering, Hohai University, Nanjing 211100, China
*
Author to whom correspondence should be addressed.
Appl. Sci. 2019, 9(6), 1212; https://doi.org/10.3390/app9061212
Submission received: 13 January 2019
/
Revised: 6 March 2019
/
Accepted: 14 March 2019
/
Published: 22 March 2019
(This article belongs to the Special Issue DC & Hybrid Micro-Grids)
Abstract
:Featured Application
The potential application of this paper is to propose a method to solve the planning problem of DG access to the AC/DC distribution network.
Abstract
The planning problem of distributed generators (DG) accessing the AC/DC distribution network is a hot research topic at present. In this paper, a location and volume model of DG is established that considers DG operation and maintenance costs, DG investment costs, system network loss costs, fuel costs, pollution compensation costs, and environmental protection subsidies. Furthermore, voltage and power constraints are also considered in the model. To solve the proposed model, a hybrid algorithm called the GA-ACO algorithm is presented that combines the ant colony algorithm (ACO) and the genetic algorithm (GA). On one hand GA has good robustness, good adaptability, and quick global searching ability but it also has some disadvantages such as premature convergence and low convergence speed. On the other hand, ACO has the ability of parallel processing and global searching but its convergence speed is very low at the beginning. The IEEE-33 node distribution network is taken as a basic network to verify the rationale of the proposed model and the effectiveness of the proposed hybrid algorithm. Simulation results show that the proposed model is very in line with reality, the hybrid algorithm is very effective in solving the model and it has advantages in both convergence speed and convergence results compared to ACO and GA.
1. Introduction
In today’s society, the energy crisis and environmental protection problems have become more and more serious. Traditional fossil energy cannot meet the goals of sustainable human development. Distributed power generation technology based on renewable energy has attracted more and more attention. Distributed generators (DG) refers to a small generator set that is designed, installed, and operated in a distribution network with capacities ranging from a few kilowatts to tens of megawatts [1]. Due to its high reliability, and clean, environmentally friendly, and flexible installation location, DG plays an increasingly important role in the distribution network.
With the promotion and popularization of DG and the stricter requirements of users for power quality, the traditional AC distribution network has revealed its inability to accept new energy [2,3,4]. In recent years, the development of power electronic devices has made great progress. The continuous improvement of converter devices has accelerated the research on related technologies of DC distribution networks. Compared with AC distribution networks, DC distribution networks have a larger power capacity, and the power loss is reduced, thus, the power quality becomes higher, and the distributed power source has easier access. This has made it more and more popular with scholars. If a DC distribution network is used, the converter used for DG access is saved greatly, and the energy loss is reduced; also, the DC bus has no phase and frequency synchronization problems, making the control of the distributed power supply simple and reliable [5]. Therefore, there is an urgent need to study the problem of DG access to AC /DC distribution networks.
When the DG is connected to the distribution network, the direction of the system power changes, which causes changes in the distribution network loss, so that the network loss is not only related to the load, but also related to the location and quantity of the DG. At the same time, due to the intermittent nature, volatility and randomness of DG, it inevitably affects the safe, stable and reliable operation of the distribution network. If the penetration rate of the distributed power supply is too high or the location of the access distribution network is improperly selected, it will not improve the environmental protection and economy of the grid operation, but will affect the safe and stable operation of the system. Therefore, it is necessary to plan the construction of the distribution network with DG.
At present, the problem of distribution network planning with DG has been studied from different perspectives. El-Khattam et al. [6] compared the difference between the distribution network with DG planning and traditional distribution network planning, and elaborated the DG planning problem from the aspects of economy and reliability. Zeng et al. [7] adopted the two-layer scene planning to solve the optimal distribution network planning scheme. Li et al. [8] established the objective function by reducing the network loss and improving the power quality, and adopted an intelligent algorithm to solve the DG location and capacity determined problem. Zhu D et al. [9] mainly considered DG and utilized the uncertainty of load growth to establish the distribution network planning model with DG and grid as the planning object. Guo et al. [10] comprehensively considered the stochastic volatility of DG and load, and used the opportunity constrained programming method to comprehensively optimize the configuration of DG. Rau N S et al. [11] used the gradient method to find the optimal solution of DG installation and configuration problems, but found it was easy to fall into local parts. Wang et al. [12] considered the location and capacity of DG and the expansion planning of the distribution network, and used a combination of genetic algorithm, branch exchange and simulated annealing algorithm to solve the model. Mei et al. [13] used the improved particle swarm optimization algorithm with simulated annealing algorithm to solve the problem of DG site selection and volume calculation based on the optimal network loss. Ye et al. [14] used the adaptive mutation particle swarm optimization algorithm to plan the location and volume of DG without considering the load-added nodes. However, at this stage, distribution network planning with DG mainly stays in the AC power distribution stage, and there is very limited research content on AC/DC distribution network planning. At the same time, most of the literature on the planning process is mainly based on the rated capacity of DG, and does not take the timing characteristics of the DG and the load into account. This causes deviations in the actual planning problem, and it is necessary to fully consider the DG and load timing characteristics in the planning process.
In recent years, more and more research including the application of heuristic intelligent optimization algorithms has been carried out. Genetic algorithms (GA) and ant colony algorithms (ACO) serve as two mainstream algorithms, and each of them has unique advantages. The genetic algorithm draws on the biological evolutionary law of nature to optimize the solution of the problem by simulating the evolution process of biological genes. The ant colony algorithm mimics real-world ant colony behavior. The algorithm simulates group behavior composed of simple individuals and seeks optimal results through group behavior.
Therefore, this paper establishes a DG access AC/DC distribution network planning model that takes environmental costs and timing characteristics into account, and optimizes the type, location and capacity of DG in the distribution network. At the same time, this paper studies the ideas and methods of GA and ACO to solve the problem, and analyzes the solution process. Then, by combining and improving the two algorithms, a GA-ACO algorithm is proposed and applied to the model solution.
2. AC/DC Distribution Network Model
The AC/DC distribution system generally consists of three main components: an AC distribution network, a DC distribution network, and a voltage source converter (VSC).
The main function of the VSC is to realize the bi-directional flow of active power on the AC side and the DC side, and at the same time to regulate the reactive power. The control mode of the converter mainly includes master-slave control and droop control [15,16,17]. This paper mainly studies the distribution network DG planning method when the converter adopts master-slave control mode.
To study the AC/DC distribution network trend, we must first establish a VSC model. When the VSC model is obtained, the power flow additional equation of the DC system should be given to consider the different control modes of the converter, so that the power flow of the AC/DC power distribution system can be solved. In the AC/DC distribution network described in this paper, the quasi-steady state model is used to equivalently process the DC part. The model not only effectively reflects the power characteristics of the DC converter, but also accurately and fully meets the actual engineering needs. The specific modeling process is as follow [18].
2.1. AC Distribution Network Power Flow Model
2.2. DC Distribution Network Power Flow Model
According to the branch flow model of the AC distribution network, the branch flow model of the DC distribution network can be derived as follows:
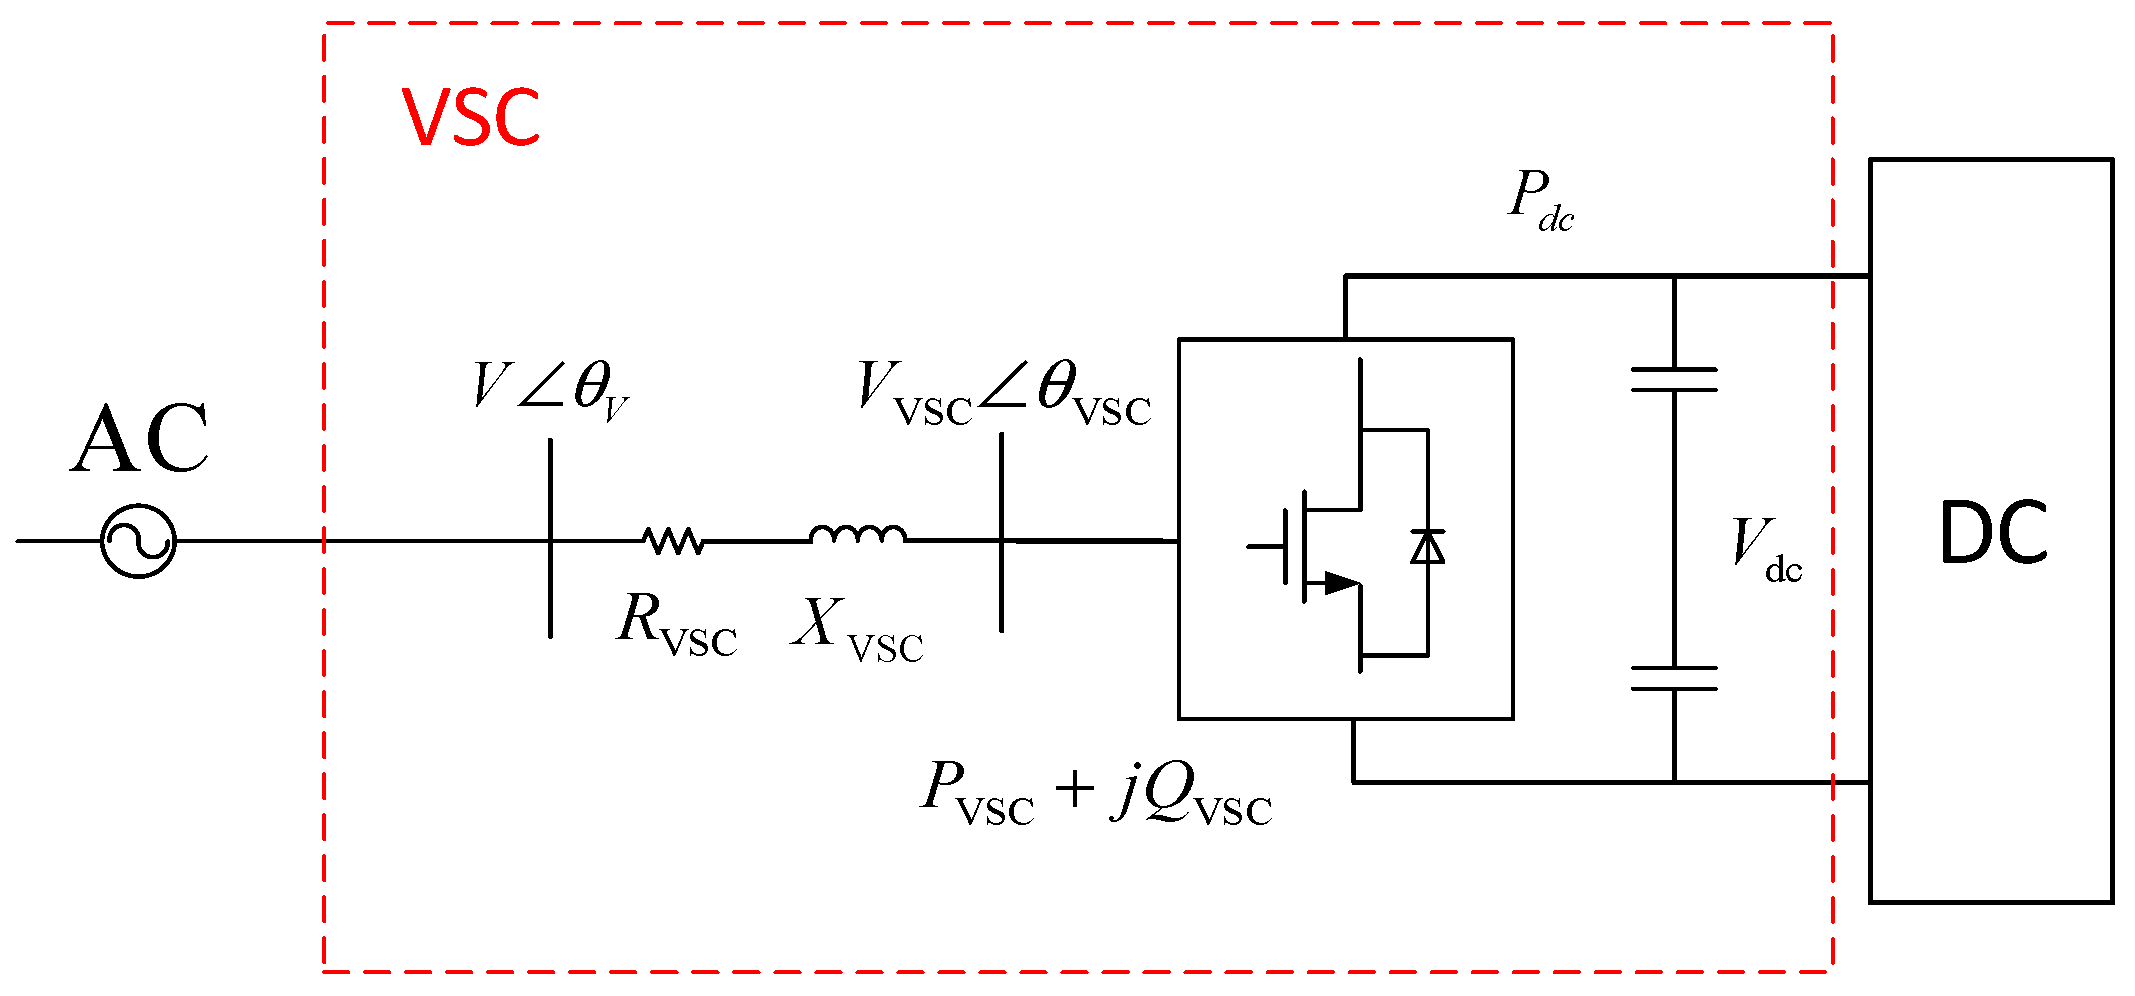
where is the voltage amplitude of the DC node i; is the resistance between the branches ij; is the active power between the branches ij; and are the load active power and DG active power at the node j, respectively. The VSC model is shown in Figure 1. Where is the voltage at the junction of the converter and the AC distribution system, and are the equivalent resistance and reactance inside the converter, is the phase voltage of the input converter, is the power of the input converter, and are the output power and voltage of the converter.
The branch flow model of is as shown in Equation (10). The AC three-phase active power of the input VSC is equal to the DC power of the VSC output. The input voltage and the output voltage satisfy the following relationship:
where is the DC voltage utilization under SPWM modulation, which is 0.866.
3. DG and Load Timing Characteristics
3.1. DG Timing Characteristics
Distributed generator usually contains micro-turbine generators (MT), wind turbine generators (WGs), photovoltaics (PV), and so on. Different types of DG apply to different regions. For example, photovoltaics generate more electricity in areas with sufficient light; micro-turbine generators are more suitable for areas with high heat demand [19]. Different DGs contribute differently to the environment, PV and WG are cleaner distributed generators. However, the timing fluctuation characteristics of these two generators, increase the uncertainty and affect the stability of the system while improving environmental protection. We have fully considered the timing characteristics of PV and WG. If we do not, there is no essential difference between WG and PV, and we cannot reflect on the advantages of MT. Additionally, we do not need to install energy storage equipment in the distribution network as this is contrary to the reality. Therefore, for the DG planning problem, the timing characteristics must be taken into consideration.
We took the three types of DG mentioned above as the research objects because these three types of DG are highly representative: the MT has rated capacity; its output is controllable and does not change with time; and the PV and WG represent a type of DG whose capacity changes with time. We also selected these two types of DG to study the impact of timing characteristics on the distribution network planning in depth.
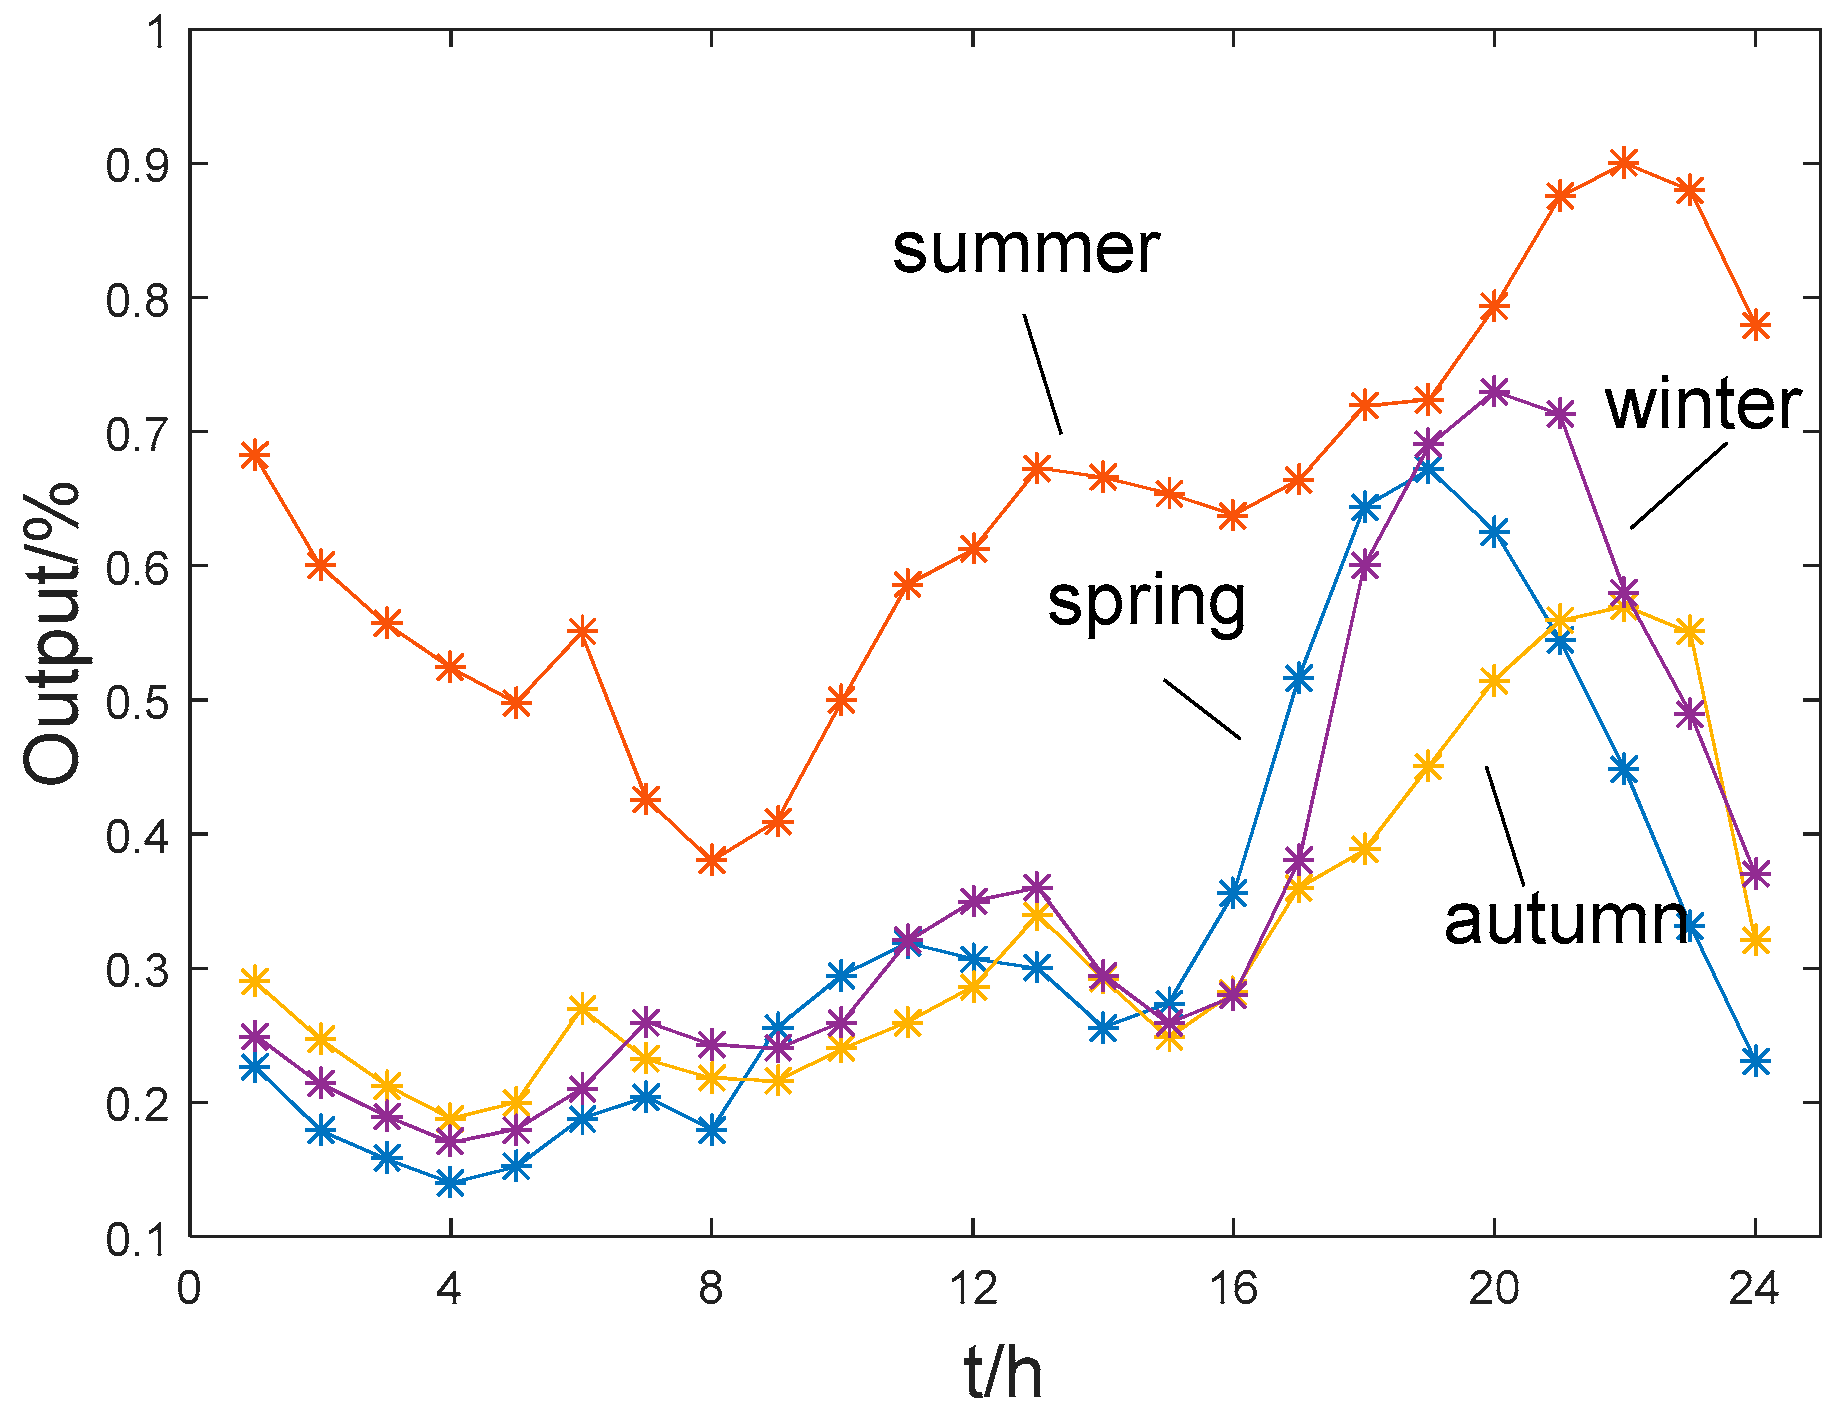
Wind speed has a great influence on the WG. Generally, wind speed is high in the evening and especially in the winter. Therefore, the output is highest in winter and the least in summer. Light intensity and temperature have a great impact on PV. During the day, solar energy is rich, and the PV output is strongest at noon. At night, PV does not generate electricity. In general, PV has the largest output in summer and the least in winter. PV and WG have a natural complementarity, which is the main reason for selecting these two DGs which have different timing characteristics. According to meteorological data [20], wind speed curves and light intensity were obtained in different seasons, and the PV and WG timing characteristics curves were obtained as shown in Figure 2 and Figure 3.
3.2. Load Timing Characteristics
At present, according to power planning and power industry statistics, the power load is generally divided into four typical loads, including industry, commerce, agriculture, and residents. Similar to DG, these loads also have particular timing characteristics. Moreover, the maximum output time of the DG is not always the same as the time of the maximum load. We took residential load and commercial load as the research objects of the distribution network, and their four seasonal load curves are shown in Figure 4 and Figure 5. The electricity consumption of residents is the lowest in the summer. The daily peak hours are generally at noon and in the evening. The daily maximum load time is about 20:00. The minimum load time, except in summer, is about 03:00, while the summer minimum load time is about 07:00 in the morning. The fluctuations in commercial electricity consumption over the four seasons are small, the power consumption period ranges from 09:00 to 23:00, and the maximum load time is about 10:00.
4. DG Optimization Configuration Model of Distribution Network
The objective function of this paper is to minimize the total annual system cost. Based on the distributed power supply capacity and voltage fluctuation range allowed by the distribution network node, the location and capacity of the DG are finally determined.
4.1. Objective Function
The annual cost of the distribution network is
where is the total annual cost of distribution system; is DG annual operation and maintenance costs; is the DG annual equivalent investment cost; is the system network loss cost; is the MT fuel cost; is the pollution compensation cost; and is the environmental protection subsidy fee.
(1) DG annual operation and maintenance costs
where is DG unit operation and maintenance costs, 10,000 yuan/(MW·h); and is the DG power generation connected to the i-th node at time t, MW·h.
(2) DG annual equivalent investment cost
where r is the discount rate; is the DG payback period; is the investment cost of installing DG at the i-th node, 10,000 yuan; and is the number of DG installations at the i-th candidate node.
(3) System network loss cost
where is the unit network loss; is the current on the i-th line, kA; and is the resistance of the i-th line, .
(4) MT fuel cost
where is the unit fuel cost per hour, 10,000 yuan/(MW·h); and is the MT power generation connected to the i-th node at time t, MW·h.
(5) Pollution compensation cost
where is the emission intensity of greenhouse gas produced by a unit MT, kg/(MW·h); is the environmental protection value, yuan/kg; and is a fine for the MT to emit greenhouse gases, yuan/kg.
(6) Environmental protection subsidy fee
where and are respectively PV and WG environmental subsidies for unit power generation, 10,000 yuan/(MW·h); and are respectively the PV and WG power generations connected to the i-th node at time t, MW·h.
4.2. Constraints
(1) DG installation capacity constraint
Light intensity, temperature, wind speed are all uncertain factors. If too much of this type of DG is added to the distribution network, the power quality of the system will be degraded. It is therefore necessary to limit the installation capacity of PV and WG.
where and are respectively the PV installation capacity at the i-th PV candidate node and the WG installation capacity at the i-th WG candidate node; and are respectively the maximum installation capacity of PV and WG.
(2) Power flow equation
where and are the active power and reactive power injected into node i, respectively; is the voltage amplitude of node i, represents all nodes connected to node i; and are respectively the admittance matrix real part and virtual part of the system; and is the phase angle difference between node i and node j.
(3) Voltage constraint
where and are the upper and lower limits of the AC node voltage amplitude; and are the upper and lower limits of the DC node voltage amplitude.
(4) Branch flow constraint
where is the power on branch j; is the maximum allowable capacity on AC branch j; is the maximum allowable capacity on DC branch j; is the maximum allowable capacity on VSC.
(5) Pollution compensation cost
where is the total capacities of the DGs at the time t, and is the sum of the loads of all nodes at time t.
5. Model Solving
In this paper, a GA-ACO algorithm is used to solve the model. The genetic algorithm mimics the generation and evolution process of all life intelligences. Using group search technology, through the genetic manipulation of selection, crossover and mutation of the current population, new groups are generated, and the population is gradually evolved to a state containing, or close to, the optimal solution. The ant colony algorithm searches for optimal solutions by simulating the processes that ant colonies use to search for food. Ants leave pheromones on the path they walk. The more ants that pass along the path, the more pheromones they leave, and the greater the probability that later ants will choose the path, thus forming a positive feedback mechanism, and finding the optimal solution.
The genetic algorithm has a large-scale and diverse initial population, so that global optimization is performed at the beginning of the algorithm, and the genetic algorithm is scalable and easy to combine with other algorithms. However, in the late stage of the genetic algorithm, the feedback information cannot be easily used, and a large number of redundant iterations are generated, which affects the convergence speed and accuracy of the algorithm. The ant colony algorithm has a fast convergence rate and good global convergence. In particular, when the pheromone is accumulated to a certain extent, the algorithm can quickly find the optimal solution. However, the disadvantage is that the accumulation of pheromones is slow at first, and it is easy to fall into the local optimum at the beginning.
Based on the advantages and disadvantages of the above two algorithms, the two algorithms can be combined to make up for their respective shortcomings. In this paper, the genetic algorithm is used to generate the initial solution, then these initial solutions are transformed into the pheromone distribution in the ant colony algorithm. Finally, the positive feedback mechanism of the ant colony algorithm is used to search for the optimal solution. The GA-ACO algorithm solution flow chart is shown in Figure 6.
5.1. Genetic Algorithm Solving
In this paper, we use binary coding. Each chromosome is regarded as a planning scheme. Each chromosome contains NDG elements. The first NMT elements represent the installed number of MT. The intermediate Npv elements represent the number of PV installations at each PV node to be selected; the last Nwg elements represent the number of WG installed at each WG node to be selected.
(1) Initial Population
The initial population of the genetic algorithm is randomly generated. To solve this model, a certain chromosome in the initial population does not meet the constraints. Combined with the planning model, the initial population is required to fully satisfy the system capacity constraints. Therefore, it is necessary to carry out innate elimination, and the individuals who do not satisfy the constraints are eliminated and regenerated until the number of individuals satisfy the constraints and reach the requirements of the initial population.
(2) Selection Operator
According to the fitness value, the individuals in the population are selected to obtain the parent sample. This paper uses the optimal individual preservation and roulette strategy to select operators. That is, the individual with the highest fitness is saved as a parent. For the remaining individuals, the roulette method is used to calculate the selected probability of each individual’s fitness to select the retained individual. That is, the more it satisfies the target condition, the easier it is to be inherited by the offspring, but other individuals have offspring with a small probability to prevent the algorithm from falling into local optimum and guarantee global convergence.
(3) Crossover Operator
For individuals in the population, cross operations are performed according to a certain crossover probability, and corresponding mutation operations are performed according to the probability of a certain mutation generating a next generation population. In this paper, the crossover operation uses a two-point crossover operator, and the mutation operation uses a single-point mutation operator.
(4) Eliminate
Because the genetic algorithm generates the randomness of the individual, the generated offspring may not satisfy the constraint. This paper sets a penalty function. When the mismatching of the offspring is higher, the degree of the penalty is larger, making the gene of the offspring difficult for the next generation to inherit, thus ensuring the innate superiority of the population.
5.2. Ant Colony Algorithm Solving
(1) Pheromone Initialization
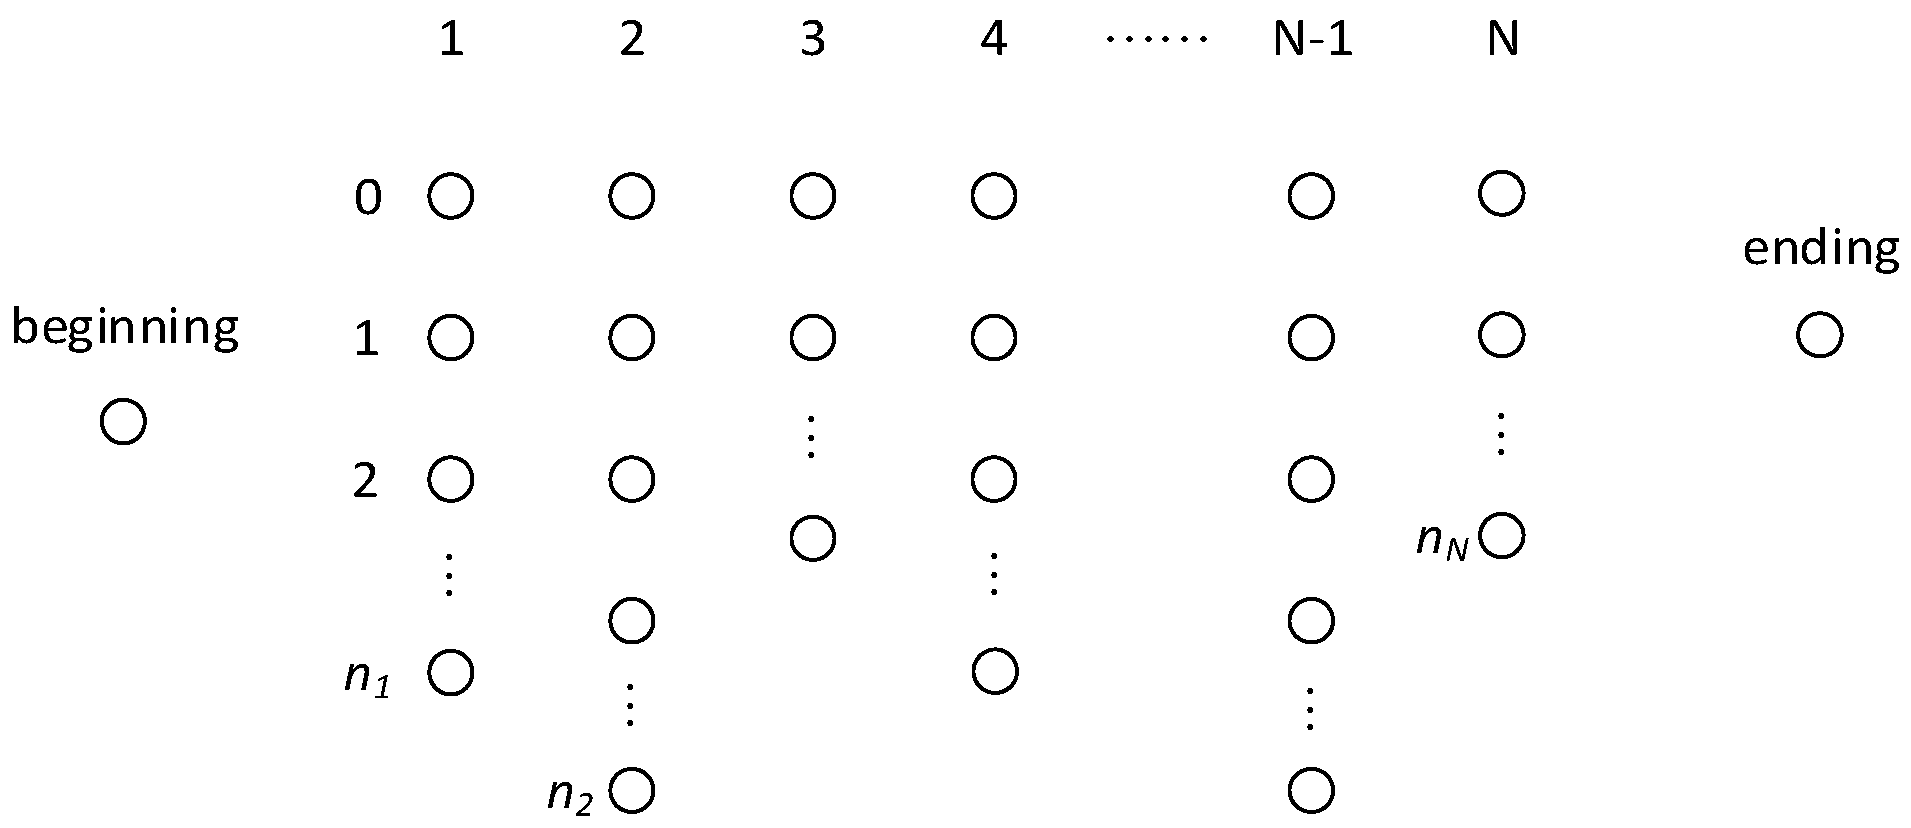
According to the location selection of the DGs, assuming that there are N installable DGs nodes, and the DGs capacity that may be installed on the node i is ni, then a similar matrix as shown in Figure 7 can be generated.
After T generation genetic optimization by genetic algorithm, m better solutions are obtained. Then the m preferred solutions are converted into the location and capacity of the ant colony algorithm, as shown in Figure 8. These location capacities are connected to form m paths, and update the pheromones on those paths. The number of ants is also set to m. M slaves are placed on m paths and the previous update pheromone are used as the initial value of the pheromone.
(2) Loop Iteration
In each iteration, ant k (k = 1, 2, 3, …, m) determines the direction of their transition based on the pheromone on each path. The tabu table, tabuk is used to record the location capacity of the ants. The ant determines the transition probability based on the pheromone and path heuristic information on each path. Pij(t) represents the probability that ant k is transferred from position i to position j at time t:
where (k = 1, 2, 3, …, m) represents the position that the ant k next allows to select. is a heuristic information factor, and represents the importance of the motion trajectory, that denotes the role that information accumulated by ants during exercise plays in the selection of ant movements. has a value range of (0,5). is the heuristic factor of expectation, which is the importance of characterizing the visibility of the path, that is, the role that the ant plays in the ant selection path during the movement. The value range of is (0,5).
represents the pheromone strength on the path (i, j) at time t. Where i is the beginning location and j is the end location. is a heuristic function, which is generally the reciprocal of the sum of the DG installation cost at location j and the distributed power source operating cost.
(3) Pheromone Update
According to the expected value of each capacity of each node and the pheromone concentration value on the path, the transition probability of the n-th ant at each capacity point on the node is calculated, and then the path is selected.
In order to prevent excessive heuristic pheromone and flooding the heuristic information, the residual pheromone is updated after the ant completes an ergodic operation on all m position capacities. According to Equations (27) and (28), adjusting the amount of information on the path (i, j) at time t+1
where is the pheromone volatilization coefficient, is the pheromone residual coefficient, and is in the range of (0, 1). represents the pheromone increment on the path (i, j) during the current cycle, =0 at the initial time. represents the number of pheromones left by the k-th ant in the path (i, j).
where Q represents the pheromone strength, and its value affects the convergence speed of the algorithm. Lk represents the total cost of the path taken by the k-th ant in this cycle.
6. Case Analysis
In this paper, the IEEE-33 standard node distribution network is used as an original network for analysis [21]. The distribution network structure is shown in Figure 9.
6.1. Case Parameters
In Figure 9, 0-33 is the node number, and L1-L33 are the line numbers. The node and line basic data are shown in Table 1.
Based on the original AC distribution network, the following changes were made to simulate the AC/DC distribution network: the AC lines between node 20 and node 21, node 23 and node 24, node 31 and the node 32 change into the DC lines. Capacitors with a value of 1 are modified at nodes 20, 21, 23, 24, 31, 32. The VSCs are installed after the three DC lines, and the configuration parameters of the converter station are consistent: the rated capacity is 2MVA, the resistance is 0.5 Ω, and the reactance is 1.5 Ω.
The MT candidate nodes are 2, 6, 10, and 14, the PV candidate nodes are 21, 24, and 32, and the WG candidate nodes are 22 and 25. The maximum current carrying capacity of the AC line is 5000 kVA, and the maximum current carrying capacity of the DC line is 2500 kVA. The node voltage is allowed to range from 0.9 to 1.1 p.u., and the three types of DG are rated at 0.1 MW. The number of access nodes to be selected for all three DGs is limited to 15. The discount rate r is taken as 0.1, the DG recovery period is taken as 20, the unit net loss is taken as 0.017 million yuan/(MW h), and the greenhouse gas emission intensity per unit MT is taken as 724.6 kg/(MW h). The environmental protection value of greenhouse gases is taken as 0.023 yuan/kg, and the fine for greenhouse gas emissions from MT is taken as 0.01 yuan/kg. The parameters of the genetic algorithm are: the population individual is 100, the number of iterations is 20, the crossover rate is 0.5, and the mutation rate is 0.1. The ant colony algorithm parameters are: the number of ants is 60, the pheromone concentration retention coefficient is 0.9, and the information heuristic factor and the expected heuristic factor are both 1, at the initial moment , the number of iterations is 60.
6.2. Result Analysis
(1) Consider Timing Characteristics
By simulating the timing characteristics of DG and the load, this paper draws a plan that is more in line with the actual operation of the AC/DC distribution network. If the timing characteristics of DG and load are not considered, the output of DG in the system remains unchanged, and the output is based on the rated capacity. The two planning schemes considering the timing characteristics and disregarding the timing characteristics are shown in Table 3 and Table 4.
It can be seen from the above results that the algorithm avoids including the MT if the timing characteristics are not considered. This is because although the investment and maintenance cost of gas MT are low, the environmental cost is too high, and the environmental subsidies for PV and WG are very high, the overall cost of MT is higher than that of PV and WG. However, the fact that the gas turbine is not added is obviously contrary to the actual situation, because in fact, the PV and WG outputs have strong volatility. If only these two types of DG are installed, there will be a certain period of time when the power supply does not meet the demand and this affects the reliable operation of the power grid. Therefore, it is necessary to consider the timing of DG.
(2) Algorithm Comparison
In order to verify the effectiveness of the GA-ACO algorithm, the genetic algorithm, ant colony algorithm and GA-ACO algorithm were used to optimize the DG access to the AC/DC distribution network. Since the results calculated by each of the algorithms in each iteration are different, this study performed 10 experiments on each of the three algorithms and took the average of the results. The final costs of the three algorithms are shown in Table 5 and the optimization curve for the three optimization algorithms is shown in Figure 10.
From the table and the figure we can see that the genetic algorithm at the beginning of the optimization results is better than the ant colony algorithm, and the convergence speed is faster than the ant colony algorithm before the 20th generation, because the genetic algorithm has a wide range of search capabilities at the beginning of the search. The ant colony algorithm takes a long time to accumulate pheromones at the beginning. In the 20th generation of the iterations, the redundant iterations generated by the genetic algorithm in the later stage affect the convergence speed and fall into the local optimal solution. The convergence speed of the ant colony algorithm starts to accelerate, and the convergence is completed at about 40 generations. However, because the initial pheromone accumulation is not complete, the global optimal solution cannot be searched. The GA-ACO algorithm combines the advantages of both algorithms. At the beginning, it uses a wide range of genetic algorithms to search for pheromones, and then uses the ant colony algorithm to help the whole optimization process maintain a faster convergence speed and not fall into local parts optimal, then, the global optimal solution is found around the 60th generation.
(3) Considering Load Growth
Load growth is also taken into consideration in this paper. It is assumed that all loads will increase by 50% in the next 15 years [23]. The number of access nodes to be selected for all the three DGs will increase to 30. What is more, the line capacity will double. The simulation results are shown in Table 6 and Figure 11.
It can be seen that by considering the load growth, the model can still reasonably reflect the actual situation and this further verifies the effectiveness of the hybrid algorithm in convergence speed and convergence.
7. Conclusions
This paper aims to optimize the location and volume of DG in the AC/DC distribution network. Based on the consideration of DG and load timing characteristics, a DG planning model is established. The model is solved by the GA-ACO algorithm. The following conclusions were obtained from the case analysis:
- (1)
- It is necessary to consider environmental costs in the problem of DG access to the distribution network, because this reflects the environmental advantages of PV and WG, helps to achieve a balance between system economics and environmental protection, and greatly improves the utilization rate of new energy, and this makes the distribution network cleaner and more environmental-friendly.
- (2)
- Timing characteristics models are critical in solving the problem of DG access to the distribution network. By considering the timing characteristics, the model can more accurately reflect the operation of the distribution network, and the resulting planning scheme is more realistic.
- (3)
- The GA-ACO algorithm combines the advantages of genetic and ant colony algorithms. It is superior to the two algorithms in terms of convergence speed and convergence results, and effectively avoids the objective function falling into the local optimal solution.
Author Contributions
Conceptualization, D.Y.; Formal analysis, F.M.; Writing—Original Draft, D.Y.; Writing—Review & Editing, F.M. and J.Z.
Funding
This paper is supported by the 2107 Key Research and Development Plan of Jiangsu Province BE2017030 “Research on Custom Power System in Photovoltaic/Battery microgrid with VSG interface”.
Conflicts of Interest
The authors declare no conflict of interest.
References
- Georgilakis, P.S.; Hatziargyriou, N.D. Optimal Distributed Generation Placement in Power Distribution Networks: Models, Methods, and Future Research. IEEE Trans. Power Syst. 2013, 283, 3420–3428. [Google Scholar] [CrossRef]
- Boroyevich, D.; Cvetković, I.; Dong, D.; Burgos, R.; Wang, F.; Lee, F. Future electronic power distribution systems—A contemplative view. In Proceedings of the 2010 12th International Conference on Optimization of Electrical and Electronic Equipment, Basov, Romania, 20–22 May 2010; pp. 1369–1380. [Google Scholar]
- Bifaretti, S.; Zanchetta, P.; Watson, A.; Tarisciotti, L.; Clare, J.C. Advanced Power Electronic Conversion and Control System for Universal and Flexible Power Management. IEEE Trans. Smart Grid 2011, 22, 231–243. [Google Scholar] [CrossRef]
- Jiang, D.; Zheng, H. Current Status and Prospects of DC Distribution Network Research. Autom. Electr. Power Syst. 2012, 368, 98–104. [Google Scholar]
- Zhao, B.; Zhao, Y.; Wang, Y.; Liu, G.W.; Song, Q. Energy Internet System Based on Flexible Medium Voltage DC Power Distribution. Proc. CSEE 2015, 3519, 4843–4851. [Google Scholar]
- Elkhattam, W.; Hegazy, Y.G.; Salama, M.M.A. An Integrated Distributed Generation Optimization Model for Distribution System Planning. IEEE Trans. Power Syst. 2005, 202, 1158–1165. [Google Scholar] [CrossRef]
- Zeng, B.; Liu, N.; Zhang, Y.; Yang, X.; Zhang, J.; Liu, W. Bi-level Scenario programming of active distribution etwork for promoting intermittent distributed generation utilization. Trans. China Electrotech. Soc. 2013, 289, 155–163. [Google Scholar]
- Li, H.; Yang, J.; Cui, J. Research on the most preferable location and constant volume of multi-distributed power supply considering network loss and voltage. J. Electr. Eng. 2015, 109, 79–86. [Google Scholar]
- Zhu, D.; Broadwater, R.P.; Tam, K.S.; Seguin, R.; Asgeirsson, H. Impact of DG placement on reliability and efficiency with time-varying loads. IEEE Trans. Power Syst. 2006, 211, 419–427. [Google Scholar] [CrossRef]
- Guo, J.; Li, X.; Deng, W.; He, C.; Liu, W. Comprehensive optimal allocation of intermittent distributed generation and reactive power compensation based on bilevel planning. Proc. CSEE 2013, 3328, 25–33. [Google Scholar]
- Rau, N.S.; Wan, Y.H. Optimum location of resources in distributed planning. IEEE Trans. Power Syst. 2002, 94, 2014–2020. [Google Scholar] [CrossRef]
- Wang, C.S.; Chen, K.; Xie, Y.H.; Zheng, H.F. Siting and sizing of distributed generation in distribution network expansion planning. Autom. Electr. Power Syst. 2006, 303, 38–43. [Google Scholar]
- Mei, H.; Cheng, H.; Wang, W. Optimal Configuration of Distributed Power Supply in Active Distribution Network. J. Electr. Power Syst. Autom. 2016, 2811, 1–8. [Google Scholar]
- Ye, D.; He, Z.; Pei, T. Siting and sizing of distributed generation planning based on adaptive mutation particle swarm optimization algorithm. Power Syst. Technol. 2011, 356, 155–160. [Google Scholar]
- Li, Y.; Mu, Q.; An, N. Development and Challenges of DC Grid Model and Simulation. Autom. Electr. Power Syst. 2014, 384, 127–135. [Google Scholar]
- Frank, S.M.; Rebennack, S. Optimal design of mixed AC–DC distribution systems for commercial buildings: A Nonconvex Generalized Benders Decomposition approach. Eur. J. Oper. Res. 2015, 2423, 710–729. [Google Scholar] [CrossRef]
- Wang, S.; Chen, S.; Xie, Y. Coordinated Economic Dispatch of Energy Storage and Converter Stations in AC/DC Distribution Network Considering Safety Constraints. Autom. Electr. Power Syst. 2017, 4111, 85–91. [Google Scholar]
- Wang, Y.; Han, X.; Sun, D.; Li, Y.; Chen, Y.; Li, D. Power flow algorithm based on AC/DC associated minimum Jacobian matrix structure. Autom. Electr. Power Syst. 2015, 39, 1–6. [Google Scholar]
- Xiao, H.; Pei, Y.; Deng, W. Analysis of the Influence of Distributed Power Supply on Distribution Network Voltage and Its Optimal Control Strategy. Trans. China Electrotech. Soc. 2016, 31, 203–213. [Google Scholar]
- He, N. Comparative Analysis of Diurnal Variations of Wind Speed and Light Intensity in the Bohai Bay. Meteorology 1980, 64, 30–31. [Google Scholar]
- Baran, M.E.; Wu, F.F. Network reconfiguration in distribution systems for loss reduction and load balancing. IEEE Trans. Power Deliv. 1989, 42, 1401–1407. [Google Scholar] [CrossRef]
- Guo, X.; Cheng, H.; Masoud, B. Optimal sitingand sizing of distributed generation in microgrid based on adaptive DPSO. Water Resour. Power 2013, 9, 220–224. [Google Scholar]
- Shao, Y.; Zhao, J.; Fang, J. Joint Dynamic Programming of Distributed Wind Power and Capacitor Based on Load Classification Growth. Power Syst. Technol. 2019, 1, 316–324. [Google Scholar]
Figure 1.
Voltage source converter (VSC) model.

Figure 2.
Photovoltaics (PV) timing characteristics curve.

Figure 3.
Wind turbine generators (WG) timing characteristics curve.

Figure 4.
Residential loads timing characteristics curve.

Figure 5.
Commercial loads timing characteristics curve.

Figure 6.
Algorithm flow chart.

Figure 7.
Ant colony algorithm search path diagram.

Figure 8.
Genetic algorithm result conversion.

Figure 9.
IEEE-33 standard node distribution network.

Figure 10.
Optimization algorithm comparison chart.

Figure 11.
Optimization algorithm comparison chart considering load growth.


Table 1.
Node and line data.
| Node Number | Load/MW | Load Type | Line Number | Start Node | End Node | R | X |
|---|---|---|---|---|---|---|---|
| 0 | 0 | balance | |||||
| 1 | 0.1 | commercial | 1 | 0 | 1 | 9.22 | 4.7 |
| 2 | 0.09 | commercial | 2 | 1 | 2 | 4.93 | 25.1 |
| 3 | 0.12 | commercial | 3 | 2 | 3 | 36.6 | 18.6 |
| 4 | 0.06 | commercial | 4 | 3 | 4 | 38.1 | 19.4 |
| 5 | 0.06 | resident | 5 | 4 | 5 | 81.9 | 70.7 |
| 6 | 0.2 | resident | 6 | 5 | 6 | 18.7 | 61.8 |
| 7 | 0.2 | resident | 7 | 6 | 7 | 71.1 | 23.5 |
| 8 | 0.06 | resident | 8 | 7 | 8 | 103 | 74.1 |
| 9 | 0.6 | resident | 9 | 8 | 9 | 104 | 74.1 |
| 10 | 0.45 | resident | 10 | 9 | 10 | 19.6 | 6.5 |
| 11 | 0.06 | resident | 11 | 10 | 11 | 37.4 | 12.4 |
| 12 | 0.06 | resident | 12 | 11 | 12 | 146 | 115 |
| 13 | 0.12 | resident | 13 | 12 | 13 | 54.1 | 71.3 |
| 14 | 0.06 | resident | 14 | 13 | 14 | 59.1 | 52.6 |
| 15 | 0.06 | resident | 15 | 14 | 15 | 74.6 | 54.5 |
| 16 | 0.06 | resident | 16 | 15 | 16 | 128 | 172 |
| 17 | 0.09 | commercial | 17 | 16 | 17 | 73.2 | 57.4 |
| 18 | 0.09 | commercial | 18 | 1 | 18 | 16.4 | 15.6 |
| 19 | 0.09 | commercial | 19 | 18 | 19 | 150 | 136 |
| 20 | 0.09 | commercial | 20 | 19 | 20 | 40.9 | 47.8 |
| 21 | 0.09 | commercial | 21 | 20 | 21 | 0.819 | - |
| 22 | 0.09 | commercial | 22 | 2 | 22 | 45.1 | 30.8 |
| 23 | 042 | commercial | 23 | 22 | 23 | 89.8 | 70.9 |
| 24 | 0.42 | commercial | 24 | 23 | 24 | 0.374 | - |
| 25 | 0.06 | resident | 25 | 5 | 25 | 20.3 | 10.3 |
| 26 | 0.06 | resident | 26 | 25 | 26 | 28.4 | 14.5 |
| 27 | 0.06 | resident | 27 | 26 | 27 | 10.5 | 93.3 |
| 28 | 0.12 | resident | 28 | 27 | 28 | 80.4 | 70.1 |
| 29 | 0.2 | resident | 29 | 28 | 29 | 50.8 | 25.9 |
| 30 | 0.15 | commercial | 30 | 29 | 30 | 97.4 | 96.3 |
| 31 | 0.21 | commercial | 31 | 30 | 31 | 31.1 | 36.2 |
| 32 | 0.6 | commercial | 32 | 31 | 32 | 0.381 | - |
Table 2.
DG cost.
| DG Type | Maintenance 10,000 Yuan/(MW·h) | Investment 10,000 Yuan/MW | Fuel 10,000 Yuan/(MW·h) | Subsidy 10,000 Yuan/(MW·h) |
|---|---|---|---|---|
| MT | 0.01 | 48 | 0.06 | 0 |
| PV | 0.02 | 100 | 0 | 0.036 |
| WG | 0.03 | 63 | 0 | 0.01 |
Table 3.
Planning schemes.
| DG Type | Consider Timing Characteristics | Disregarding Timing Characteristics |
|---|---|---|
| MT | 2(11), 6(15), 10(11), 14(4) | / |
| PV | 21(2), 24(3), 32(8) | 21(12), 24(14), 32(14) |
| WG | 22(5), 25(1) | 22(1), 25(7) |
2(11) means that 11 DGs are installed at node 2, and so on.
Table 4.
Costs of planning schemes.
| DG Type | Consider Timing Characteristics | Disregarding Timing Characteristics |
|---|---|---|
| Maintenance cost/10,000 yuan | 679.9 | 884.7 |
| Investment cost/10,000 yuan | 358.3 | 444.1 |
| Loss cost/10,000 yuan | 203.3 | 267 |
| Fuel cost/10,000 yuan | 1961 | 0 |
| Pollution compensation cost/10,000 yuan | 78.75 | 0 |
| Subsidy cost/10,000 yuan | −417.6 | −1322.8 |
| Total cost/10,000 yuan | 2863.7 | 273.1 |
Table 5.
Average cost of the three algorithms.
| Planning | GA-ACO | GA | ACO |
|---|---|---|---|
| Maintenance cost/10,000 yuan | 679.9 | 589.2 | 612.9 |
| Investment cost/10,000 yuan | 358.3 | 278.7 | 298.3 |
| Loss cost/10,000 yuan | 203.3 | 259.3 | 241.7 |
| Fuel cost/10,000 yuan | 1961 | 2231.6 | 2193.9 |
| Pollution compensation cost/10,000 yuan | 78.75 | 109.3 | 92.6 |
| Subsidy cost/10,000 yuan | −417.6 | −285.6 | −301.8 |
| Total cost/10,000 yuan | 2863.7 | 3182.5 | 3137.6 |
Table 6.
Planning schemes considering load growth.
| DG Type | Consider Timing Characteristics | Disregarding Timing Characteristics |
|---|---|---|
| MT | 2(12), 6(27), 10(11), 14(7) | / |
| PV | 21(8), 24(10), 32(15) | 21(13), 24(18), 32(20) |
| WG | 22(18), 25(8) | 22(5), 25(3) |
© 2019 by the authors. Licensee MDPI, Basel, Switzerland. This article is an open access article distributed under the terms and conditions of the Creative Commons Attribution (CC BY) license (http://creativecommons.org/licenses/by/4.0/).
Share and Cite
MDPI and ACS Style
Yin, D.; Mei, F.; Zheng, J. An AC/DC Distribution Network DG Planning Problem: A Genetic-Ant Colony Hybrid Algorithm Approach. Appl. Sci. 2019, 9, 1212. https://doi.org/10.3390/app9061212
AMA Style
Yin D, Mei F, Zheng J. An AC/DC Distribution Network DG Planning Problem: A Genetic-Ant Colony Hybrid Algorithm Approach. Applied Sciences. 2019; 9(6):1212. https://doi.org/10.3390/app9061212
Chicago/Turabian StyleYin, Deyang, Fei Mei, and Jianyong Zheng. 2019. "An AC/DC Distribution Network DG Planning Problem: A Genetic-Ant Colony Hybrid Algorithm Approach" Applied Sciences 9, no. 6: 1212. https://doi.org/10.3390/app9061212
Note that from the first issue of 2016, this journal uses article numbers instead of page numbers. See further details here.