A Novel Approach for the Definition of an Integrated Visual Quality Index for Residential Buildings


Department of Civil Environmental and Mechanical Engineering, University of Trento, 38123 Trento, Italy
*
Author to whom correspondence should be addressed.
Appl. Sci. 2019, 9(8), 1579; https://doi.org/10.3390/app9081579
Submission received: 20 March 2019
/
Revised: 10 April 2019
/
Accepted: 12 April 2019
/
Published: 16 April 2019
(This article belongs to the Special Issue Zero-Energy Buildings)
Abstract
:Visual quality is an important component of indoor environment quality and greatly affects inhabitants’ perception of the living space. Nevertheless, the lighting design of residential buildings is usually underestimated by both designers and standards. This paper presents an integrated index for evaluating the visual quality of an indoor environment in residential buildings. The main parameters considered are daylight access, probability of glare from daylight and electric illumination, maintained illuminance, and color temperature. These aspects are evaluated throughout a whole year using a fixed set of metrics and are combined using relative weights. It was decided to also consider qualitative parameters in order to give more importance to some psychological aspects of visual comfort. Finally, the building visual quality index is obtained by a weighted average of the results of each room with the addition of the qualitative parameters. The applicability of the index was tested through the simulation of a dwelling that will be built and monitored in the context of the Comfort for Sustainable Buildings in the Alps (CASA) research project. The building visual quality index proved to be useful during the design process, allowing for improvements in both electric illumination and daylight access through a comparison of different solutions. This study could represent a step towards the holistic evaluation of indoor environment quality.
1. Introduction
Indoor human comfort is usually defined as the subjective satisfaction with the environment [1,2] related to functional, physical, and psychological aspects [3]. It is influenced by a great number of stimuli at once creating a complex net of relationships between mind, environment, and perception. The task of understanding how a given stimulus contributes to improving or impairing the state of mind of a person is very challenging [4] and it may even not be worth doing [5]. In an attempt to clarify the relationship between the built environment and human satisfaction, several interesting approaches have been developed (environmental determinism, social constructivism, and user-centered theories [6]), expanding the research to fields like medicine and psychology. On the other hand, focusing on the features of the building that favor health and comfort of the occupants, it is possible to closely correlate human comfort to indoor environmental quality (IEQ) [7].
IEQ is a general indicator of the quality of conditions inside a building and in the literature it has been interpreted in different ways. It is commonly defined by four basic factors: indoor climate, visual (or lighting) quality, indoor air quality, and acoustical quality [8]. It is certainly possible to account for more factors (like electromagnetic fields, vibration, greens, and water [9]) and some authors argue that it should be necessary to consider also parameters linked to personal, cultural, and interior design preferences (like view out, control, privacy, layout, and aesthetics [10]). In any case, the great majority of studies in this field accept structuring IEQ analysis using the four aforementioned aspects, which are evaluated as the most important and strictly related to human response to environment exposure. Many attempts to combine these factors and obtain an overall IEQ index have been made in past years [7,11,12,13,14,15,16,17], but currently no consensus has been found on how to weigh the different factors.
The study presented in this paper is part of a wider and upcoming research project on the definition of an integrated IEQ index for residential buildings. In particular, it is focused on visual quality (VQ) and presents an index with which to quantify it throughout a whole year. Five main aspects are considered: daylighting, electric illumination distribution, glare probability from daylight, glare probability from electric illumination, and color temperature. Additional parameters have been added for more personal evaluation like view out, shading device availability, and flexibility and control. Utilizing the method proposed by Marino et al. [18], this new visual quality index (VQI) can synthetize the trend of different metrics and aims to become a tool for designers and constructors who want to quantify the visual quality of a residential building by comparing different design solutions. The index takes advantage of the potential of new building simulation software which allows the simulation of a large number of parameters with good accuracy, but it is also possible to use it for post-occupancy evaluation. Hopefully, this kind of study could contribute to providing better, more comfortable and, above all, healthier buildings.
In particular, the research hereafter presented was developed in the context of the Comfort for Sustainable Buildings in the Alps (CASA) project, consisting of the design, construction, and monitoring of four residential buildings with the same shape and orientation but with different construction technology and installations. The aim of the project is to define a predictive IEQ index, to calibrate, and to verify it in different phases of the process: project (simulation), construction (environmental monitoring), and use (post-occupancy evaluation). Regarding the VQI, a simulation of a house of the CASA project was run using different applications to calibrate the index and to evaluate its performance in a real case study.
2. State of the Art
In the last few decades several studies have been conducted on different building types with the aim of maximizing visual comfort. Yener [19] defines a method for designing fixed shading devices, taking into consideration illuminance, luminance, and color, with the preference of daylight over electric light. Frascarolo et al. [20] propose an innovative lighting design for residential use that focuses on flexibility and seeks to reach visual comfort in terms of luminance balance of the vision field and visual task performance. Konis [21], in his work about external shading devices in an office building in California, focuses the attention on avoiding glare. Xue et al. [22] study luminous comfort as the result of the interaction between daylight and human behavior in residential buildings. Ochoa et al. [23] try to define combined optimization criteria on window sizing procedures for balancing energy consumption and visual comfort, considering mainly glare and illuminance uniformity. In the literature there are some results that are commonly accepted, such as the positive effect of daylighting [24] or view out [25], but a shared definition of visual comfort has not yet been agreed upon [26].
Visual quality is defined as the characteristic of an environment that favors visual comfort. According to the IESNA lighting handbook [27] it is obtained through a design that balances human needs, architecture, and economic/environmental issues. Visual quality is one of the basic factors that influences the perception of the environment and the state of mind of the occupants [8]. This assertion may find supporting proof in an analysis of the studies conducted in the last decade on overall comfort that correlate objective parameters of the environment with user satisfaction acquired through questionnaires [7,11,12,13,14,15,16,17]. All of these studies consider visual quality among the aspects that affect IEQ and the relative weight given to this aspect varies from 0.19 (school) [11] to 0.29 (commercial) [15]. According to these references it is possible to claim that visual quality has a non-negligible influence on overall perception of the environment in a proportion that depends on the use of the environment. For residential buildings the task of fixing a weight is even more controversial, because the choice of illuminance is task-related and depends also on external parameters like energy cost and personal preferences. According to a study by Lai et al. [7] on 32 typical apartments in Hong Kong, for instance, visual quality has a weight of 0.21, significantly less than that for thermal and acoustic environments but much higher than that for indoor air quality.
Monitoring visual quality is a challenging issue and it is often necessary to find a trade-off between accuracy and feasibility. The minimum parameter that is taken into account is illuminance, but Heinzerling et al. [15] highlight the necessity of a uniformity of temporal and spatial resolution of measurements in order to permit a correct comparison between different environments. Glare could also be considered but the measurement is absolutely non-trivial [28,29] and it depends not only on the position but also on the orientation of the viewer. More detailed measurements comprehend daylight access and view out; an interesting approach is suggested by Hellinga et al. [30]. An example of monitoring that tries to deepen the knowledge of the visual environment is given by Chiang and Lai [9], who consider four parameters: average illuminance, average illuminance at the operated face, uniformity ratio of illuminance at the targeted face, and ratio of daylight. This is an interesting step towards a more exhaustive measurement of visual quality.
Does current design practice tend towards visual quality? Regulations traditionally focus on electric lighting defining minimum levels of given metrics [31,32]. It could be claimed that the standards are more interested in visibility rather than visual comfort and residential buildings remain largely unregulated in this field. There is hope that the new European standard EN 17037 on daylighting could represent a shift in this trend, and in the meantime the lack is partially covered by quality certifications that give interesting suggestions for enhancing visual quality. The LEED v4 protocol [33], for instance, favors daylight access and view out. The WEEL building standard [34] is even more specific in this field and takes into consideration many visual quality related characteristics like color quality, circadian lighting design, and dimming controls. In any case, current lighting design still favors the rule of thumb or at least uses very simple methods based on static parameters like daylight factor [35].
A relatively new tool for designers is a building simulation that was created to enhance energy efficiency but nowadays can be used for predicting a large number of parameters related to human comfort. In particular, the simulation of day lit spaces has evolved both in terms of the method and in the calculation of procedures [36]. It has abandoned static evaluations towards dynamic climate-based systems by refining the predictions in terms of illuminance [26,37], glare [38,39], and building-user interaction [40]. For future development there is a need for uniformity of the accuracy of the inputs and of the choice of the metrics. Atzeri et al. [37] address this topic and suggest a set of metrics considering either constancy or spatial uniformity of different comfort aspects. Given these improvements Loonen et al. [41] foresee the possibility of linking the field of building performance simulation with IEQ research. In this trend, IEQ models could be used not only for comparison between different environments but also for predicting user satisfaction and for evaluating the sustainability of a project. The latter is often calculated using key performance indicators (KPIs), which are drivers for the assessment of buildings under different categories, including the environmental field [42]. An interesting approach to the assessment of sustainability of a residential building is proposed by Zavrl et al. [43], who insert indicators of indoor comfort among the environmental KPIs, highlighting the demand for a rational and robust method for IEQ evaluation.
In this complex picture, an integrated VQI for residential buildings is missing. In fact, illuminance level is still largely used but it is not a good approximation of visual quality. Residential buildings are largely neglected. Moreover, simulation is an instrument than should be better linked to IEQ models. On this basis, in this paper a broader and robust definition of visual quality for residential buildings is proposed which may be objectively measured through an integrated index useful in the design phase as well as in the building evaluation through on-site monitoring.
3. Methods
In the following section the index proposal is explained in detail. The quantitative and qualitative parameters, metrics, thresholds, the structure of the model, and, finally, the simulation requirements are described.
3.1. Quantitative Parameters
Several parameters are responsible for the perception of visual comfort. The first step for the definition of the VQI therefore involves the proper choice of the parameters being taken into account. The building function strongly influences the process: in dwellings, it is important to create a pleasant and relaxing environment, while productivity may be of secondary importance. Another crucial issue is the flexibility of the lighting environment: the same space may be used for very different tasks and every inhabitant should be able to adapt the space to his/her needs or preferences.
The IESNA lighting handbook [27] detects a number of design issues that are determinant for the design of indoor environments. They regard for instance daylighting, the type and position of the artificial sources of light, and the surface characteristics; according to the use of the building, they more or less affect comfort. As an example, for residence—an ordinary task—the “very important issues” are illuminance, source/task/eye geometry, direct and reflected glare, and color appearance. According to Xue et al. [22], whose study regards visual quality in residential buildings in Hong Kong, satisfaction with daylighting is the most important factor in determining the level of luminous comfort, and in particular there is a direct correlation between solar access and user satisfaction. Among other parameters, the most important are the perception of uniformity and the avoidance of glare. In residential environments people may be more tolerant of glare than in office settings, where glare may impede the task performance. Finally, color temperature is gaining interest in literature and its influence on mood, cognitive performance, and satisfaction has been deeply investigated in the last years [44]. In particular, it is interesting to consider how color temperature influences melatonin production and therefore human alertness and response [45]. It is important to recall that all visual stimuli affect human comfort following three different routes: the visual system, the circadian timing system, and mood and motivation [46]. Therefore, every parameter involves a physiological response from the viewer but affects also his/her psychology in a relation that has not been completely explained yet. An interesting study in this field was conducted by Chamilothori et al. [47] who tried to measure the two components independently using both questionnaires for user satisfaction and a wearable biometric device for physiological responses (heart rate and skin conductance). Research of this kind is beyond the scope of this paper and the effect of each parameter on visual comfort will be considered in its entirety.
Based on the bibliographic research previously presented and on the opinion of a panel of experts interviewed within the CASA project, the aspects of visual quality which were taken into account for the proposed index are the following:
- Daylight access;
- Glare probability from daylighting;
- Illuminance level from electric lighting;
- Glare probability from electric lighting;
- Color appearance of electric lighting.
During the design phase, these aspects help to properly tackle the design of orientation, shape, and position of windows (a–b), the lighting system (c–d), shading devices (b) and lighting bodies (d–e). Uniformity of illuminance was not considered because it is not an absolute value when task performance is not predominant [48]. In residential buildings, inhabitants tend to appreciate different patterns of light and shadows.
3.2. Metrics
Each physical dimension can be measured with different metrics. They usually present both advantages and disadvantages and may be used in different situations [49]. Concerning visual comfort, there is still no consensus on the metrics to consider, and, moreover, there is the challenge to synthetize in a single value the conditions that change in relation to space and time [38]. Here, a trade-off between precision and possibility to measure/simulate is necessary. The metrics chosen for the proposed VQI are:
| • sDA—spatial daylight autonomy [50] | (for daylight access) |
| • sDGP—simplified daylight glare probability [51] | (for glare probability from daylighting) |
| • Em—maintained illuminance | (for illuminance level from electric lighting) |
| • UGR—unified glare ratio | (for glare probability from electric lighting) |
| • CCT—correlated color temperature | (for color appearance of electric lighting) |
Daylight factor (DF) is the most used metric for the assessment of daylight access. It is very easy to calculate but it has several limitations: it is a static metric that does not depend on weather conditions, the period of the year, or even the orientation of the window [49]. To overcome these limitations, daylight autonomy was introduced by the Association Suisse des Electriciens in 1989: it represents the percentage of the occupied hours of the year when a minimum illuminance threshold is met solely by daylight. sDA is a further step and allows the use of a single value to give information about the daylight illuminance of the entire room [52]: it is the ratio of space that receives a daylight illuminance greater or equal to 300 lux for at least 50% of the occupied hours. The main criticism of this metric is that it doesn’t have an upper limit, leaving the possibility of an excess of light that could cause glare. In our case the risk was overcome, since we also considered glare probability with a separate parameter. In the LEED v4 protocol [33], sDA is paired with the measurement of annual sun exposure (ASE), which has to be inferior to 10%. This limitation is highly restrictive and is adequate for spaces with delicate visual tasks [53] which have been generally used for office buildings.
According to some authors, daylight glare probability (DGP) is the most appropriate metric to with which to analyze absolute glare issues [54], but it has the limitation that the computation is very demanding. sDGP is a simplified version of daylight glare probability proposed by Wienold et al. in 2007 [51]. The simplification consists of neglecting the influence of peak glare sources, and significantly reduces the computational effort [49]. The discomfort glare index (DGI) is considered less precise [55] while the measurement of glare through HDR (high dynamic range) images [29,56] is too complicated for extensive monitoring.
For electric lighting it was decided upon to select the metrics that are more widely used in professional practice and which are also regulated in the standard UNI EN 12464 of illumination for workplaces [31]. Maintained illuminance (Em) describes the illuminance on a given surface considering the natural decay of performance of the illumination devices. The unified glare ratio (UGR) was introduced by CIE (Commission Internationale de l’Éclairage) in 1995 for determining the glare of light sources. It has several limitations [49], but it is widely used, and is considered suitable to assess glare due to artificial light sources of medium size. Correlated color temperature (CCT) measures the apparent color of the light emitted.
3.3. Thresholds
Each metric is organized in four classes defined as follows:
- Class I: the parameter’s value is optimal for enhancing VQ;
- Class II: the parameter’s value favors a good level of VQ;
- Class III: the parameter’s value permits a sufficient level of VQ;
- Class IV: the parameter’s value is not suitable for residential use.
Some metrics come with a defined set of threshold values, while for others values from standards or protocols have been considered. For few of them, a proposal has been done based on simulation, literature, and experts’ consultation. For upper levels of sDA, LEED v4 [33] suggests the thresholds of 55% and 75%. The value of the limit between Classes III and IV was fixed by simulating a room with a window facing north with a glazed surface of 1/8 of the floor area in different conditions of weather and geometry. The thresholds for sDGP are defined with the index. According to UNI 12464-1, UGR ranges between 10 (imperceptible) to 34 (intolerable), where the value of 19 is typically considered the frontier between comfort and discomfort [49]. Values suggested by Cai and Chung [57] have been used in relation to user perception: unacceptable (Class IV), just acceptable (Class III), perceptible (Class II), and just perceptible (Class I). For values of maintained illuminance, the references have been UNI EN 12464 and UNI 10380, a repealed Italian standard which used to also take into account residential environments. The ranges were also adjusted on the basis of experience in accordance with common lighting design. It was decided to include in Class IV both poorly illuminated and over illuminated environments. The ranges of CCT were particularly difficult to define because in this field satisfaction depends on aesthetics preferences, culture, and even the time of day. It was decided that wide ranges should be kept with the only aim being to avoid lights that appear too reddish or bluish. In Table 1 and Table 2 the thresholds for each parameter used in the definition of the index are listed.
3.4. Qualitative Parameters
Light affects visual comfort in many ways that are not objectively measurable, and which act directly on the mood and motivation of inhabitants. This influence cannot be neglected, especially in a residential environment, so it was decided to be included in the index with some simple yes/no checks. In the following paragraphs the checks required for the definition of the qualitative score (QS) are listed.
3.4.1. View Out
It is widely accepted that a window view elicits a positive effect on the user of an indoor environment. The first research in this field was from Ulrich [58], who examined patients in a suburban Pennsylvania hospital between 1972 and 1981 to determine whether assignment to a room with a window view of a natural setting might have restorative influences. Moreover, Chang and Chen [25] have demonstrated that a view out in a workplace leads to less nervous and anxious workers. Hellinga and Hordijk [30] add that three characteristics of outside views are generally appreciated: natural views, distant views, and views containing water. Similar considerations also apply to residential spaces where the effect of view out on human comfort is often neglected or at most is accounted for in a quantitative way [30]. With reference to the new European standard EN 17037 and to the LEED v4 protocol [33], the VQI includes the following checks:
- View out: at least 75% of the floor of the rooms has a direct line of sight to the outdoors;
- Qualitative view out: window views includes at least two of the following elements: flora, fauna, sky, movement, and objects at least 7.5 m from the glazing.
3.4.2. Shading Devices
Shading devices are crucial for the control of illuminance and glare from daylight, but they play an important role also in the definition of the view out and view in (privacy is an important issue in residential buildings). According to typology, it is possible to act on one single aspect as well as more simultaneously: a trade-off between them is often necessary. Checks are defined as follows:
- Daylight shading: it is possible to darken the room;
- View shading: it is possible to control the view out/in without precluding daylighting;
- Glare shading: it is possible to stop glare without precluding daylighting and the view.
Each type of shading device (or their combination) will guarantee a different answer to the checks. For instance, a rollup has an effect only on daylight, while external venetian blinds allow the user to darken the room but also to control glare. Window views are typically managed with an internal light curtain that doesn’t preclude daylighting.
3.4.3. Flexibility and Control
The possibility of controlling the illuminance in specific places or to dimmer the environmental lights according to personal preferences or mood is very much appreciated in every indoor environment. Regarding workplaces, previous research demonstrates that personally controlled illumination provides several advantages compared to a fixed light, including more positive office appraisal and satisfaction, improved mood and motivation, and higher self-assessed productivity [59]. In residential spaces, these benefits are still under investigation, because of the variability of schedules and user behaviors. However, since comfort is linked to the environmental conditions but also to the possibility the user has to control them [4], VQI includes the following checks:
- Specific lights: there are specific lights for most common tasks (bed, desk, mirror);
- Dimmable lights: the main lights of the rooms are dimmable;
- Scenarios: there is the possibility of setting light scenarios.
3.5. Structure of the Index
The visual quality index is composed of two parts, defined as quantitative and qualitative. The quantitative part is given by the value of five metrics (sDA, sDGP, UGR, Em, and CCT) calculated in relation to a reference year. Each metric is assigned a relative weight (ω) that represents the importance of the measured aspect in relation to the overall visual comfort of the inhabitants. The weights are shown in Table 3 and were proposed on the basis of the following considerations: daylight and electric lights were given the same importance; in each field, more importance was given to illuminance rather than to glare; and finally, color temperature was considered less important than the other parameters. This is consistent with the study of Xue et al. [22], who state that solar access is the most important parameter, and that artificial lighting hours have a significant influence on visual comfort and inhabitants may be more tolerant to glare in residential spaces rather than in offices.
In order to summarize in a single value the trend of each metric throughout the year, a method was exploited that is widely used also in other field of IEQ assessment consisting of the definition of a performance index (PI) which represents the percentage of values of a given metric during occupied hours that falls within an acceptability range [60]. Following the method proposed by Marino et al. [18], a time fraction matrix is calculated for every room of the building with the PI of every metric in each class. This matrix is multiplied by the relative weight vector to obtain the time fraction weighted mean vector:
This vector allows for the calculation of the VQI of the room using the following equation:
The building visual quality index (BVQI) is the result of a weighted average of the VQIs of all the rooms of the building (with the exclusion of corridors and non-heated zones) with the addition of the qualitative score. The weight of each room (W) is given by the formula
where Aroom is the net floor area of the room and Abuilding is the net floor area of the whole building. According to this definition, the sum of the weights of all the rooms equals one. This weighting model is based on the consideration that the size of the room is directly correlated with its importance. For the sake of completeness, other types of weighting were tested, for instance those considering the estimated hours of utilization of each room, but the results were comparable, and the proposed approach seemed the most direct and easy to apply. The qualitative score (QS) consists of a 0–8 points score, calculated only once for the whole building and added to the quantitative part. This score was assigned considering the eight checks relative to view out, shading devices, and flexibility and control. Each check was evaluated room by room and was gained when the assertion was true for more than 50% of the floor area of the building.
BVQI is a score that may vary virtually from 0 to more than 100 considering the qualitative parameters. It was subdivided into classes, as shown in Table 4. The first two classes (Excellent and Good), which can really distinguish attention in the design of indoor spaces quality, were assigned the first 25 points considering findings from the paper of Marino et al. [18], while it was considered unnecessary to have many low categories where the visual quality is so poor that a finest distinction is useless. Therefore, the remaining 75 points were equally assigned to two classes (Sufficient and Bad). Considering the fact that the QS may lead to a score higher than 100, it was decided to insert also the category excellent*, to reward the attention of the designer paid to the qualitative parameters.
3.6. Simulation Specifics
In the residential sector, simulation is very limited and matches exclusively light engineering projects of a certain relevance. In this sense, optimizing the design of a dwelling represents a challenge that current simulation tools can make simpler and less uncertain. Loonen et al. [41] provide an accurate overview of the main building performance simulation software currently on the market, divided according to their ability to predict the four primary aspects of IEQ. The number of applications able to provide integrated comfort analysis is rather restricted and each of them tends to be limited to one or at most two lines of analysis. In order to achieve the definition of the VQI, it is possible to use any application as long as it is able to simulate the trend of the selected parameters throughout the year.
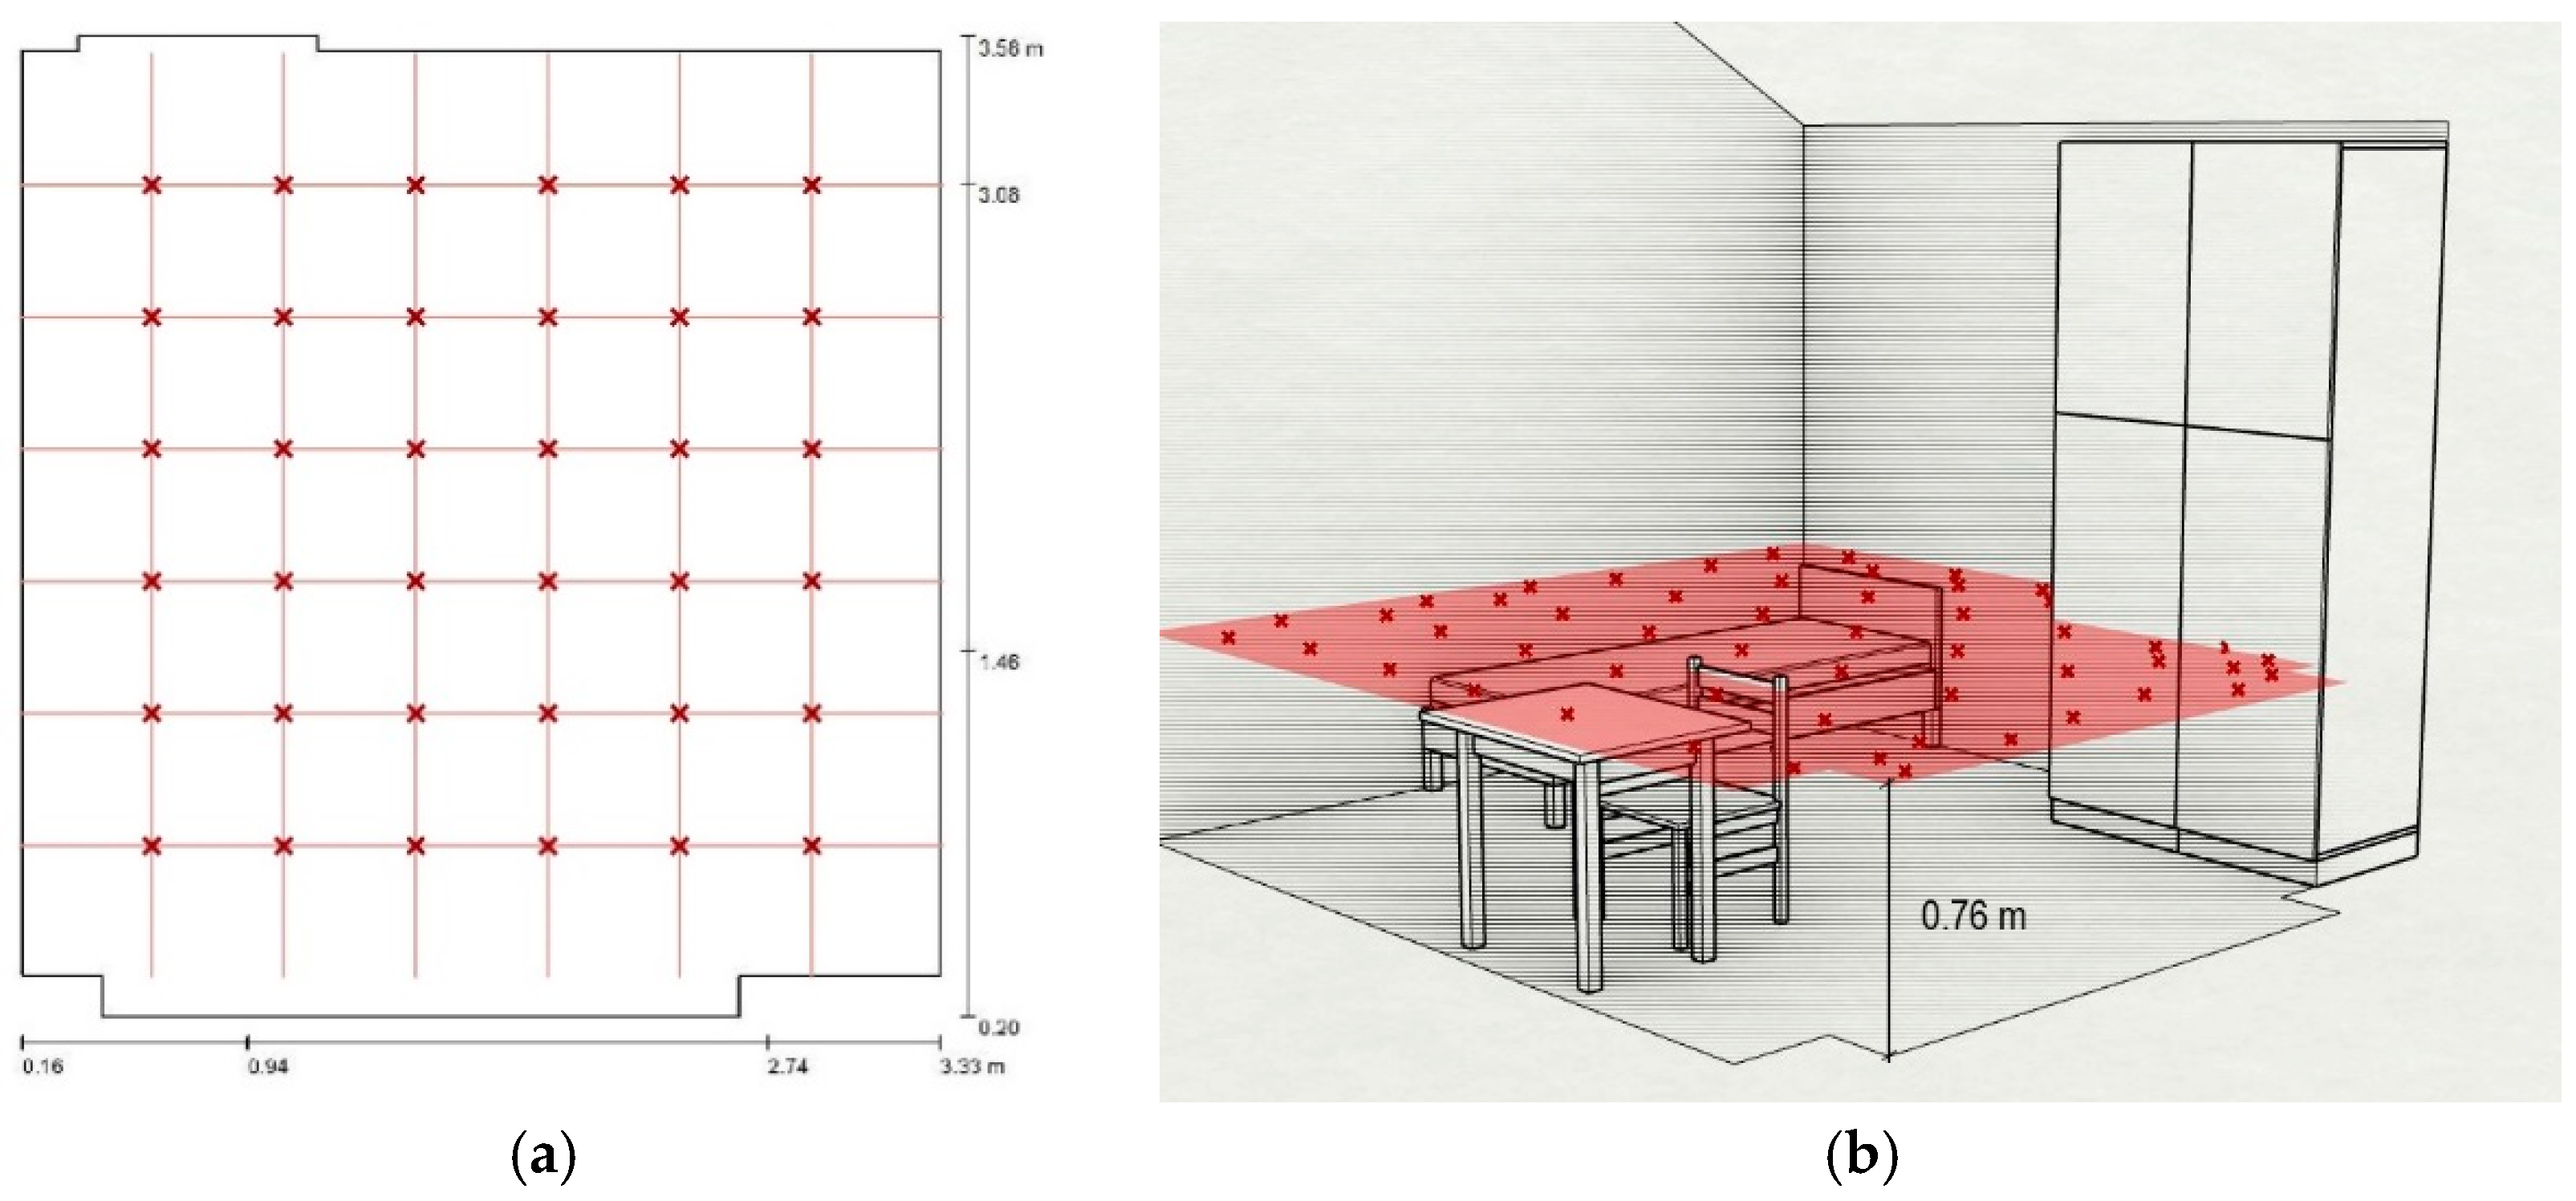
All the materials of the room (including glazing) need to be simulated as similarly as possible to their real counterparts. The external shadings like mountains, trees, and eaves are modelled while mobile shading systems are neglected because they are considered to be fully open. sDA and Em are calculated on the test surface recommended by LEED v4: a square grid with size 0.5 m laying at 0.76 m above the finishing ground. sDGP and UGR are metrics whose value depends on the position and also orientation of the viewer. Consequently, we decided to evaluate them using a few given points where the inhabitants are led to spend an important span of time, namely:
- in the living room: every sofa seat (1.15 m) and every table seat (1.15 m);
- in the kitchen: counter (1.55 m), sink (1.55 m), and every table seat (1.15 m);
- in the bedrooms: every bed (seated position—1.15 m) and desk (1.15 m);
- in the bathrooms: sink (1.55 m).
For all the points, the test vector was considered horizontal and perpendicular to the face of the simulated mannequin.
4. Case Study
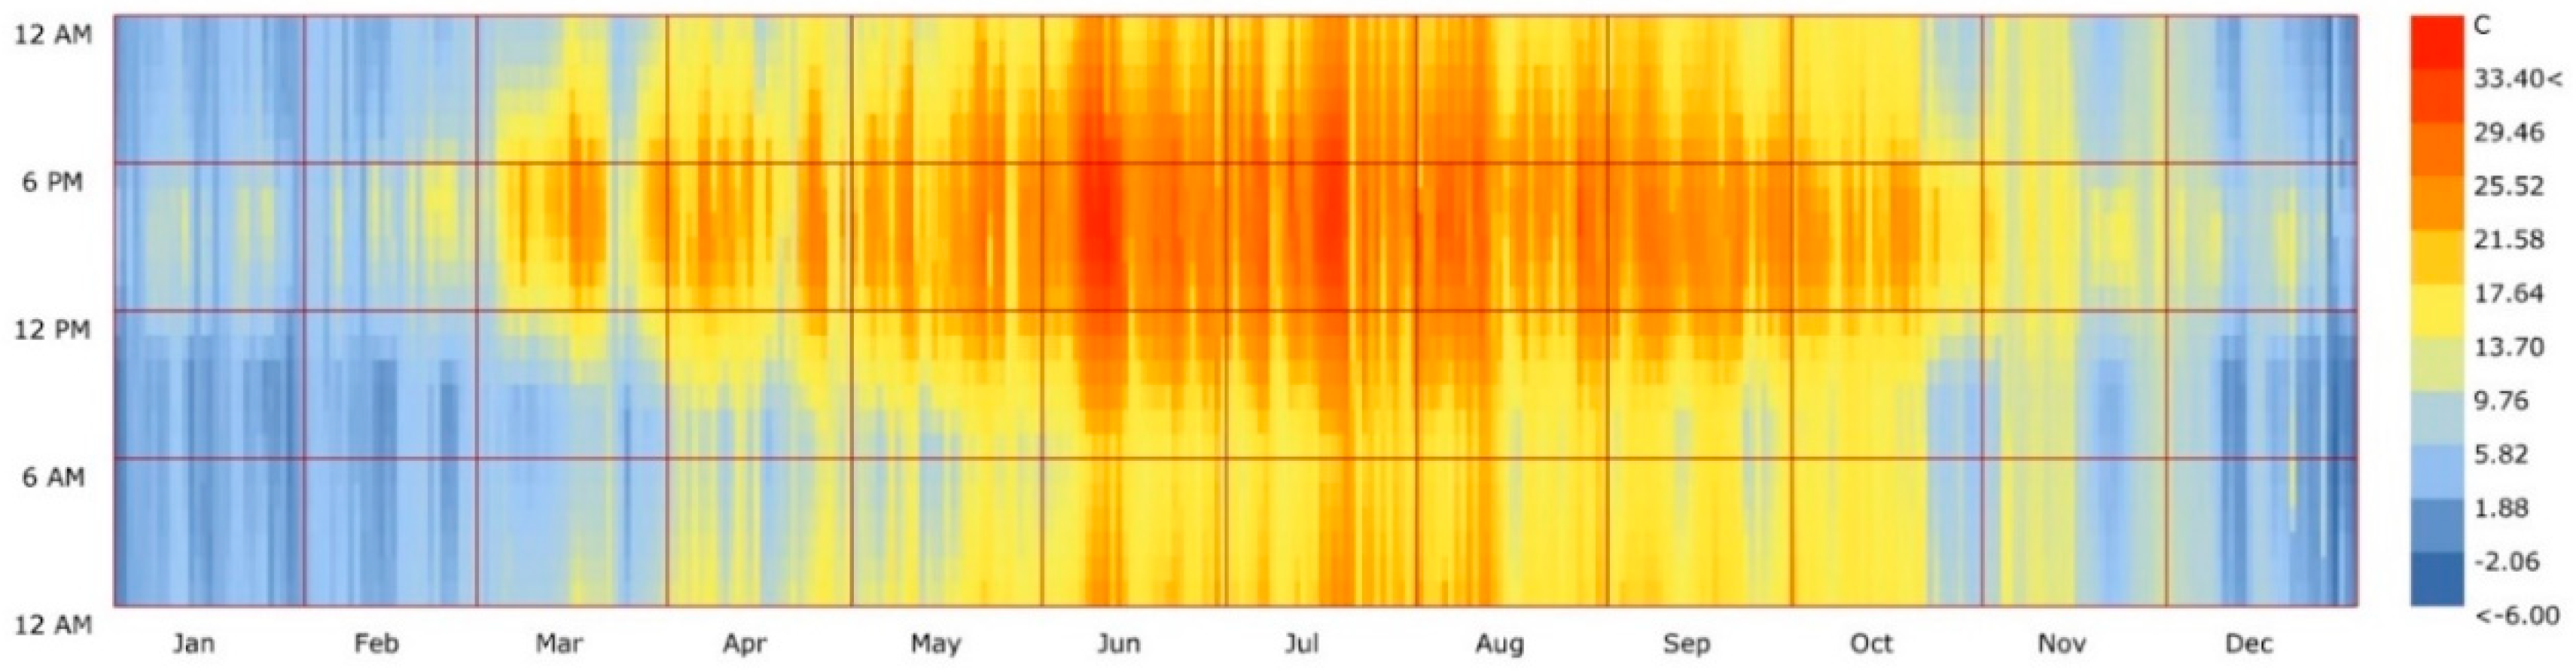
The case study was located in Segno, 30 km from Trento, in the north-east of Italy (46°18′20.81′’N–11°04′28.78′’E). The location is situated in the climatic zone F (3.647 degree-days). The average summer temperature is nearly 19 °C with a minimum of 7 °C and maximum 33 °C, and the average winter temperature is 5 °C with a minimum of –6 °C and maximum 24 °C. In Figure 1, the trend of the dry bulb temperature in Segno throughout the reference year is depicted.
The weather data file used in this study was taken from the database of the Mach foundation [61] and covered a history of more than ten years. The building was a two-story single-family house, located near five other functionally similar houses (see Figure 2).
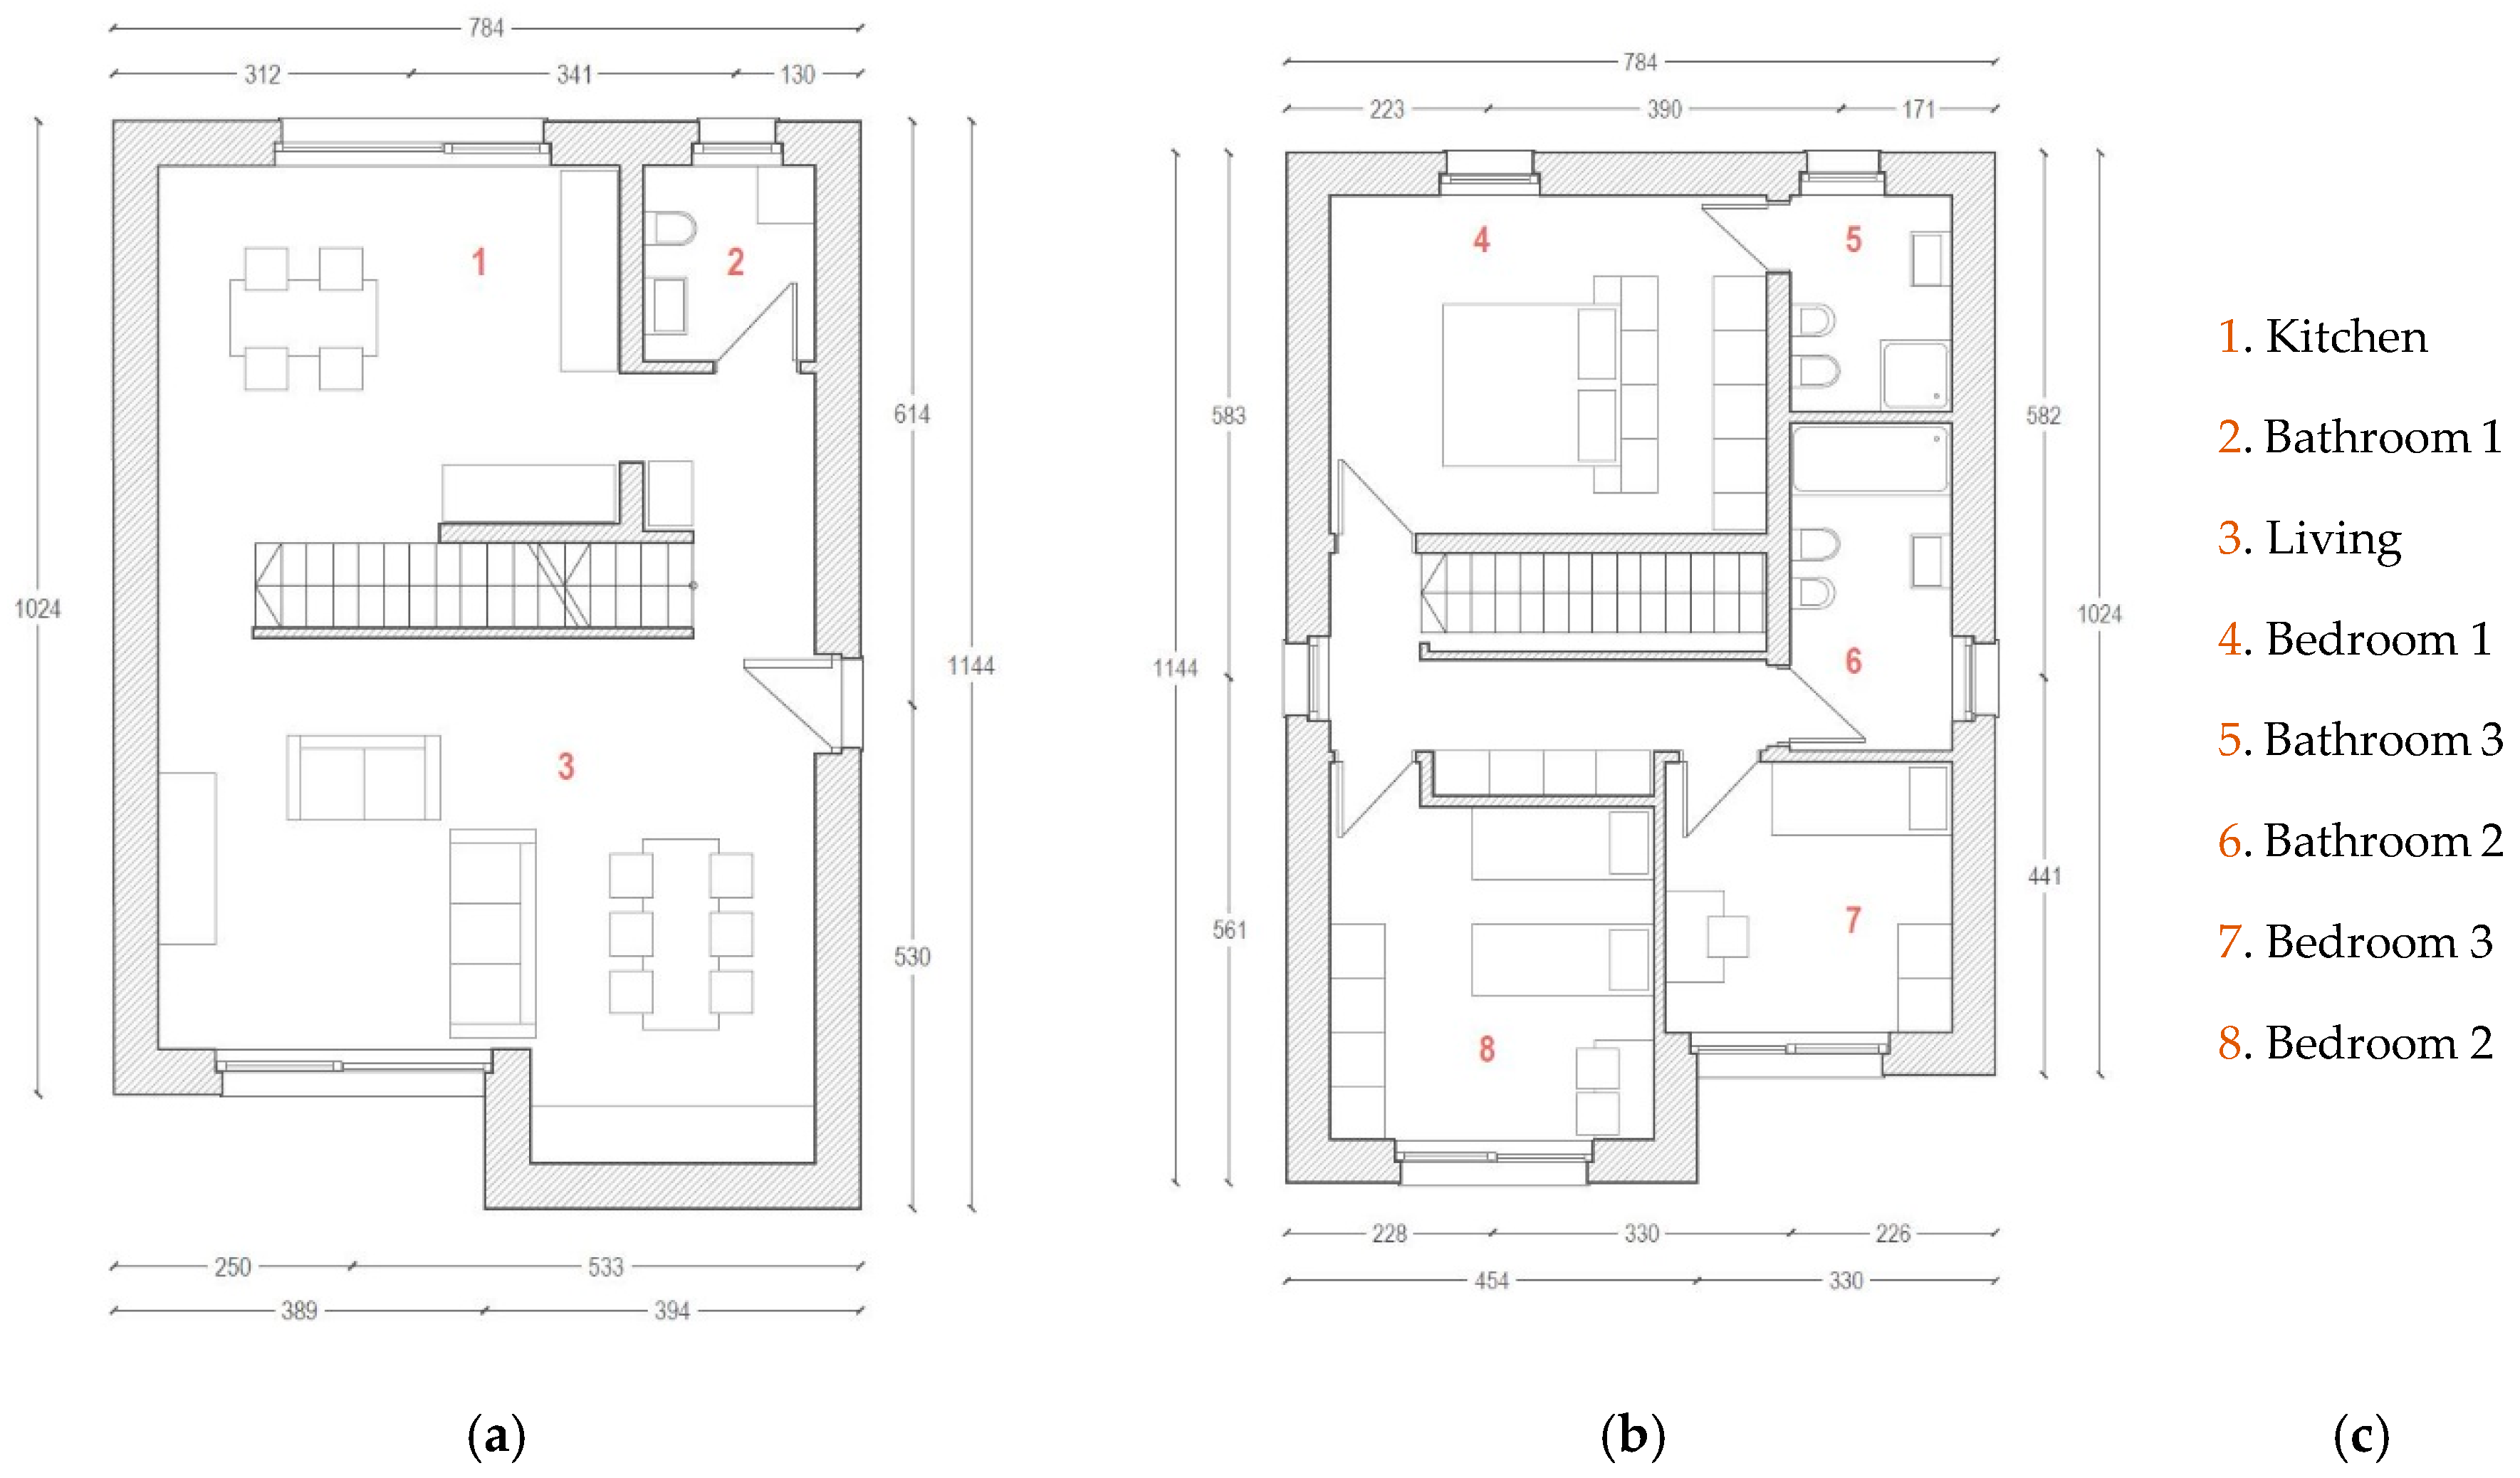
As shown in Figure 3, the apartment consists of a living room, kitchen, and bathroom on the ground floor, and three bedrooms, two bathrooms, and a service corridor on the upper floor. Except for this last space, the simulation regarded all the rooms mentioned above.
Case Study Simulation
For the simulation of the case study, the choice fell on Grasshopper for Rhinoceros which, with appropriate plug-ins, becomes a valid and accurate support for a holistic approach to the project. Specifically, for daylight and natural light glare analysis, Ladybug and Honeybee plug-ins were used, which were connected to Radiance, Daysim, EnergyPlus, and OpenStudio [62]. The parametric simulation represents one of the most valid tools in the optimization process of building performance. This is true not only in the design phase: parametric modelling has drawn attention also as a potential solution with which to provide an intelligent searching method for efficient feedback [63]. For analysis related to electric lighting the software Dialux, which is also widely used in professional practice, was used. In Table 5, the software used for the simulation of each parameter are reported.
In order to make the simulated object as similar as possible to the real building, surface modelling methodology was implemented. Proper materials were assigned to each surface: opaque components, glazing surfaces, and furniture. Walls, floors, ceilings, and windows are described in Table 6, glazing characteristics are available in Table 7, and calculation parameters used both for sDA and sDGP evaluation are shown in Table 8. These last values are responsible for the precision of the model and each of them more or less affects the results of the simulation. The values were fixed in order to guarantee good precision without increasing the computational effort too much. Table 8 is not intended to be a requisite for the use of the BVQI but it is provided to give a complete understanding of the simulation of the case study. The values depend on the awaited precision and also on the software used.
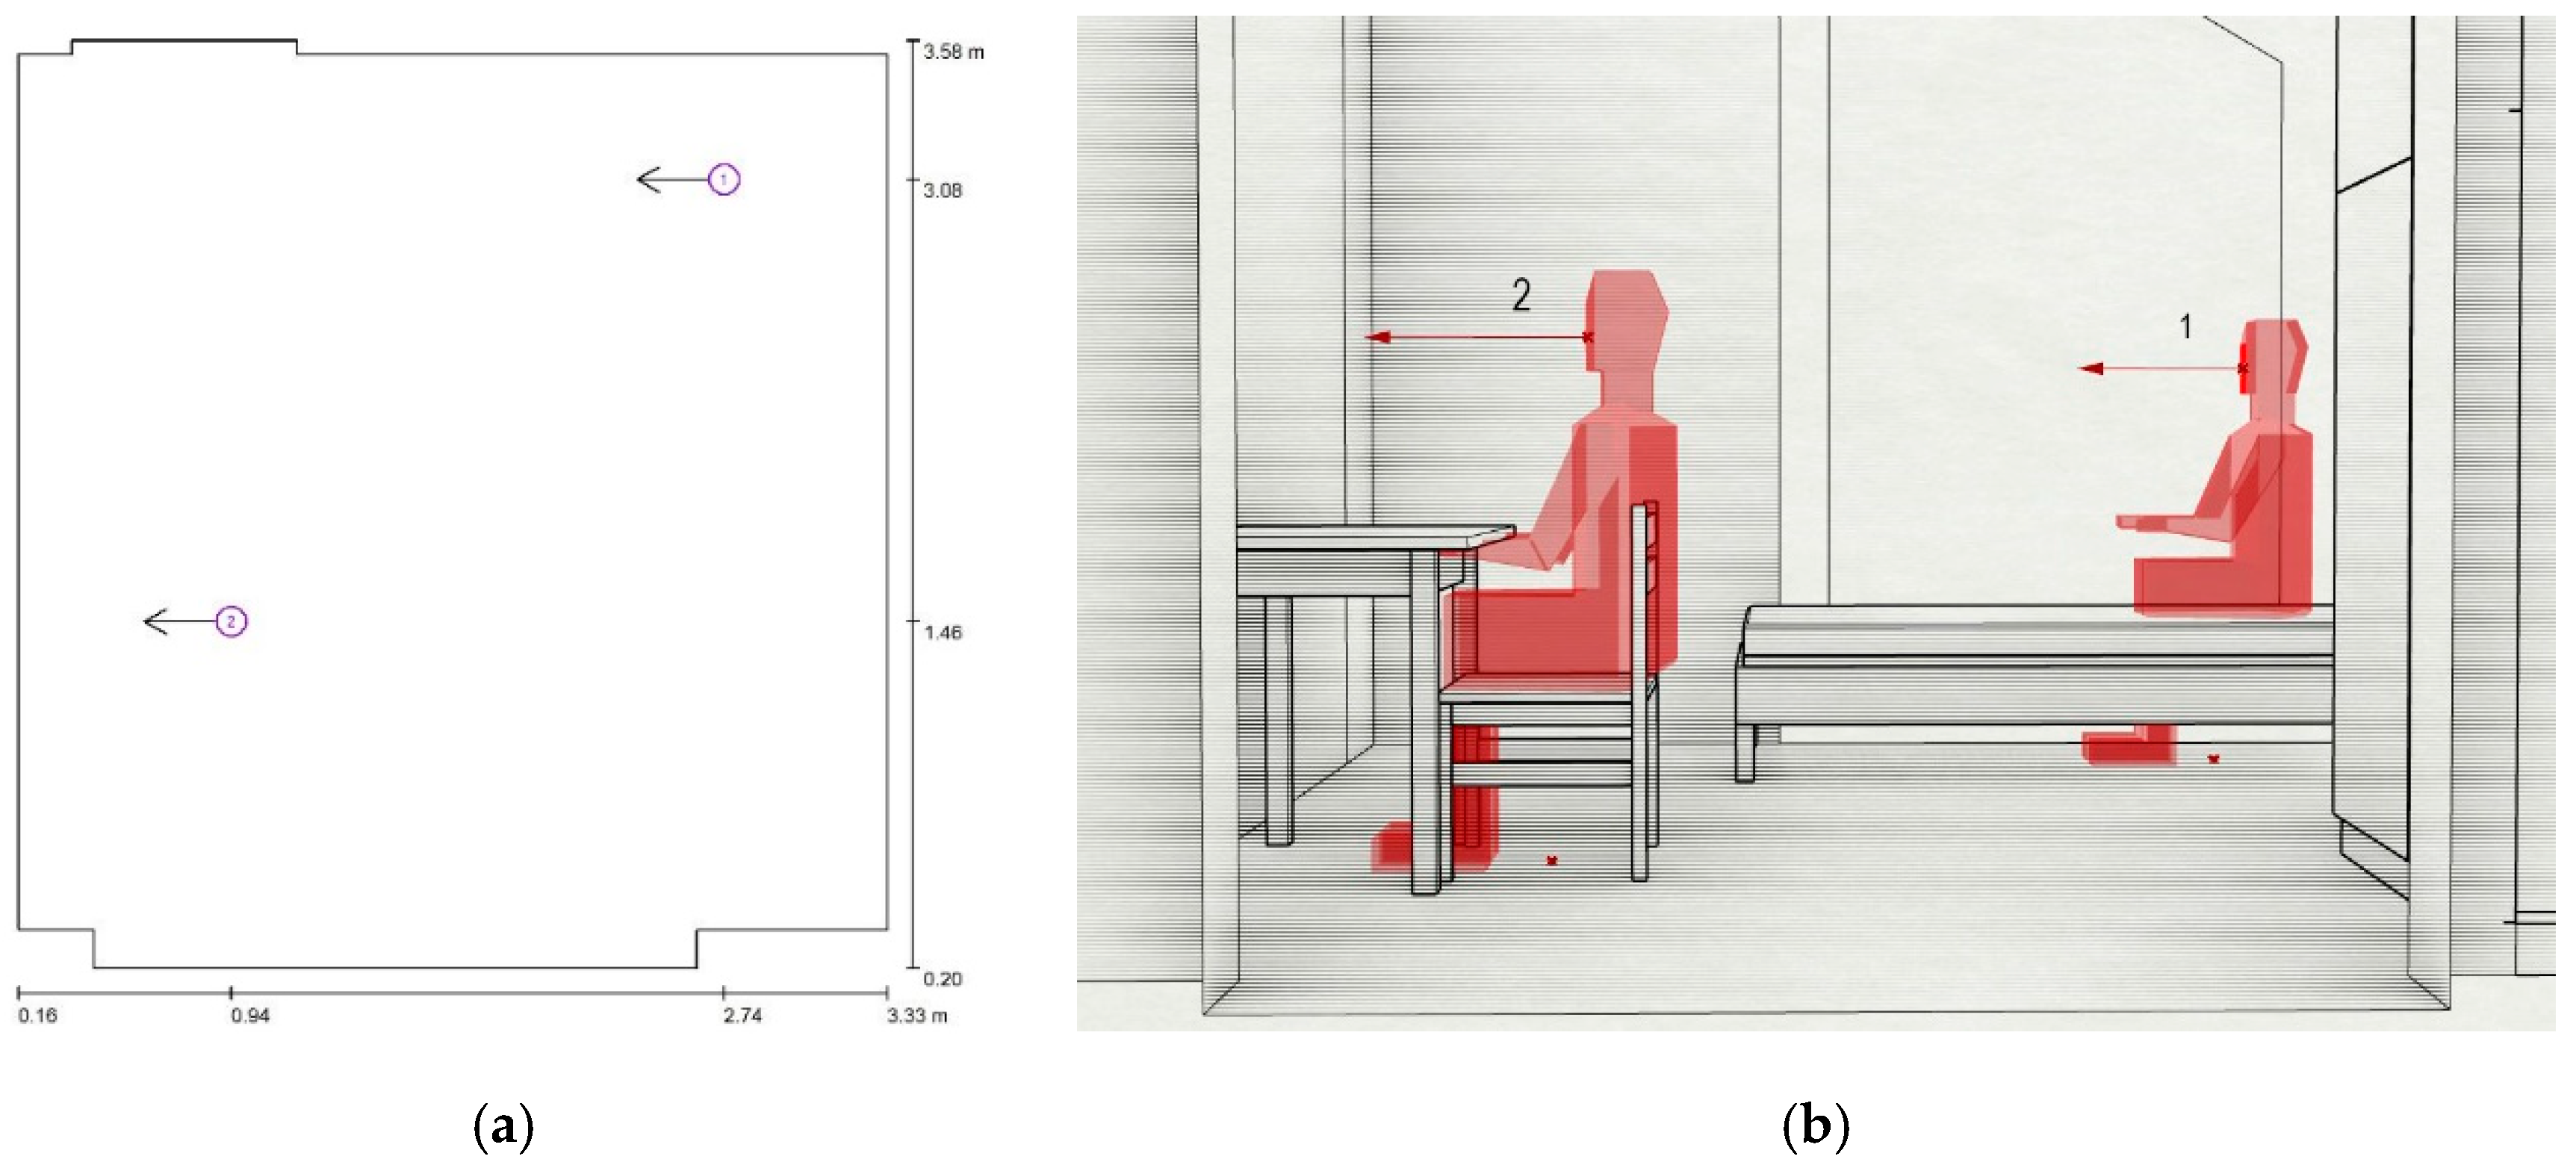
Context was modelled paying attention to the shadow created by both the overhangs and fins and the surrounding buildings. A 360° solar diagram used to reproduce the orography of the place has been outlined too. After modelling the rooms and qualifying the respective surfaces, the luminaires and the corresponding light bulbs were inserted in the positions conceived by the lighting project. sDA and Em were calculated on the test surface previously described and visible in Figure 4 for Bedroom 3. sDPG and UGR were evaluated in the spots where the inhabitants are supposed to stay still for some time (see also Section 3.6): in the case of Bedroom 3 the selected positions are the desk and the bed (as shown in Figure 5).
5. Results
In Table 9 the performance of each room under every considered aspect is presented. SDA, Em, UGR and CCT are reported in their own units of measure along with the indication of the corresponding class. For sDGP the time fraction vector is reported, since the value of the metric is variable throughout the year. At the end of Table 9 the visual quality index of every single environment is highlighted.
Table 10 shows the calculation of the weights of the different rooms and of the qualitative score. The QS was evaluated room by room and the point was assigned if the check was considered true for at least 50% of the floor of the building.
Finally, the BVQI can be calculated by adding the VQI of each room multiplied by its weight and the qualitative score:
The building visual quality index of the house is 91. This means that the building could be classified as excellent.
Focusing on the Results of Bedroom 2
To better understand the method, in the following paragraph the process of calculating the VQI of Bedroom 2 is explained in detail. Bedroom 2 is located on the first floor of the house and is designed to host two beds (see Figure 3):
- The value of sDA is 81: considering the square mesh already mentioned, 81% of the room floor has an illuminance equal to or greater than 300 lux for the period 8 am–6 pm;
- sDPG was evaluated in three spots (two beds and one desk): the glare probability is very low and falls in Class I for over 97% of the time in all the spots;
- The value of Em represents the average illuminance on the test surface and is equal to 153 lux (see Figure 6, where the output of the simulation is shown);
- UGR was evaluated on the same three spots used for sDGP (see Figure 7). The values for the three spots are, respectively, 17, 14, and 19;
- Color temperature has a fixed value of 3000 K.
All these values were inserted into the time fraction matrix as follows. It is important to note that the matrix has more than five columns, because sDGP and UGR were considered thrice. The relative weight vector was consequently modified by adding more rows and dividing the weight of sDGP and UGR by three. The matrix and the VQI of Bedroom 2 are, therefore:
6. Discussion
During the design phase, results of the VQI simulation summarized in tables (like Table 9 for the case study previously presented) are of great importance in relation to optimizing the project and to appropriately drive the design choices. The designer has a clear overview of the problems connected with indoor visual comfort and can immediately understand which rooms or different parameters need particular attention. Considering T, for instance, it can be inferred that the electric lighting system was carefully designed, since the illuminance and UGR parameters are always in Class I or II. On the other hand, daylight is surely an aspect more complicated to control since it depends mainly on the external environment (outside weather conditions rapidly changing); furthermore, window position and size are driven also by thermal issues and regional standards that are often in contrast with visual needs. As a matter of fact, considering sDA, four rooms fall in Class IV and, furthermore, the living room (the indoor environment probably most used in a house) does not manage to reach Class I. A separate reasoning is needed for sDGP: this parameter is calculated only in specific spots and is very much dependent on the furniture layout. The overall very good result obtained in this metric does not indicate an absolute absence of glare from daylight but rather a good relation between windows and indoor layout. CCT has a relatively low weight on the overall index value because in the design phase it can be freely defined depending on the lamps chosen, but nevertheless it is an important aspect to be considered from the very beginning since it can modify the comfort sensation of the users and it must be properly evaluated during the life time of the building with on-site monitoring.
The best performing room is the kitchen, which had a very high value of VQI which was near to the maximum score. This is consistent with the fact that it has been design with a big window facing north that provides a large amount of daylight but avoids at the same time the possibility of direct glare. All the bathrooms and Bedroom 1 suffer from a lack of daylight: this is due to the small windows chosen by the designer. The worst VQI was for Bathroom 3, where poor daylighting is coupled with a not perfect electric lighting design that must be improved.
The choice of the relative weights was a very controversial step and the authors believe that it is not realistic to define an ultimate solution which would be universally valid for every type of environment, inhabitant, and climate. In the literature it was not possible to find a study that considered these specific metrics in the definition of visual quality, so the proposal of the relative weights presented in this paper was to be considered a first attempt. In any case, the final result of the simulation demonstrates that the weights assigned to the parameters are reasonable. For example, a room with a poor daylight access, such as the bathrooms, which have been previously mentioned, cannot exceed 70 points, i.e., they are sufficient. A similar VQI would be assigned to a room with an inappropriate electric lighting design but with design choices for daylighting of a sufficient level. In future developments of the project, the post occupancy evaluation and the analysis of the satisfaction of the inhabitants will be used to validate or propose any changes to these weights.
It is important to notice that the influence of the qualitative parameters is crucial. In the case study they allow the final result to shift from good to excellent. The qualitative score should precisely be representative of this fact: the attention to qualitative issues like view out, shading, and flexibility and control is an added value to the overall visual quality of the building that must be taken into consideration for the influence it has on the psychological aspects of the inhabitants.
In order to increase the VQI score and to define a better indoor environment for visual comfort, and to analyze the simulation results of the rooms and the related scores of the metrics, the following actions could be considered:
- First of all, it is reasonable to work on environments that have the highest weight on the overall index. In the case study, these would be the living room and Bedroom 1;
- In the rooms previously defined, it is important to concentrate the attention mainly on those metrics that present the worse score, trying to improve them by defining new design options. In the case study, for instance, shifting the sDA value of Bedroom 1 from Class IV to Class II would add three points to the BVQI;
- After that, attention should be given to the others’ rooms primarily acting on the parameters which are easier to correct towards a better indoor visual environment. For example, the lighting bodies of Bedrooms 1 and 2 and of the living room cause glare, a problem that can be easily avoided by changing the shape or the position of the lamps. Of course, afterwards the maintained illuminance level of the room must be verified again.
7. Conclusions and Future Developments
An integrated index for evaluating the visual quality of an indoor environment in residential buildings has been proposed and discussed. In the definition of the index daylight access, glare probability from daylight and electric illumination, maintained illuminance, and color temperature are considered the main quantitative parameters. These aspects are measured through a fixed set of metrics and are combined using relative weights to obtain an index that could be representative of the visual quality of an environment throughout a whole year. Qualitative parameters are considered as well in order to thoroughly take into account the psychological aspects of the inhabitants. The applicability of the index was tested by simulation on a dwelling that will be built and monitored in the context of the CASA research project, and which will assess and eventually properly modify and/or improve the index itself. A classification of the final BVQI in different levels is proposed which is useful for making available more direct and simpler information to users as well as providing a benchmark for commercial use.
It has been proven that the index achieves its purpose: it is easy to use and to understand because it synthetizes the visual quality of the environment into a single value which properly balances the contribution of the different rooms; it is useful during the design process as it gives the designers information on how to choose among different solutions to improve both electric lighting, daylight access, and space organization.
Considering future developments, first of all the index will be validated in real case studies where users’ satisfaction is recorded, correlated with the value of the index and compared with the real physical values monitored with a building monitoring system designed for this purpose. This will be done in the next two years within the CASA project (where all the parameters connected to human comfort will be controlled and monitored), but a wider utilization of the index is recommended for its stronger validation and/or for the proposal of proper changes in the parameters weights, in the thresholds, or in the considered aspects.
Future implementation of the index could comprehend an evaluation that is based on the effective occupancy profile of the dwelling. A stronger connection with the building energy efficiency will also be considered.
Finally, the methodology followed to define the VQI could be replicated in other fields of human comfort perception in order to achieve a holistic evaluation of indoor environmental quality.
Author Contributions
Conceptualization, R.A.; methodology and formal analysis, R.A., S.Z., and N.C.; simulation N.C.; writing—original draft preparation, S.Z. and N.C.; writing—review and editing, R.A., S.Z., and N.C.
Funding
This research was funded by Covi Costruzioni s.r.l. under the CASA project.
Conflicts of Interest
The authors declare no conflict of interest.
Nomenclature
| IEQ | indoor environment quality | CCT | correlated color temperature |
| VQ | visual quality | QS | qualitative score |
| VQI | visual quality index | ω | relative weight assigned to the metrics |
| sDA | spatial daylight autonomy | PI | performance index |
| sDPG | simplified daylight glare probability | f | weighted time fraction |
| Em | maintained illuminance | BVQI | building visual quality index |
| UGR | unified glare ratio | W | relative weight assigned to the rooms |
References
- ANSI/ASHRAE. ANSI/ASHRAE Standard 55—Thermal Environment Conditions for Human Occupancy; American Society of Heating, Refrigerating and Air-Conditioning Engineers: Atlanta, GA, USA, 2010. [Google Scholar]
- CEN. UNI EN ISO 7730—Ergonomics of the Thermal Environment; European Committee for Standardization: Bruxelles, Belgium, 2006. [Google Scholar]
- Vischer, J.C. Towards an Environmental Psychology of Workspace: How People are Affected by Environments for Work. Archit. Sci. Rev. 2008, 51, 97–108. [Google Scholar] [CrossRef]
- Hellwig, R.T. Perceived control in indoor environments: A conceptual approach. Build. Res. Inf. 2015, 43, 302–315. [Google Scholar] [CrossRef]
- Humphreys, M.A. Quantifying occupant comfort: Are combined indices of the indoor environment practicable? Build. Res. Inf. 2005, 33, 317–325. [Google Scholar] [CrossRef]
- Vischer, J.C. Towards a user-centred theory of the built environment. Build. Res. Inf. 2008, 36, 231–240. [Google Scholar] [CrossRef]
- Lai, A.C.K.; Mui, K.W.; Wong, L.T.; Law, L.Y. An evaluation model for indoor environmental quality (IEQ) acceptance in residential buildings. Energy Build. 2009, 41, 930–936. [Google Scholar] [CrossRef]
- Bluyssen, P.M. The Indoor Environment Handbook; Earthscan: London, UK, 2009; ISBN 9781844077878. [Google Scholar]
- Chiang, C.M.; Lai, C.M. A study on the comprehensive indicator of indoor environment assessment for occupants’ health in Taiwan. Build. Environ. 2002, 37, 387–392. [Google Scholar] [CrossRef]
- Kim, J.; de Dear, R. Nonlinear relationships between individual IEQ factors and overall workspace satisfaction. Build. Environ. 2012, 49, 33–40. [Google Scholar] [CrossRef]
- Astolfi, A.; Pellerey, F. Subjective and objective assessment of acoustical and overall environmental quality in secondary school classrooms. J. Acoust. Soc. Am. 2008, 123, 163–173. [Google Scholar] [CrossRef] [PubMed]
- Wong, L.T.; Mui, K.W.; Hui, P.S. A multivariate-logistic model for acceptance of indoor environmental quality (IEQ) in offices. Build. Environ. 2008, 43, 1–6. [Google Scholar] [CrossRef]
- Cao, B.; Ouyang, Q.; Zhu, Y.; Huang, L.; Hu, H.; Deng, G. Development of a multivariate regression model for overall satisfaction in public buildings based on field studies in Beijing and Shanghai. Build. Environ. 2012, 47, 394–399. [Google Scholar] [CrossRef]
- Ncube, M.; Riffat, S. Developing an indoor environment quality tool for assessment of mechanically ventilated office buildings in the UK—A preliminary study. Build. Environ. 2012, 53, 26–33. [Google Scholar] [CrossRef]
- Heinzerling, D.; Schiavon, S.; Webster, T.; Arens, E. Indoor environmental quality assessment models: A literature review and a proposed weighting and classification scheme. Build. Environ. 2013, 70, 210–222. [Google Scholar] [CrossRef]
- Li, N.; Cui, H.; Zhu, C.; Zhang, X.; Su, L. Grey preference analysis of indoor environmental factors using sub-indexes based on Weber/Fechner’s law and predicted mean vote. Indoor Built Environ. 2016, 25, 1197–1208. [Google Scholar] [CrossRef]
- Buratti, C.; Belloni, E.; Merli, F.; Ricciardi, P. A new index combining thermal, acoustic, and visual comfort of moderate environments in temperate climates. Build. Environ. 2018, 139, 27–37. [Google Scholar] [CrossRef]
- Marino, C.; Nucara, A.; Pietrafesa, M. Proposal of comfort classification indexes suitable for both single environments and whole buildings. Build. Environ. 2012, 57, 58–67. [Google Scholar] [CrossRef]
- Yener, A.K. A method of obtaining visual comfort using fixed shading devices in rooms. Build. Environ. 1999, 34, 285–291. [Google Scholar] [CrossRef]
- Frascarolo, M.; Martorelli, S.; Vitale, V. An innovative lighting system for residential application that optimizes visual comfort and conserves energy for different user needs. Energy Build. 2014, 83, 217–224. [Google Scholar] [CrossRef]
- Konis, K. Evaluating daylighting effectiveness and occupant visual comfort in a side-lit open-plan office building in San Francisco, California. Build. Environ. 2013, 59, 662–677. [Google Scholar] [CrossRef]
- Xue, P.; Mak, C.M.; Cheung, H.D. The effects of daylighting and human behavior on luminous comfort in residential buildings: A questionnaire survey. Build. Environ. 2014, 81, 51–59. [Google Scholar] [CrossRef]
- Ochoa, C.E.; Aries, M.B.C.; van Loenen, E.J.; Hensen, J.L.M. Considerations on design optimization criteria for windows providing low energy consumption and high visual comfort. Appl. Energy 2012, 95, 238–245. [Google Scholar] [CrossRef]
- Lee, J.H.; Yoon, Y.; Baik, Y.K.; Kim, S. Analyses on human responses to illuminance variations for resident-friendly lighting environment in a small office. Indoor Built Environ. 2013, 22, 535–550. [Google Scholar] [CrossRef]
- Chang, C.Y.; Chen, P.K. Human response to window views and indoor plants in the workplace. HortScience 2005, 40, 1354–1359. [Google Scholar] [CrossRef]
- Xue, P.; Mak, C.M.; Huang, Y. Quantification of luminous comfort with dynamic daylight metrics in residential buildings. Energy Build. 2016, 117, 99–108. [Google Scholar] [CrossRef]
- Illuminating Engineering Society of North America. The IESNA Lighting Handbook, 10th ed.; Illuminating Engineering Society: New York, NY, USA, 2011; ISBN 978-0-87995-241-9. [Google Scholar]
- Jones, N.L.; Reinhart, C.F. Experimental validation of ray tracing as a means of image-based visual discomfort prediction. Build. Environ. 2017, 113, 131–150. [Google Scholar] [CrossRef]
- Wienold, J.; Christoffersen, J. Evaluation methods and development of a new glare prediction model for daylight environments with the use of CCD cameras. Energy Build. 2006, 38, 743–757. [Google Scholar] [CrossRef]
- Hellinga, H.; Hordijk, T. The D&V analysis method: A method for the analysis of daylight access and view quality. Build. Environ. 2014, 79, 101–114. [Google Scholar]
- CEN. UNI 12464-1 Light and Lighting—Lighting of Workplaces—Part 1: Indoor Workplaces; European Committee for Standardization: Bruxelles, Belgium, 2002. [Google Scholar]
- CIE. CIE 117—Discomfort Glare in Interior Lighting; International Commission on Illumination: Vienna, Austria, 1995. [Google Scholar]
- U.S. Green Building Council. LEED v4 for Building Design and Construction; U.S. Green Building Council: Washington, DC, USA, 2018. [Google Scholar]
- WELL Buildings Standard v2. Available online: https://v2.wellcertified.com/ (accessed on 5 March 2019).
- Galasiu, A.D.; Reinhart, C.F. Current daylighting design practice: A survey. Build. Res. Inf. 2008, 36, 159–174. [Google Scholar] [CrossRef]
- Reinhart, C.F.; Wienold, J. The daylighting dashboard—A simulation-based design analysis for daylit spaces. Build. Environ. 2011, 46, 386–396. [Google Scholar] [CrossRef]
- Atzeri, A.M.; Cappelletti, F.; Tzempelikos, A.; Gasparella, A. Comfort metrics for an integrated evaluation of buildings performance. Energy Build. 2016, 127, 411–424. [Google Scholar] [CrossRef]
- Konstantzos, I.; Tzempelikos, A.; Chan, Y.C. Experimental and simulation analysis of daylight glare probability inoffices with dynamic window shades. Build. Environ. 2015, 87, 244–254. [Google Scholar] [CrossRef]
- Bian, Y.; Leng, T.; Ma, Y. A proposed discomfort glare evaluation method based on the concept of “adaptive zone”. Build. Environ. 2018, 143, 306–317. [Google Scholar] [CrossRef]
- Heydarian, A.; Pantazis, E.; Wang, A.; Gerber, D.; Becerik-Gerber, B. Towards user centered building design: Identifying end-user lighting preferences via immersive virtual environments. Autom. Constr. 2017, 81, 56–66. [Google Scholar] [CrossRef]
- Loonen, R.; Loomans, M.; Hensen, J. Towards predicting the satisfaction with indoor environmental quality in building performance simulation. In Proceedings of the Healthy buildings Europe 2015, Eindhoven, The Netherlands, 18–20 May 2015. [Google Scholar]
- Kylili, A.; Fokaides, P.A.; Lopez Jimenez, P.A. Key Performance Indicators (KPIs) approach in buildings renovation for the sustainability of the built environment: A review. Renew. Sustain. Energy Rev. 2016, 56, 906–915. [Google Scholar] [CrossRef]
- Zavrl, M.Š.; Žarnić, R.; Šelih, J. Multicriterial Sustainability Assessment of Residential Buildings. Technol. Econ. Dev. Econ. 2009, 15, 612–630. [Google Scholar] [CrossRef]
- Wang, Q.; Xu, H.; Zhang, F.; Wang, Z. Influence of color temperature on comfort and preference for LED indoor lighting. Optik 2017, 129, 21–29. [Google Scholar] [CrossRef]
- Kraneburg, A.; Franke, S.; Methling, R.; Griefahn, B. Effect of color temperature on melatonin production for illumination of working environments. Appl. Ergon. 2017, 58, 446–453. [Google Scholar] [CrossRef]
- Boyce, P.R. Human Factors in Lighting, 3rd ed.; CRC Press: Boca Raton, FL, USA, 2014; ISBN 9781439874899. [Google Scholar]
- Chamilothori, K.; Chinazzo, G.; Rodrigues, J.; Dan-Glauser, E.S.; Wienold, J.; Andersen, M. Subjective and physiological responses to facade and sunlight pattern geometry in virtual reality. Build. Environ. 2019, 150, 144–155. [Google Scholar] [CrossRef]
- Veitch, J.A. Psychological processes influencing lighting quality. J. Illum. Eng. Soc. 2001, 30, 124–140. [Google Scholar] [CrossRef]
- Carlucci, S.; Causone, F.; De Rosa, F.; Pagliano, L. A review of indices for assessing visual comfort with a view to their use in optimization processes to support building integrated design. Renew. Sustain. Energy Rev. 2015, 47, 1016–1033. [Google Scholar] [CrossRef]
- IES. Approved Method: IES Spatial Daylight Autonomy (sDA) and Annual Sunlight Exposure (ASE); Illuminating Engineering Society: New York, NY, USA, 2012; ISBN 978-0-87995-272-3. [Google Scholar]
- Wienold, J. Dynamic simulation of blind control strategies for visual comfort and energy balance analysis. In Proceedings of the Building Simulation 2007, Beijing, China, 3–6 September 2007. [Google Scholar]
- Reinhart, C.F.; Walkenhorst, O. Validation of dynamic RADIANCE-based daylight simulations for a test office with external blinds. Energy Build. 2001, 33, 683–697. [Google Scholar] [CrossRef]
- Reinhart, C. Opinion: Climate-based daylighting metrics in LEEDv4—A fragile progress. Light. Res. Technol. 2015, 47, 388. [Google Scholar] [CrossRef]
- Suk, J.Y.; Schiler, M.; Kensek, K. Development of new daylight glare analysis methodology using absolute glare factor and relative glare factor. Energy Build. 2013, 64, 113–122. [Google Scholar] [CrossRef]
- Mcneil, A.; Burrell, G. Applicability of DGP and DGI for evaluating glare in a brightly daylit space. In Proceedings of the ASHRAE and IBPSA-USA SimBuild 2016, Salt Lake City, UT, USA, 10–12 August 2016. [Google Scholar]
- Suk, J.Y.; Schiler, M.; Kensek, K. Investigation of existing discomfort glare indices using human subject study data. Build. Environ. 2017, 113, 121–130. [Google Scholar] [CrossRef]
- Cai, H.; Chung, T. Evaluating discomfort glare from non-uniform electric light sources. Light. Res. Technol. 2013, 45, 267–294. [Google Scholar] [CrossRef]
- Ulrich, R.S. View through a window may influence recovery from surgery. Science 1984, 224, 420–421. [Google Scholar] [CrossRef] [PubMed]
- Lashina, T.; van der Vleuten-Chraibi, S.; Despenic, M.; Shrubsole, P.; Rosemann, A.; van Loenen, E. A comparison of lighting control strategies for open offices. Build. Environ. 2019, 149, 68–78. [Google Scholar] [CrossRef]
- Fabrizio, E.; Corgnati, S.P.; Causone, F.; Filippi, M. Numerical comparison between energy and comfort performances of radiant heating and cooling systems versus air systems. Hvac R Res. 2012, 18, 692–708. [Google Scholar]
- The Edmund Mach Foundation. Available online: https://www.fmach.it/ (accessed on 3 September 2018).
- Østergård, T.; Jensen, R.L.; Maagaard, S.E. Building simulations supporting decision making in early design—A review. Renew. Sustain. Energy Rev. 2016, 61, 187–201. [Google Scholar] [CrossRef]
- Toutou, A.; Fikry, M.; Mohamed, W. The parametric based optimization framework daylighting and energy performance in residential buildings in hot arid zone. Alex. Eng. J. 2018, 57, 3595–3608. [Google Scholar] [CrossRef]
Figure 1.
Graph of the dry bulb temperature (°C) in Segno (Tn)—Italy on an hourly time step.

Figure 2.
View of the site with an indication of the simulated house.

Figure 3.
Plan of the apartment: (a) ground floor and (b) first floor.

Figure 4.
Grid for the evaluation of sDA and Em in Bedroom 3: (a) plan and (b) perspective view.

Figure 5.
Spots for evaluation of sDGP in Bedroom 3: (a) plan and (b) perspective view.

Figure 6.
Distribution of illuminance in Bedroom 2: (a) plan and (b) perspective view.

Figure 7.
UGR evaluation in Bedroom 2: plan view.


Table 1.
Thresholds for each class regarding spatial daylight autonomy (sDA), simplified daylight glare probability (sDGP), unified glare ratio (UGR) and correlated color temperature (CCT).
Table 1.
Thresholds for each class regarding spatial daylight autonomy (sDA), simplified daylight glare probability (sDGP), unified glare ratio (UGR) and correlated color temperature (CCT).
| sDA (%) | sDGP | UGR | CCT (K) | |
|---|---|---|---|---|
| Class I | ≥75 | ≤0.35 | ≤16 | ≥2500 ∩ ≤3000 |
| Class II | ≥55 ∩ <75 | ≤0.40 ∩ >0.35 | ≤19 ∩ >16 | >3000 ∩ ≤3300 |
| Class III | ≥35 ∩ <55 | ≤0.45 ∩ >0.40 | ≤22 ∩ >19 | >3300 ∩ ≤5300 |
| Class IV | <30 | >0.45 | >22 | >5300 ∪ >2500 |
Table 2.
Thresholds for each class and intended use of the environment regarding maintained illuminance (Em).
Table 2.
Thresholds for each class and intended use of the environment regarding maintained illuminance (Em).
| Maintained Illuminance (lux) | ||||
|---|---|---|---|---|
| Living Room | Kitchen | Sleeping Room | Bathroom | |
| Class I | >172.5 ∩ <222.5 | >170 ∩ <230 | >115 ∩ <175 | >115 ∩ <175 |
| Class II | >127.5 ∩ <172.5 | >130 ∩ <170 | >85 ∩ <115 | >85 ∩ <115 |
| Class III | >100 ∩ <127.5 | >100 ∩ <130 | >50 ∩ <85 | >50 ∩ <85 |
| Class IV | >222.5 ∪ <100 | >230 ∪ <100 | >175 ∪ <50 | >175 ∪ <50 |
Table 3.
Relative weights (ω) of the parameters.
| Metric | Relative Weight ω | |
|---|---|---|
| sDA | 0.30 | 0.5—Daylight |
| sDGP | 0.20 | |
| Em | 0.25 | 0.5—Electric lighting |
| UGR | 0.15 | |
| CCT | 0.10 |
Table 4.
Subdivision of building visual quality index (BVQI) in classes.
| SCORE | Class |
|---|---|
| 0–40 | Bad |
| 40–75 | Sufficient |
| 75–90 | Good |
| 90–100 | Excellent |
| 100+ | Excellent* |
Table 5.
Software used in the simulation.
| Metrics | Software | Plug-in |
|---|---|---|
| sDA | Grasshopper for Rhinocheros Build 1.0.0005 | Ladybug v. 0.0.66 + Honeybee v. 0.063 |
| sDGP | Grasshopper for Rhinocheros Build 1.0.0005 | Ladybug v. 0.0.66 + Honeybee v. 0.063 |
| Em | Dialux v. 4.13.0.2 | |
| UGR | Dialux v. 4.13.0.2 | |
| CCT | Dialux v. 4.13.0.2 |
Table 6.
Surface parameters of floor, ceiling and walls.
| R Reflectance | G Reflectance | B Reflectance | Tot. Reflectance | Roughness | Specularity | |
|---|---|---|---|---|---|---|
| Floor | 0.309 | 0.165 | 0.083 | 0.198 | 0.1 | 0.03 |
| Ceiling | 0.726 | 0.706 | 0.633 | 0.707 | 0.1 | 0 |
| Walls | 0.726 | 0.706 | 0.633 | 0.707 | 0.1 | 0 |
Table 7.
Characteristics of the glazing.
| Solar Transmittance | Visible Transmittance (VT) | Transmissivity | |
|---|---|---|---|
| Glazing | 0.5 | 0.71 | 0.785 |
Table 8.
Parameters for evaluation of sDA and sDGP.
| Radiance Simulation Parameter | Value |
|---|---|
| Sampling threshold (pt) | 0.15 |
| Direct sampling (ds) | 0.5 |
| Ambient accuracy (aa) | 0.1 |
| Anti-aliasing jitter (pj) | 0.6 |
| Direct threshold (dt) | 0.5 |
| Ambient divisions (ad) | 1000 |
| Direct jitter (dj) | 0 |
| Direct pretest density (dp) | 64 |
| Limit weight (lw) | 0.05 |
| Ambient resolution (ar) | 300 |
| Ambient super-samples (as) | 20 |
| Direct certainty (dc) | 0.25 |
| Ambient value (av) | 0 |
| Limit reflection (lr) | 4 |
| Pixel sampling rate (ps) | 8 |
| Specular threshold (st) | 0.85 |
| Specular jitter (sj) | 0.3 |
| Direct relays (dr) | 0 |
| Ambient bounces (ab) | 7 |
Table 9.
Visual quality indexes (VQIs) of all the rooms.
| Living | Kitchen | Bathroom 1 | Bedroom 1 | Bedroom 2 | Bedroom 3 | Bathroom 2 | Bathroom 3 | |||||||||
|---|---|---|---|---|---|---|---|---|---|---|---|---|---|---|---|---|
| SDA (%) | 57.9 | II | 94.4 | I | 16.7 | IV | 16.7 | IV | 81.0 | I | 96.6 | I | 22.2 | IV | 0.0 | IV |
| Em (lux) | 181 | I | 184 | I | 161 | I | 165 | I | 153 | I | 145 | I | 150 | I | 110 | II |
| UGR | 18.2 1 | II | 0 | I | 0 | I | 13 | I | 16.7 1 | II | 19 1 | II | 0 | I | 0 | I |
| Colour (K) | 3000 | I | 3000 | I | 3000 | I | 3000 | I | 3000 | I | 3000 | I | 3000 | I | 3000 | I |
| sDPG (%) | 90.8 1 | I | 98.5 | I | 100.0 | I | 100.0 | I | 98.3 1 | I | 99.0 1 | I | 100.0 | I | 100.0 | I |
| 3.9 1 | II | 0.6 | II | 0.0 | II | 0.0 | II | 0.6 1 | II | 0.4 1 | II | 0.0 | II | 0.0 | II | |
| 1.7 1 | III | 0.5 | III | 0.0 | III | 0.0 | III | 0.4 1 | III | 0.2 1 | III | 0.0 | III | 0.0 | III | |
| 3.6 1 | IV | 0.4 | IV | 0.0 | IV | 0.0 | IV | 0.7 1 | IV | 0.4 1 | IV | 0.0 | IV | 0.0 | IV | |
| VQI | 83.2 | 99.8 | 70.0 | 70.0 | 96.8 | 95.0 | 70.0 | 62.5 | ||||||||
1 Average of multiple measurements in different positions.
Table 10.
Calculation of the weights of the rooms (W) and of the qualitative score (QS).
| Living | Kitchen | Bathroom 1 | Bedroom 1 | Bedroom 2 | Bedroom 3 | Bathroom 2 | Bathroom 3 | Total | ||
|---|---|---|---|---|---|---|---|---|---|---|
| Area (m2) | 34.68 | 18.98 | 3.75 | 18.51 | 14.92 | 10.62 | 6.18 | 4.32 | 111.96 | |
| Weight (W) | 0.31 | 0.17 | 0.03 | 0.17 | 0.13 | 0.09 | 0.06 | 0.04 | 1.00 | |
| View out | YES | YES | YES | YES | YES | YES | NO | YES | 94% | YES |
| Qualitative view out | YES | YES | YES | YES | YES | YES | NO | YES | 94% | YES |
| Daylight shading | YES | YES | NO | YES | YES | YES | NO | NO | 87% | YES |
| View shading | YES | YES | NO | YES | YES | YES | NO | NO | 87% | YES |
| Glare shading | NO | NO | YES | NO | NO | NO | YES | YES | 13% | NO |
| Specific lights | YES | YES | YES | YES | YES | YES | YES | YES | 100% | YES |
| Dimmable lights | YES | YES | NO | YES | YES | YES | NO | NO | 87% | YES |
| Light scenarios | YES | NO | NO | NO | NO | NO | NO | NO | 31% | NO |
| QS: | 6 | |||||||||
© 2019 by the authors. Licensee MDPI, Basel, Switzerland. This article is an open access article distributed under the terms and conditions of the Creative Commons Attribution (CC BY) license (http://creativecommons.org/licenses/by/4.0/).
Share and Cite
MDPI and ACS Style
Zanon, S.; Callegaro, N.; Albatici, R. A Novel Approach for the Definition of an Integrated Visual Quality Index for Residential Buildings. Appl. Sci. 2019, 9, 1579. https://doi.org/10.3390/app9081579
AMA Style
Zanon S, Callegaro N, Albatici R. A Novel Approach for the Definition of an Integrated Visual Quality Index for Residential Buildings. Applied Sciences. 2019; 9(8):1579. https://doi.org/10.3390/app9081579
Chicago/Turabian StyleZanon, Stefano, Nicola Callegaro, and Rossano Albatici. 2019. "A Novel Approach for the Definition of an Integrated Visual Quality Index for Residential Buildings" Applied Sciences 9, no. 8: 1579. https://doi.org/10.3390/app9081579
Note that from the first issue of 2016, this journal uses article numbers instead of page numbers. See further details here.