Prediction of Shape Change for Fatigue Crack in a Round Bar Using Three-Parameter Growth Circles


1
School of Mechanical Engineering, University of Ulsan, Ulsan 680-749, Korea
2
School of Mechanical and Automotive Engineering, Shanghai University of Engineering Science, Shanghai 201620, China
*
Author to whom correspondence should be addressed.
Appl. Sci. 2019, 9(9), 1751; https://doi.org/10.3390/app9091751
Submission received: 26 March 2019
/
Revised: 18 April 2019
/
Accepted: 22 April 2019
/
Published: 27 April 2019
(This article belongs to the Special Issue Computational Methods for Fracture)
Abstract
:Featured Application
Life prediction for engineering materials.
Abstract
The conventional method for predicting the shape change of a surface crack in a round bar simply utilizes the Paris-Erdogan law with the least squares method using a certain shape assumption with excessive constraints. In this paper, a three-parameter model for a round bar subjected to tension is developed with fewer shape assumption restraints by employing a fatigue crack growth circles method. The equivalent stress intensity factor based on both stress intensity factors along the current and new crack front is used to reduce the total number of increments. The results show that the proposed method has a good convergence speed and accurate prediction of crack shapes. The present method is validated by comparing the solution with other simulation solutions and experimental data.
1. Introduction
The propagation analysis of a surface crack is a critical capability for structural integrity prediction of cylindrical metallic components (bolts, screws, shafts, etc.) Part-through flaws appear on the free surface of a smooth round bar and the front of a growing crack can be considered as a so-called ‘almond’ shape by extensive experimental works [1,2,3,4,5,6].
Attempts to predict fatigue growth of a surface crack in a round bar have been reported. Some investigators have employed a circular arc to describe the crack front [5,7,8], then the hypothesis that an actual part-through crack can be replaced by an equivalent elliptical arc edge flaw has been widely applied. A. Carpinteri [9,10,11,12,13], as one of the most representative researchers on this topic, conducted extensive studies related to this configuration. However, regardless of whether they used a circular arc or elliptical arc, most researchers employed a certain shape with a fixed center, which reduced the fatigue calculations to one-or two-dimensional problems. Few efforts have been made utilizing a three-parameter model. Although A. Carpinteri [14] mentioned the three-parameter model previously, the fatigue crack propagation was simply examined by applying the Paris-Erdogan law with the least square method as in almost all previous studies [15,16,17]. In addition to experimental backtracking technique [18,19] and normalized area-compliance method [20], there is no further research regarding the method of surface crack prediction.
The objective of this paper was to predict the shape change of a fatigue crack in a round bar subjected to tension by employing fatigue crack growth circles, based on a three-parameter model using finite element analysis. In this paper, a fewer shape restraints model with part-elliptical cracks whose center was allowed to move along the vertical axis was built, which could be more precise for expressing the actual crack shape front. The nominal aspect ratio of an ellipse, which is more meaningful, is proposed for the three-parameter model. Meanwhile, the fatigue crack growth circles, which are on a tangent to both current and new crack fronts, were developed to predict the crack path. The equivalent stress intensity factor based on both stress intensity factors along the current and new crack fronts was proposed to reduce the number of modeling computations with only a few iterations. The validity of the present method will be shown by comparing its results with a simulation solution and experimental results.
2. Numerical Propagation Process
2.1. Three-Parameter Model
A surface crack in a smooth round bar with diameter subjected to fatigue tension are taken into consideration. A part-elliptical surface flaw is defined by three parameters: (1) major axis of an ellipse , (2) minor axis of an ellipse , and (3) center of ellipse (Figure 1).
2.2. Fatigue Crack Propagation
The propagation of a surface crack in a round bar under cyclic tension is predicted by employing fatigue crack growth circles [21] (Figure 2). If the crack presents an ellipse shape up to the i-th loading step, the initial ellipse whose center is located on the surface of the specimen can be defined with given and , as represented by the following equation
Points , , , and in Figure 2 with coordinates () are deployed equidistantly along the current crack front, where the subscript refers to the points , , , and .
The growth of a new crack front lying on an ellipse with semi-axes , , and after one cyclic loading step to a new configuration can be described by the following equation
The assumed crack growth circles, which pass points , , , and respectively, are tangent to both current and new crack fronts. The new crack front points with coordinates () are the points of tangency between crack growth circles and the new crack front. Meanwhile the centers of crack growth circles can be determined as ().
The crack growth increment among these points can be determined by applying the Paris-Erdogan law
where is crack growth rate, is the stress intensity factor range, and and are material constants.
After each computed crack configuration, an increment of crack growth at the interior point is given. The crack growth length of other points can be determined
Here, stands for the equivalent stress intensity factor related to the stress intensity factors of both current and new crack fronts.
The stress intensity factor is assumed to be a liner function of crack growth increment. An arbitrary number of crack growth steps can be assumed. Using
the crack growth length is increased to repeatedly in each step to the last step by adjusting material constant . The equivalent stress intensity factor with stepping coefficient can be obtained appropriately through the crack growth plot of vs. .
At the beginning of iteration, sometimes a relatively large value of can be used to avoid diverging.
The distance from the center of crack growth circles to points along the new crack front are calculated using the geometrical relationship
An error equation can be derived as
The values of and which minimize the error equation, are based on iterative methods and repeat all of the above steps based on the obtained crack front. The parameters of the ellipse for each new crack front can be determined until the results converge.
2.3. Numerical Simulation
The typical model of a round bar with diameter and length that contains a surface crack in its median cross section has been used in many experimental tests and numerical simulations. F.P. Yang [19] presented the experimental results of fatigue crack growth for a straight-fronted edge crack in an elastic bar under axial loading with a diameter of 12 mm, a length of 90 mm, and carbon steel S45 as the material. Table 1 lists material parameters for steel S45. A. Carpinteri [11,12] calculated the surface cracks in round bars with 50 mm diameters through finite-element analysis. Since the propagation of crack shape is defined by the crack configuration for a given loading type [15], in the present paper, the models are established for different values of these initial parameters to compare the fatigue crack propagation with the experimental and simulation results from F.P. Yang [19] and A. Carpinteri [11,12].
The finite element analysis software AbaqusTM (France) is used to simulate the scenario. Since the bar geometry and applied loads present two planes of symmetry, 3D finite element analysis was performed by modeling a quarter of the round bar, as shown in Figure 3. About 350,000–380,000 quadratic hexahedral elements have been employed in each model. The 1/4-node displacement method and fine meshing with a 0.02 mm mesh size has been used around the crack front to model the stress field singularity and improve the accuracy of the contour integral calculation.
For each crack configuration defined by parameters and , the stress-intensity factor along the crack front is obtained through the above described finite-element analysis. The fatigue growth for the initial defects with and is considered in this paper.
3. Results and Discussion
3.1. Evolution of the Crack Shape
Figure 4 illustrates the fatigue shape evolution by the crack growth circles in a round bar subjected to tension. The seven crack front profiles displayed are deduced from roughly 30 crack growth circles in less than 20 iterations. The outermost crack growth circle rolls along the internal profile of the round bar in an approximate manner. When the point of tangency between crack growth circle with crack front approaches very closely to the surface of the bar, such as crack front 6 in Figure 4, the outermost crack growth circle will disappear in the next propagation. The rate of crack propagation can be observed intuitionally by the size of crack growth circles. As shown in Figure 5, the optimum simulation result for the center of an ellipse is not fixed on the surface of the bar, but is reciprocating along the y-axis. Therefore, the actual crack shape can be accurately expressed by the three-parameter model.
In the simulation process, notice that several different ellipses with the same chord length can be replaced to describe one actual crack front, since only part of an ellipse is used, once the center is not fixed (Figure 6). A large variation of ellipse actual aspect ratio is obtained with undifferentiated iteration error, as shown in Figure 7. Hence, the actual aspect ratio of the ellipse semi-axis is meaningless for the three-parameter model to describe the crack front.
Figure 8 illustrates the fatigue shape evolution for five cases. The aspect ratio of initial ellipses , and relative crack depth , while the material constants in the Paris-Erdogan law are assumed to be = 2, 3, and 4. The trends of crack propagation are adequately demonstrated.
As mentioned previously, the nominal aspect ratio of an ellipse, which is the ratio of the maximum crack depth to the chord length , can be considered here. It is noteworthy that, as shown in Figure 9, both initial crack dimensions and Paris law exponent m have an effect on the evolution of different parameters. The crack propagation trends are consistent with the same initial crack aspect ratio when using the same material, although the beginning propagation is affected by the crack depth provisionally. Meanwhile a difference of transition can be noticed between the crack propagation with different Paris law exponent values. In Figure 9, it can be found that the nominal aspect ratio change is very sensitive to the initial crack geometry during early growth, and then the nominal aspect ratios for all cases are converged and become constant around . It shows the flaws tend to follow preferential propagation paths that flatten gradually when the crack depth become larger.
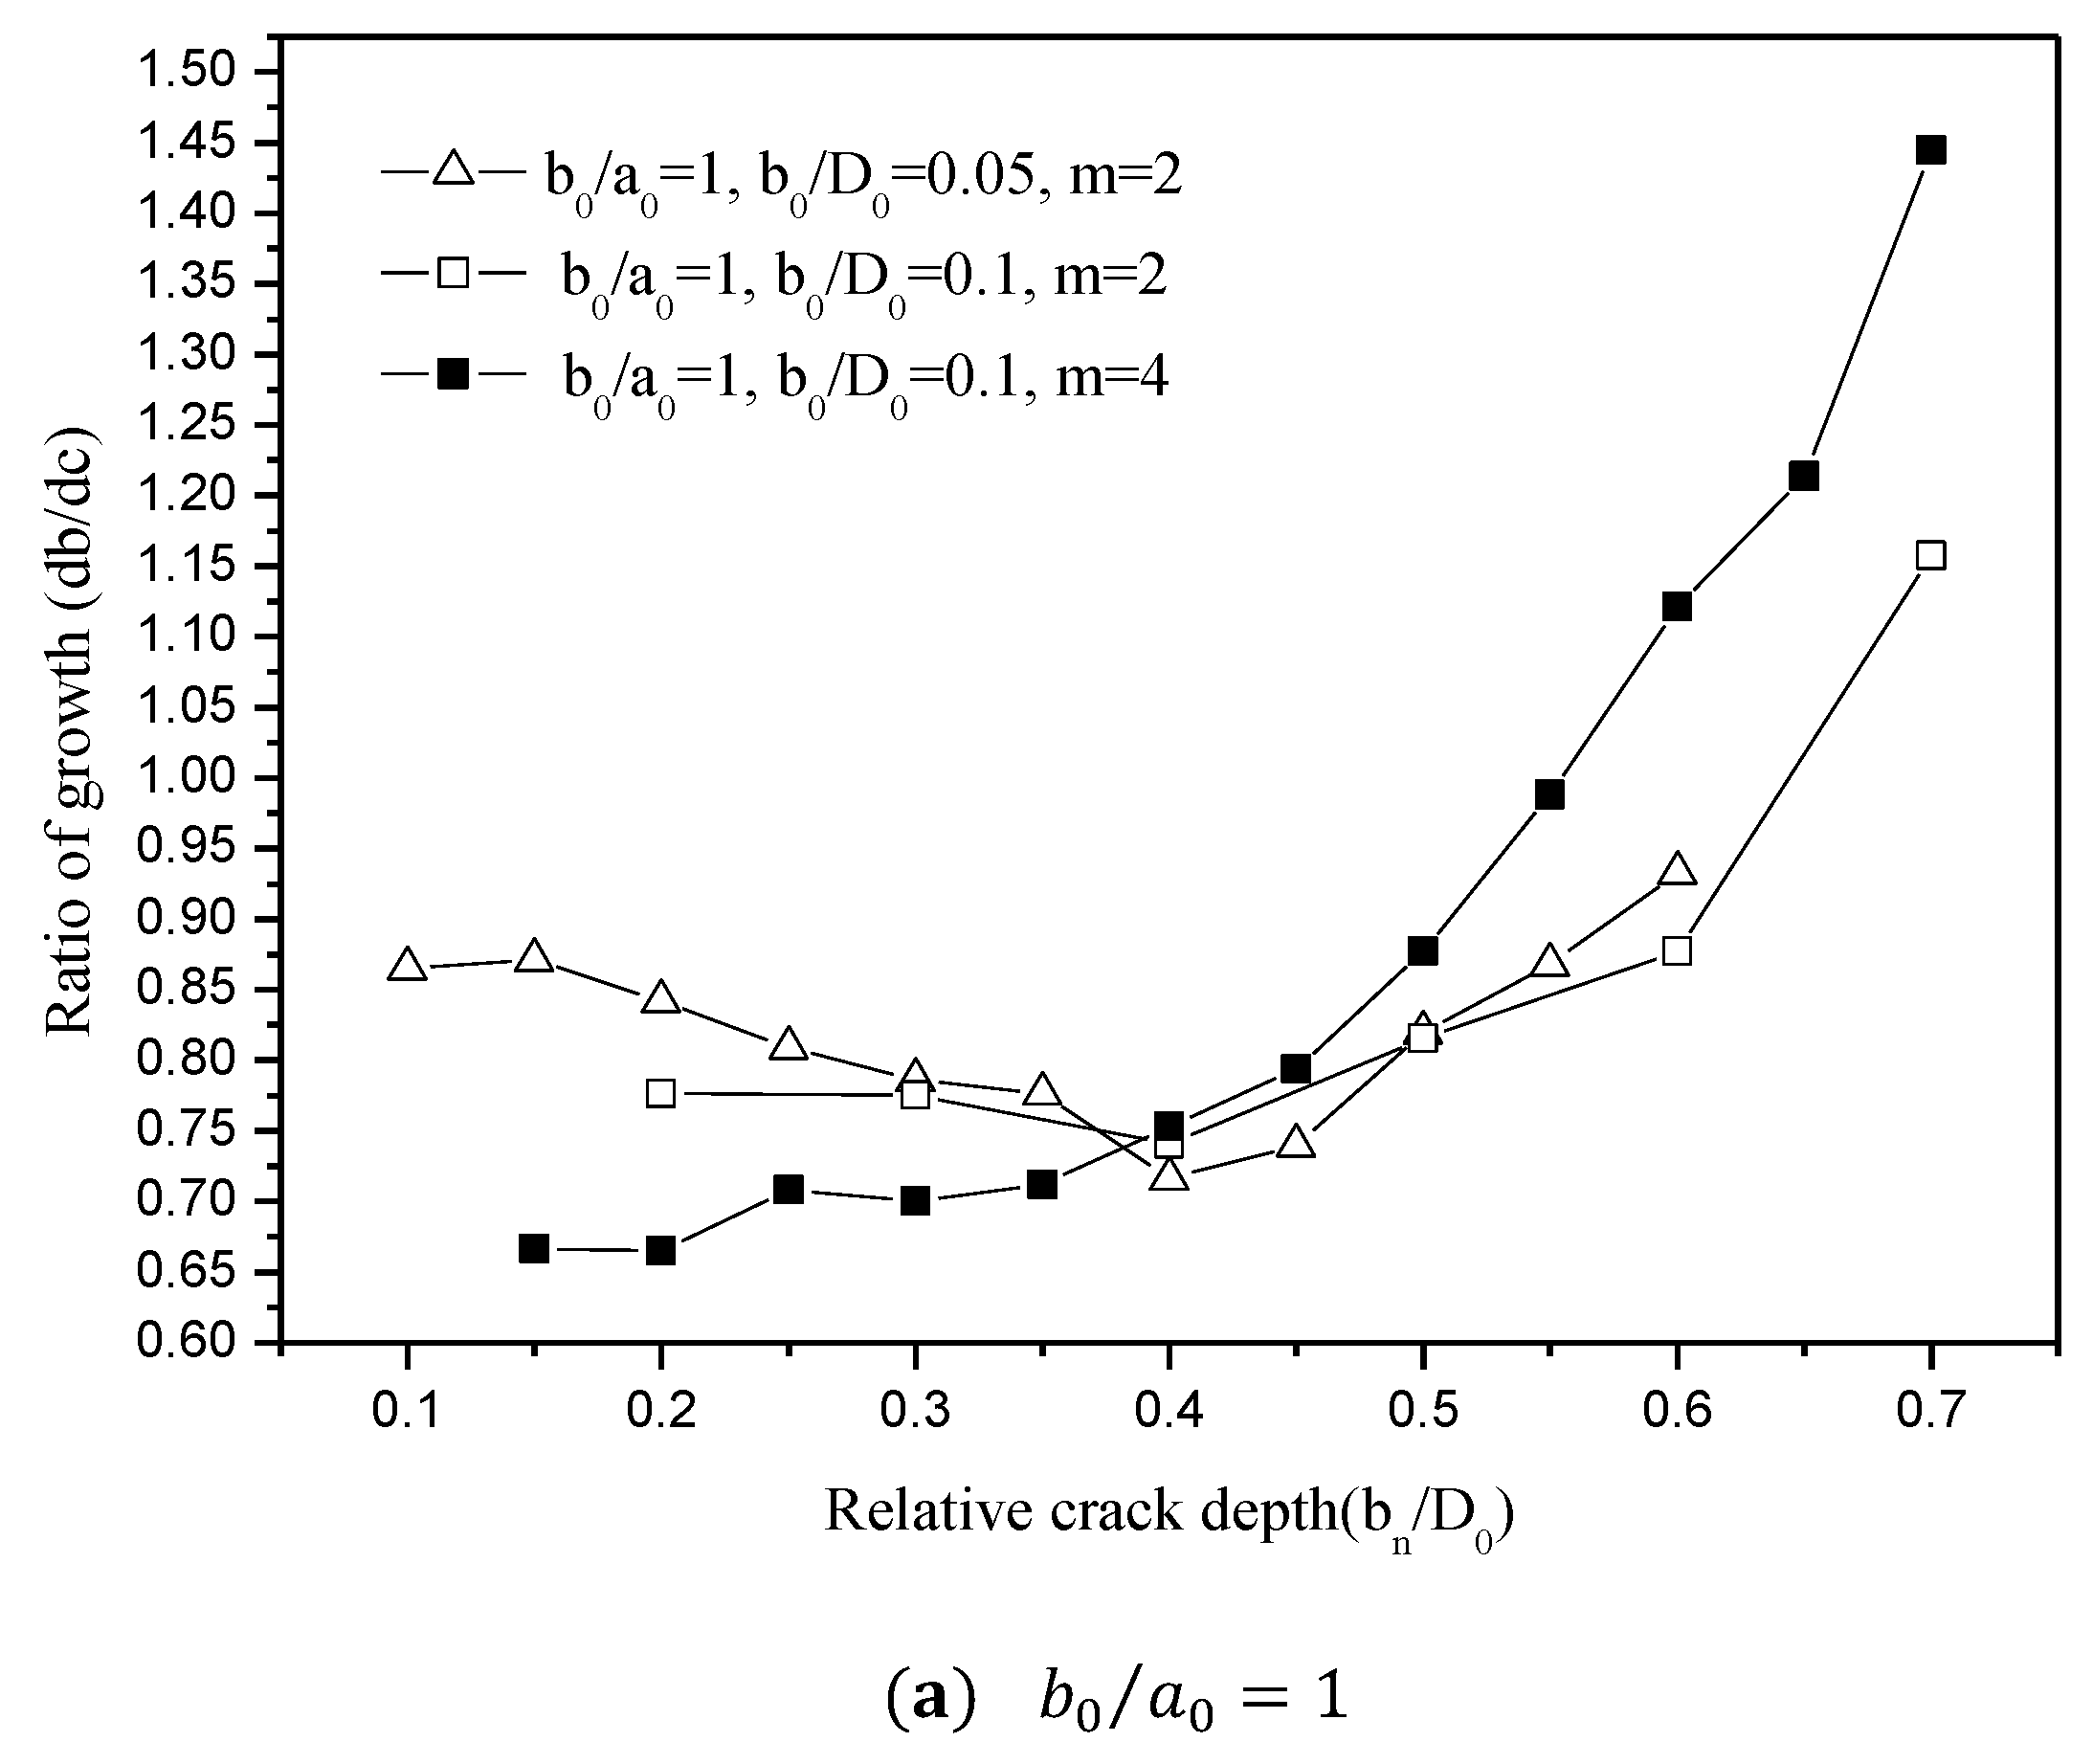
The fatigue crack developments with under cyclic for different initial parameters are shown in Figure 10. It can be seen that the crack propagation paths differ with different initial flaws, but will converge asymptotically. Furthermore, in the process of expansion, the crack growth rate for center and outermost points are variable, which is deduced from the gradient of two type lines with initial flaws . This can be seen more precisely in Figure 11. For the case of an initial crack shown in Figure 11a, the ratio of crack growth () is always less than 1 for most propagation processes, which means the crack growth rate for the central point is always slower than the outermost point until the relative crack depth . However, the change in growth ratio will slow down from the beginning to the stage of for all the cases with initial flaws , and then increase distinctly. For the case of an initial crack with , as shown in Figure 11b, the crack growth along the vertical central line is always greater than the growth adjacent to the horizontal surface until the relative crack depth satisfies , since the gradient line exceeds 1. Furthermore, the rate decreases sharply at the beginning propagation, especially for = 3. Larger values of Paris law exponent m convey more drastic changes. It can be deduced that in the early propagation stage, the exponent m in the Paris law have a distinct effect on the evolution of the crack. The change of crack growth rate for central point is bigger for large value of . It is considered to be related to plasticity which suppress the crack propagation on the outermost surface.
3.2. Comparison with Other Numerical Solutions and Experimental Results
In Figure 12, the fatigue propagation of the initial crack , is compared with numerical solutions by A. Carpinteri [11,12]. The curves in the present results are similar for all cases. However, some discrepancy between the present result and Carpinteri can be seen, especially for the initial crack , . It should be pointed out that in the above comparison, the deviation is mainly due to the difference in the crack growth method adopted and the idealized crack front geometry. A two-parameter elliptical-arc shape with fixed center is assumed only by employing the Paris-Erdogan law ordinarily by Carpinteri [11,12]. The two-parameter shape assumption method mentioned above can simplify the fatigue calculations, but it is also clear that better predications should be obtained if the shape restraint can be reduced, such as those generated by the present method. Moreover, the crack growth circles, which are tangent to the new crack front as well as to the current crack front, can accurately represent the real path of the fatigue crack and thus yield more accurate results. In addition, the better mesh refinement demonstrated in this paper also leads to improved prediction accuracy.
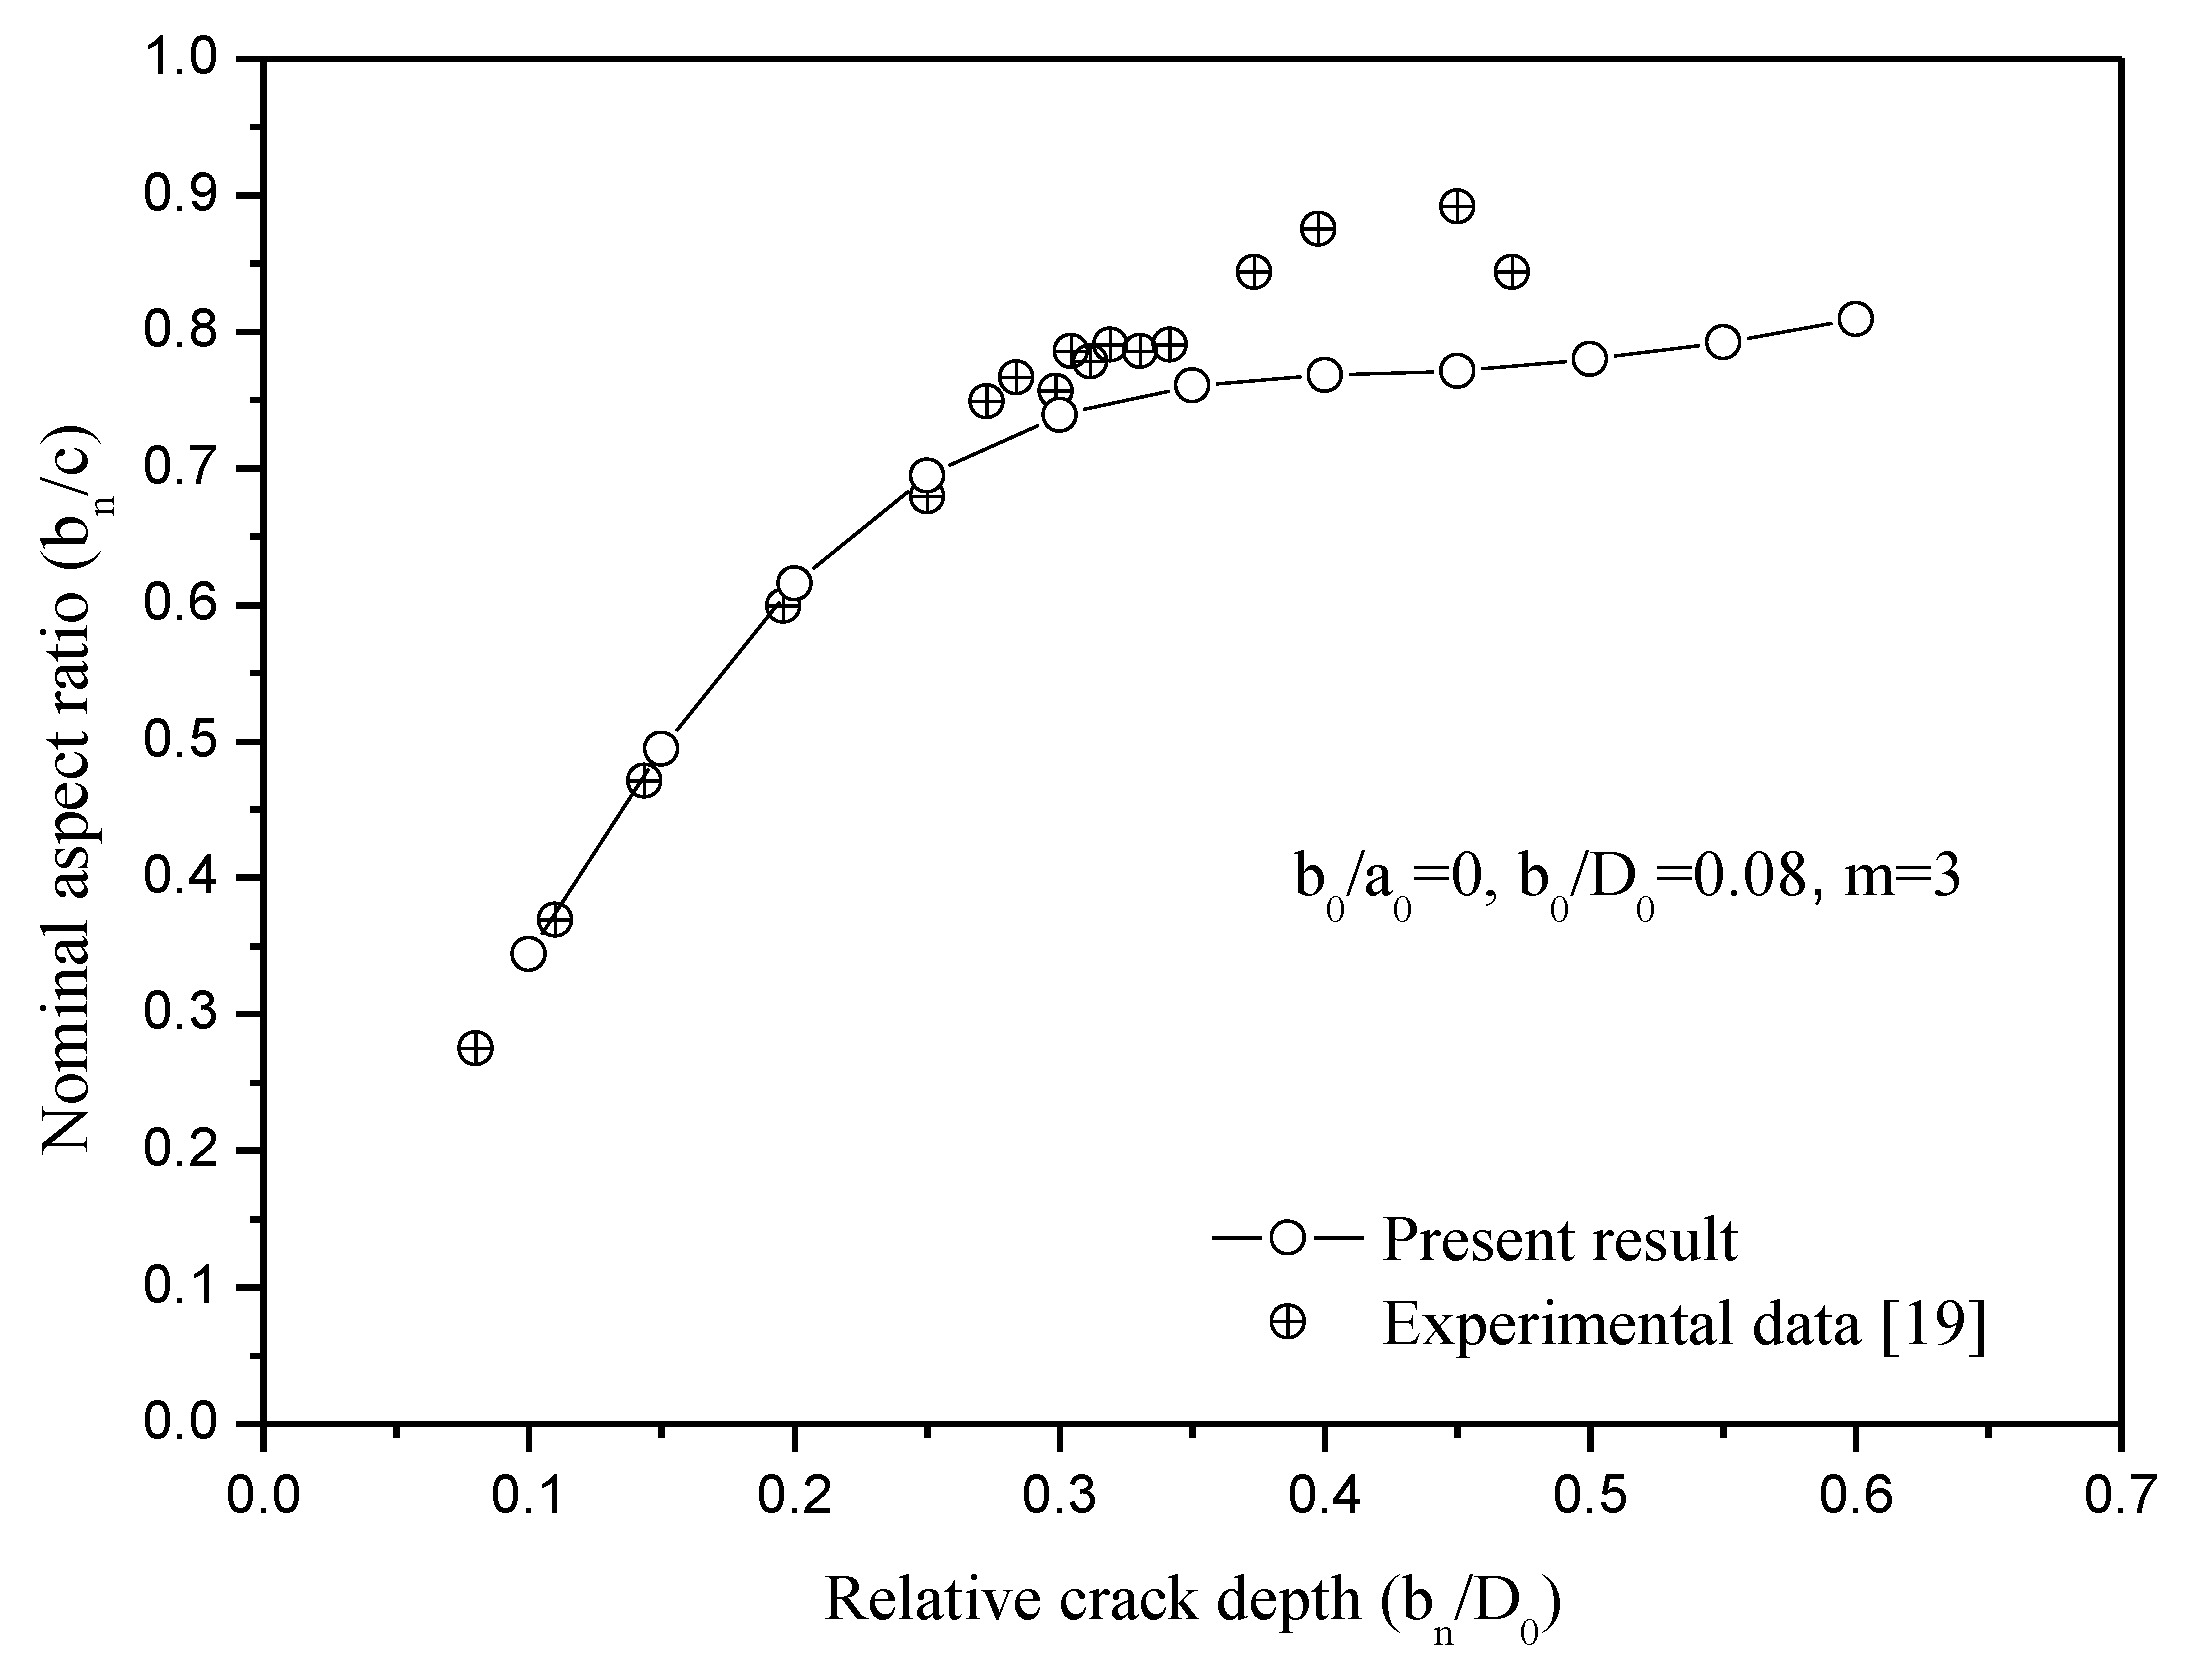
Figure 13 and Figure 14 compare the crack propagation result with the experimental data deduced from F.P. Yang [19]. It is shown that the present results agree well with the experimental data. The experimental result deviates abnormally around the relative crack depth of in Figure 14. The maximum discrepancies are approximately 12%. The deviation of the two solutions are acceptable since as the fracture begins to happen in the experimental method approach, the relative crack depth . It is confirmed that the present method could provide more accurate results.
4. Conclusions
The fatigue propagation of a surface crack in a round bar subjected to tension loads has been investigated by using crack growth circles. The present results demonstrate that the experimental method had good convergence speed and accurate prediction of crack shape patterns. The following conclusions can be drawn:
- The crack growth circles method is developed for the surface cracks of a round bar, and the circles are tangent to both current and new crack fronts. In this way, good simulation accuracy can be achieved with fewer iterations.
- A three-parameter model with fewer shape restraints whose center is allowed to move along the vertical axis is built, and the shape change of a fatigue crack is predicted more precisely. The nominal aspect ratio of an ellipse, which is the ratio of the maximum crack depth to the chord length , , is considered, instead of the actual aspect ratio of an ellipse semi-axis.
- A relatively large crack growth increment can be used by adopting the equivalent stress intensity factor based on the stress intensity factors along the current and new crack fronts.
- The crack propagation process is described accurately based on the ratio of vertical growth toward the horizontal surface. It can be seen that the crack propagation paths differ with different initial flaws, but will converge asymptotically. The ratio of crack growth is always less than 1 for the case of initial crack , and the crack growth along the vertical central line is always greater than the growth toward the horizontal surface. For the case of an initial crack , a greater Paris law exponent m value generates more drastic change.
- The present solutions are compared with other numerical solutions and experimental data. Comparison shows that the present solutions agree well with the experimental data and are better than other numerical solutions.
Author Contributions
Conceptualization, S.C. and Y.Y.; methodology, S.C. and Y.Y.; software, Y.Y.; validation, S.C. and Y.Y.; formal analysis, S.C. and Y.Y.; investigation, H.C.; resources, H.C.; data curation, Y.Y.; writing—original draft preparation, S.C. and Y.Y.; writing—review and editing, S.C. and Y.Y.; visualization, S.C. and Y.Y.; supervision, S.C.; project administration, S.C.; funding acquisition, S.C. and H.C.
Funding
This research was funded by the Natural Science Foundation of Shanghai (18ZR1416500) and Development Fund for Shanghai Talents.
Conflicts of Interest
The Authors declare no conflicts of interest.
Nomenclature
| Diameter of round bar | Stress intensity factor range | ||
| Major axis of an ellipse | Equivalent stress intensity factor | ||
| Minor axis of an ellipse | Stepping coefficient | ||
| Center of ellipse | Crack growth length in Equation (4) | ||
| Chord length of an ellipse | Distance in Equation (7) | ||
| Semi-axes of ellipse for i-th loading step | Actual aspect ratio | ||
| , | Semi-axes of ellipse for i + 1-th loading step | Nominal aspect ratio | |
| Center of ellipse for i + 1-th loading step | Relative crack depth | ||
| Coordinate for points , , , and | Relative chord length | ||
| Crack growth rate | Ratio of growth | ||
| , | Constants of the Paris–Erdogan law |
References
- Athanassiadis, A.; Boissenot, J.M.; Brevet, P.; Francois, D.; Raharinaivo, A. Linear elastic fracture mechanics computations of cracked cylindrical tensioned bodies. Int. J. Fract. 1981, 17, 553–566. [Google Scholar] [CrossRef]
- Nezu, K.; Machida, S.; Nakamura, H. Stress intensity factor of surface cracks and fatigue crack propagation behavior in a cylindrical bar. In Proceedings of the 25th Japan Congress on Material Research, Metallic Metals, Kyoto, Japan, 25–28 March 1982; pp. 87–92. [Google Scholar]
- Mackay, T.L.; Alperin, B.J. Stress intensity factors for fatigue cracking in high-strength bolts. Eng. Fract. Mech. 1985, 21, 391–397. [Google Scholar] [CrossRef]
- Lorentzen, T.; Kjaer, N.E.; Henriksen, T.K. The application of fracture mechanics to surface cracks in shafts. Eng. Fract. Mech. 1986, 23, 1005–1014. [Google Scholar] [CrossRef]
- Forman, R.G.; Shivakumar, V. Growth behavior of surface cracks in the circumferential plane of solid and hollow cylinders. In Fracture Mechanics: Seventeen Volume; American Society of Testing and Materials: Conshohocken, PA, USA, 1986; pp. 59–74. [Google Scholar]
- Caspers, M.; Mattheck, C.; Munz, D. Propagation of surface cracks in Notched and Unnotched Rods. In Surface-Crack Growth: Models, Experiments, and Structures; American Society of Testing and Materials: Conshohocken, PA, USA, 1990; pp. 365–389. [Google Scholar]
- Caspers, M.; Mattheck, C. Weighted averaged stress intensity factors of circular-fronted cracks in cylindrical bars. Fatigue Eng. Mater. Struct. 1987, 9, 329–341. [Google Scholar] [CrossRef]
- Ael din, S.S.; Lovegrove, J.M. Stress intensity factors for fatigue cracking of round bars. Int. J. Fatigue 1981, 3, 117–123. [Google Scholar]
- Carpinteri, A. Elliptical-arc surface cracks in round bars. Fatigue Eng. Mater. Struct. 1992, 15, 1141–1153. [Google Scholar] [CrossRef]
- Carpinteri, A.; Brighenti, R. Fatigue propagation of surface flaws in round bars: A three-parameter theoretical model. Fatigue Eng. Mater. Struct. 1996, 19, 1471–1480. [Google Scholar] [CrossRef]
- Carpinteri, A.; Brighenti, R.; Vantadori, S. Surface cracks in notched round bars under cyclic tension and bending. Int. J. Fatigue 2006, 28, 251–260. [Google Scholar] [CrossRef]
- Carpinteri, A. Shape change of surface cracks in round bars under cyclic axial loading. Int. J. Fatigue 1993, 15, 21–26. [Google Scholar] [CrossRef]
- Carpinteri, A.; Ronchei, C.; Vantadori, S. Stress intensity factors and fatigue growth of surface cracks in notched shell and round bars: Two decades of research work. Fatigue Fract. Eng. Mater. Struct. 2013, 36, 1–13. [Google Scholar] [CrossRef]
- Carpinteri, A.; Vantadori, S. Surface crack in round bars under cyclic tension or bending. Key Eng. Mater. 2008, 378–379, 341–354. [Google Scholar] [CrossRef]
- Couroneau, N.; Royer, J. Simplified model for the fatigue growth analysis of surface cracks in round bars under mode I. Int. J. Fatigue 1998, 20, 711–718. [Google Scholar] [CrossRef]
- Carpinteri, A.; Vantadori, S. Sickle-shaped surface crack in a notched round bar under cyclic tension and bending. Fatigue Fract. Eng. Mater. Struct. 2009, 32, 223–232. [Google Scholar] [CrossRef]
- Ayhan, A.O. Simulation of three-dimensional fatigue crack propagation using enriched finite elements. Comput. Struct. 2011, 89, 801–812. [Google Scholar] [CrossRef]
- Shin, C.S.; Cai, C.Q. Experimental and finite element analyses on stress intensity factors of an elliptical surface crack in a circular shaft under tension and bending. Int. J. Fatigue 2004, 129, 239–264. [Google Scholar] [CrossRef]
- Yang, F.P.; Kuang, Z.B.; Shlyannikov, V.N. Fatigue crack growth for straight-fronted edge crack in a round bar. Int. J. Fatigue 2006, 28, 431–437. [Google Scholar] [CrossRef]
- Cai, C.Q.; Shin, C.S. A normalized area-compliance method for monitoring surface crack development in a cylindrical rod. Int. J. Fatigue 2005, 27, 801–809. [Google Scholar] [CrossRef]
- Liu, C.; Chu, S. Prediction of shape change of corner crack by fatigue crack growth circles. Int. J. Fatigue 2015, 75, 80–88. [Google Scholar] [CrossRef]
Figure 1.
Definition of the geometrical parameters for a surface crack in a round bar.
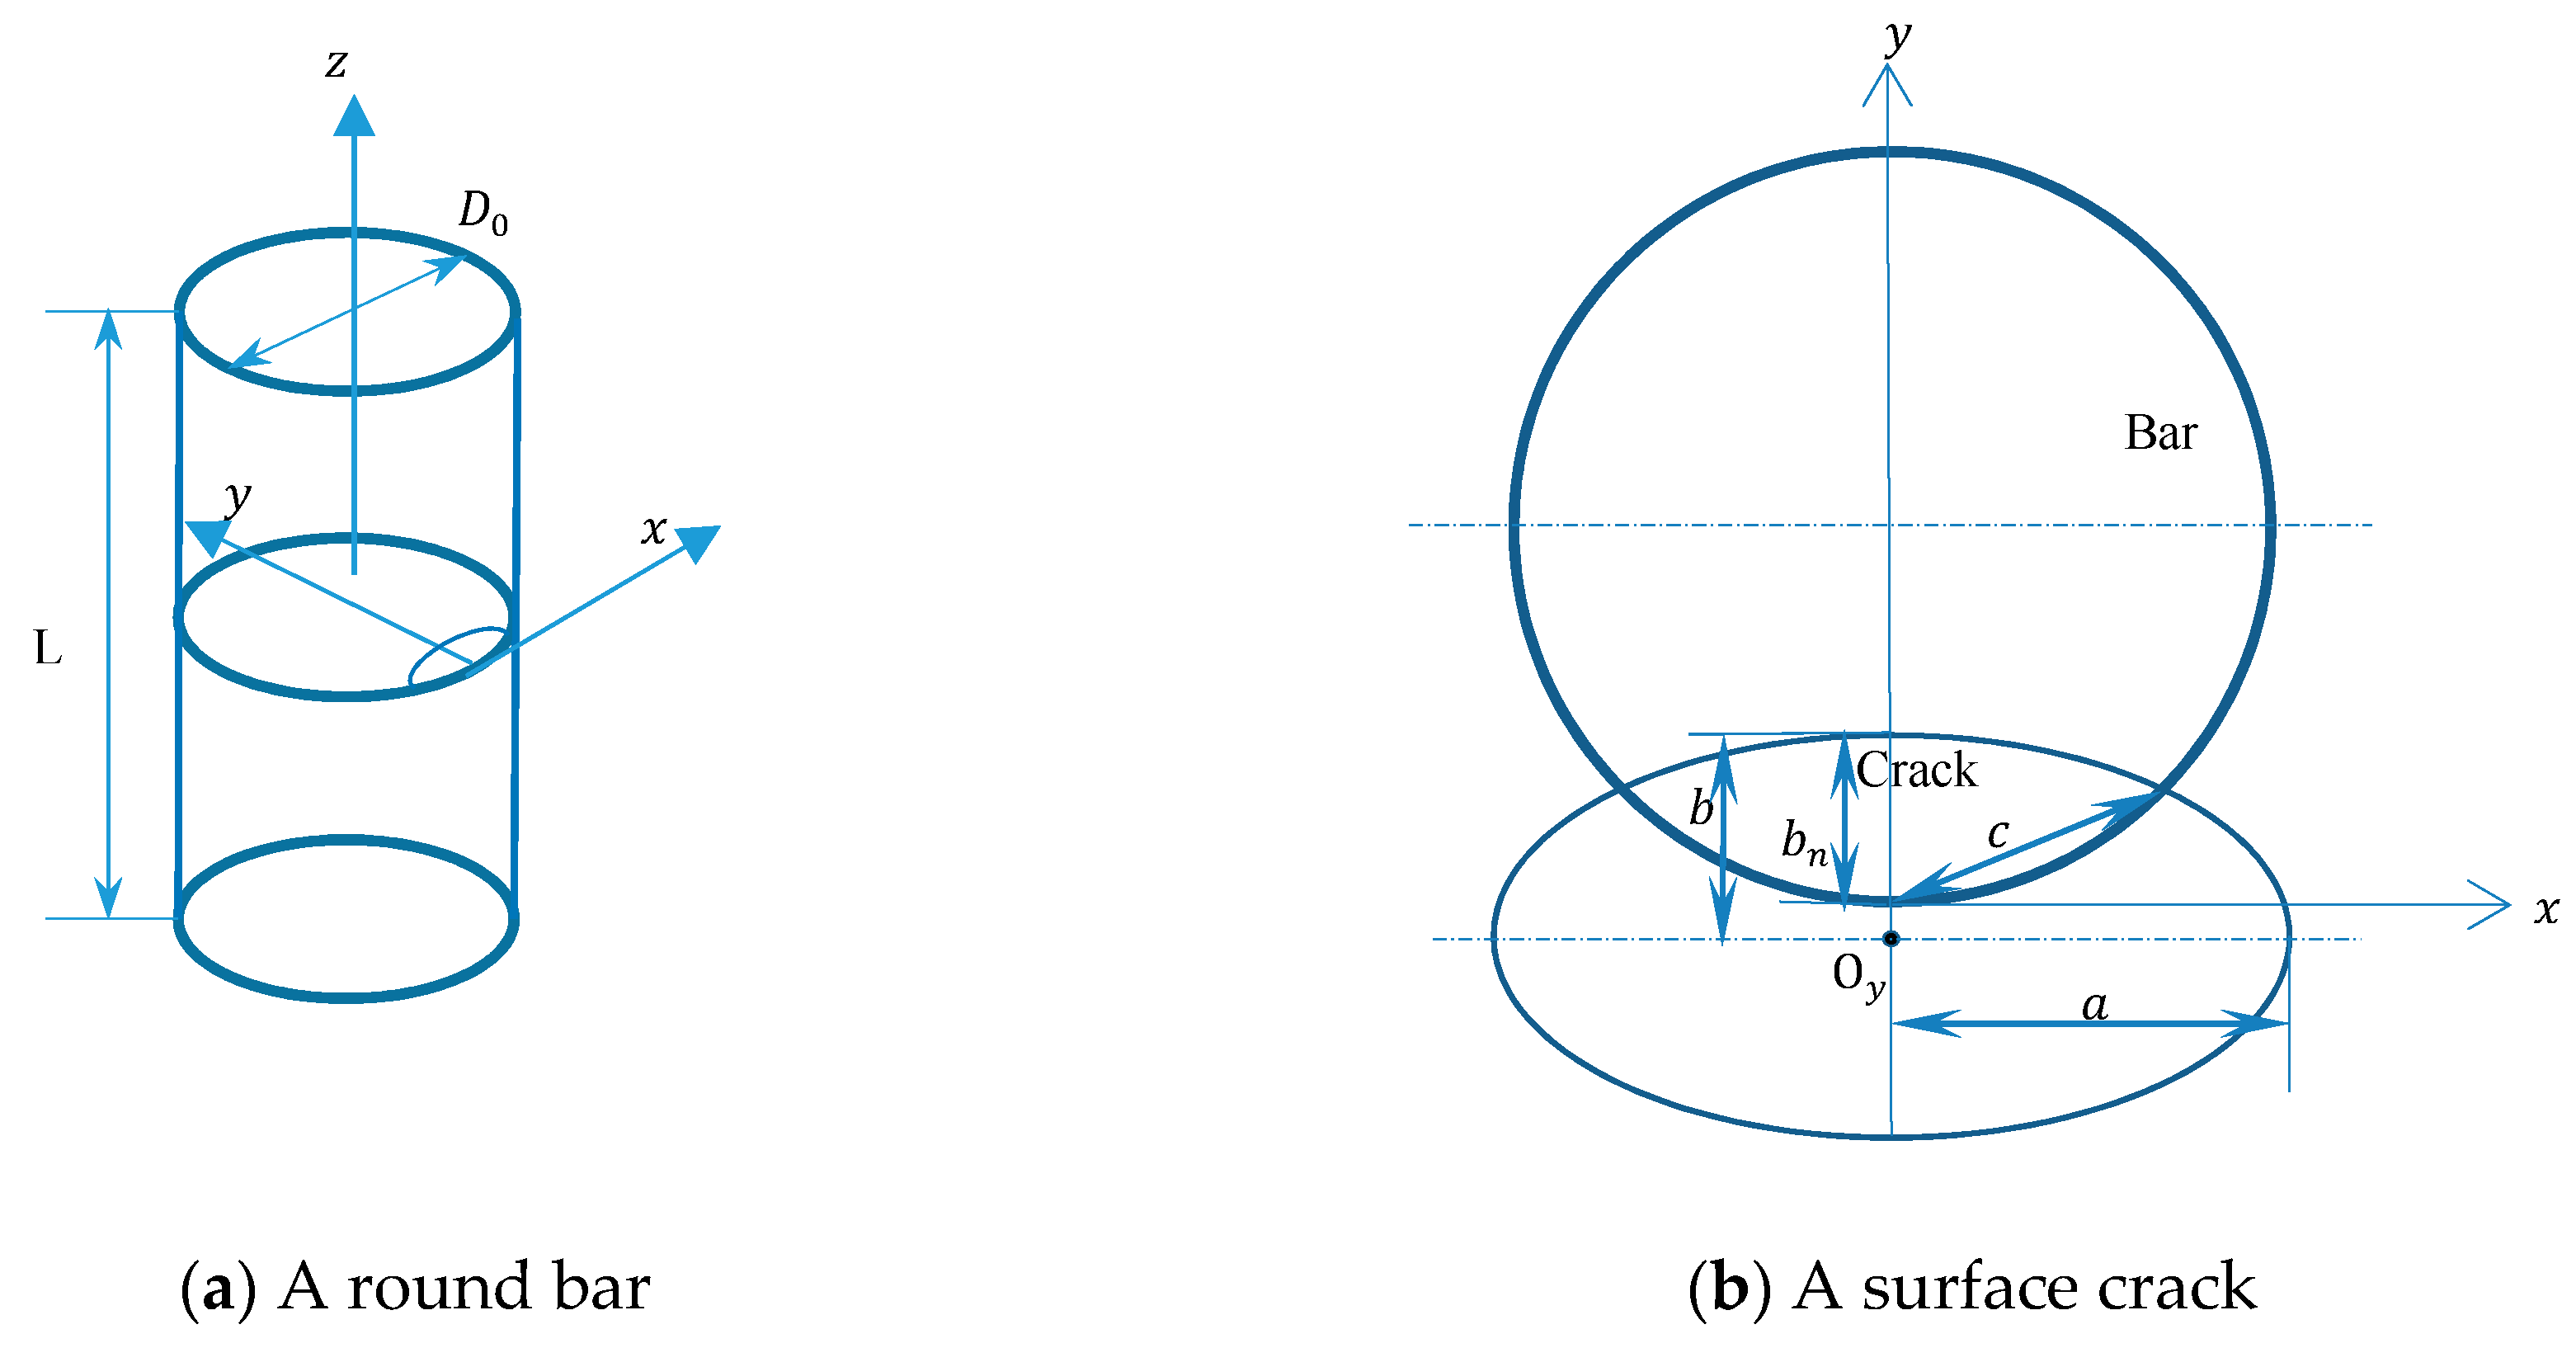
Figure 2.
Determination of a new crack front by fatigue crack growth circles.

Figure 3.
The finite element models of a surface-cracked round bar.
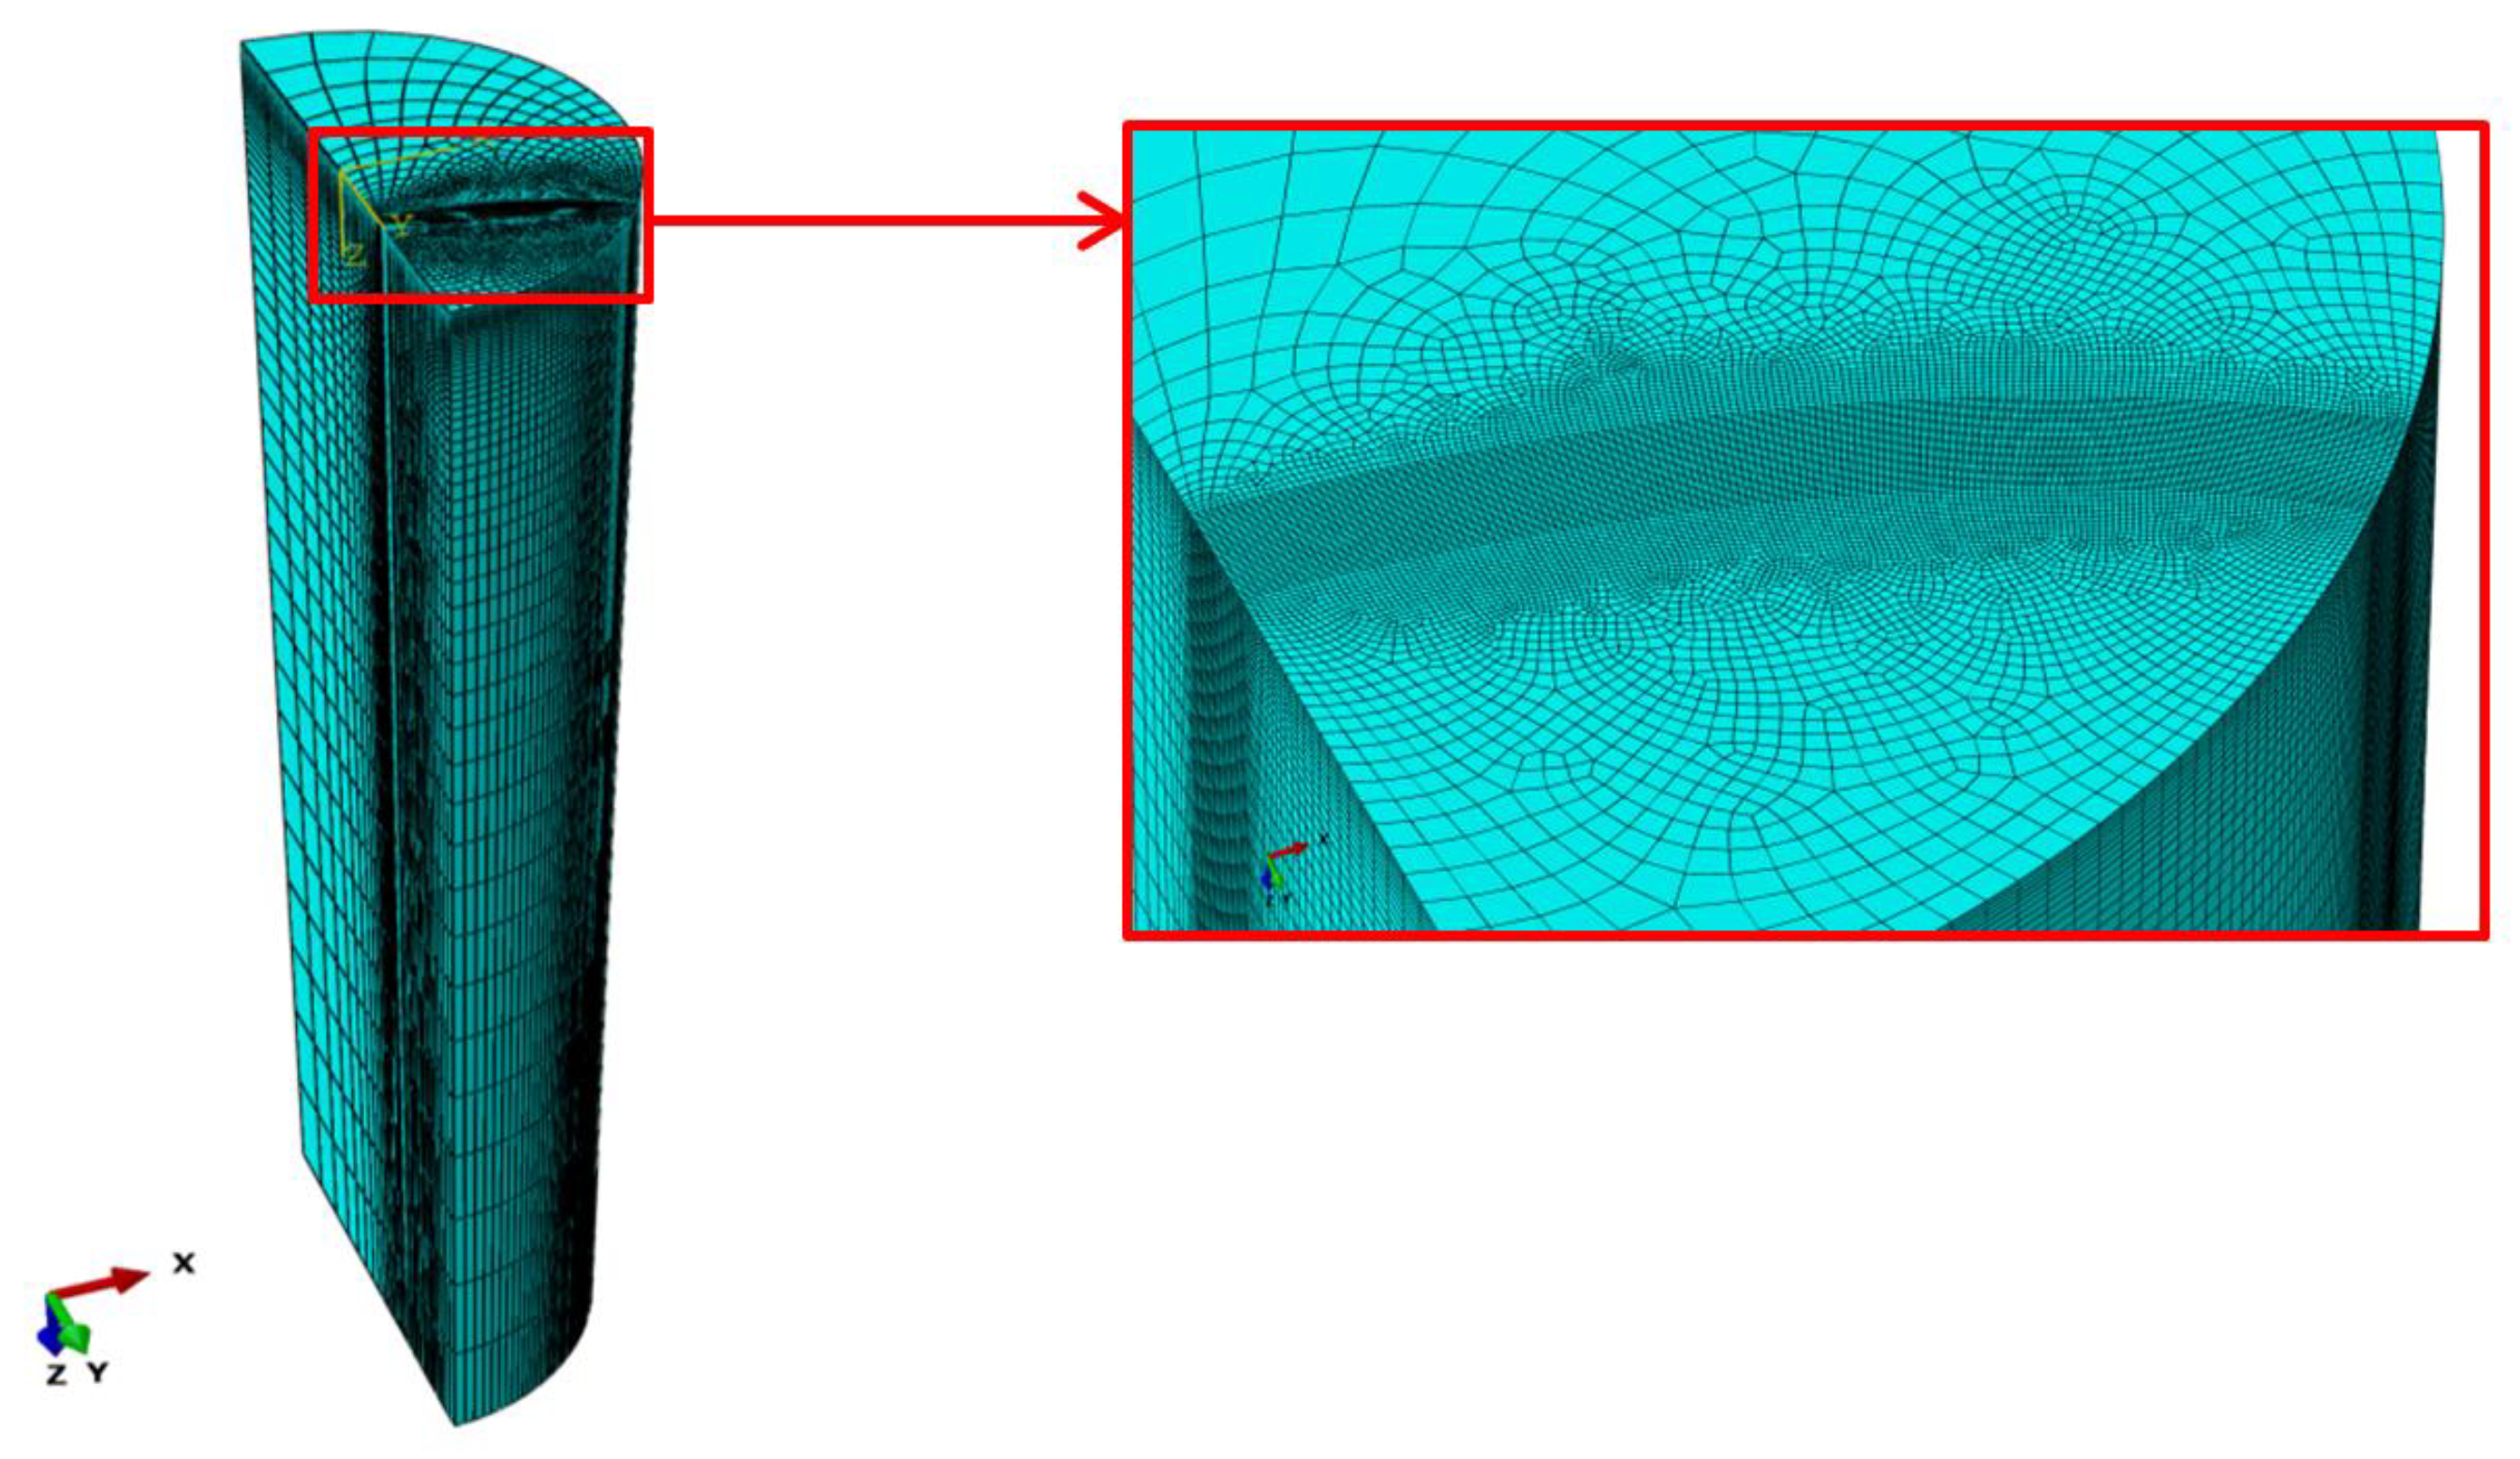
Figure 4.
Successive determination of crack fronts by the crack growth circles with initial crack
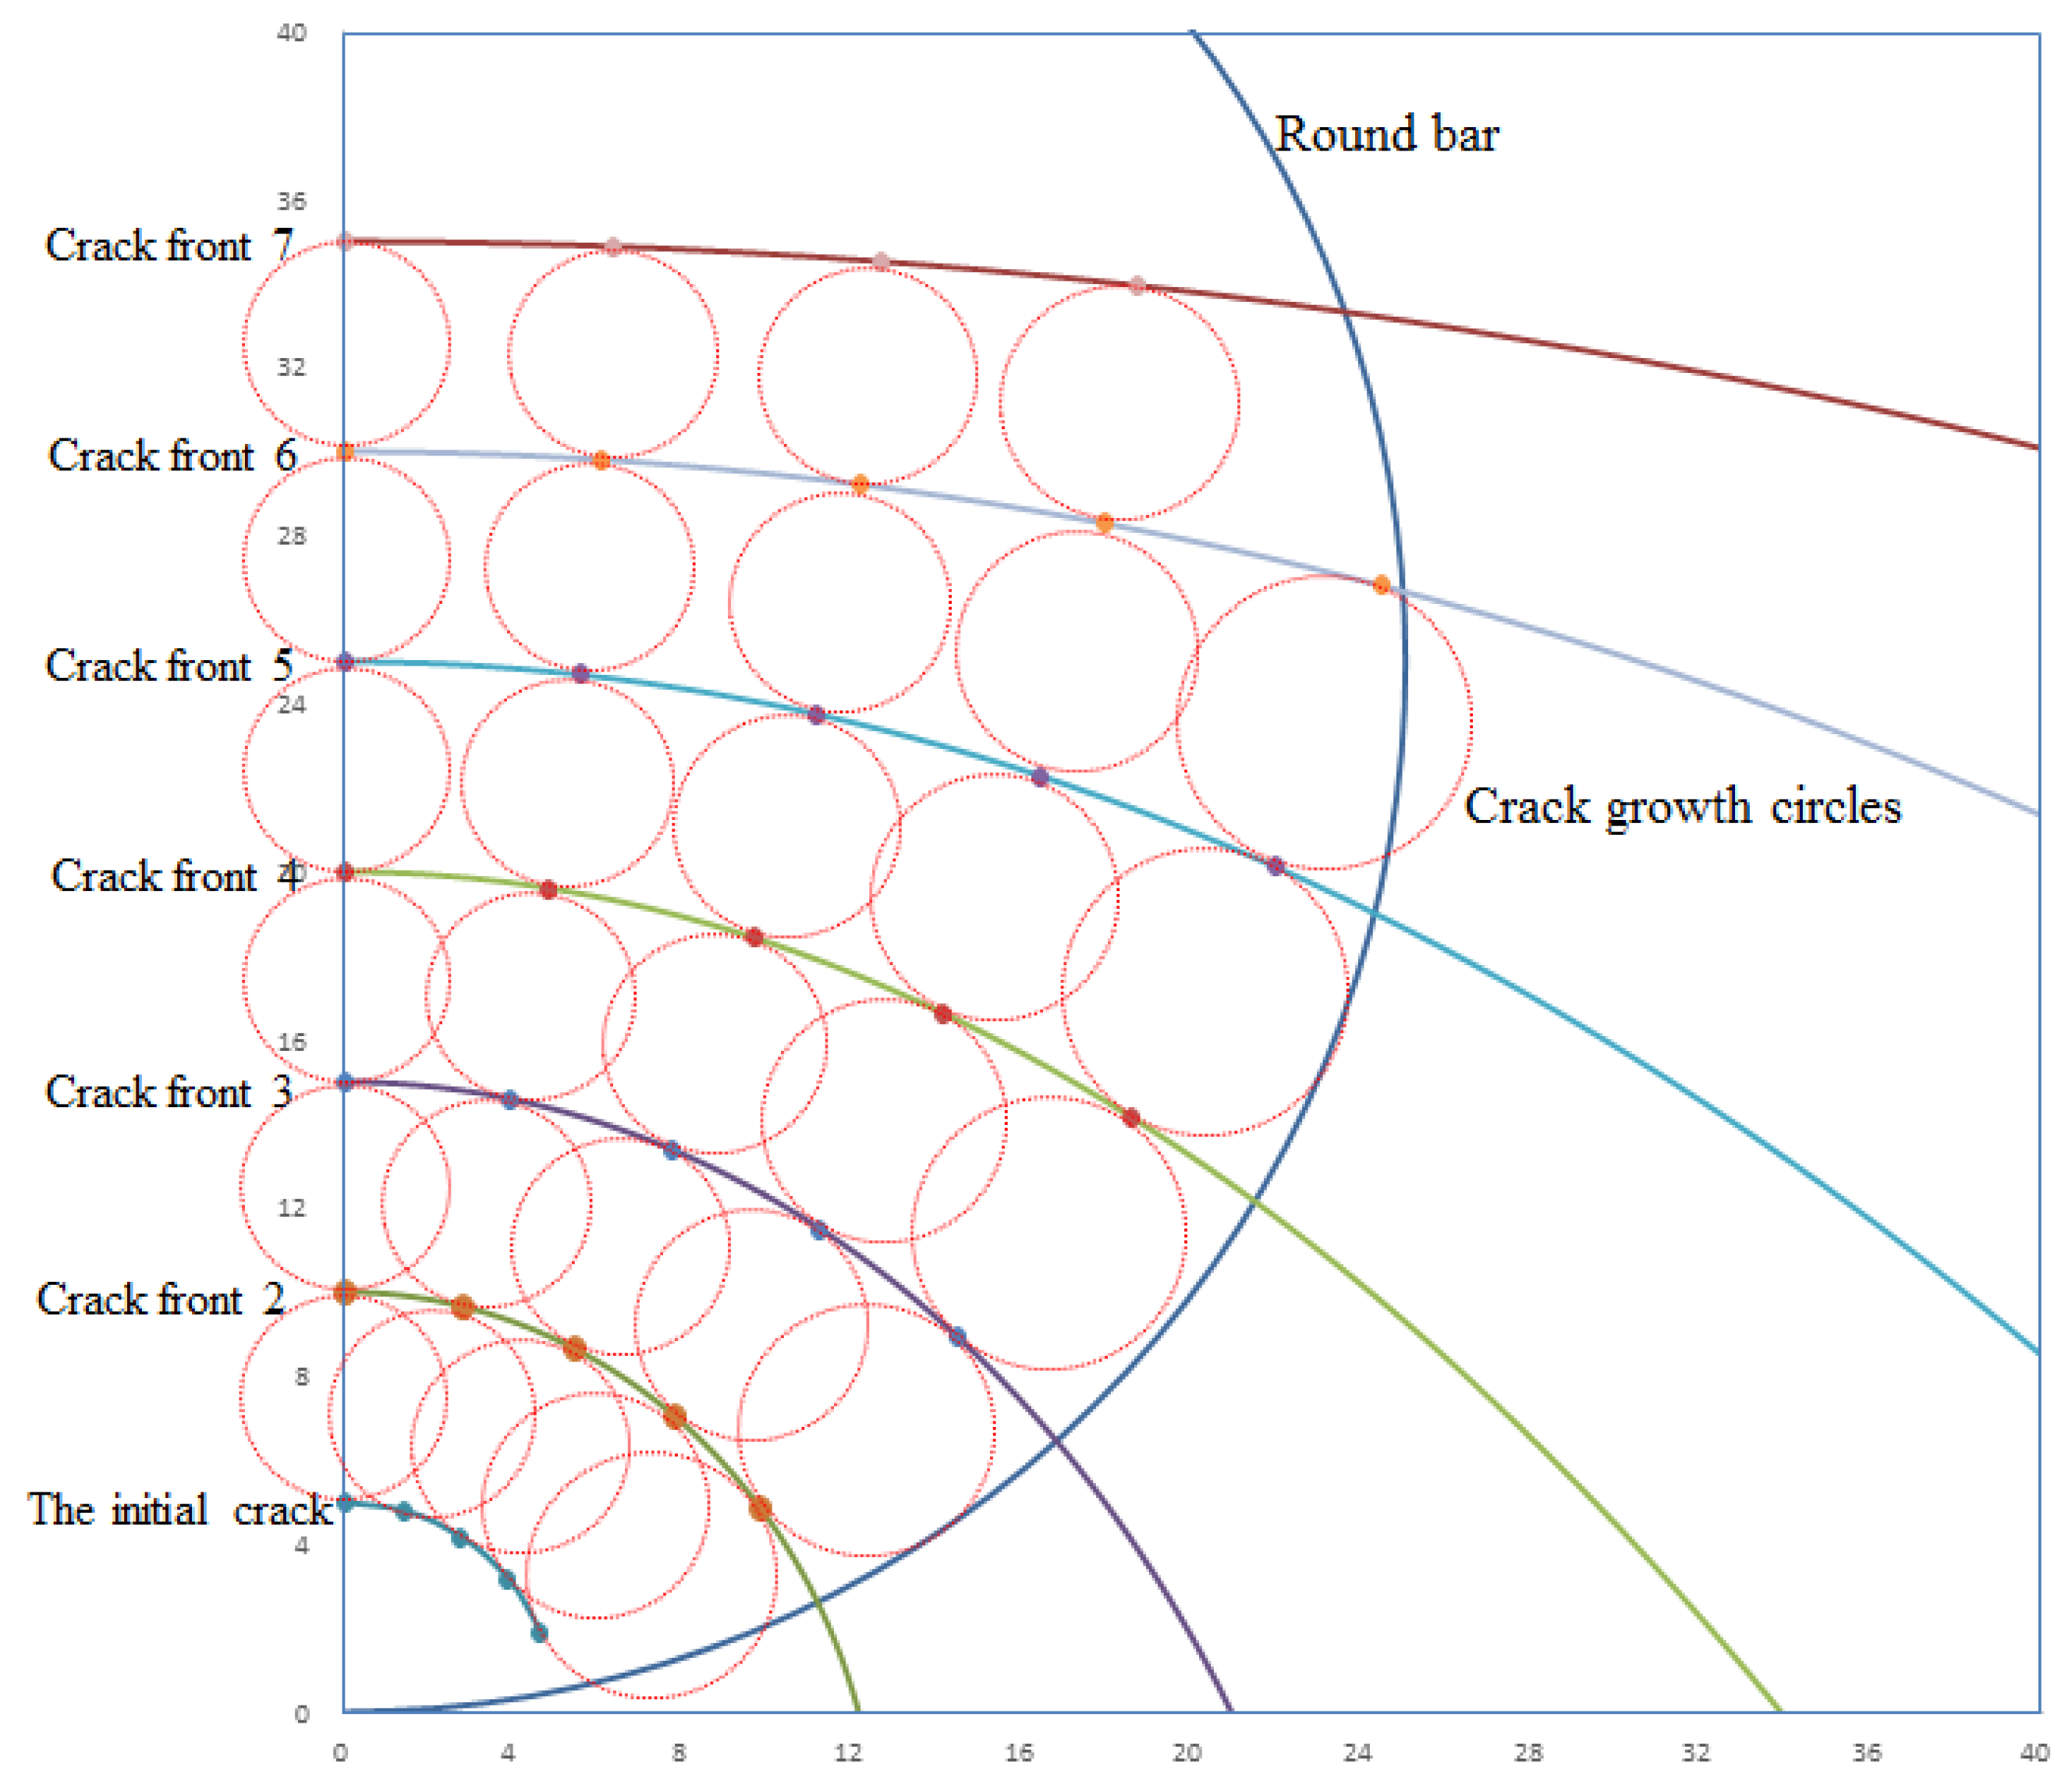
Figure 5.
Ellipses used to determine crack fronts when initial crack
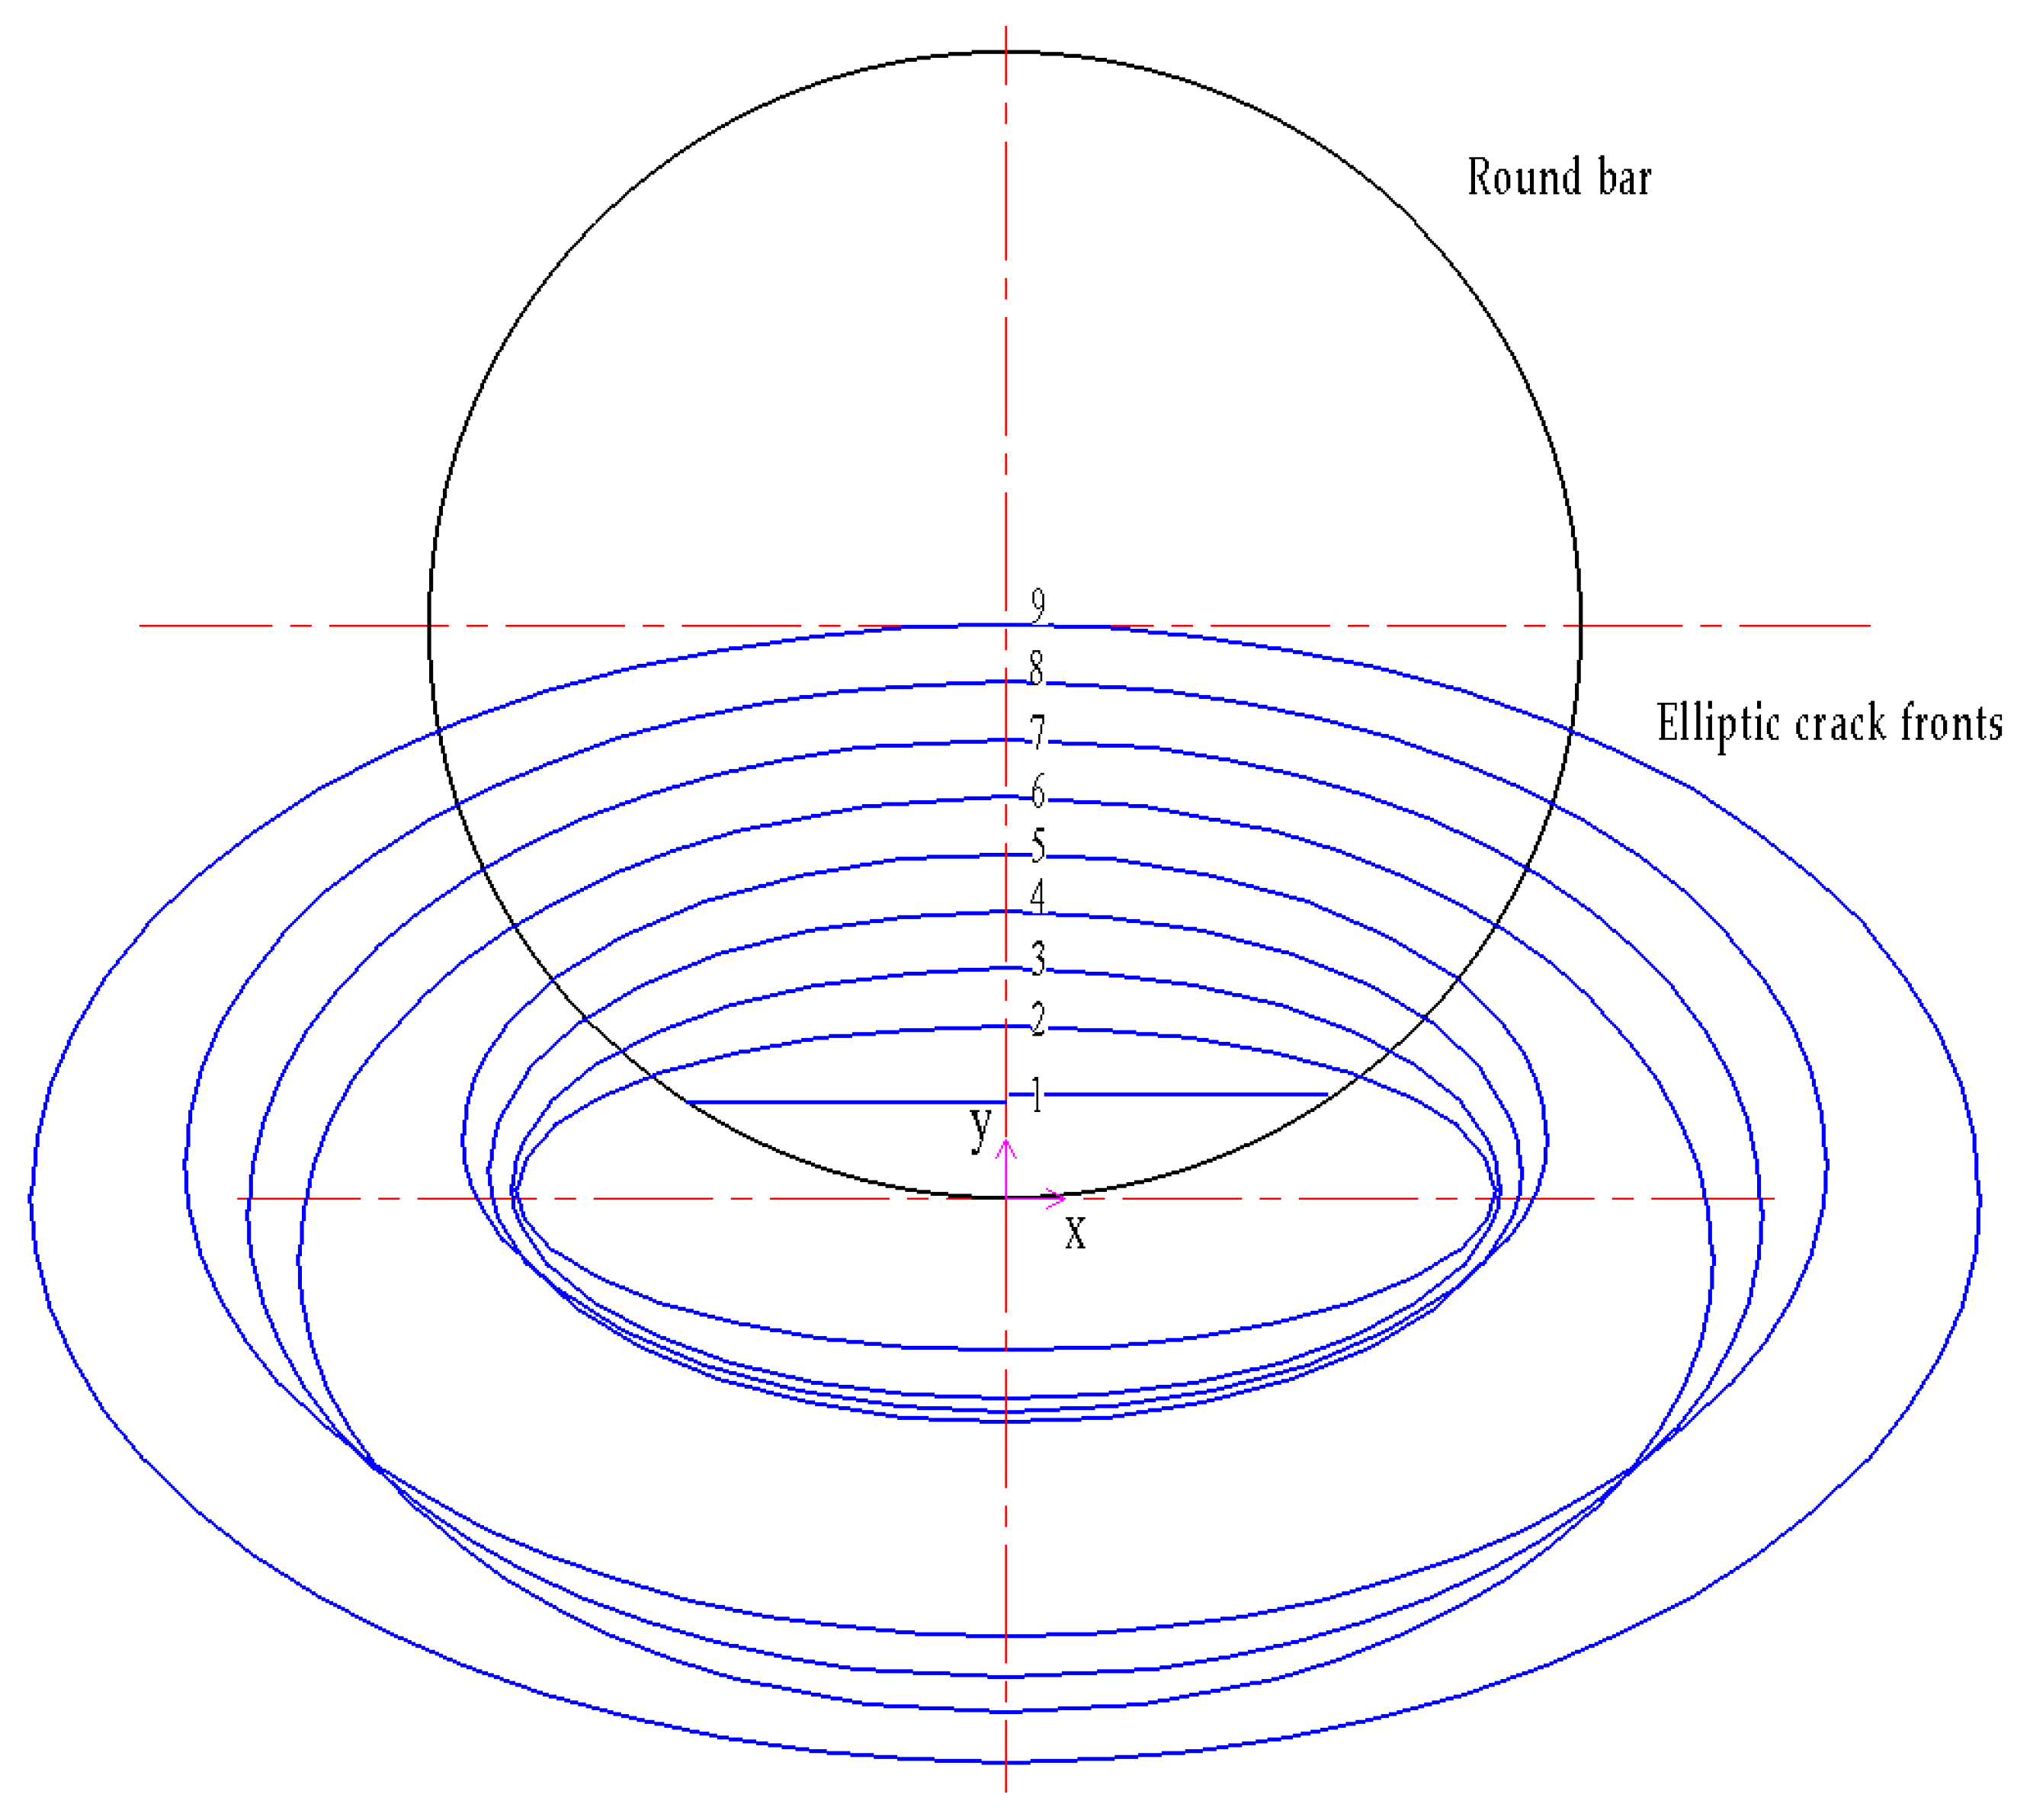
Figure 6.
Crack front as a part of an ellipse.

Figure 7.
Change of actual aspect ratio with the same chord length .
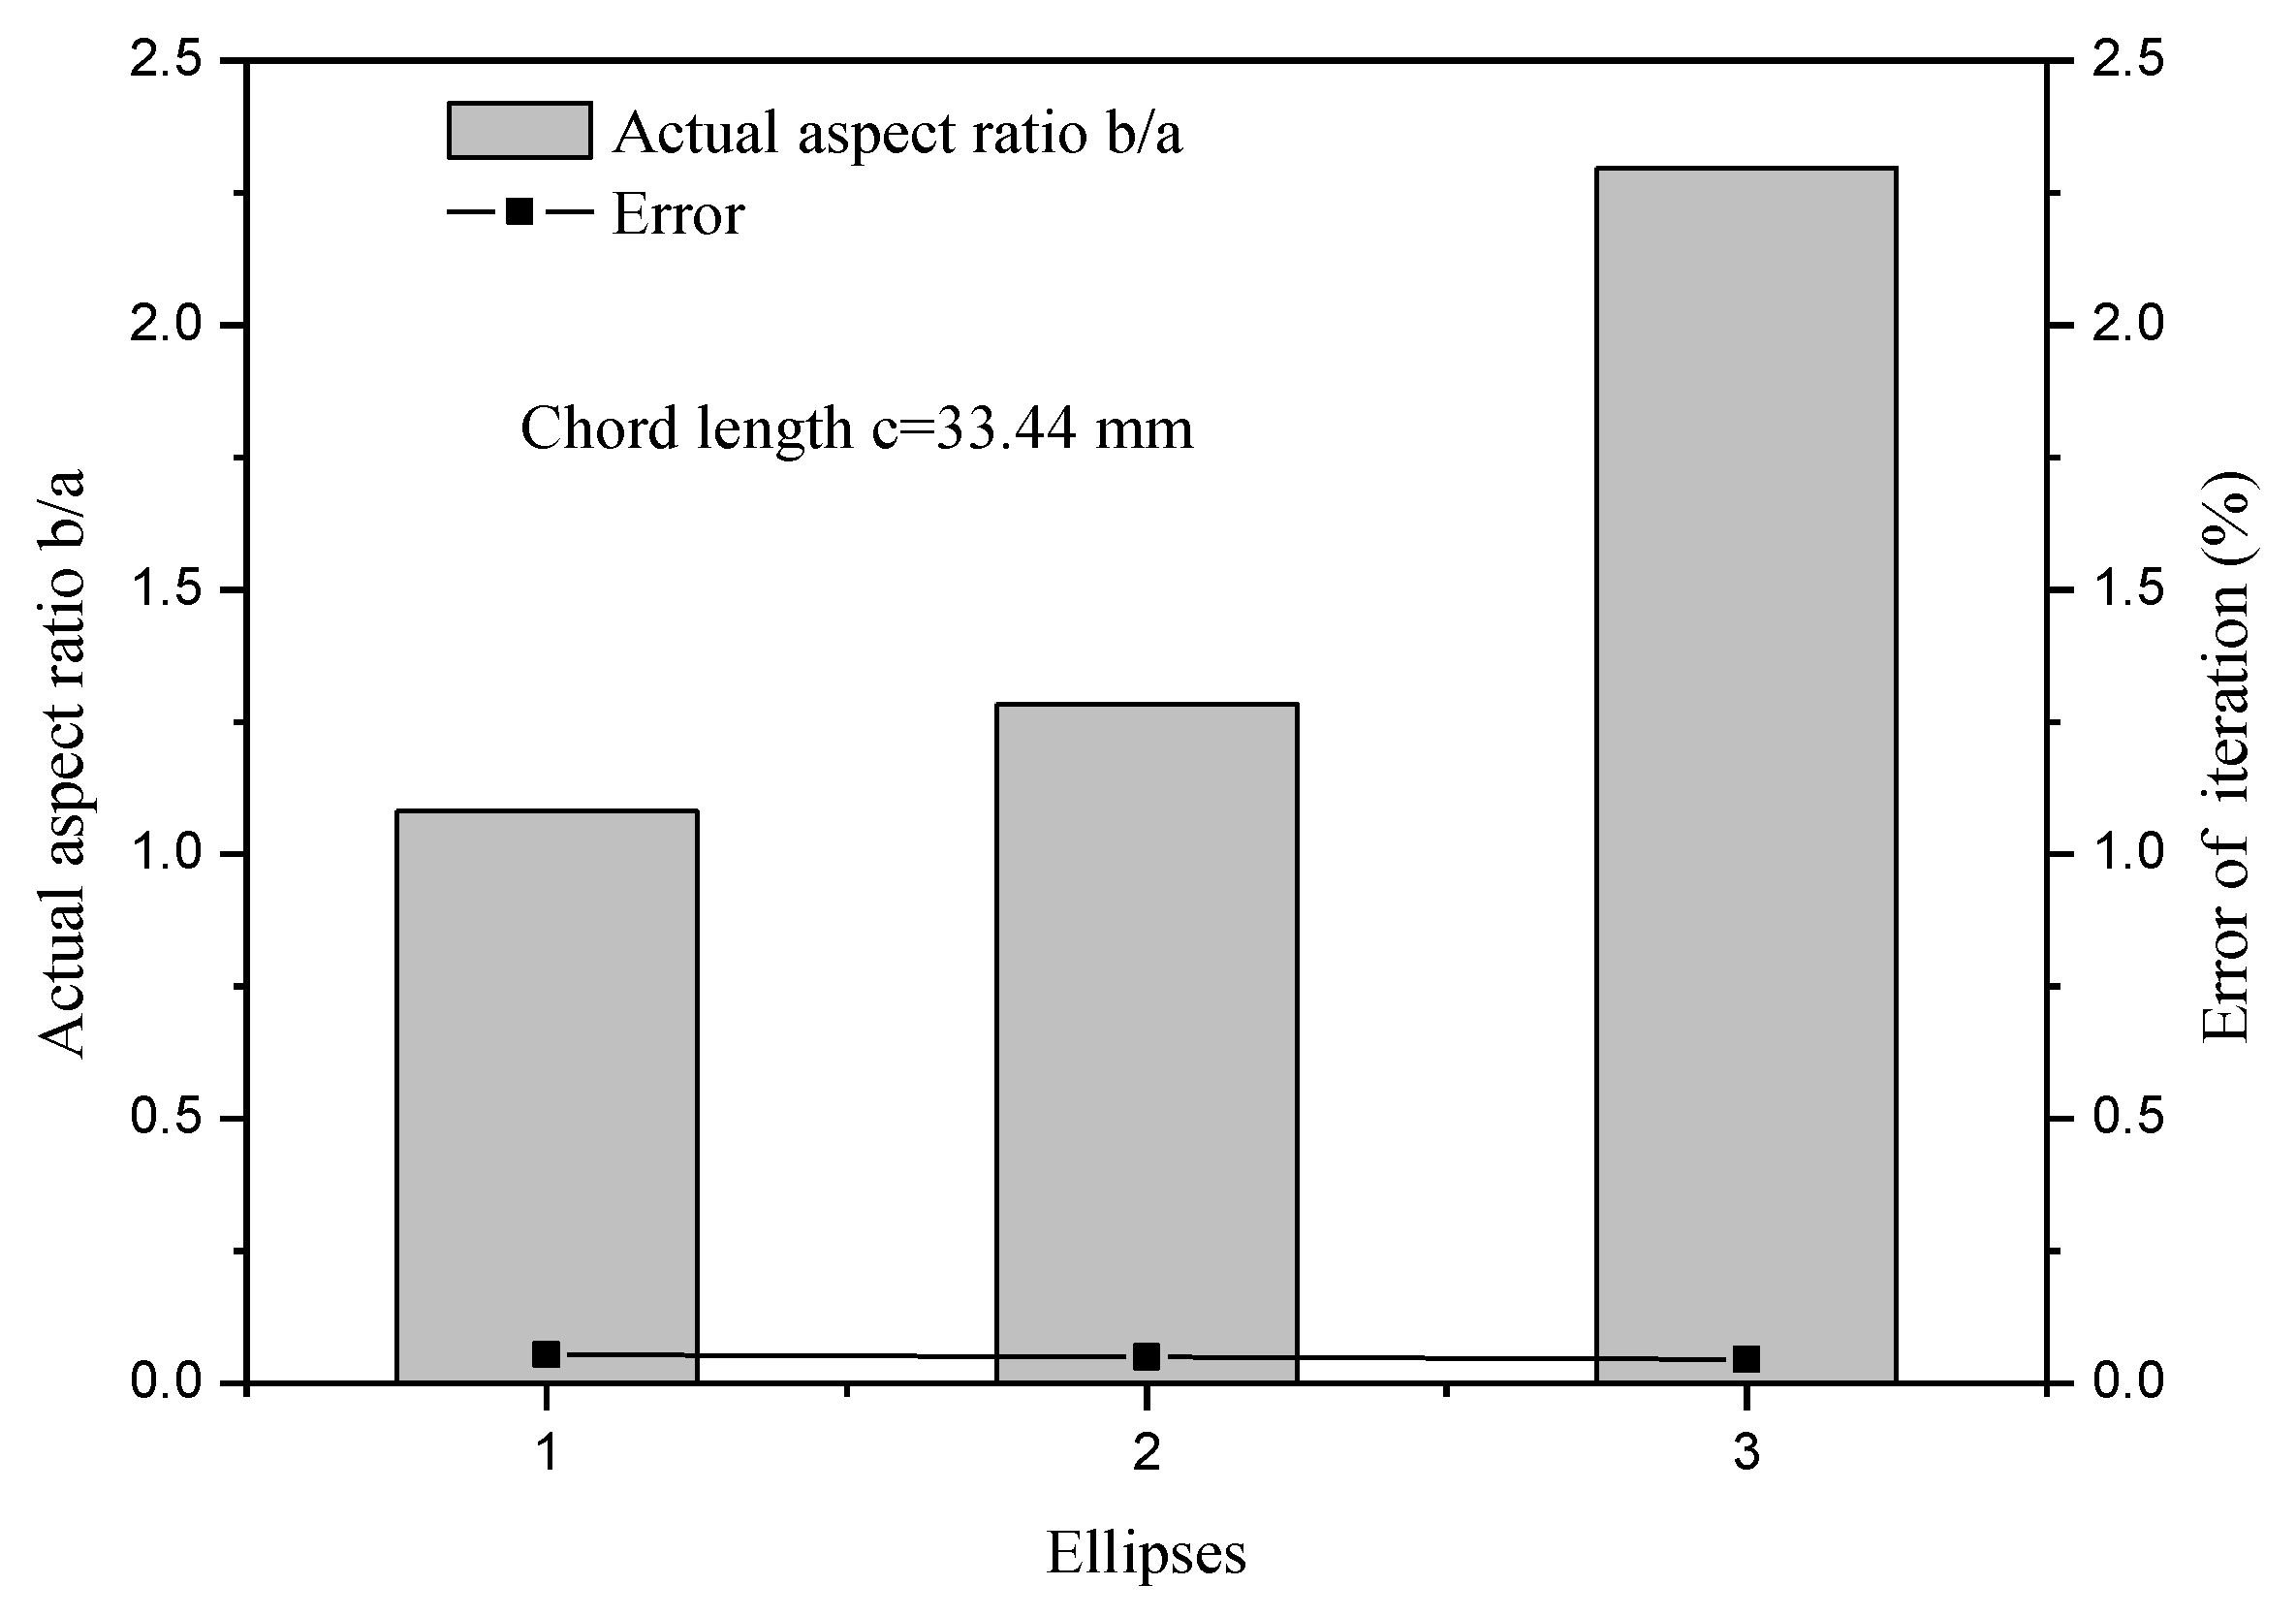
Figure 8.
Shape change of different initial crack for different fatigue crack growth exponent values.
Figure 8.
Shape change of different initial crack for different fatigue crack growth exponent values.
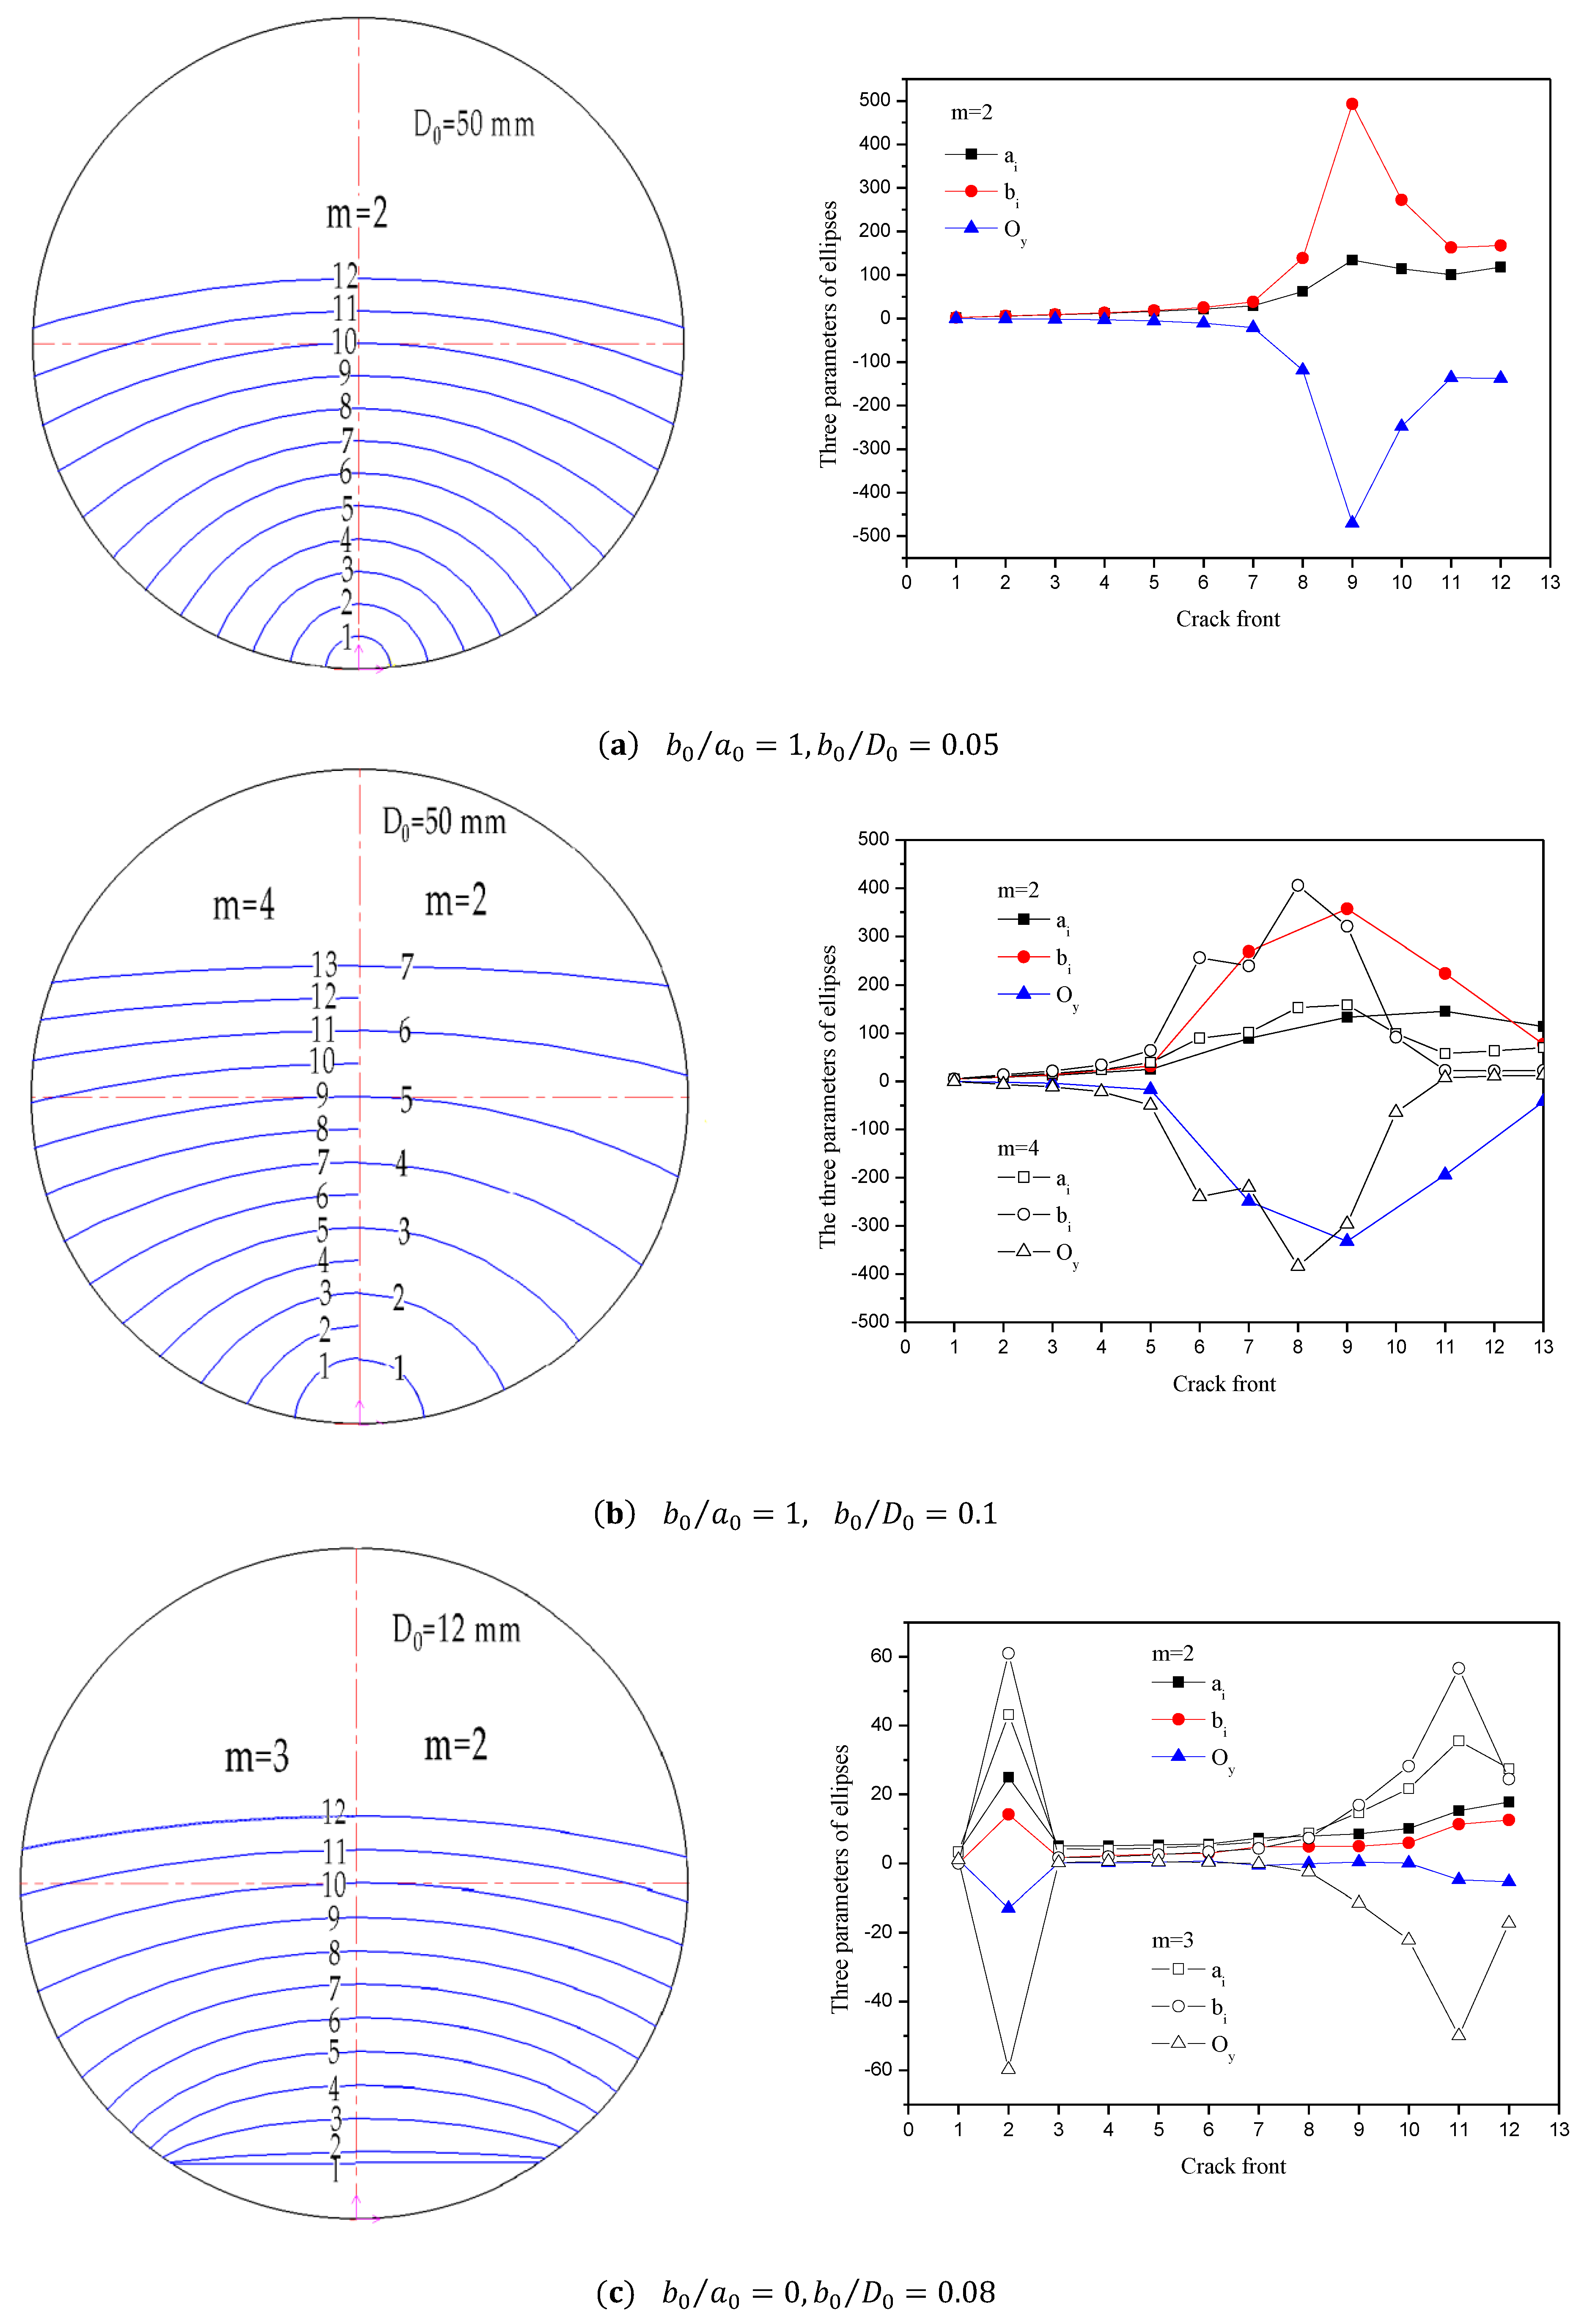
Figure 9.
Nominal aspect ratio vs. relative crack depth.

Figure 10.
Relative crack depth vs. relative chord length with different initial parameters.
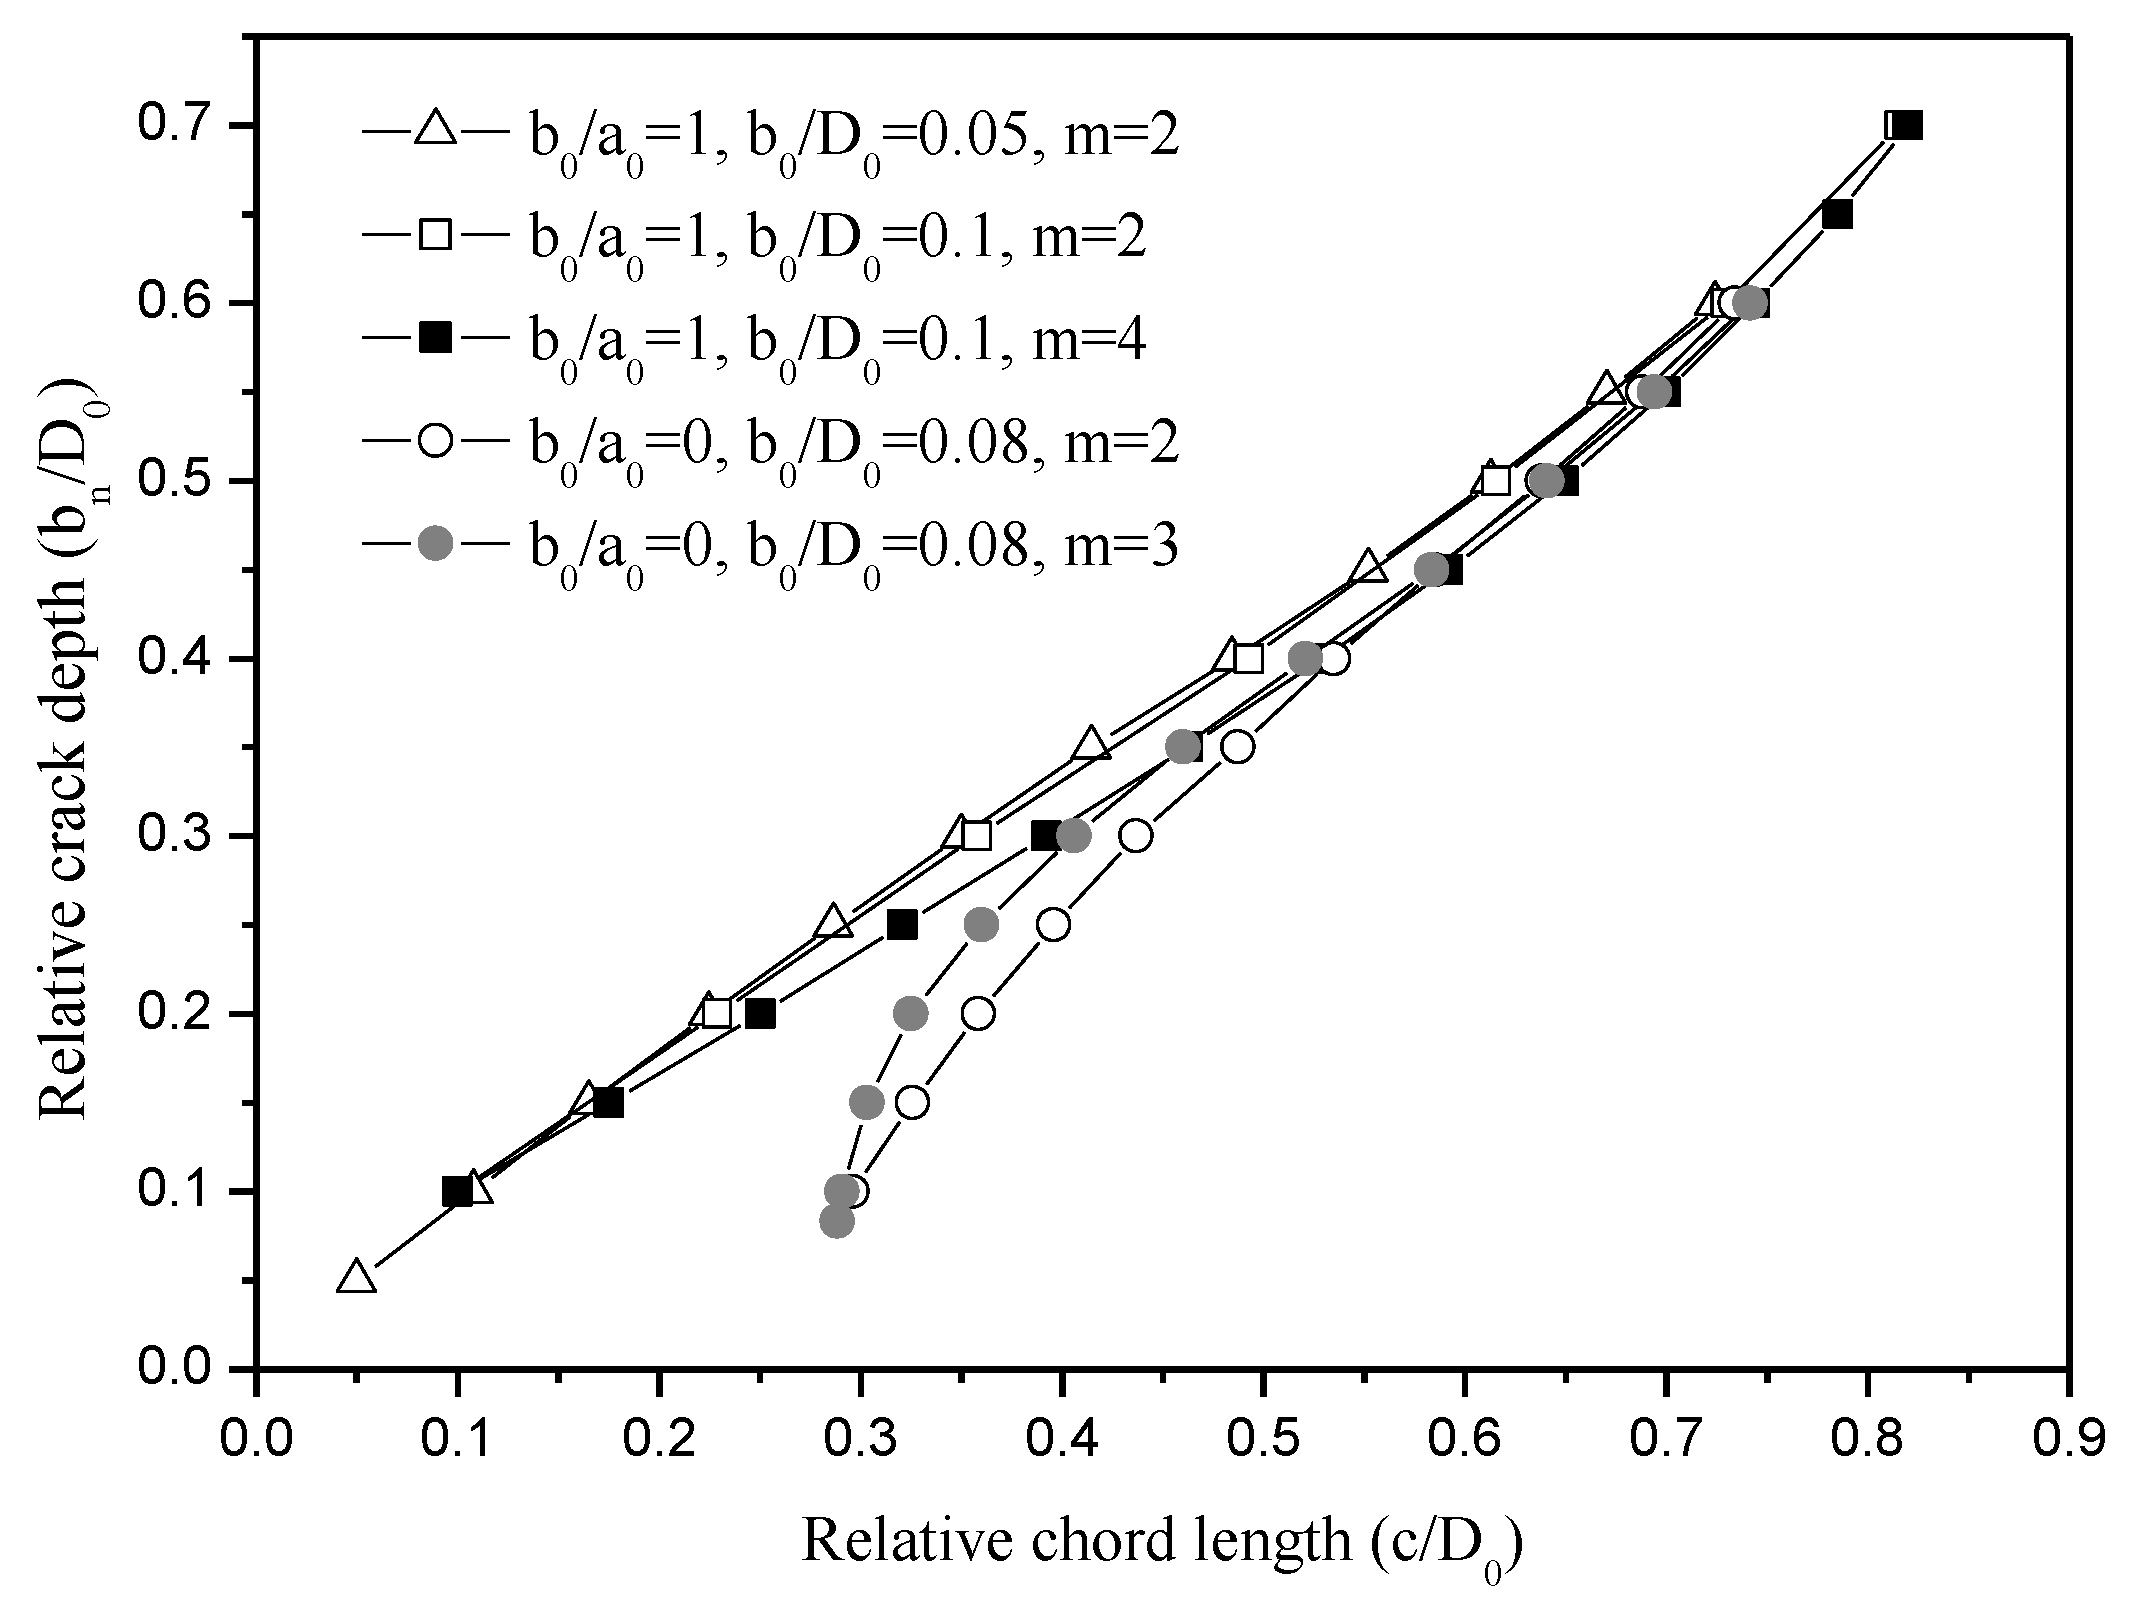
Figure 11.
Ratio of crack growth along the vertical central line and toward the horizontal surface.

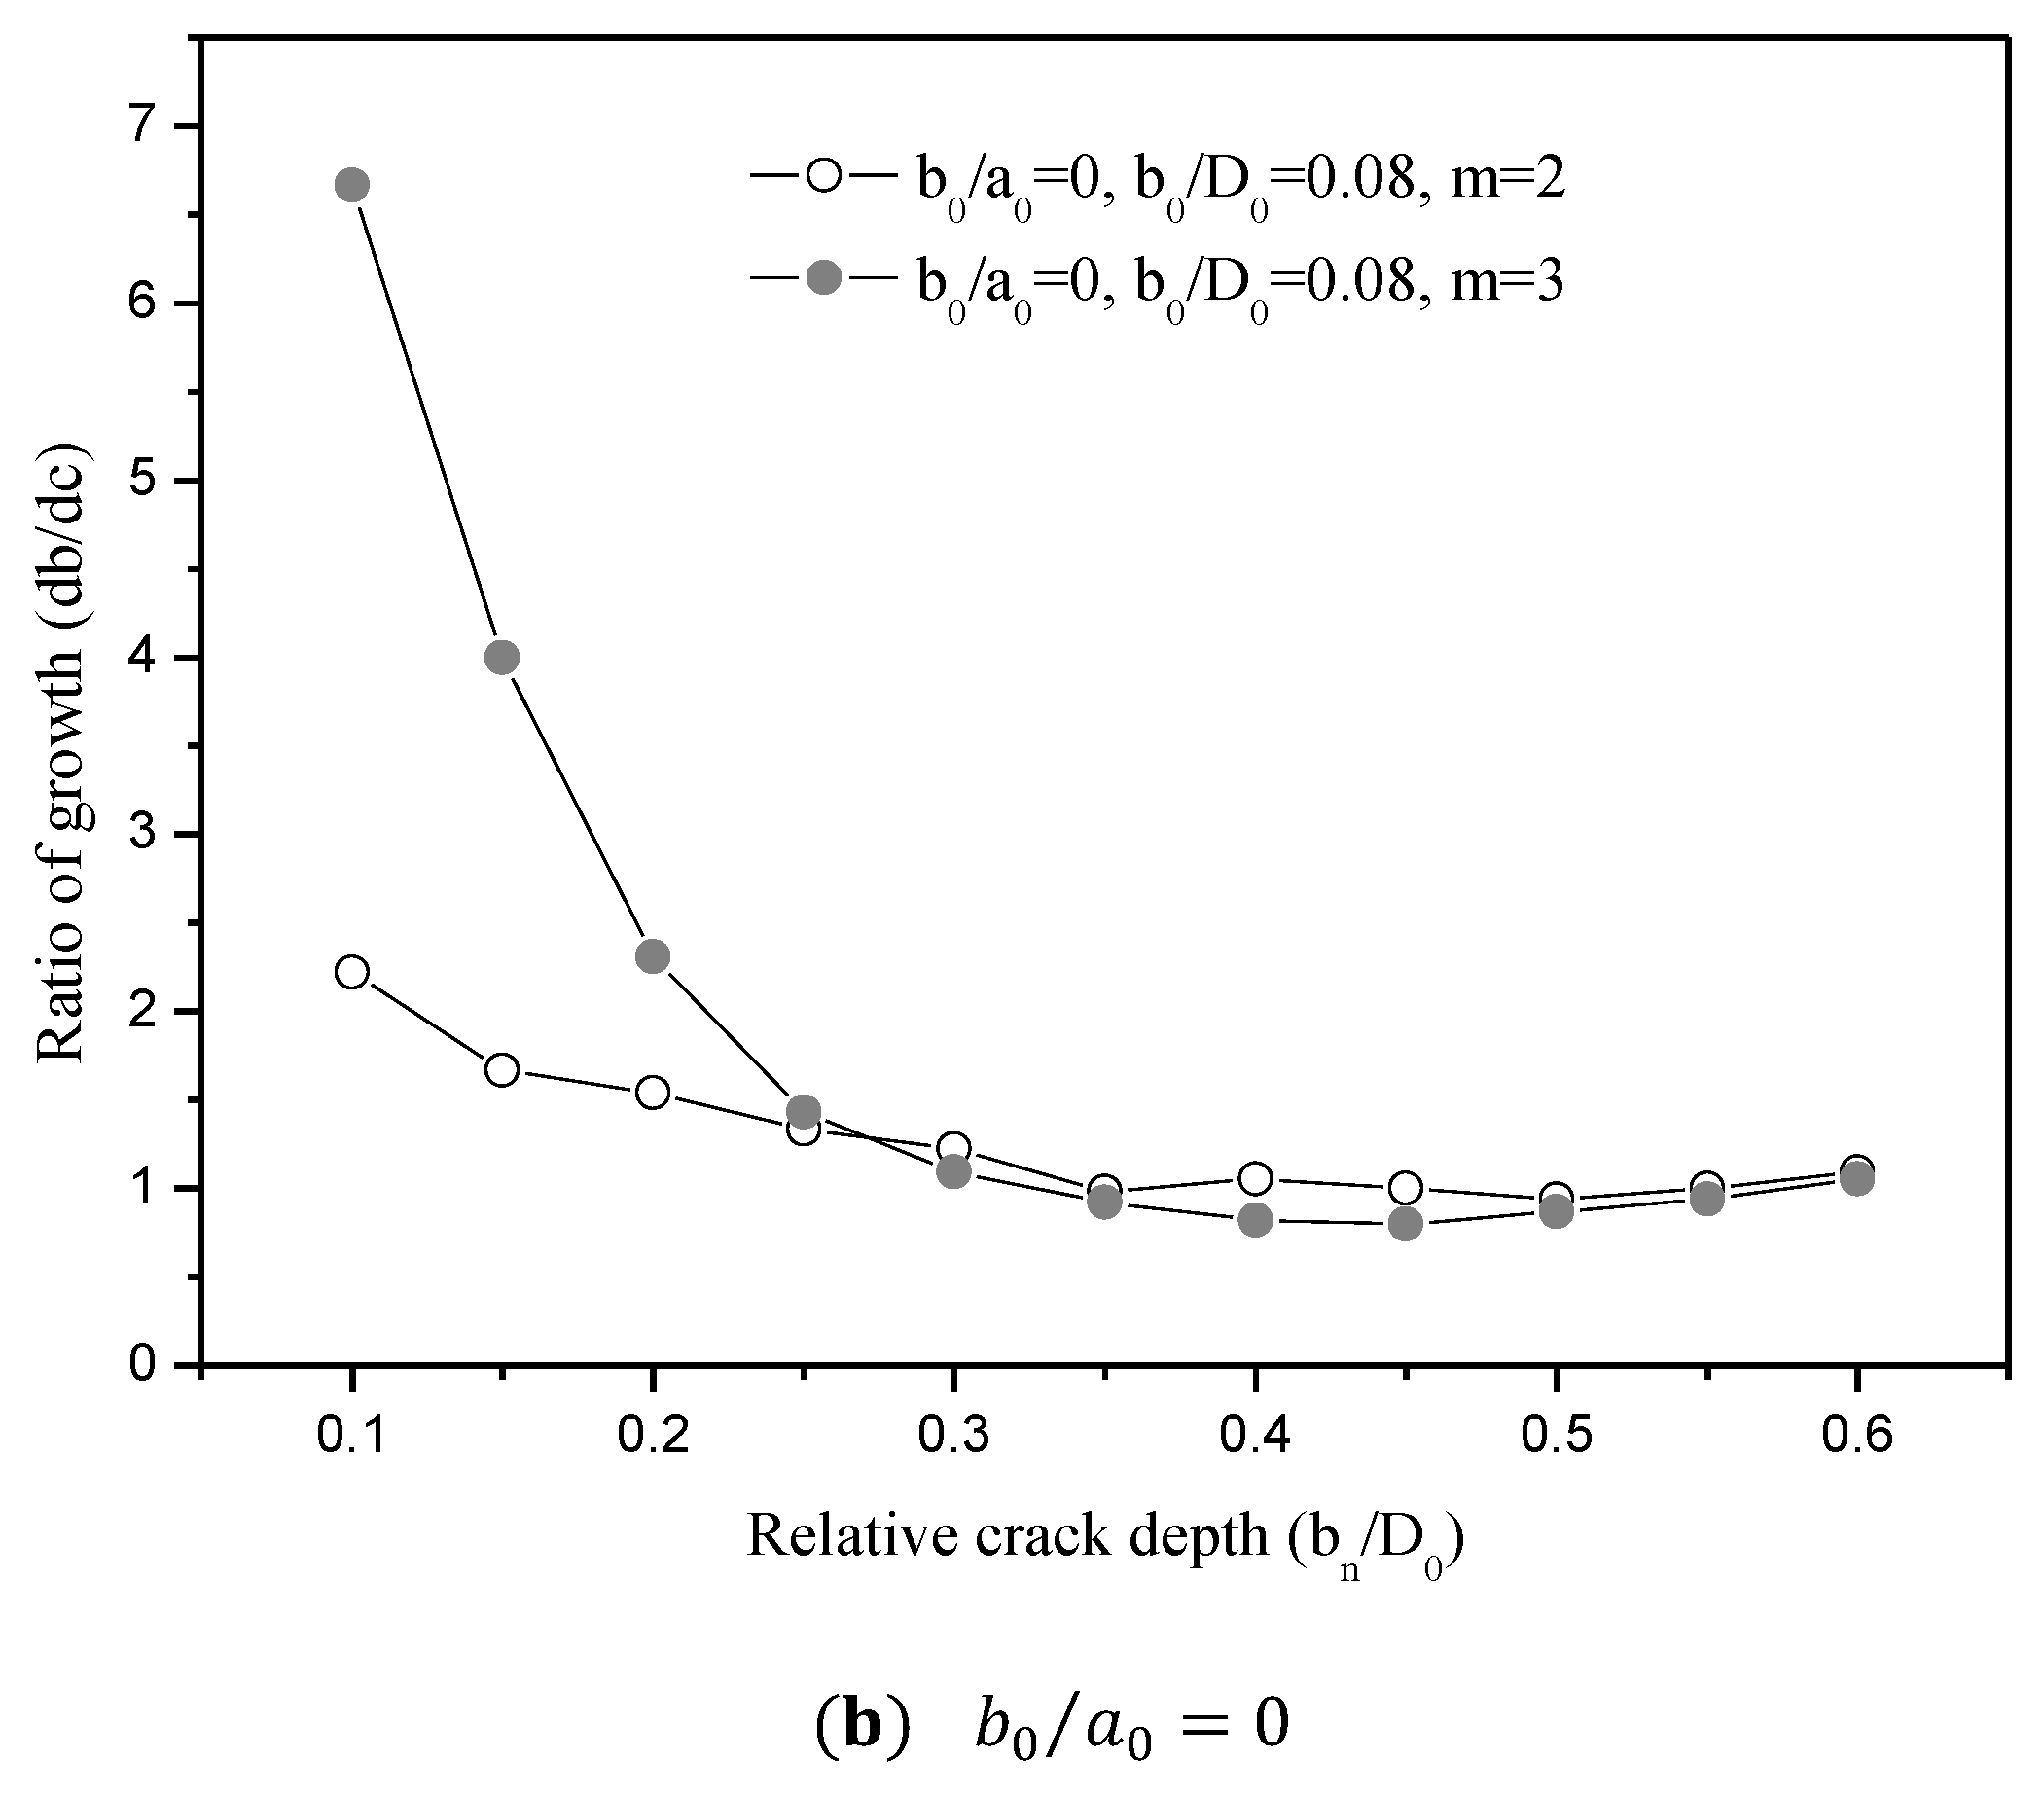
Figure 12.
Crack propagation patterns compared with numerical solutions.
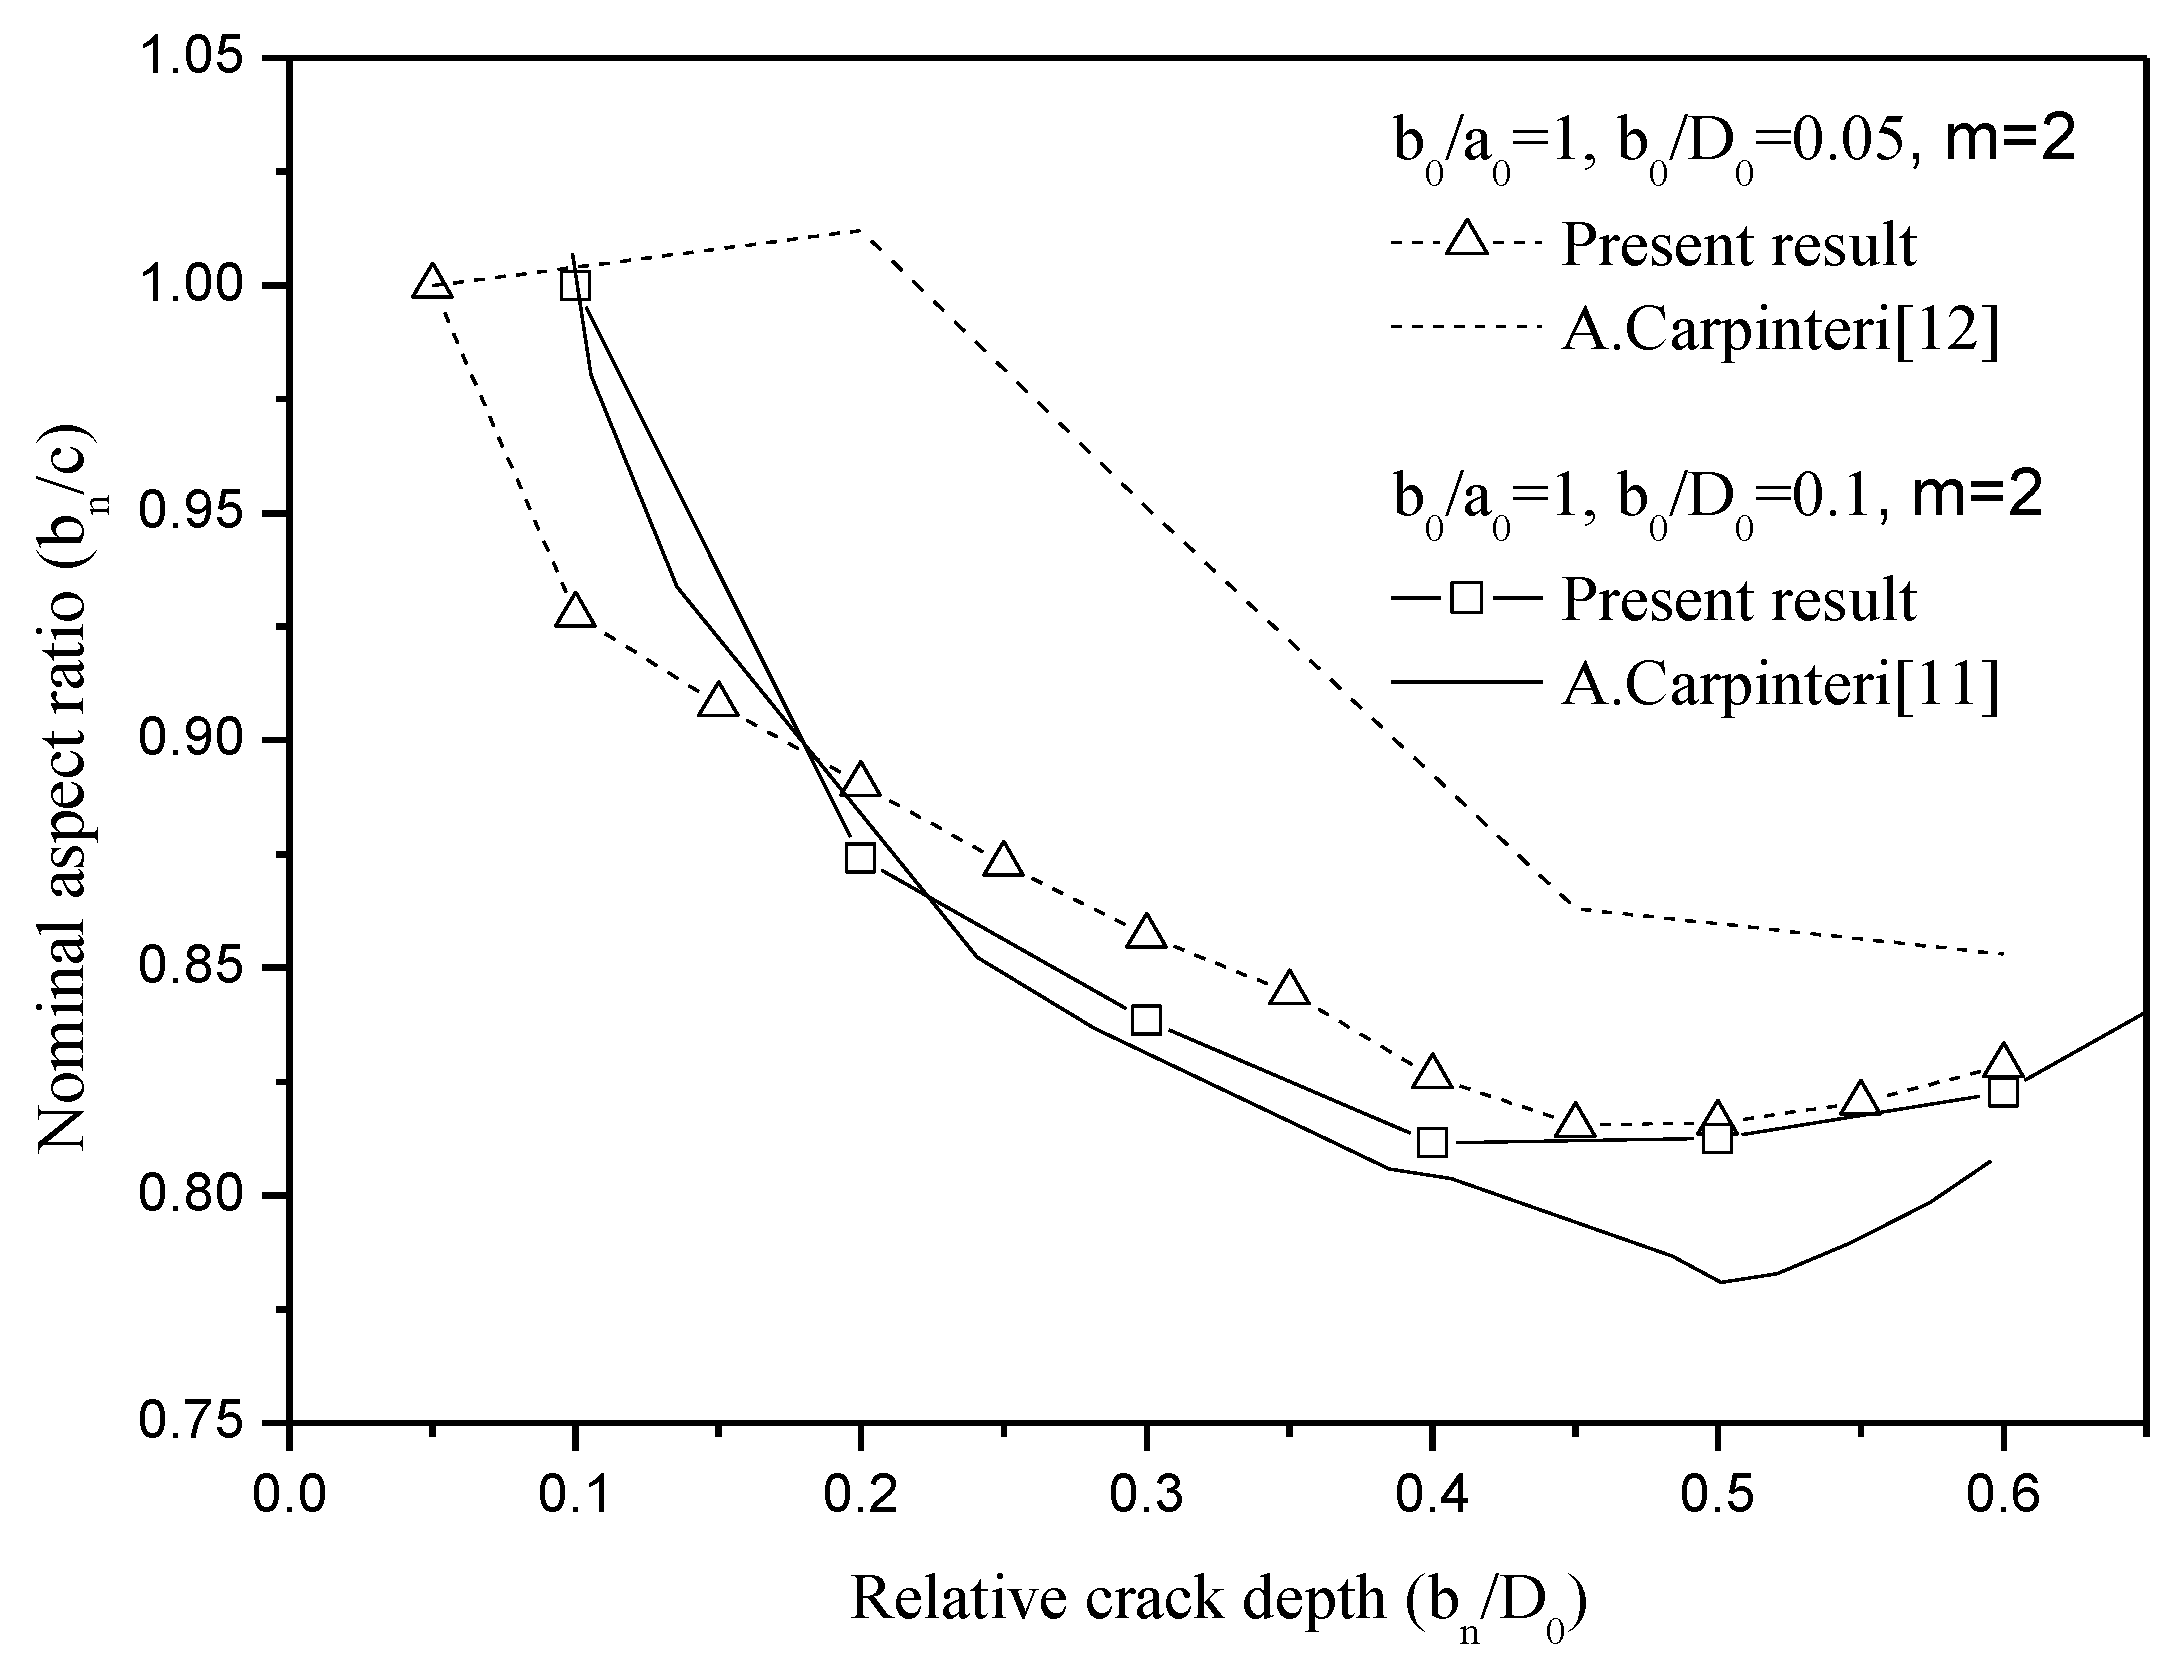
Figure 13.
Relationship of crack propagation with depth and chord length compared with experimental data.
Figure 13.
Relationship of crack propagation with depth and chord length compared with experimental data.

Figure 14.
Crack propagation patterns compared with experimental data.


Table 1.
Material parameters for steel S45.
| Monotonic Tensile Yield Strength | Nominal Ultimate Tensile Strength | True Ultimate Tensile Strength | Young’s Modulus | Poisson’s Ratio | Crack Growth Parameter |
|---|---|---|---|---|---|
| 2.06 × 10⁵ MPa | 0.33 | 3 |
© 2019 by the authors. Licensee MDPI, Basel, Switzerland. This article is an open access article distributed under the terms and conditions of the Creative Commons Attribution (CC BY) license (http://creativecommons.org/licenses/by/4.0/).
Share and Cite
MDPI and ACS Style
Yang, Y.; Chu, S.; Chen, H. Prediction of Shape Change for Fatigue Crack in a Round Bar Using Three-Parameter Growth Circles. Appl. Sci. 2019, 9, 1751. https://doi.org/10.3390/app9091751
AMA Style
Yang Y, Chu S, Chen H. Prediction of Shape Change for Fatigue Crack in a Round Bar Using Three-Parameter Growth Circles. Applied Sciences. 2019; 9(9):1751. https://doi.org/10.3390/app9091751
Chicago/Turabian StyleYang, Yali, Seokjae Chu, and Hao Chen. 2019. "Prediction of Shape Change for Fatigue Crack in a Round Bar Using Three-Parameter Growth Circles" Applied Sciences 9, no. 9: 1751. https://doi.org/10.3390/app9091751
Note that from the first issue of 2016, this journal uses article numbers instead of page numbers. See further details here.