Modeling the Genetic Basis of Individual Differences in Susceptibility to Gulf War Illness


 , , and
Abstract
1. Introduction
2. Materials and Methods
2.1. Animals
2.2. Materials
3. Experimental Design
3.1. Treatment Groups
- Control. Plain tap water for fluid, saline injection and euthanized 6h after injection by cervical dislocation followed by decapitation. The brain was removed, and the frontal cortex dissected, weighed and placed on dry ice and stored at −80 °C until assay for cytokine gene expression.
- CORT group. These animals received tap water containing 20 mg% CORT dissolved in 0.6% (v/v) EtOH vehicle for 8 days. On the 8th day, the animals were injected with saline, euthanized 6h after injection by cervical dislocation followed by decapitation. The brain was removed, and the frontal cortex dissected, weighed and placed on dry ice and stored at −80 °C until assay for cytokine gene expression.
- DFP group. These animals received plain tap water for fluid and were injected with 4 mg/kg DFP, i.p. 6 h after injection, the animals were euthanized by cervical dislocation followed by decapitation. The brain was removed, and the frontal cortex dissected, weighed and placed on dry ice and stored at −80 °C until assay for cytokine gene expression.
- CORT-DFP (C + D), group. These animals received tap water containing 20 mg% CORT dissolved in 0.6% (v/v) EtOH vehicle for 8 days. On the 8th day, the animals were injected with 4 mg/kg DFP, i.p. 6 h after injection, and the animals were euthanized by cervical dislocation followed by decapitation. The brain was removed, and the frontal cortex dissected, weighed and placed on dry ice and stored at -80 °C until assay for cytokine gene expression.
3.2. RNA Isolation, cDNA Synthesis and rtPCR
3.3. Data Analysis
4. Results
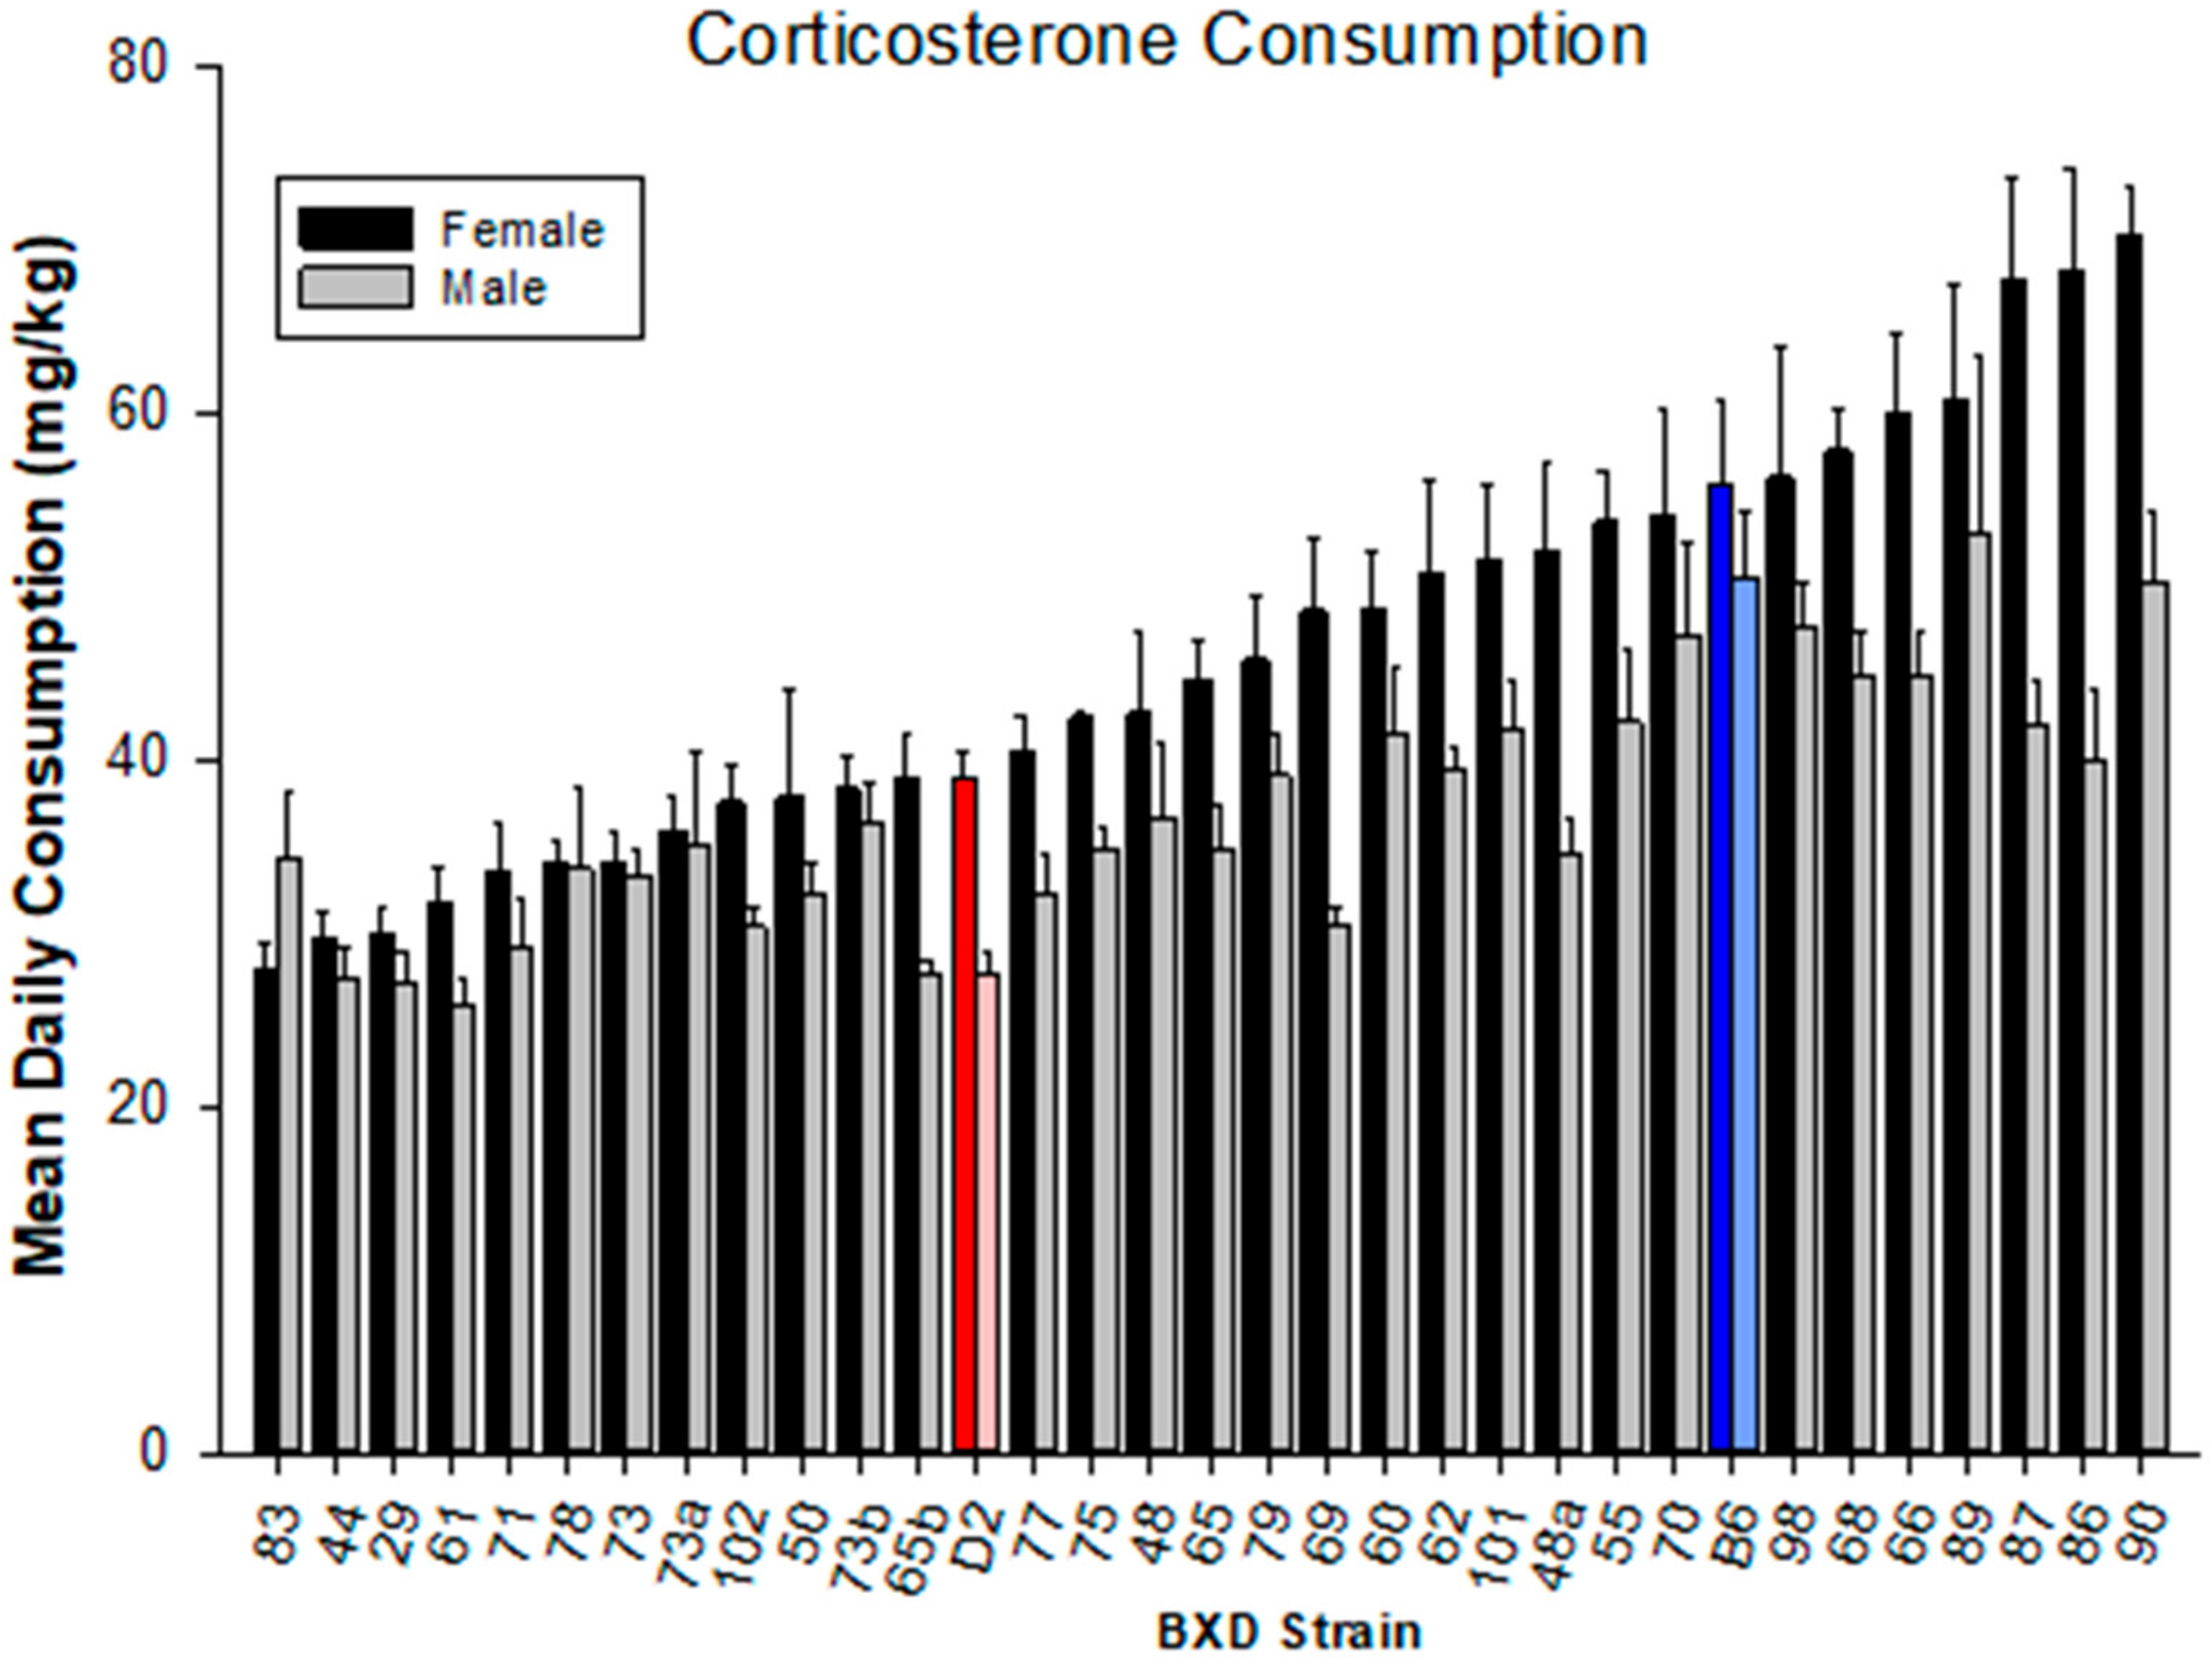
4.1. Corticosterone Consumption
4.2. Gene Expression in Response to Treatments
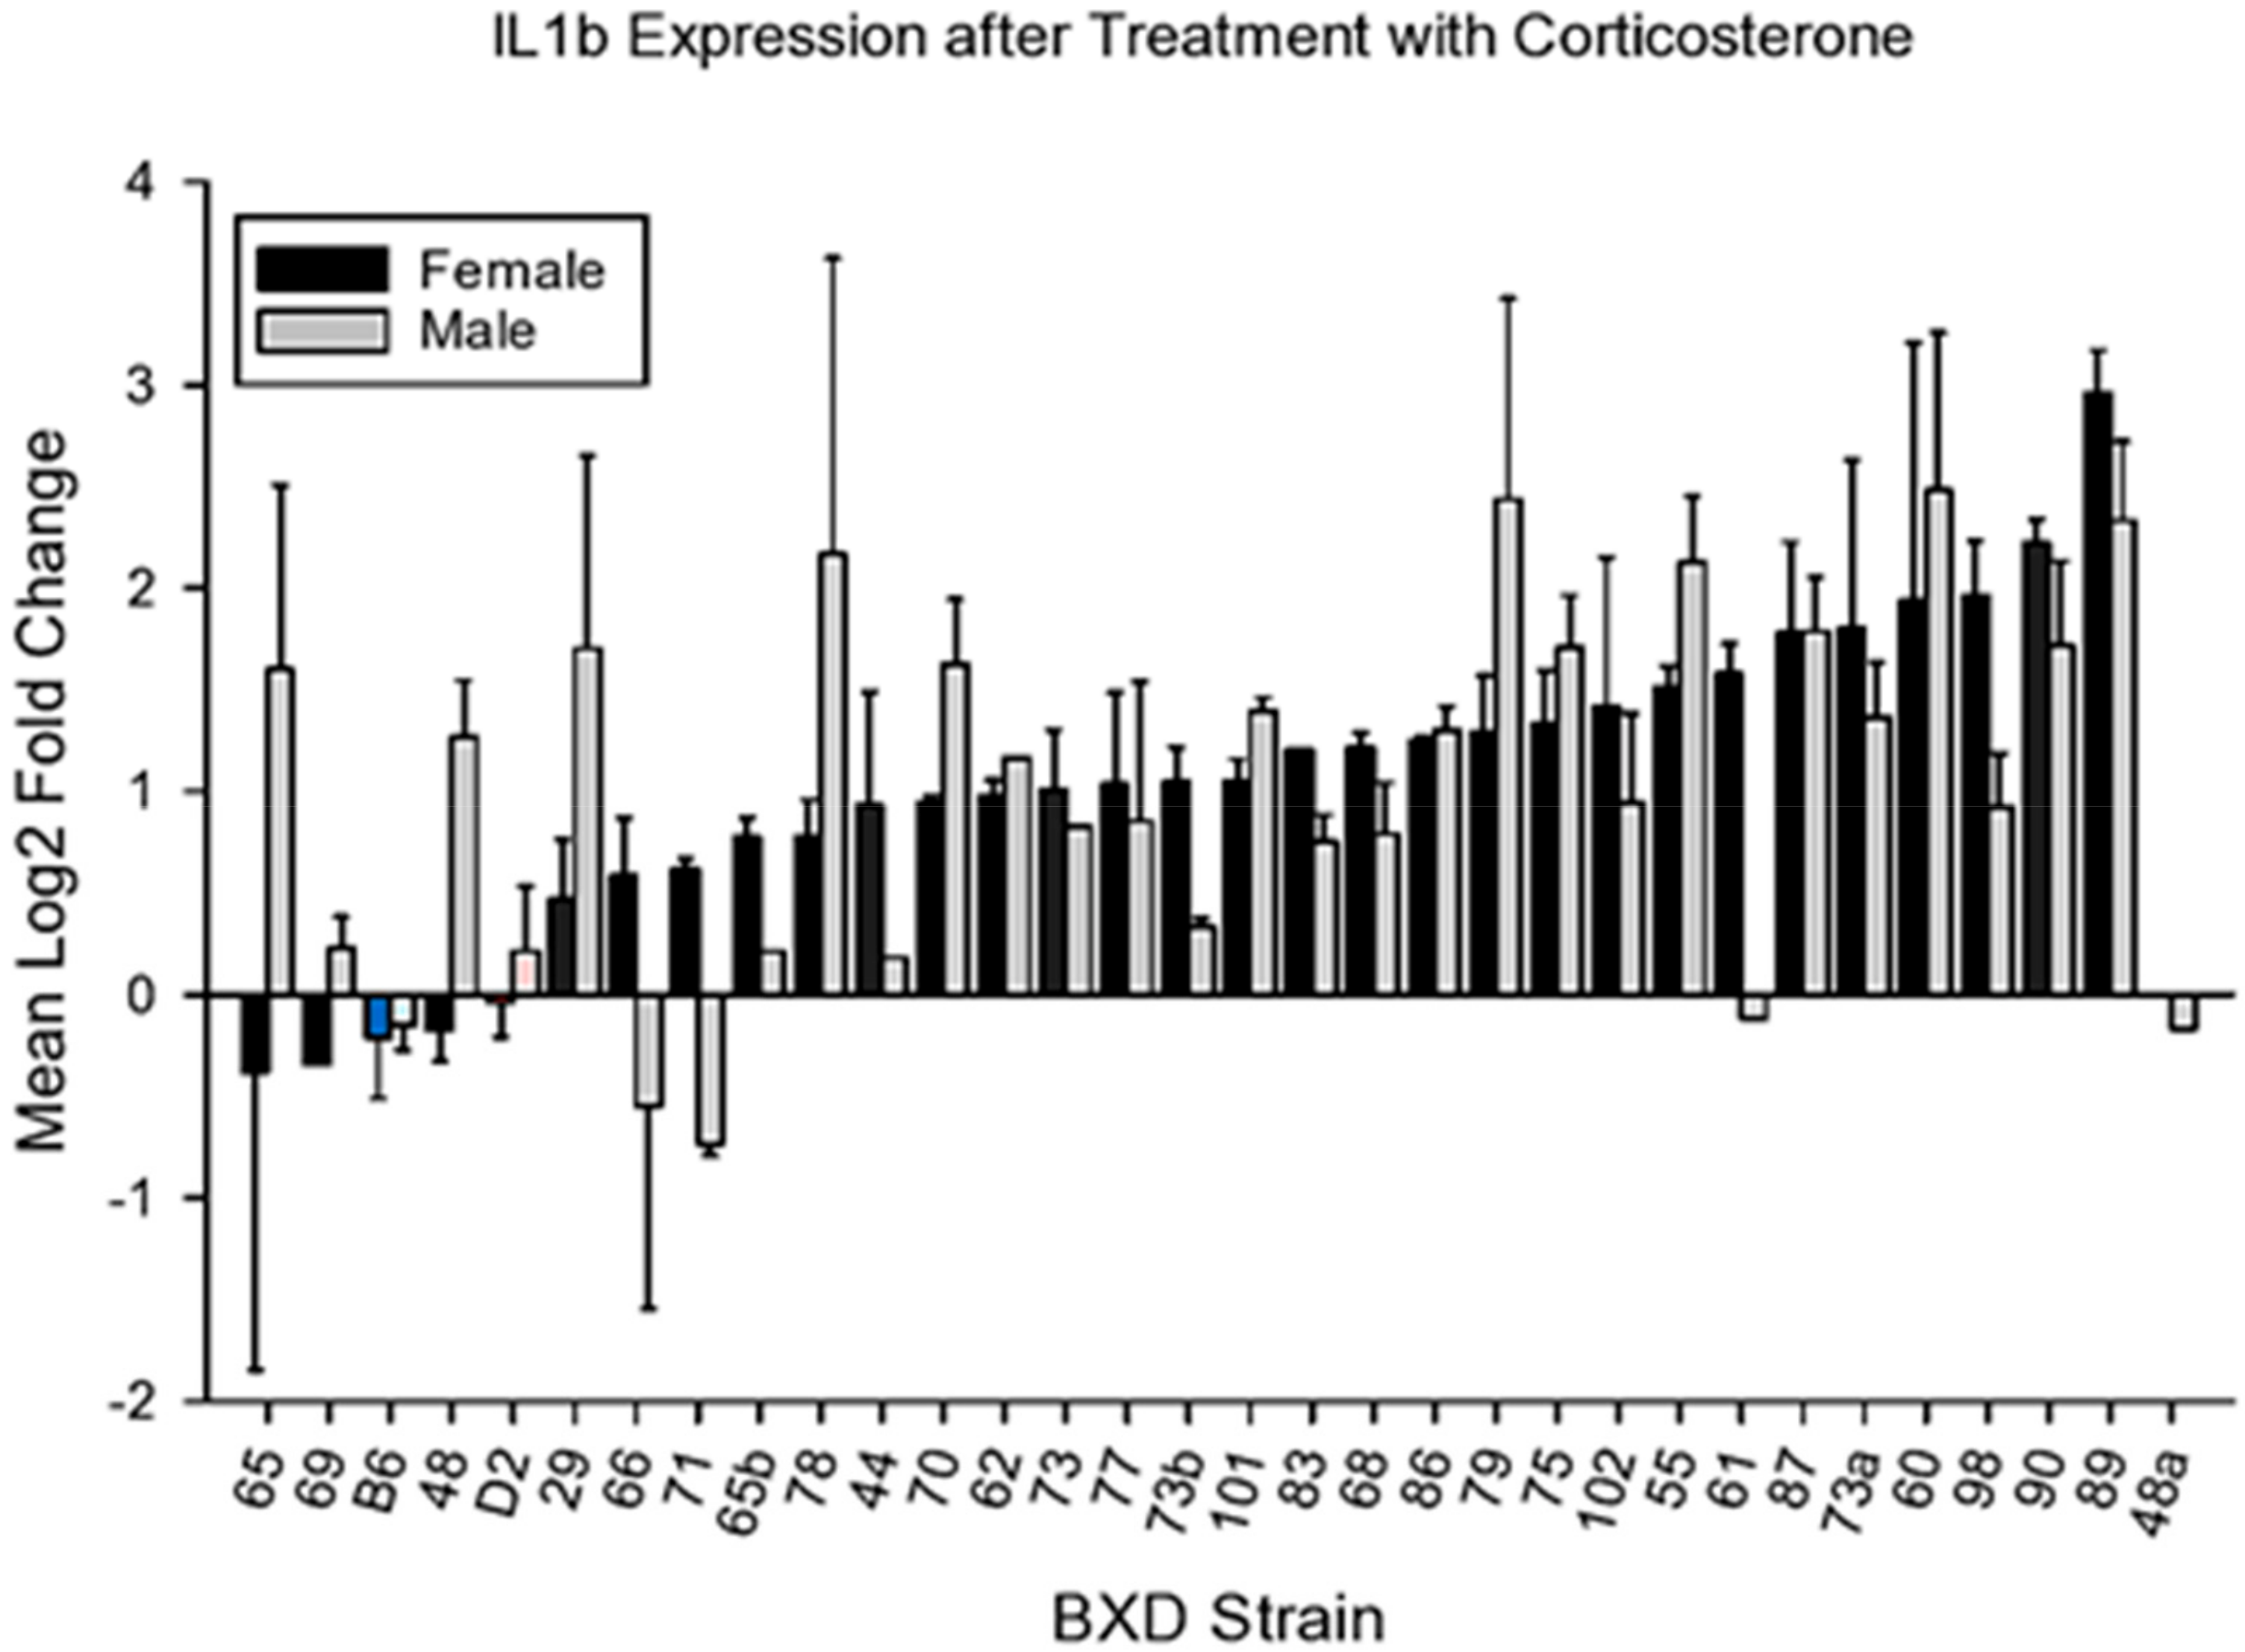
4.2.1. IL1b
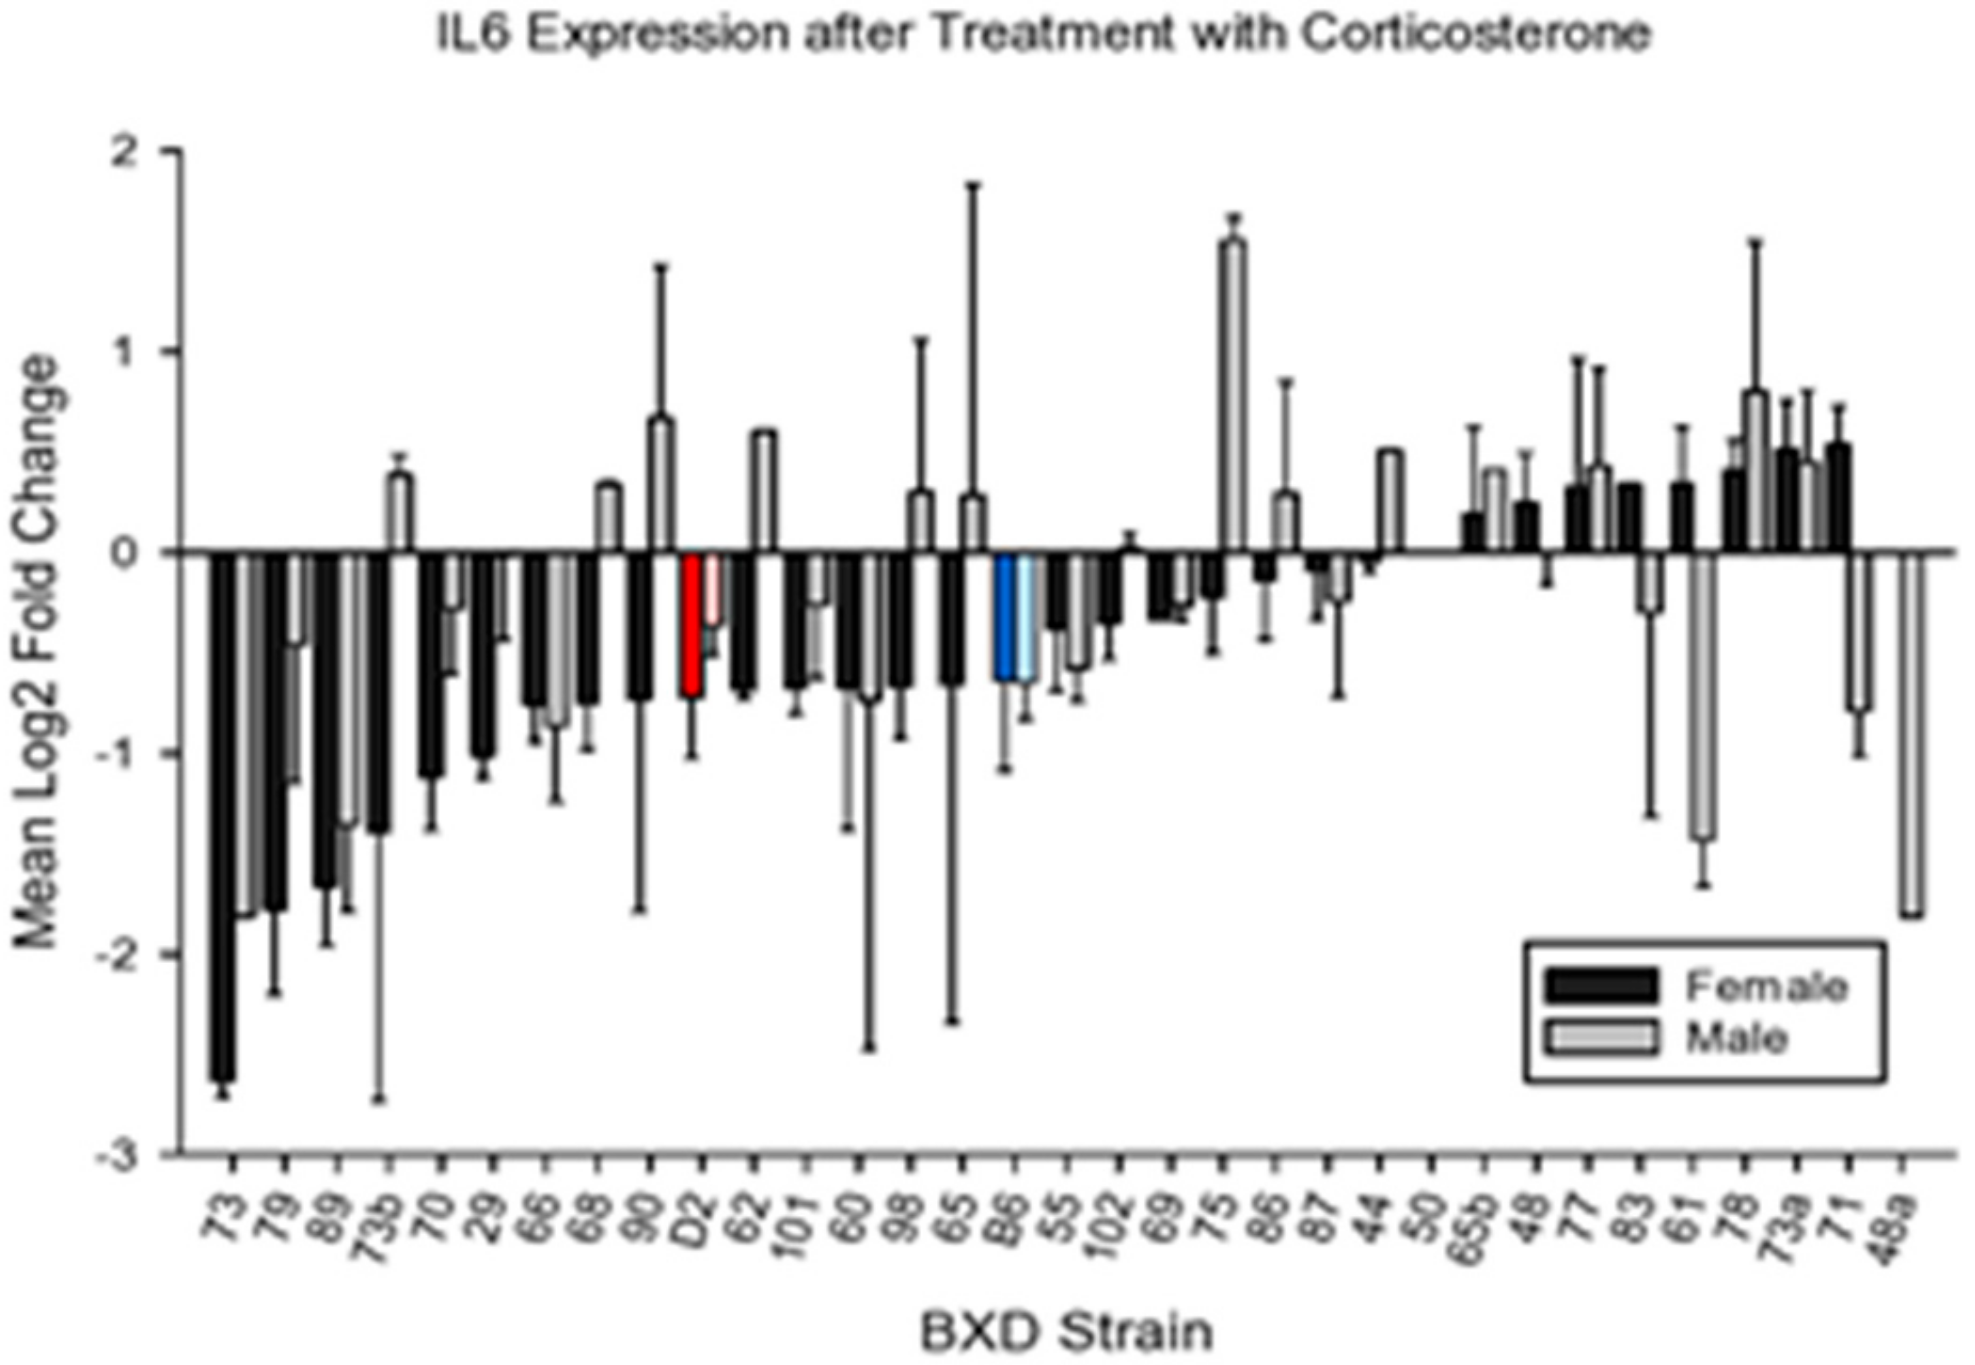
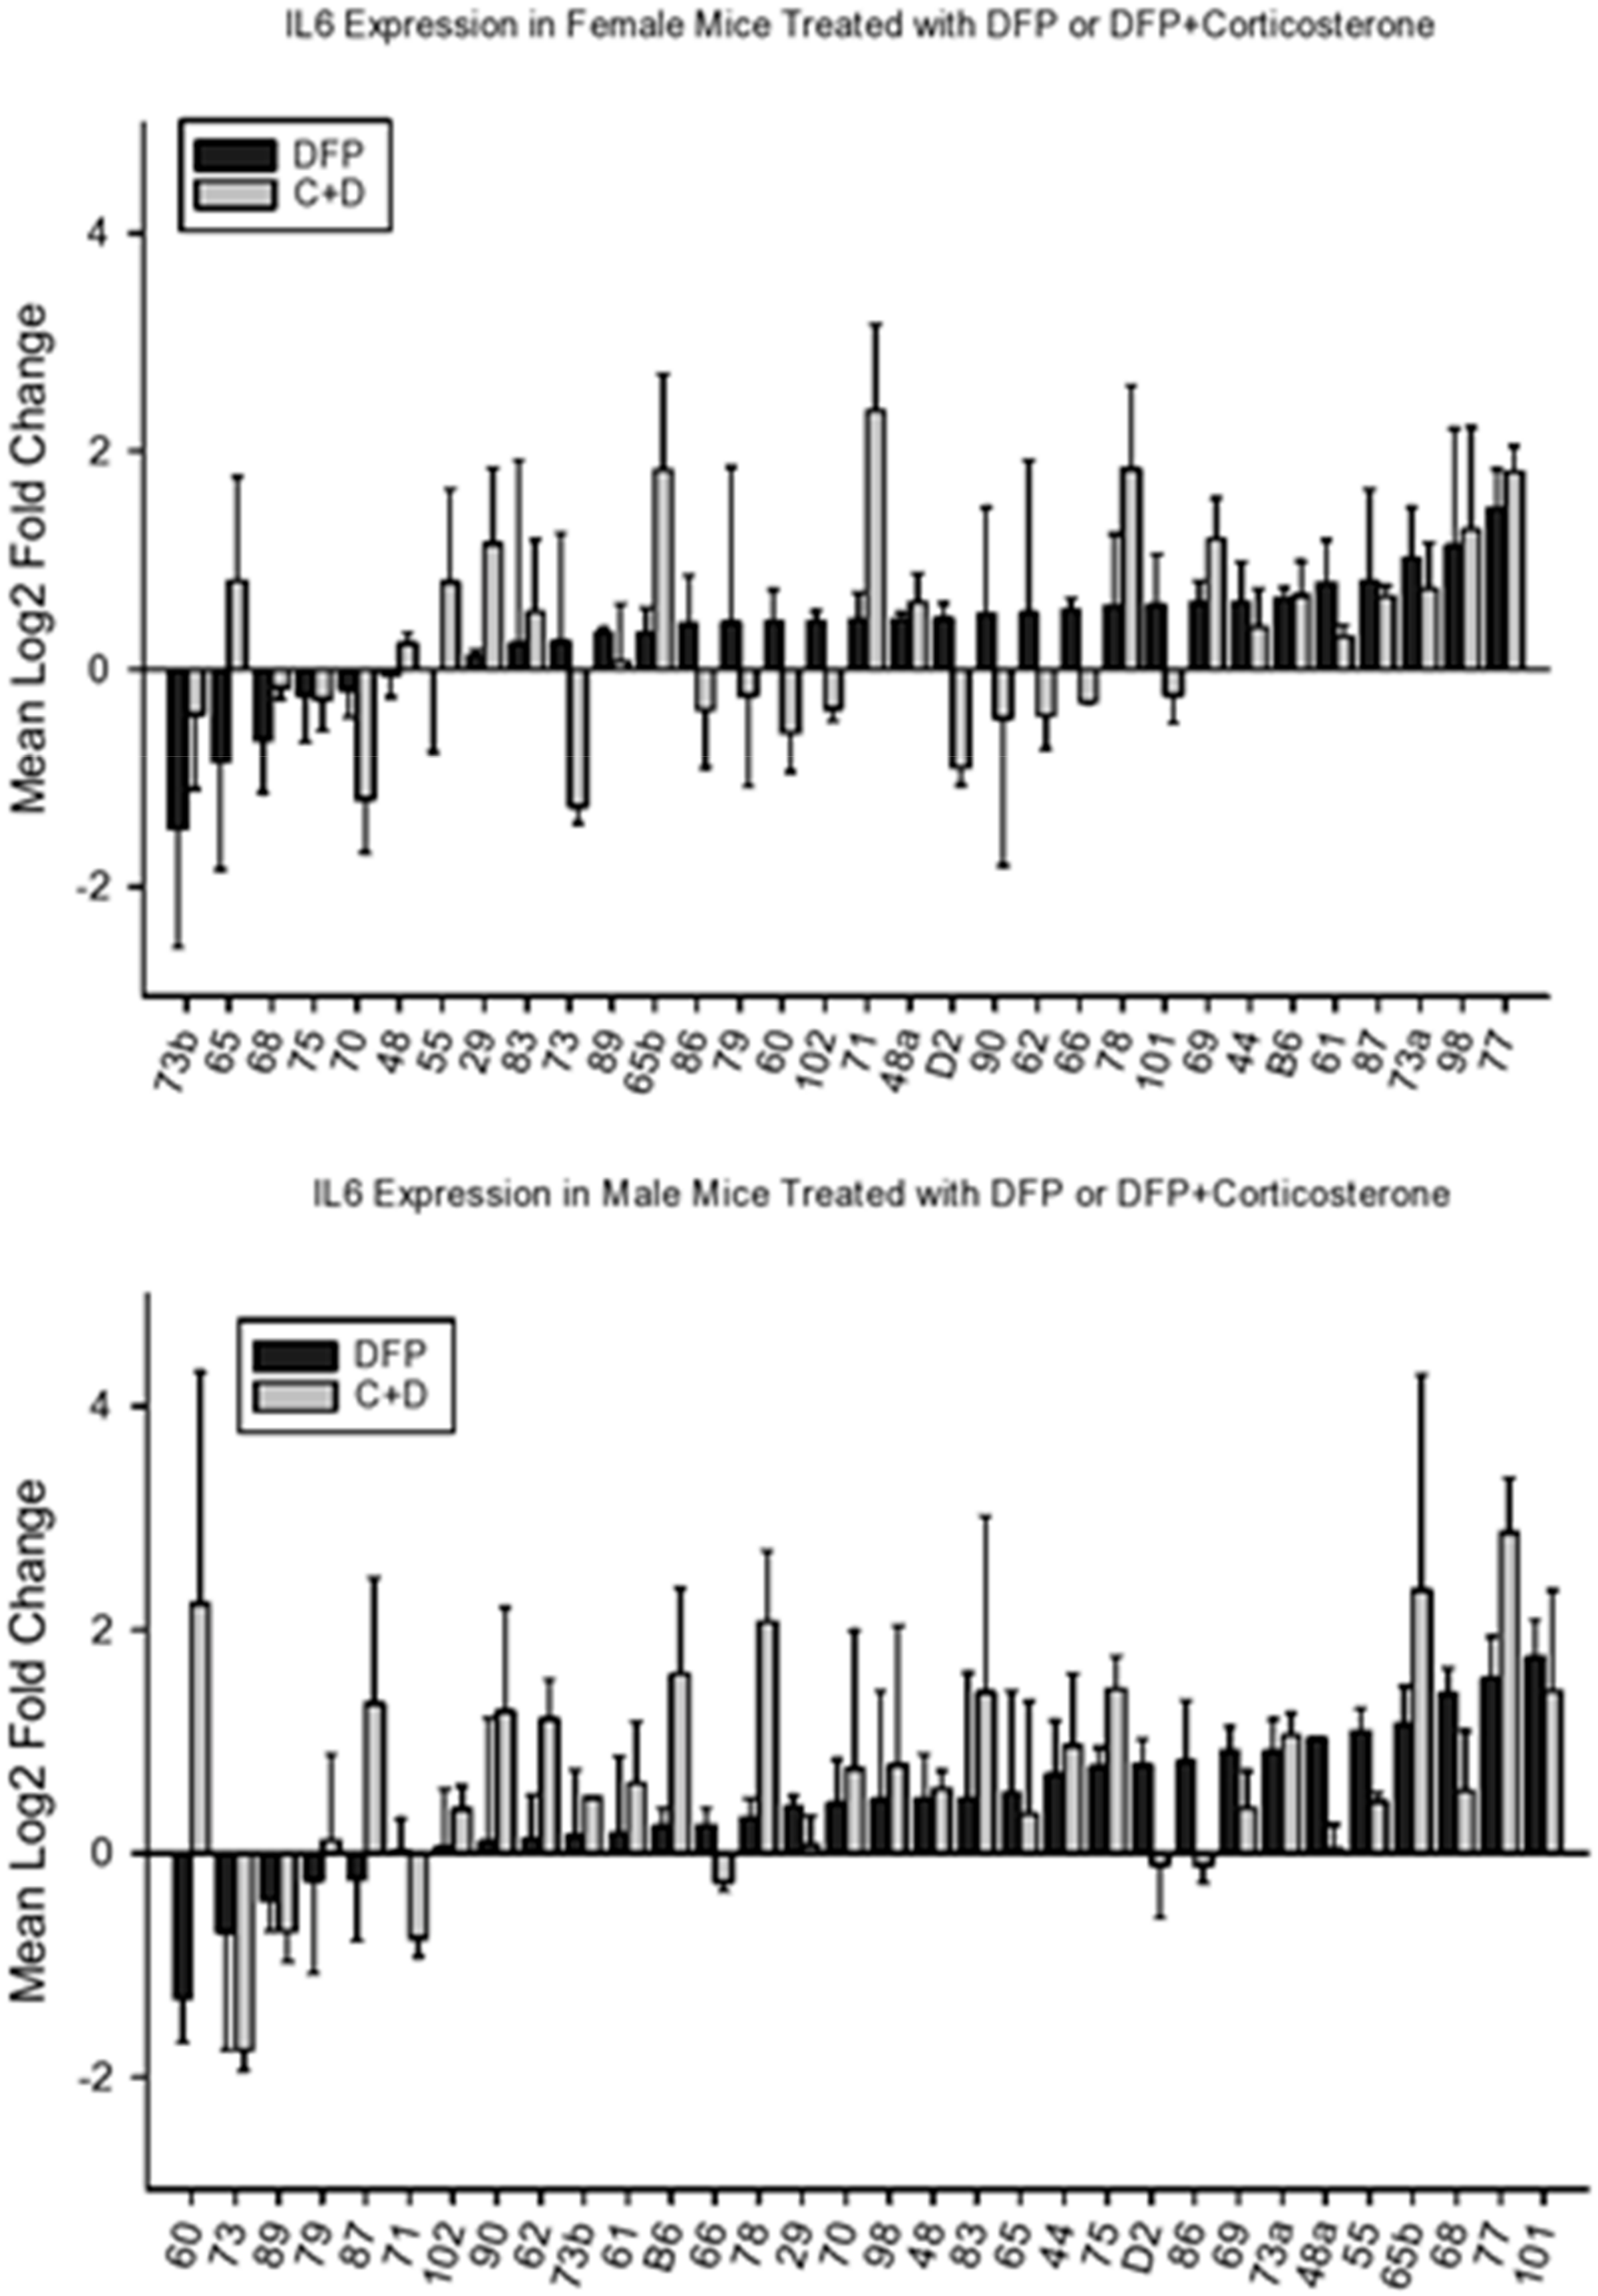
4.2.2. IL6
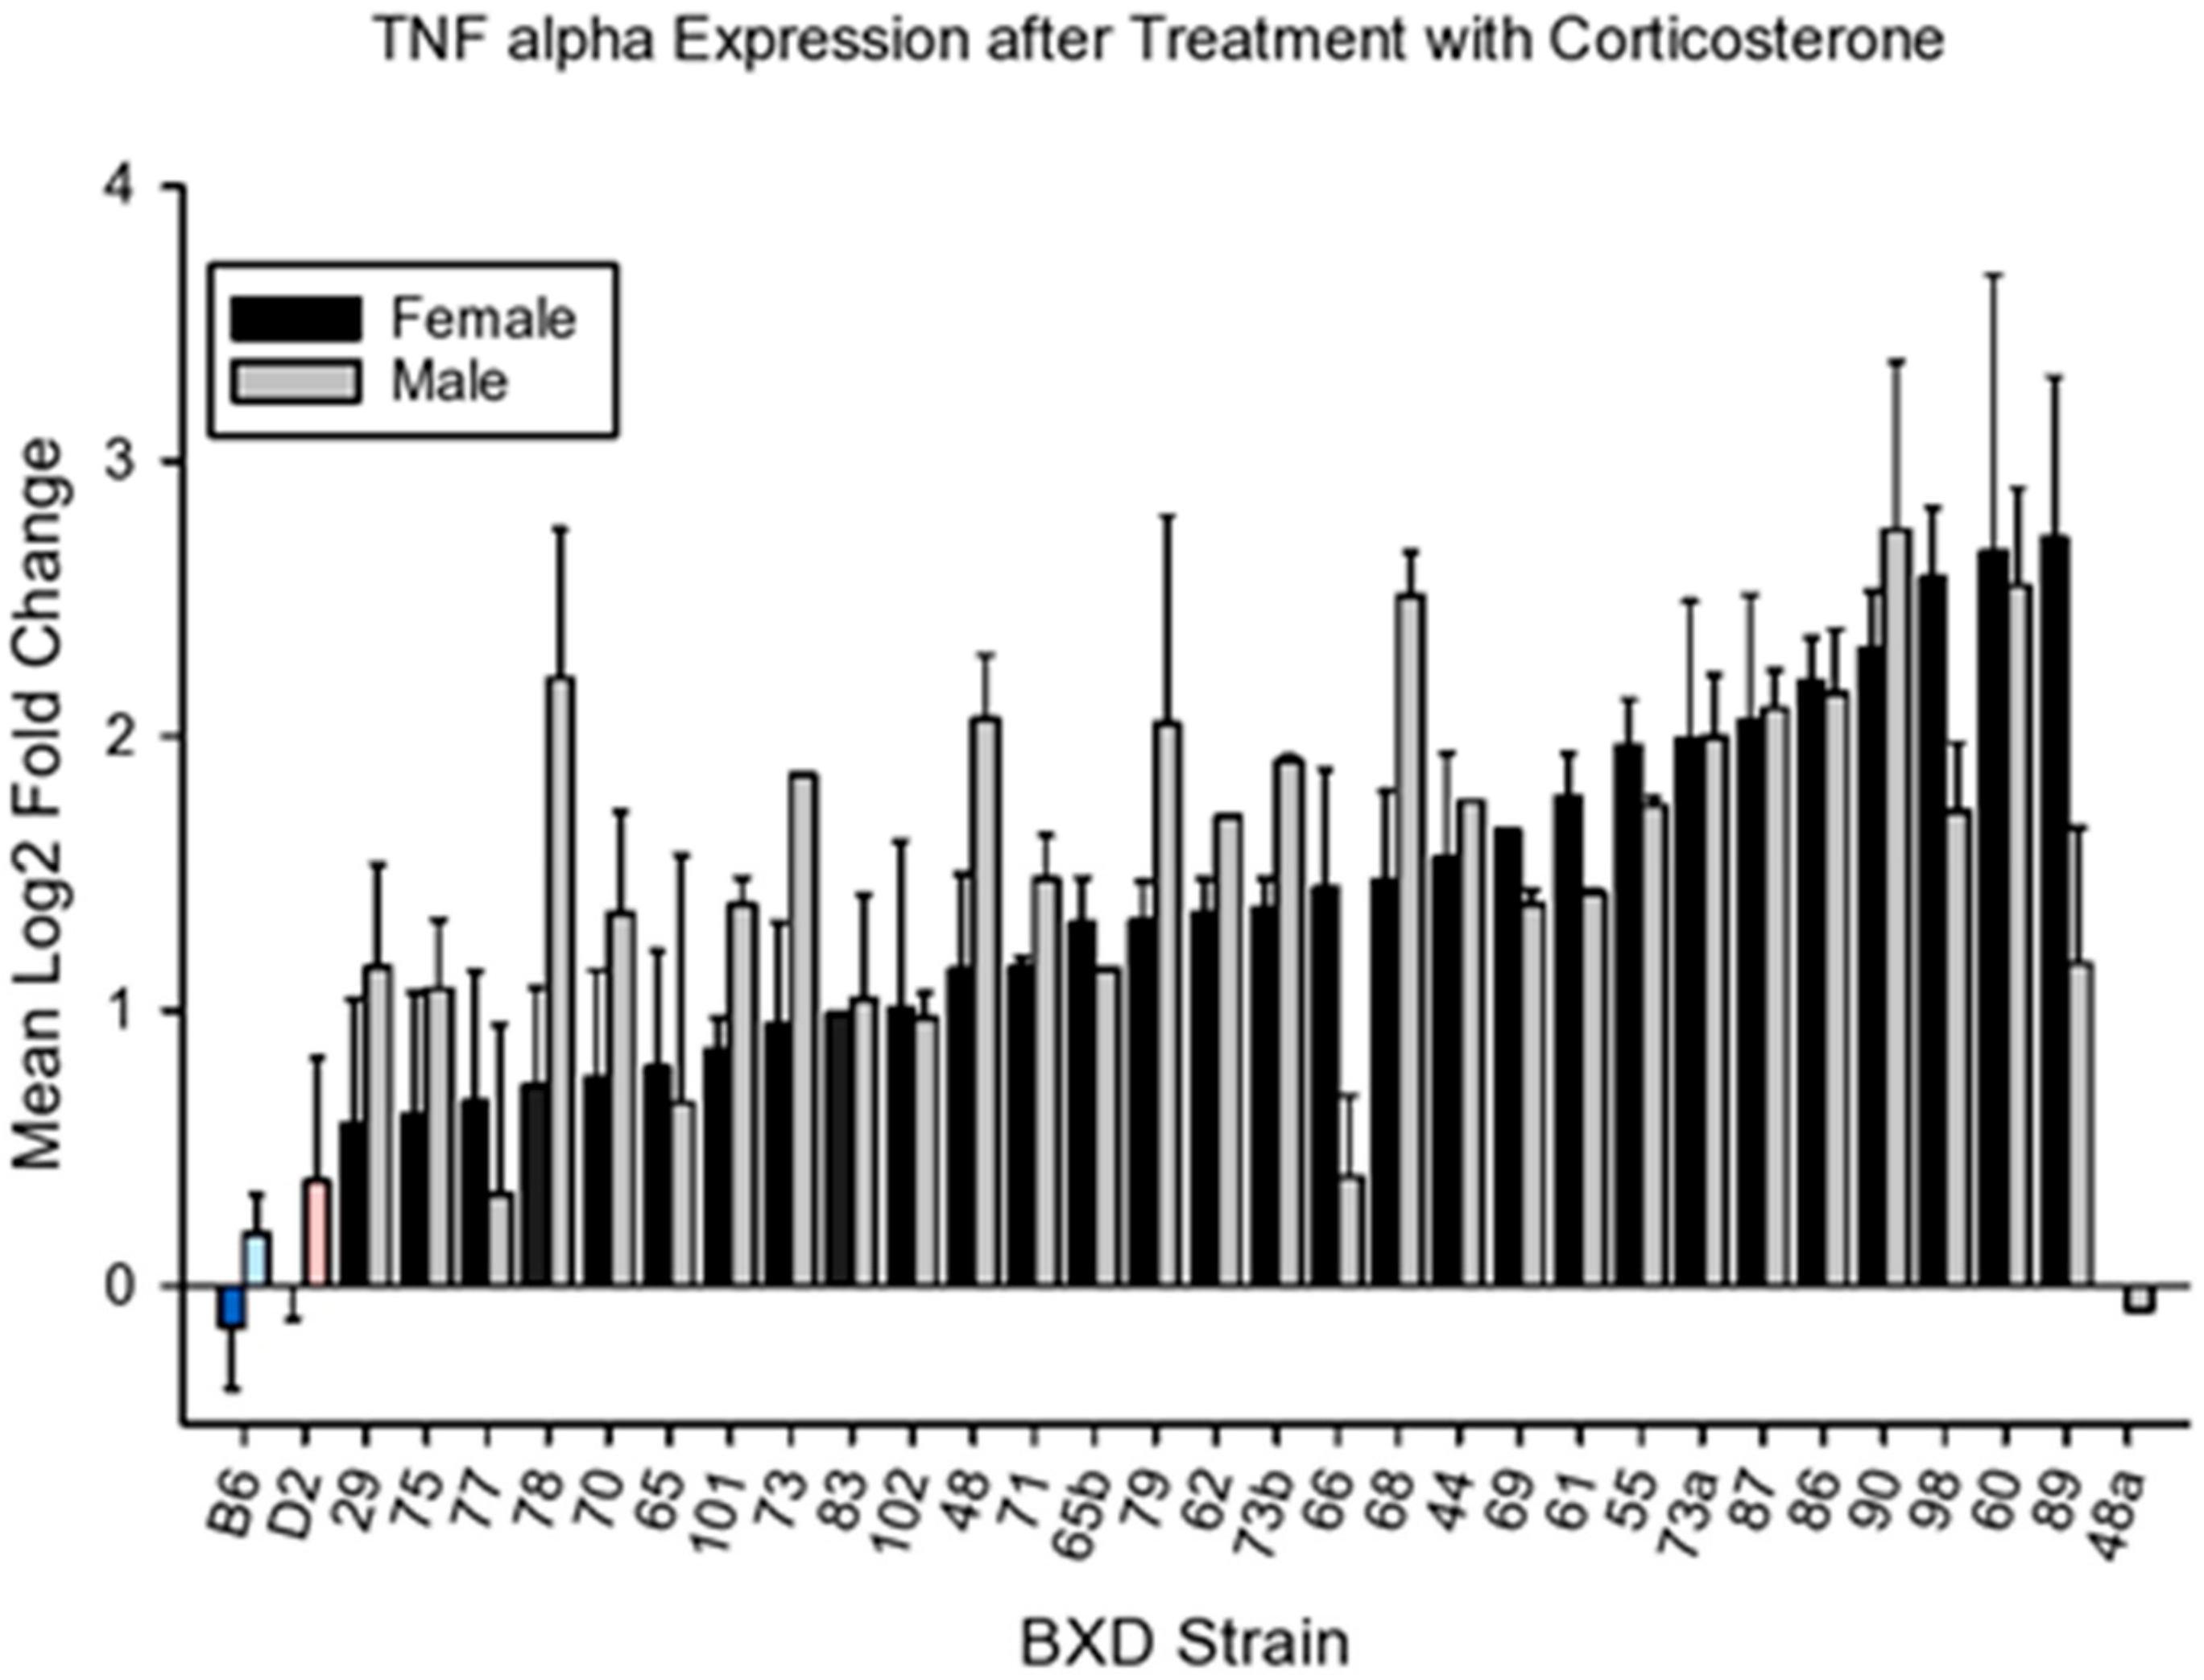
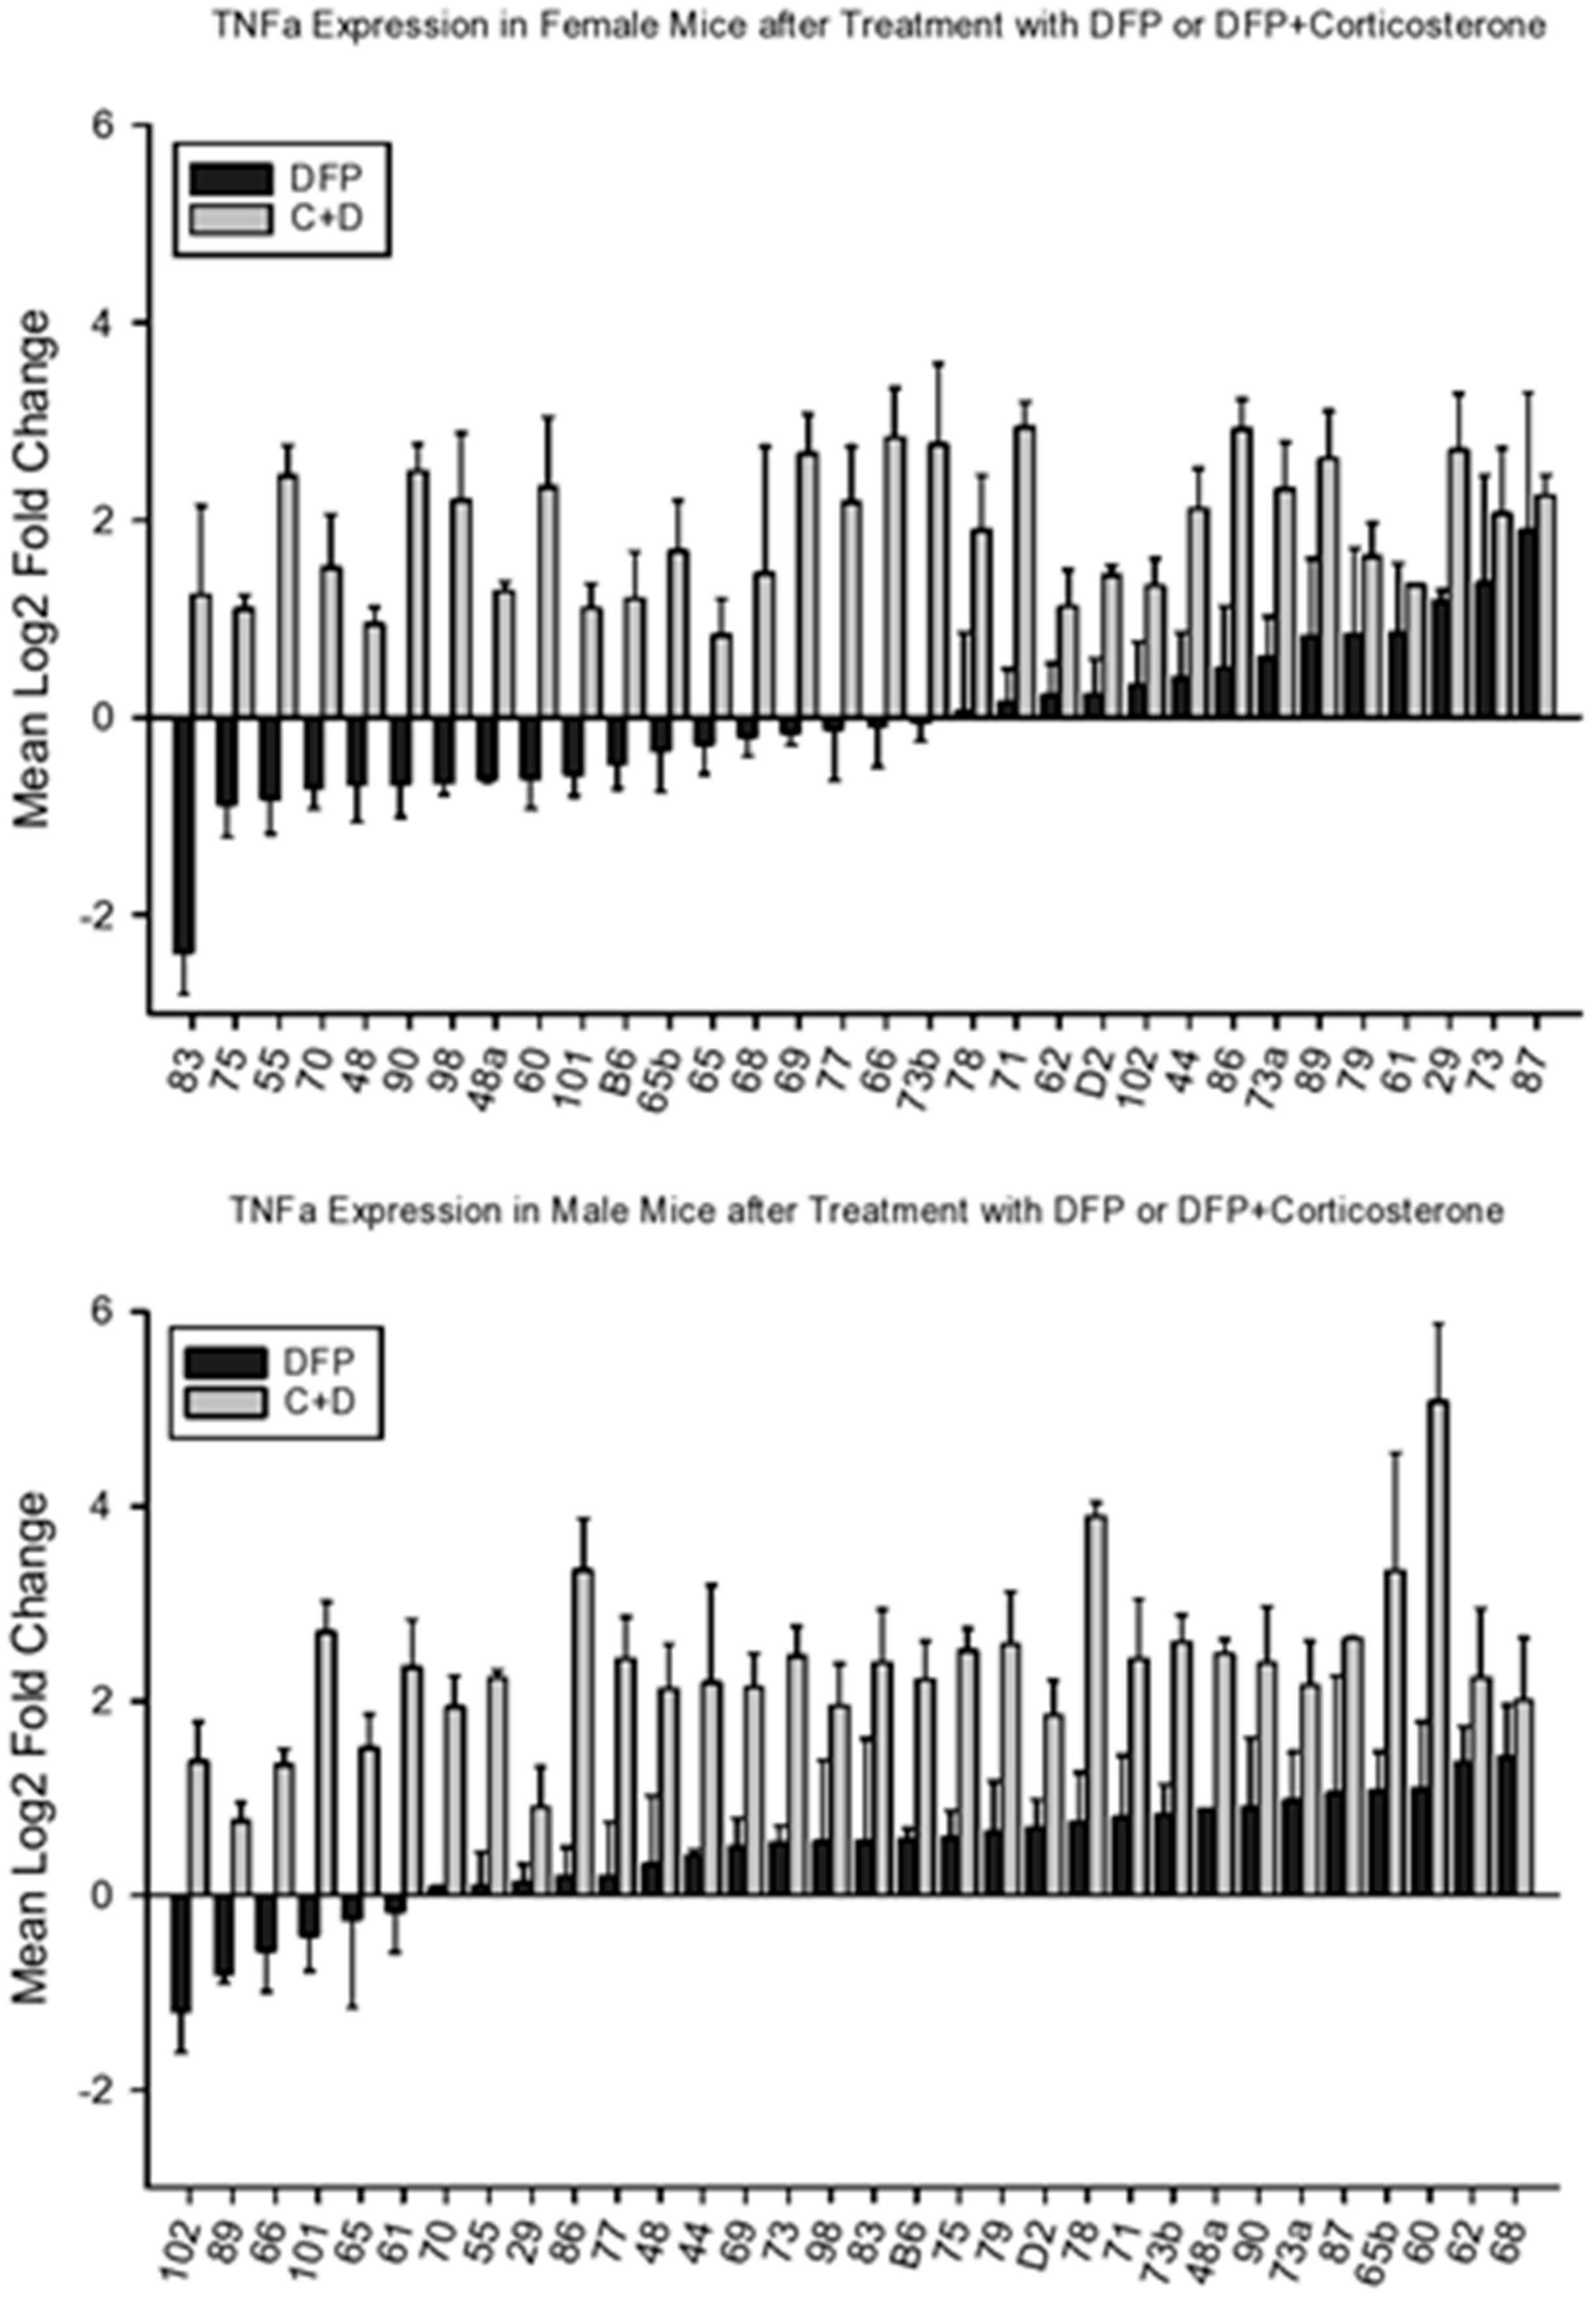
4.2.3. Tnfa
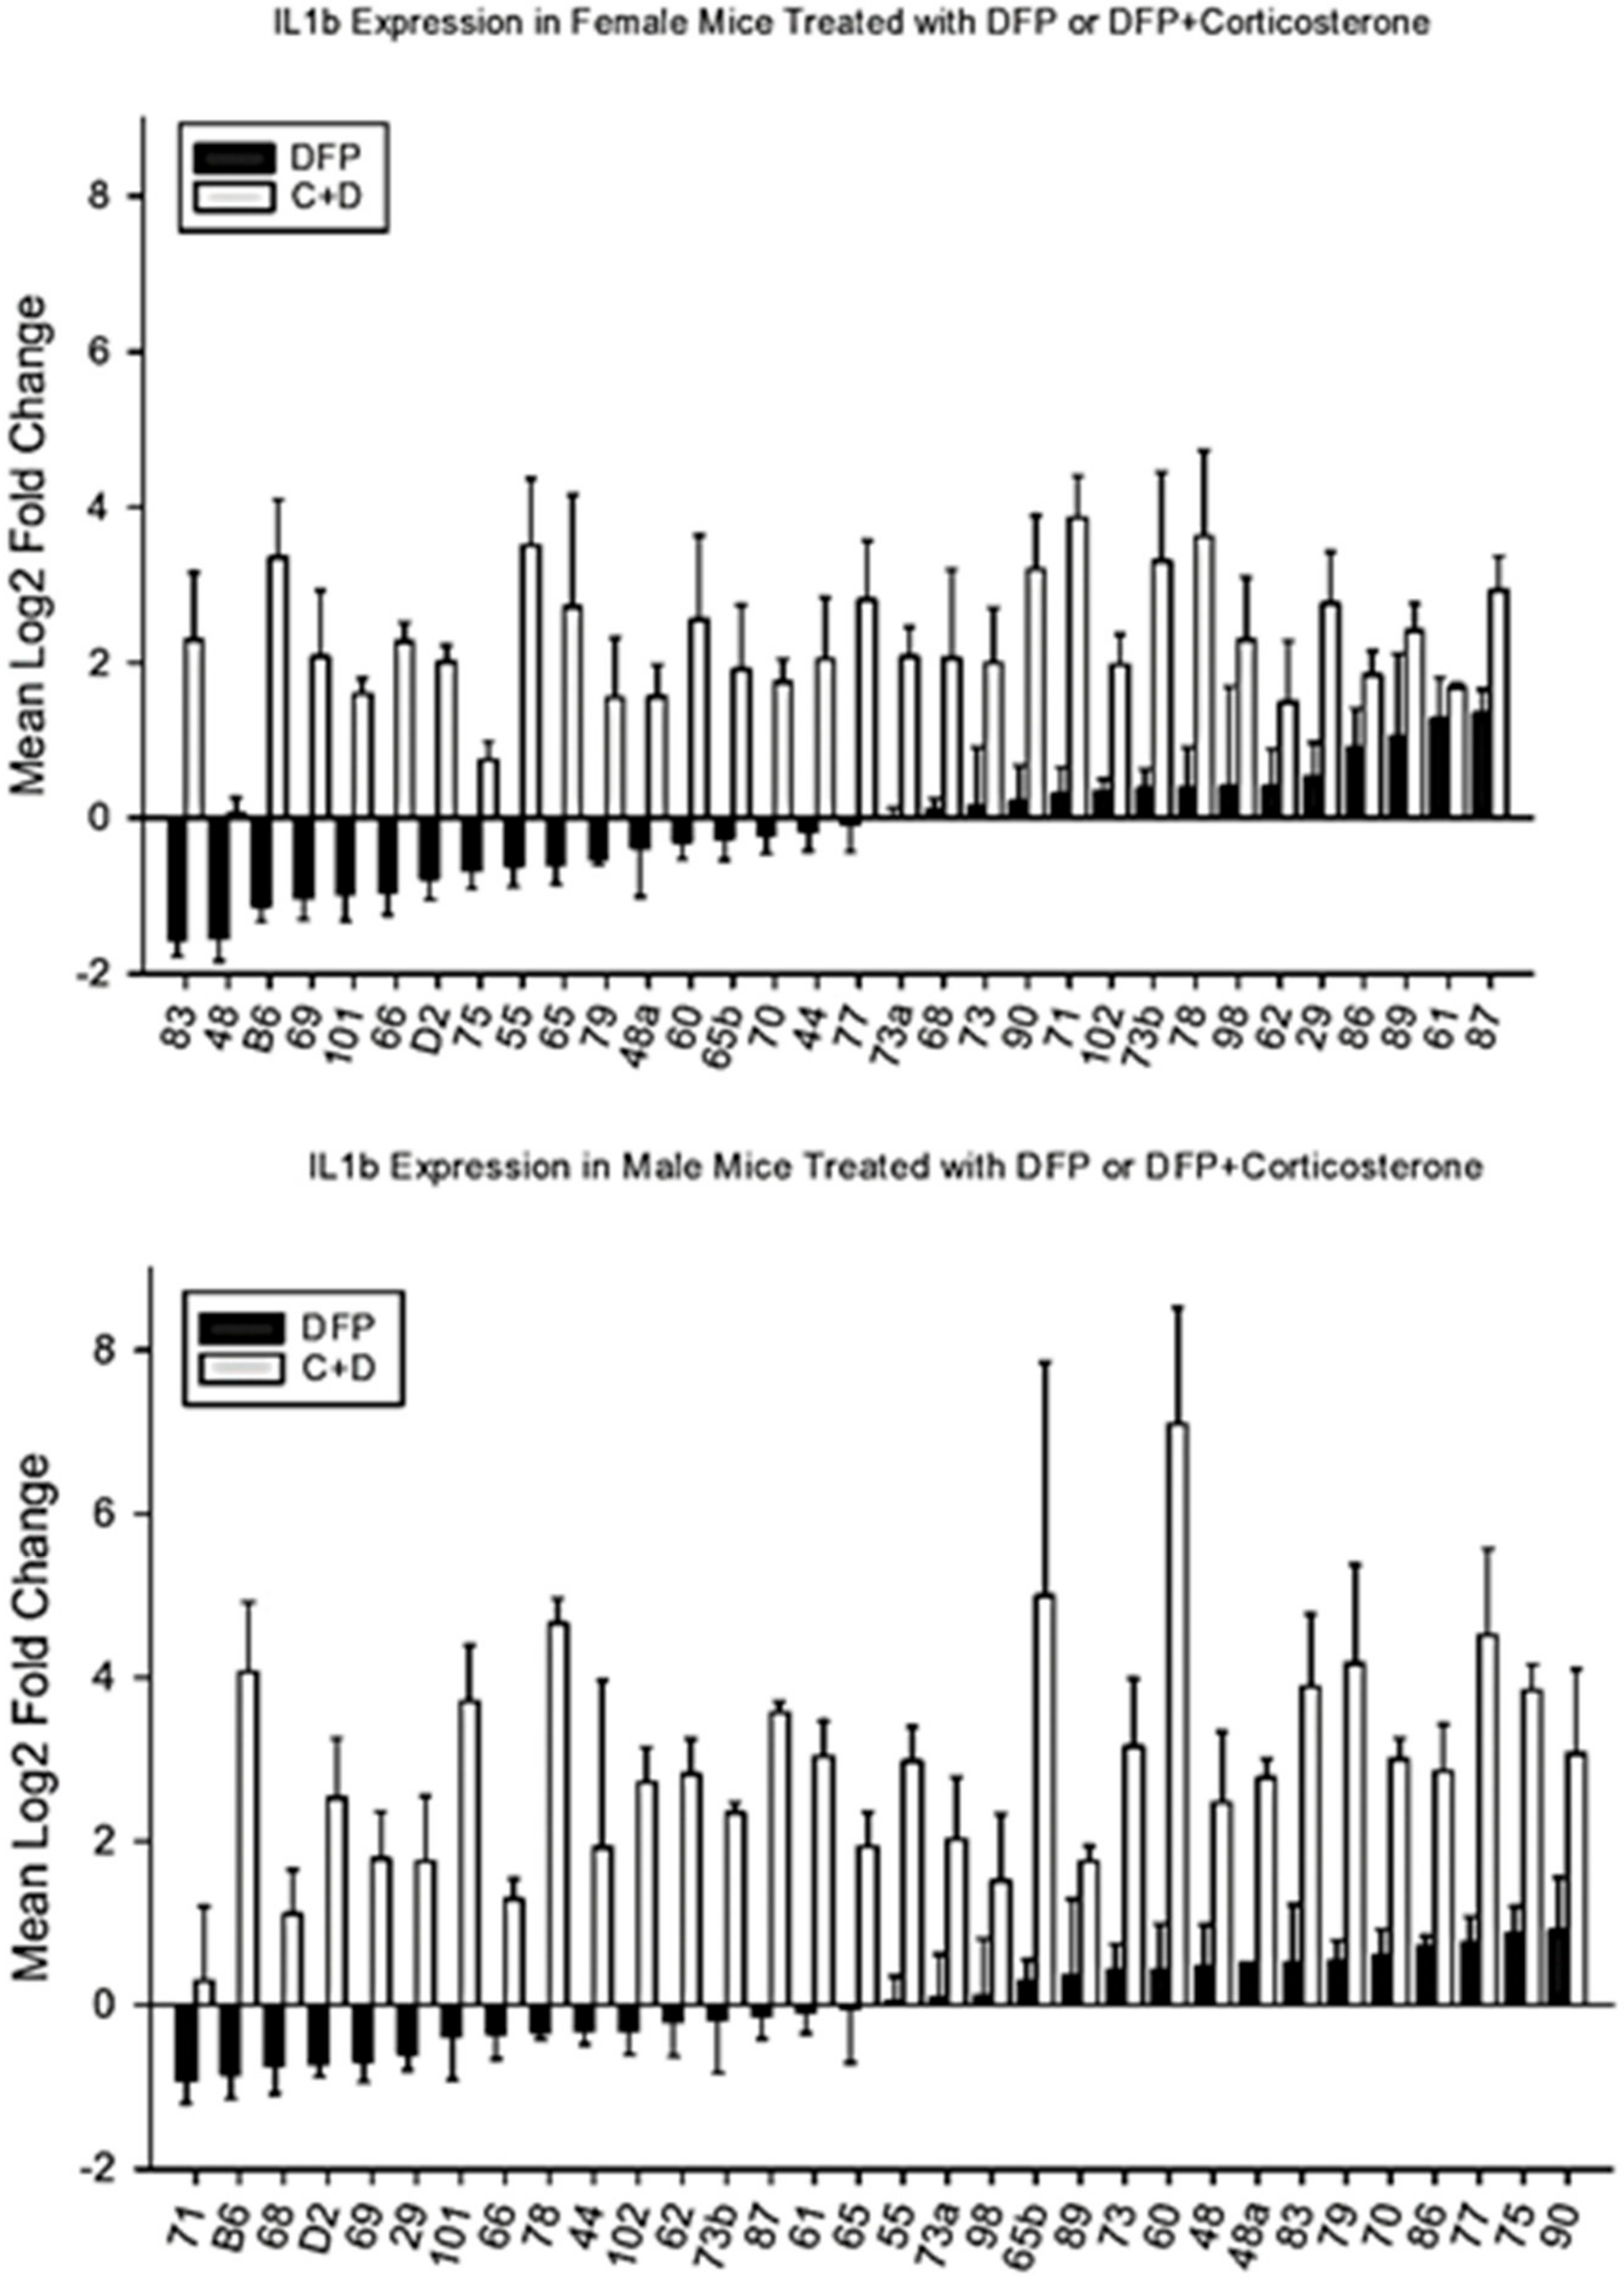
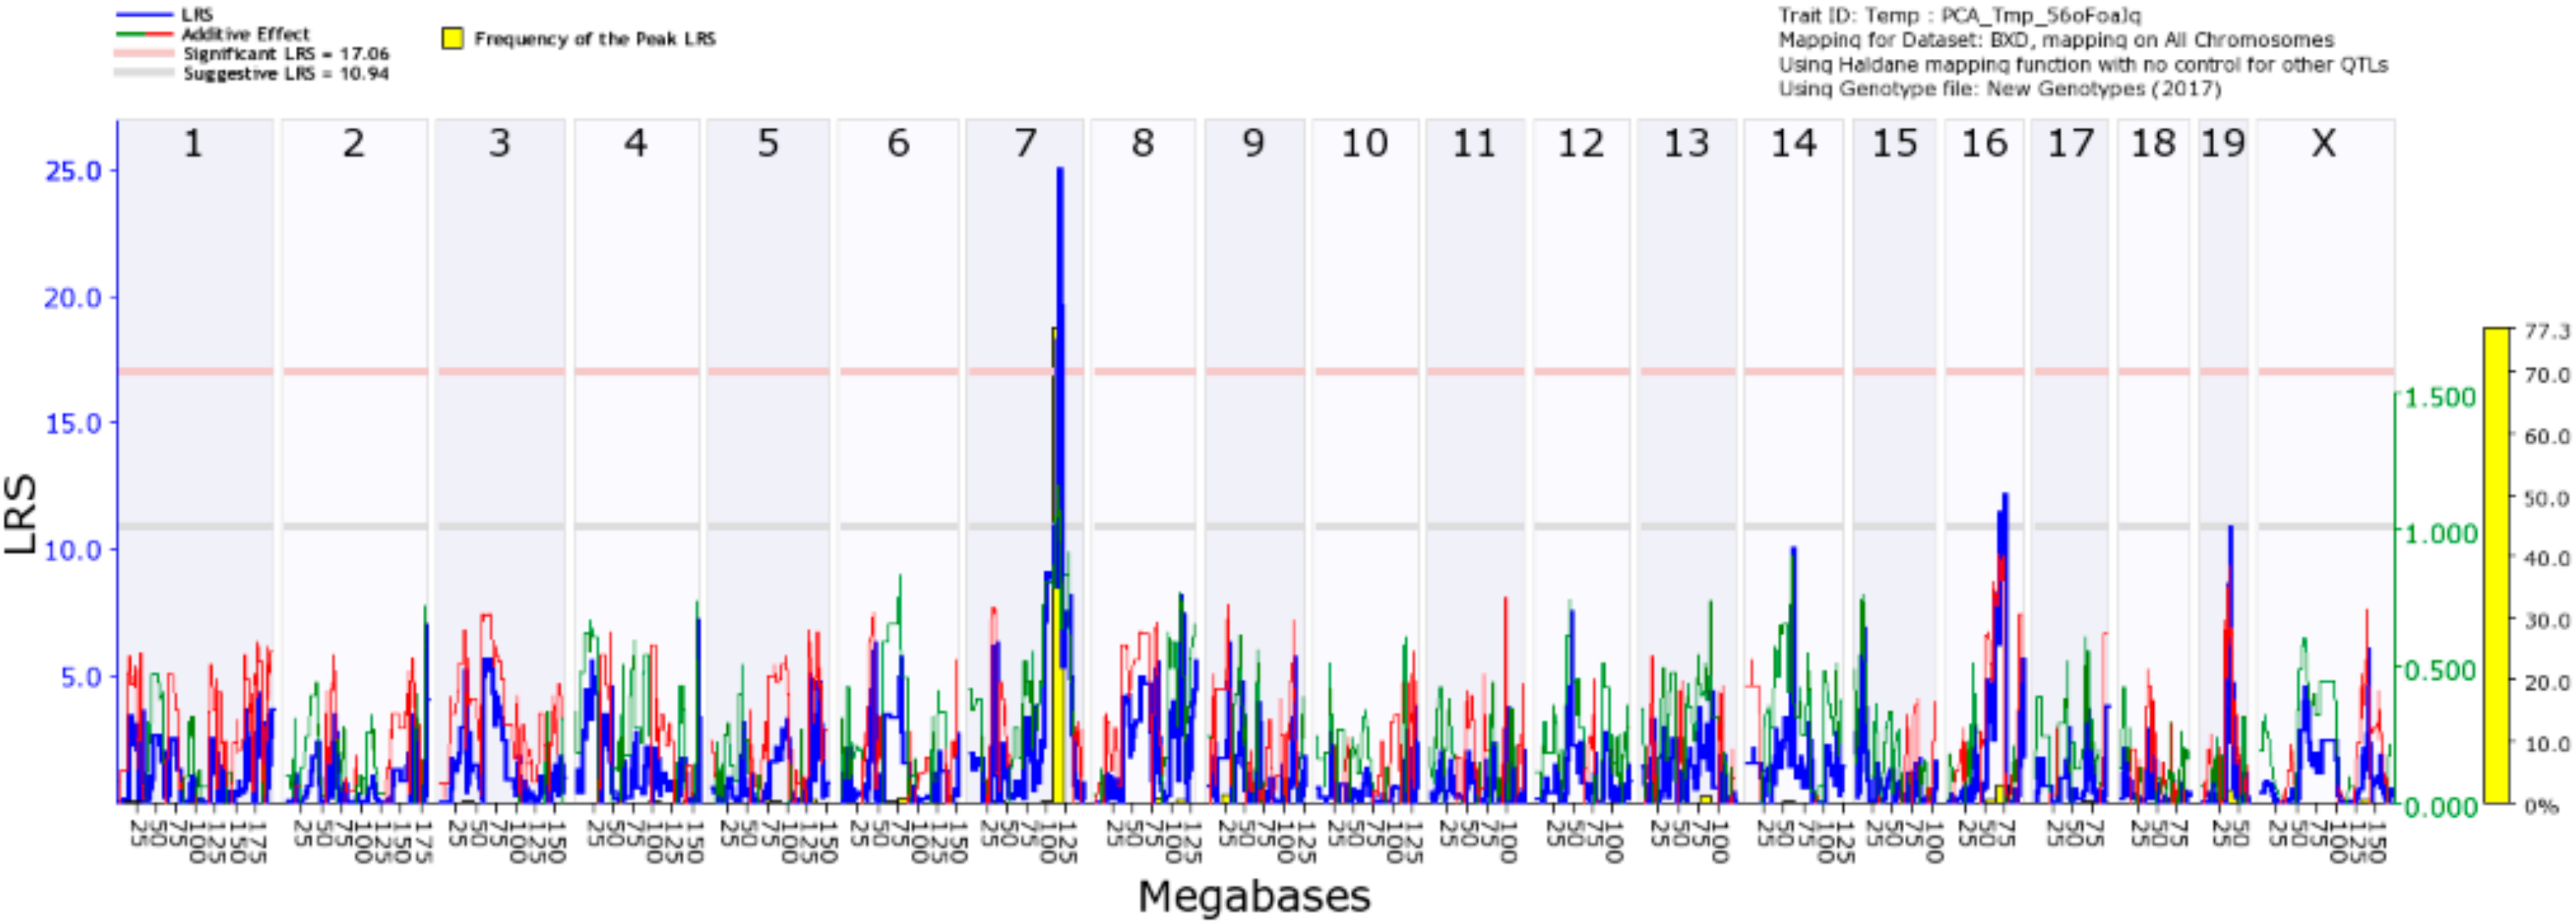
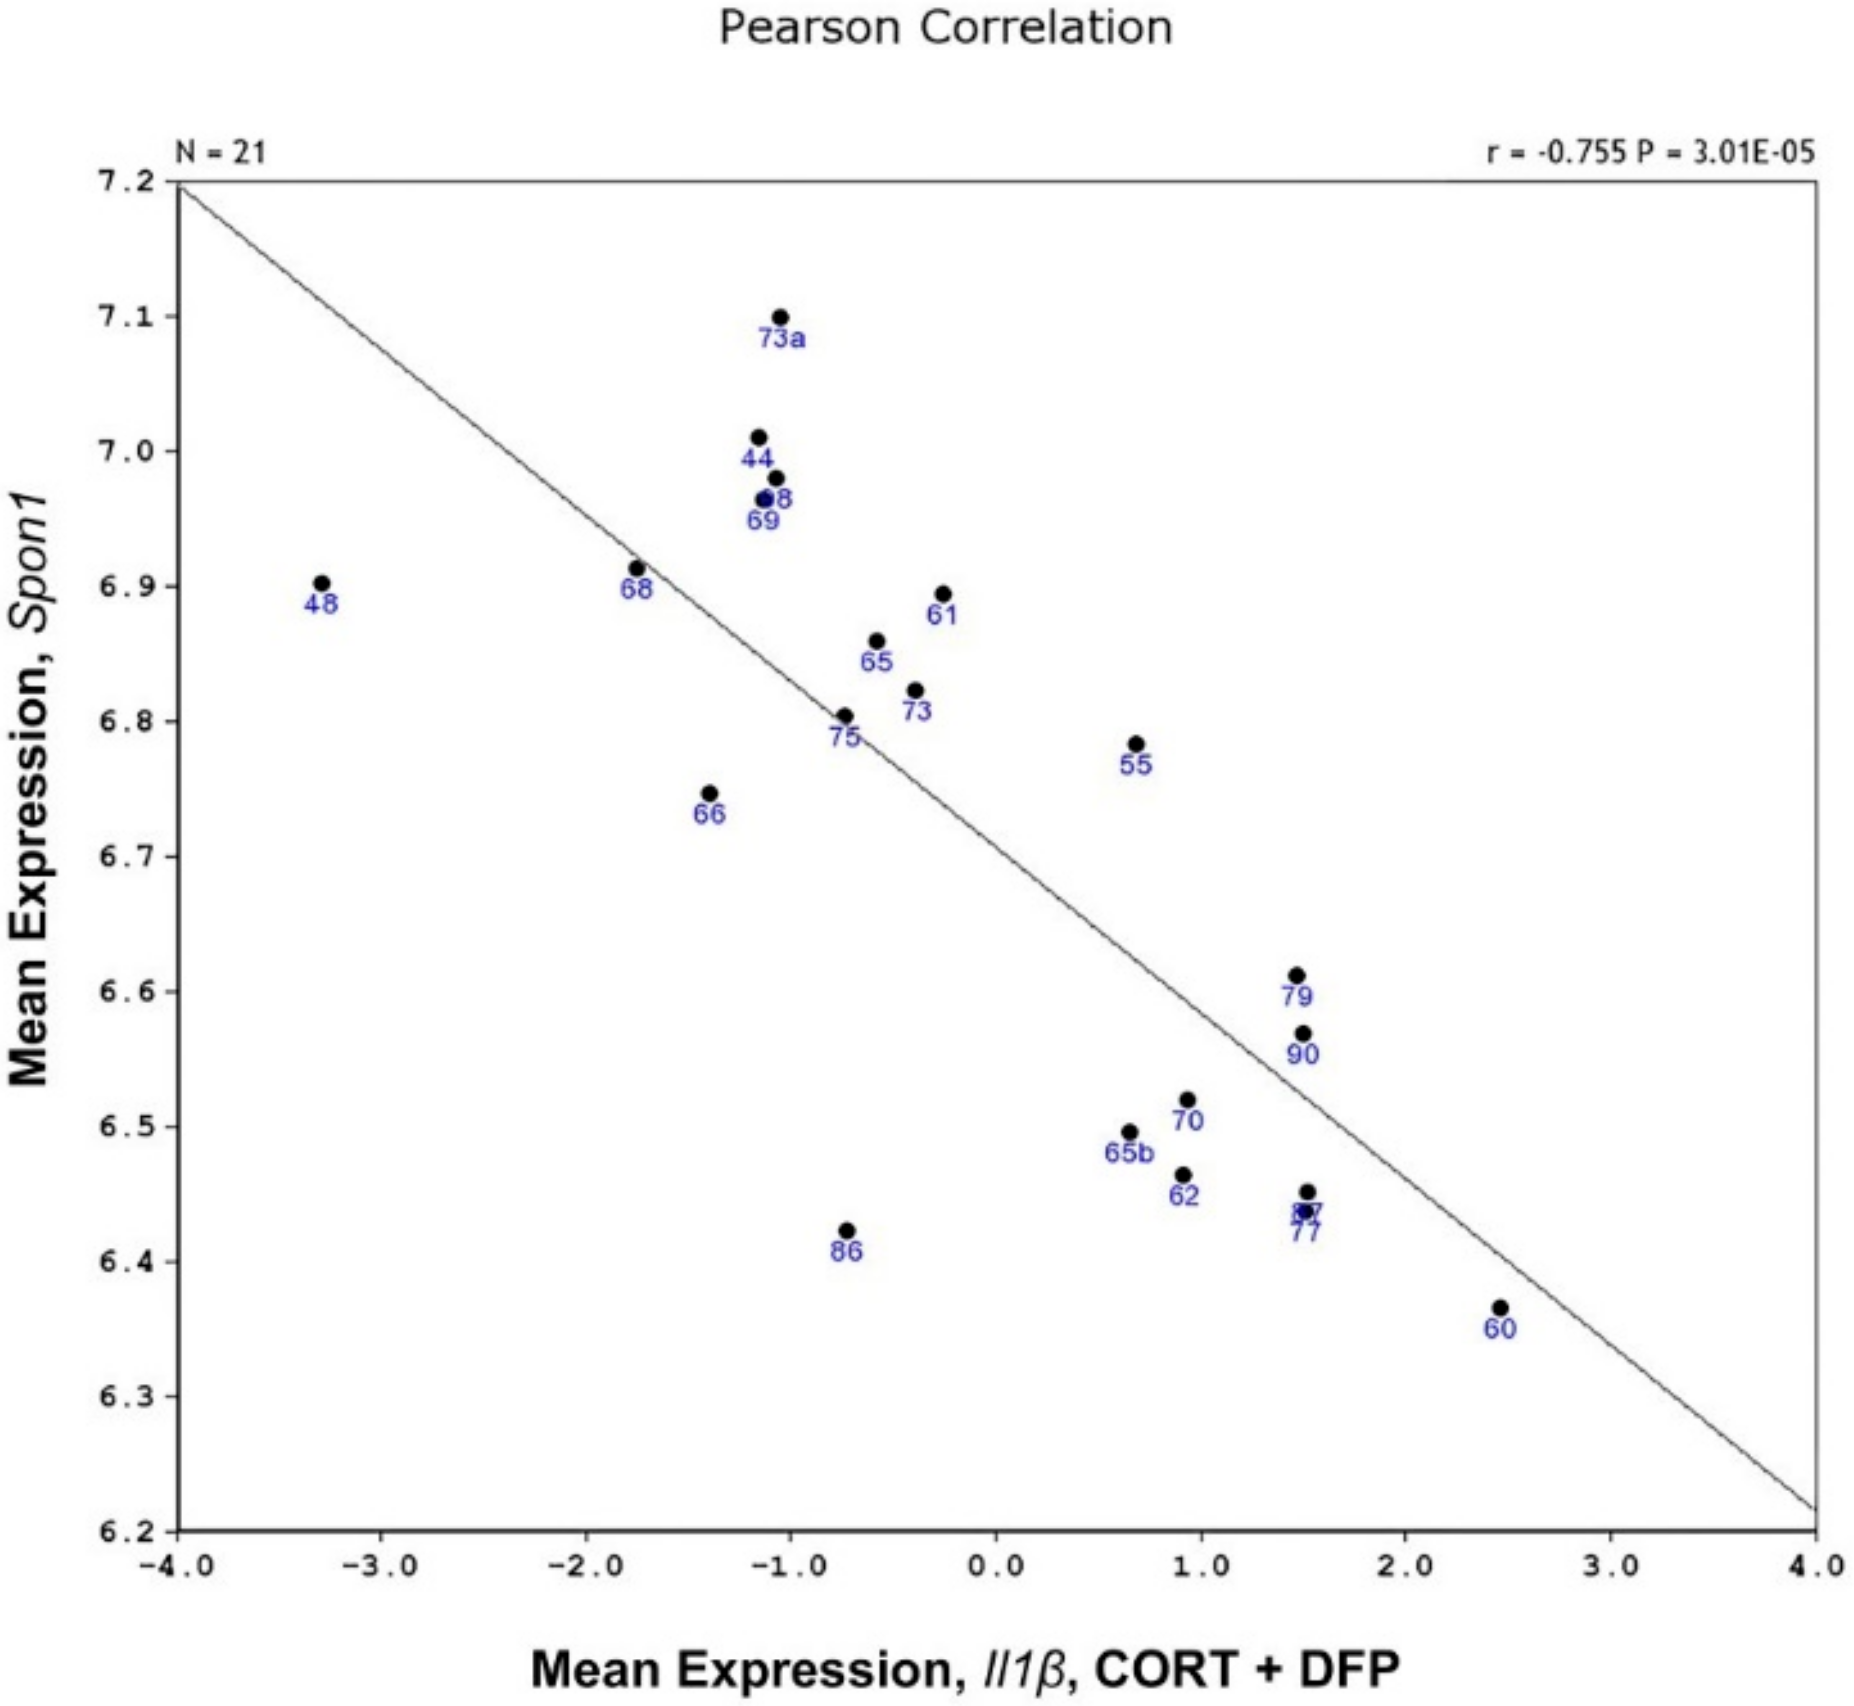
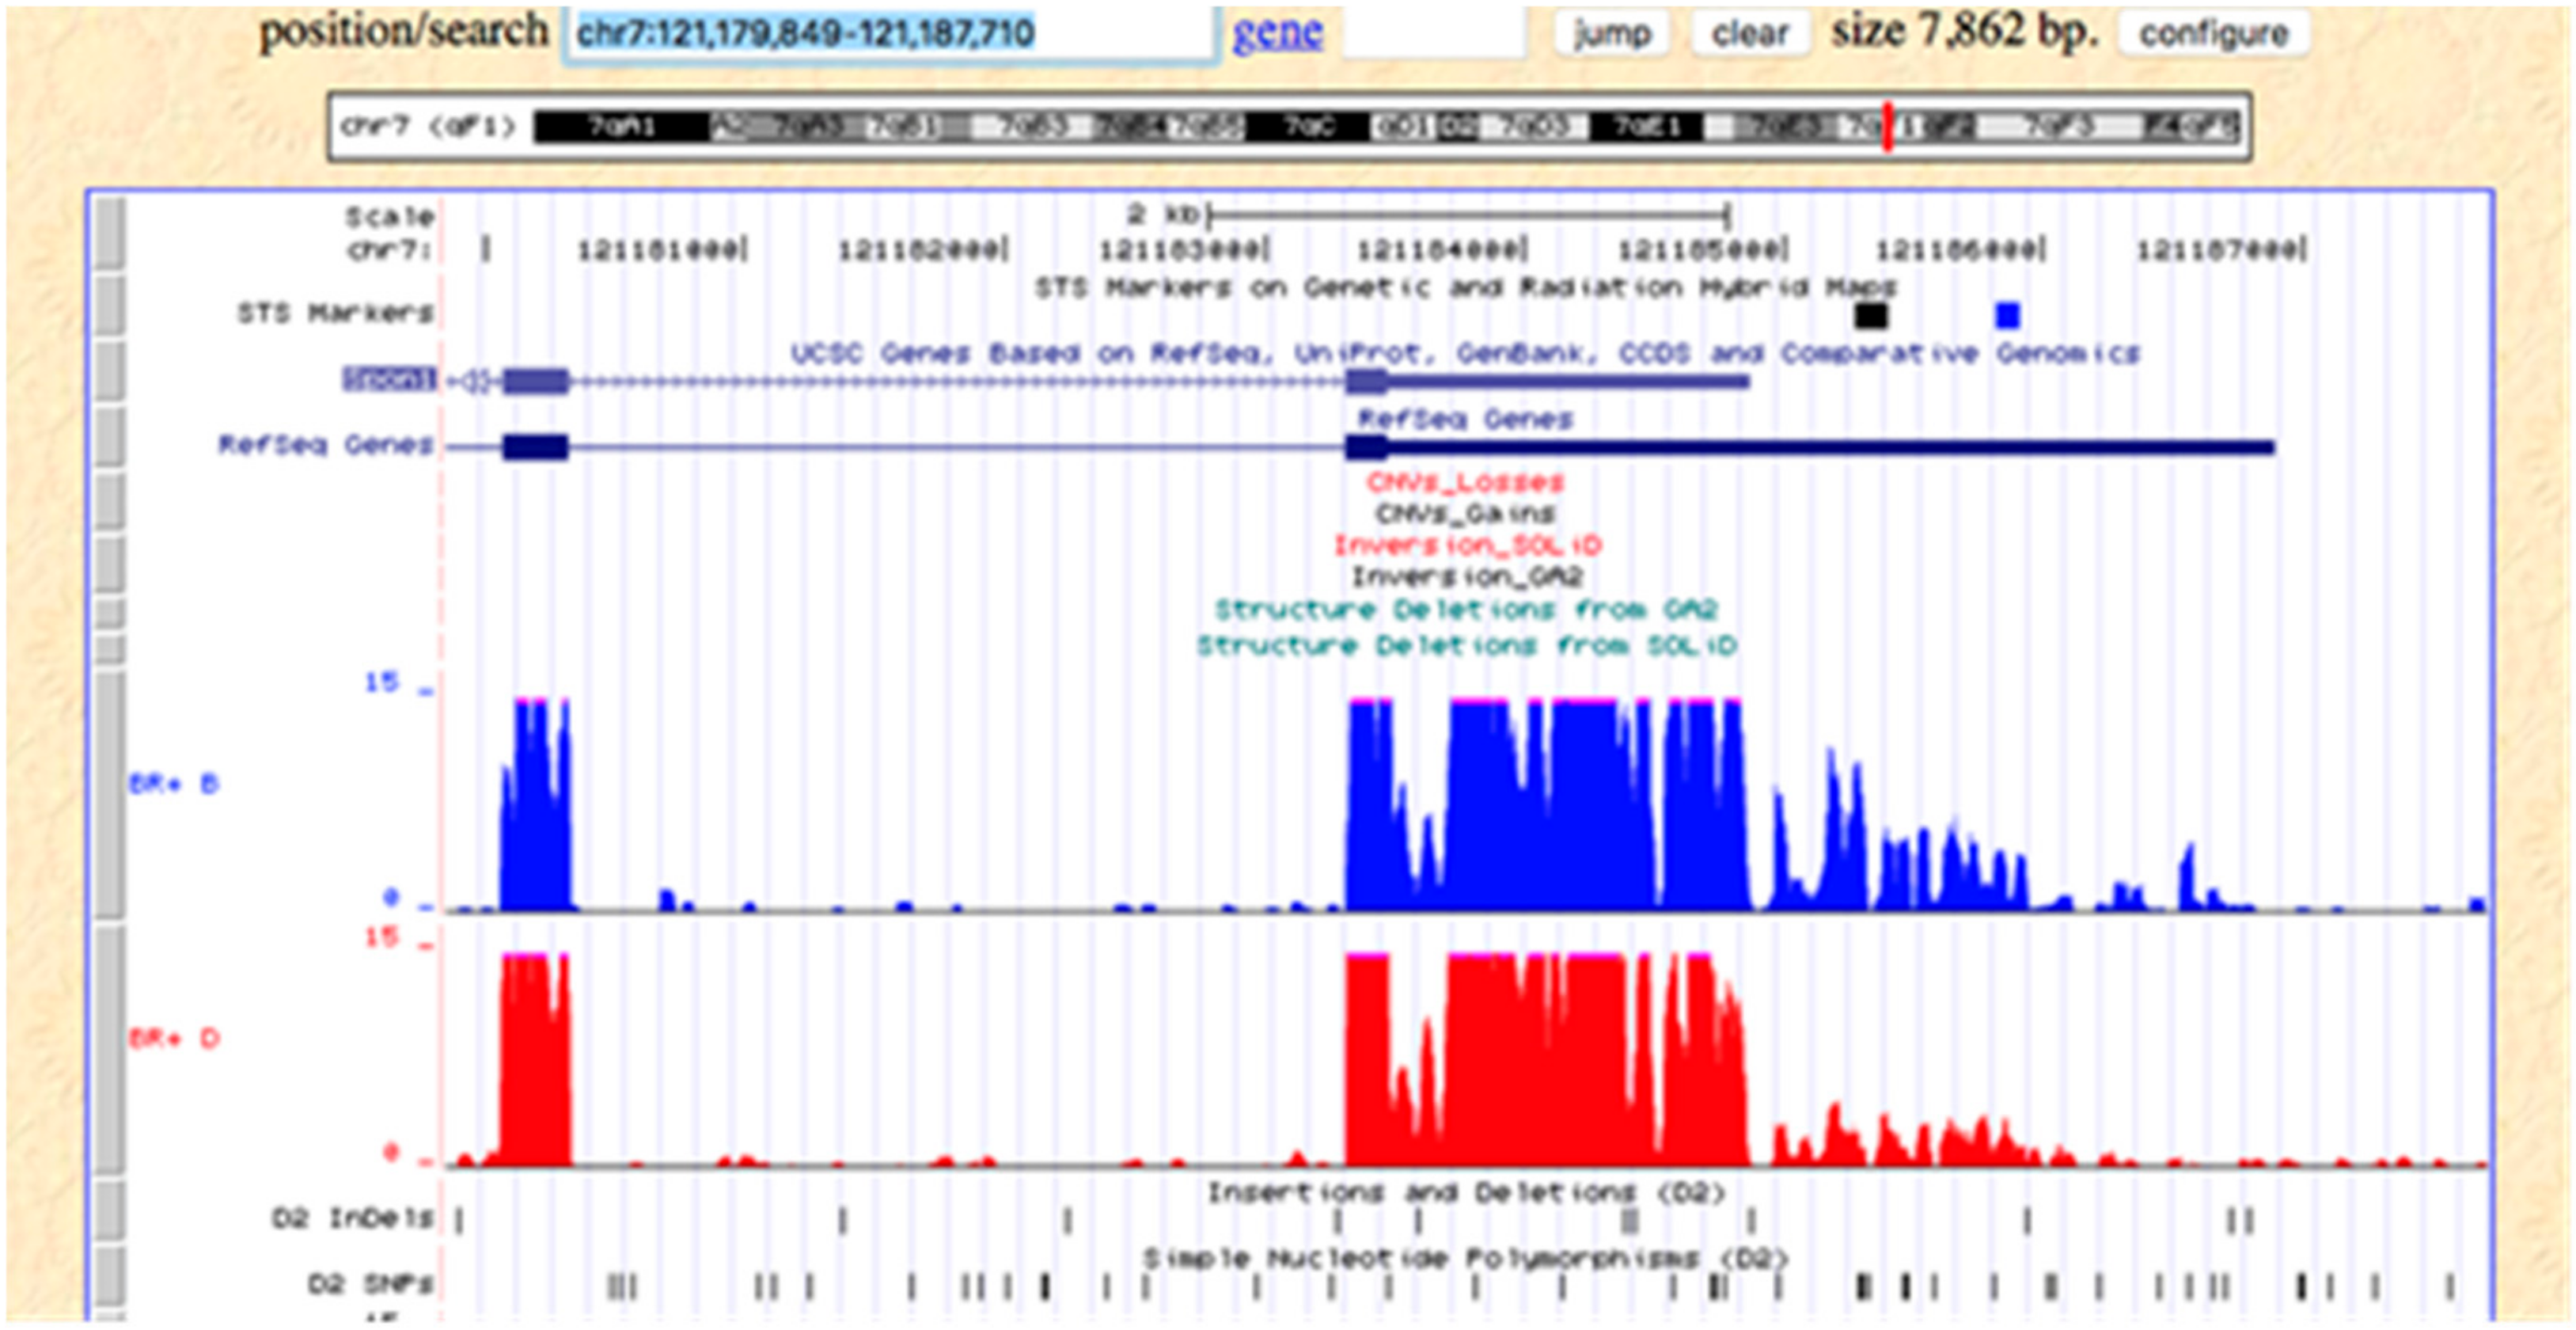
4.3. Mapping of IL1β Response to CORT + DFP
5. Discussion
6. Conclusions
Author Contributions
Funding
Conflicts of Interest
References
- Steele, L. Prevalence and patterns of Gulf War illness in Kansas veterans: Association of symptoms with characteristics of person, place and time of military service. Am. J. Epidemiol. 2000, 152, 992–1002. [Google Scholar] [CrossRef] [PubMed]
- Golomb, B.A. Acetylcholinesterase inhibitors and Gulf War illness. Proc. Natl. Acad. Sci. USA 2008, 105, 4295–4300. [Google Scholar] [CrossRef] [PubMed]
- Dantzer, R.; O’Connor, J.C.; Freund, G.G.; Johnson, R.W.; Kelley, K.W. From inflammation to sickness and depression: When the immune system subjugates the brain. Nat. Rev. Neurosci. 2008, 9, 46–56. [Google Scholar] [CrossRef] [PubMed]
- O’Callaghan, J.P.; Michalovicz, L.T.; Kelly, K.A. Supporting a neuroimmune basis of Gulf War Illness. EBioMedicine 2016, 13, 5–6. [Google Scholar]
- O’Callaghan, J.P.; Michalovicz, L.T.; Miller, J.V.; Kelly, K.A. Advancing the role of Neuroimmunity and Genetic Susceptibility in Gulf War Illness. EBiomedicine 2017, 26, 11–12. [Google Scholar] [CrossRef] [PubMed]
- Georgopoulos, A.P.; James, L.M.; Mahan, M.Y.; Joseph, J.; Georgopoulos, A.; Engdahl, B.E. Reduced human leukocyte antigen (HLA) protection in Gulf War Illness (GWI). EBioMedicine 2015, 3, 79–85. [Google Scholar] [CrossRef] [PubMed]
- Naviaux, R.K.; Naviaux, J.C.; Li, K.; Wang, L.; Monk, J.M.; Bright, A.T.; Koslik, H.J.; Ritchie, J.B.; Golomb, B.A. Metabolic features of Gulf War Illness. PLoS ONE 2019, 14, e0219531. [Google Scholar] [CrossRef] [PubMed]
- Locker, A.R.; Michalovicz, L.T.; Kelly, K.A.; Miller, J.V.; Miller, D.B.; O’Callaghan, J.P. Corticosterone primes the neuroinflammatory response to Gulf War-relevant organophosphates independently of acetylcholinesterase inhibition. J. Neurochem. 2017, 142, 444–445. [Google Scholar] [CrossRef] [PubMed]
- Steele, L.; Lockridge, O.; Gerkovich, M.M.; Cook, M.R.; Sastre, A. Butylcholinesterase genotype and enzyme activity in relation to Gulf War illness: Preliminary evidence of gene-exposure interaction from a case-control study of 1991 Gulf War veterans. Environ. Health 2015, 14, 4. [Google Scholar] [CrossRef] [PubMed]
- O’Callaghan, J.P.; Kelly, K.A.; Locker, A.R.; Miller, D.B.; Lasley, S.M. Corticosterone primes the neuroinflammatory response to DFP in mice: Potential animal model of Gulf War Illness. J. Neurochem. 2015, 133, 708–721. [Google Scholar]
- O’Callaghan, J.P.; Miller, D.B. Neuroinflammation disorders exacerbated by environmental stressors. Metabolism 2019, 100, 153951. [Google Scholar] [CrossRef] [PubMed]
- Ashbrook, D.G.; Arends, D.; Prins, P.; Mulligan, M.K.; Roy, S.; Williams, E.G.; Lutz, C.M.; Valenzuela, A.; Bohl, C.J.; Ingels, J.F.; et al. The expanded BXD family of mice: A cohort for experimental systems genetics and precision medicine. BioRxiv 2019. [Google Scholar] [CrossRef]
- Peirce, J.L.; Lu, L.; Gu, J.; Silver, L.M.; Williams, R.W. A new set of BXD recombinant inbred lines from advanced intercross populations in mice. BMC Genet. 2004, 5, 7. [Google Scholar] [CrossRef] [PubMed]
- Andreux, P.A.; Williams, E.G.; Koutnikiova, H.; Houtkooper, R.H.; Champy, M.F.; Schjoonjans, K.; Williams, R.W.; Auwerx, J. Systems genetics of metabolism: The use of BXD murine reference panel for multiscalar integration of traits. Cell 2012, 150, 1287–1299. [Google Scholar] [CrossRef] [PubMed]
- Alam, G.; Jones, B.C. Toxicogenetics: In search of host susceptibility to environmental toxicants. Front. Genet. 2014, 5, 327. [Google Scholar] [CrossRef] [PubMed][Green Version]
- Mulligan, M.K.; Mozhui, K.; Prins, P.; Williams, R.W. Genenetwork: A toolbox for systems genetics. Methods Mol. Biol. 2017, 1488, 75–120. [Google Scholar] [PubMed]
- Trevedi, M.S.; Abreu, M.M.; Sarria, L.; Ahmed, N.; Beljanski, V.; Fletcher, M.A.; Klimas, N.G.; Nathanson, L. Alterations in DNA methylation status associated with gulf war illness. DNA Cell Biol. 2019, 38, 561–571. [Google Scholar] [CrossRef] [PubMed]
- Ashbrook, D.G.; Hing, B.; Michalovicz, L.T.; Kelly, K.A.; Miller, J.V.; de Vega, W.C.; Miller, D.B.; Broderick, G.; O’Callaghan, J.P.; Mc Gowan, P.O. Epigenetic impacts of stress priming of the neuroinflammatory response to sarin surrogate in mice: A model of Gulf War Illness. J. Neuroinflamm. 2018, 15, 86. [Google Scholar] [CrossRef]
- Ermann, J.; Glimcher, L.H. After GWAS: Mice to the rescue? Curr. Opin. Immunol. 2012, 5, 564–570. [Google Scholar] [CrossRef]
- Jones, L.C.; Earley, C.J.; Allen, R.P.; Jones, B.C. Of mice and men, periodic limb movements and iron: How the human genome informs the mouse genome. Genes Brain Behav. 2008, 5, 513–514. [Google Scholar] [CrossRef]
- Zhao, J.; Kim, K.-A.; De Vera, J.; Palencia, S.; Wagle, M.; Abo, A. R-spondin1 protects mice from chemotherapy or radiation-induced oral mucositis through the canonical Wnt/β-catenin pathway. PNAS USA 2009, 106, 2331–2336. [Google Scholar] [CrossRef] [PubMed]
- Jahanshad, N.; Rajagopalan, P.; Hua, X.; Hibar, D.P.; Nir, T.M.; Toga, A.W.; Clifford, R., Jr.; Saykin, A.J.; Green, R.C.; Weiner, M.W.; et al. Genome-wide scan of healthy human connectome discovers SPON1 gene variant influence dementia severity. Proc. Natl. Acad. Sci. USA 2013, 110, 4768–4773. [Google Scholar] [CrossRef]
- Carrillo, G.L.; Su, J.; Monavarfeshani, A.; Fox, M.A. F-spondin is essential for maintaining circadian rhythms. Front. Neural Circuits 2018, 12, 13. [Google Scholar] [CrossRef] [PubMed]
- Mukudan, G.; Attur, G.D.; Palmer, H.E.; Al-Mussawir, M.D.; Teixeira, C.; Rifkin, M.D.; Appelton, T.G.; Beier, F.; Abramson, S.B. F-spondin, a neuroregulatory protein, is up-regulated in osteoarthritis and regulates cartilage metabolism via TGF-β activation. FASEB J. 2009, 23, 79–89. [Google Scholar]
- Li, Z.; Mulligan, M.K.; Wang, X.; Miles, M.F.; Lu, L.; Williams, R.W. A transposon in Comt generates mRNA variants and causes widespread expression and behavioral differences among mice. PLoS ONE 2010. [Google Scholar] [CrossRef] [PubMed]
- Kim, K.A.; Wagle, M.; Tran, K.; Zhan, X.; Dixon, M.A.; Liu, S.; Gros, D.; Korver, W.; Yonkovich, S.; Tomasevic, N.; et al. R-Spondin family members regulate the Wnt pathway by a common mechanism. Mol. Biol. Cell. 2008, 19, 2588–2596. [Google Scholar] [CrossRef] [PubMed]
- Sherva, R.; Tripodis, Y.; Bennett, D.A.; Chibnik, L.B.; Crane, P.K.; de Jager, P.L.; Farrer, L.A.; Saykin, A.J.; Shulman, J.M.; Naj, A.; et al. The GENAROAD Consortium, The Alzheimer’s Disease Neuroimaging Initiative, and the Alzheimer’s Disease Genetics Consortium. Genome-wide association study of the rate of cognitive decline in Alzheimer’s disease. Alzheimer Dement. 2014, 10, 45–52. [Google Scholar] [CrossRef]
- Hafez, D.M.; Huang, J.Y.; Richardson, J.C.; Masliah, E.; Peterson, D.A.; Marr, R.A. F-spondin gene transfer improves memory performance and reduces amyloid-β levels in mice. Neuroscience 2012, 223, 465–472. [Google Scholar] [CrossRef][Green Version]


| Control | Day 1–7 plain water; day 8 saline injection followed 6 h later by PFC harvest |
| CORT | Day 1–7 Corticosterone in drinking water; day 8 saline injection followed 6h later by PFC harvest |
| DFP: | Day 1–7 plain water; day 8 DFP injection followed 6 h later by PFC harvest |
| C + D | Day1–7 Corticosterone in drinking water; day 8 DFP injection followed 6h later by PFC harvest |
© 2020 by the authors. Licensee MDPI, Basel, Switzerland. This article is an open access article distributed under the terms and conditions of the Creative Commons Attribution (CC BY) license (http://creativecommons.org/licenses/by/4.0/).
Share and Cite
Jones, B.C.; Miller, D.B.; Lu, L.; Zhao, W.; Ashbrook, D.G.; Xu, F.; Mulligan, M.K.; Williams, R.W.; Zhuang, D.; Torres-Rojas, C.; et al. Modeling the Genetic Basis of Individual Differences in Susceptibility to Gulf War Illness. Brain Sci. 2020, 10, 143. https://doi.org/10.3390/brainsci10030143
Jones BC, Miller DB, Lu L, Zhao W, Ashbrook DG, Xu F, Mulligan MK, Williams RW, Zhuang D, Torres-Rojas C, et al. Modeling the Genetic Basis of Individual Differences in Susceptibility to Gulf War Illness. Brain Sciences. 2020; 10(3):143. https://doi.org/10.3390/brainsci10030143
Chicago/Turabian StyleJones, Byron C., Diane B. Miller, Lu Lu, Wenyuan Zhao, David G. Ashbrook, Fuyi Xu, Megan K. Mulligan, Robert W. Williams, Daming Zhuang, Carolina Torres-Rojas, and et al. 2020. "Modeling the Genetic Basis of Individual Differences in Susceptibility to Gulf War Illness" Brain Sciences 10, no. 3: 143. https://doi.org/10.3390/brainsci10030143
APA StyleJones, B. C., Miller, D. B., Lu, L., Zhao, W., Ashbrook, D. G., Xu, F., Mulligan, M. K., Williams, R. W., Zhuang, D., Torres-Rojas, C., & O’Callaghan, J. P. (2020). Modeling the Genetic Basis of Individual Differences in Susceptibility to Gulf War Illness. Brain Sciences, 10(3), 143. https://doi.org/10.3390/brainsci10030143