Differential Expression of Genes Related to Innate Immune Responses in Ex Vivo Spinal Cord and Cerebellar Slice Cultures Infected with West Nile Virus

 ,
,
Abstract
:1. Introduction
2. Methods
2.1. Cerebellar and Spinal Cord Slice Cultures
2.2. Infection with WNV
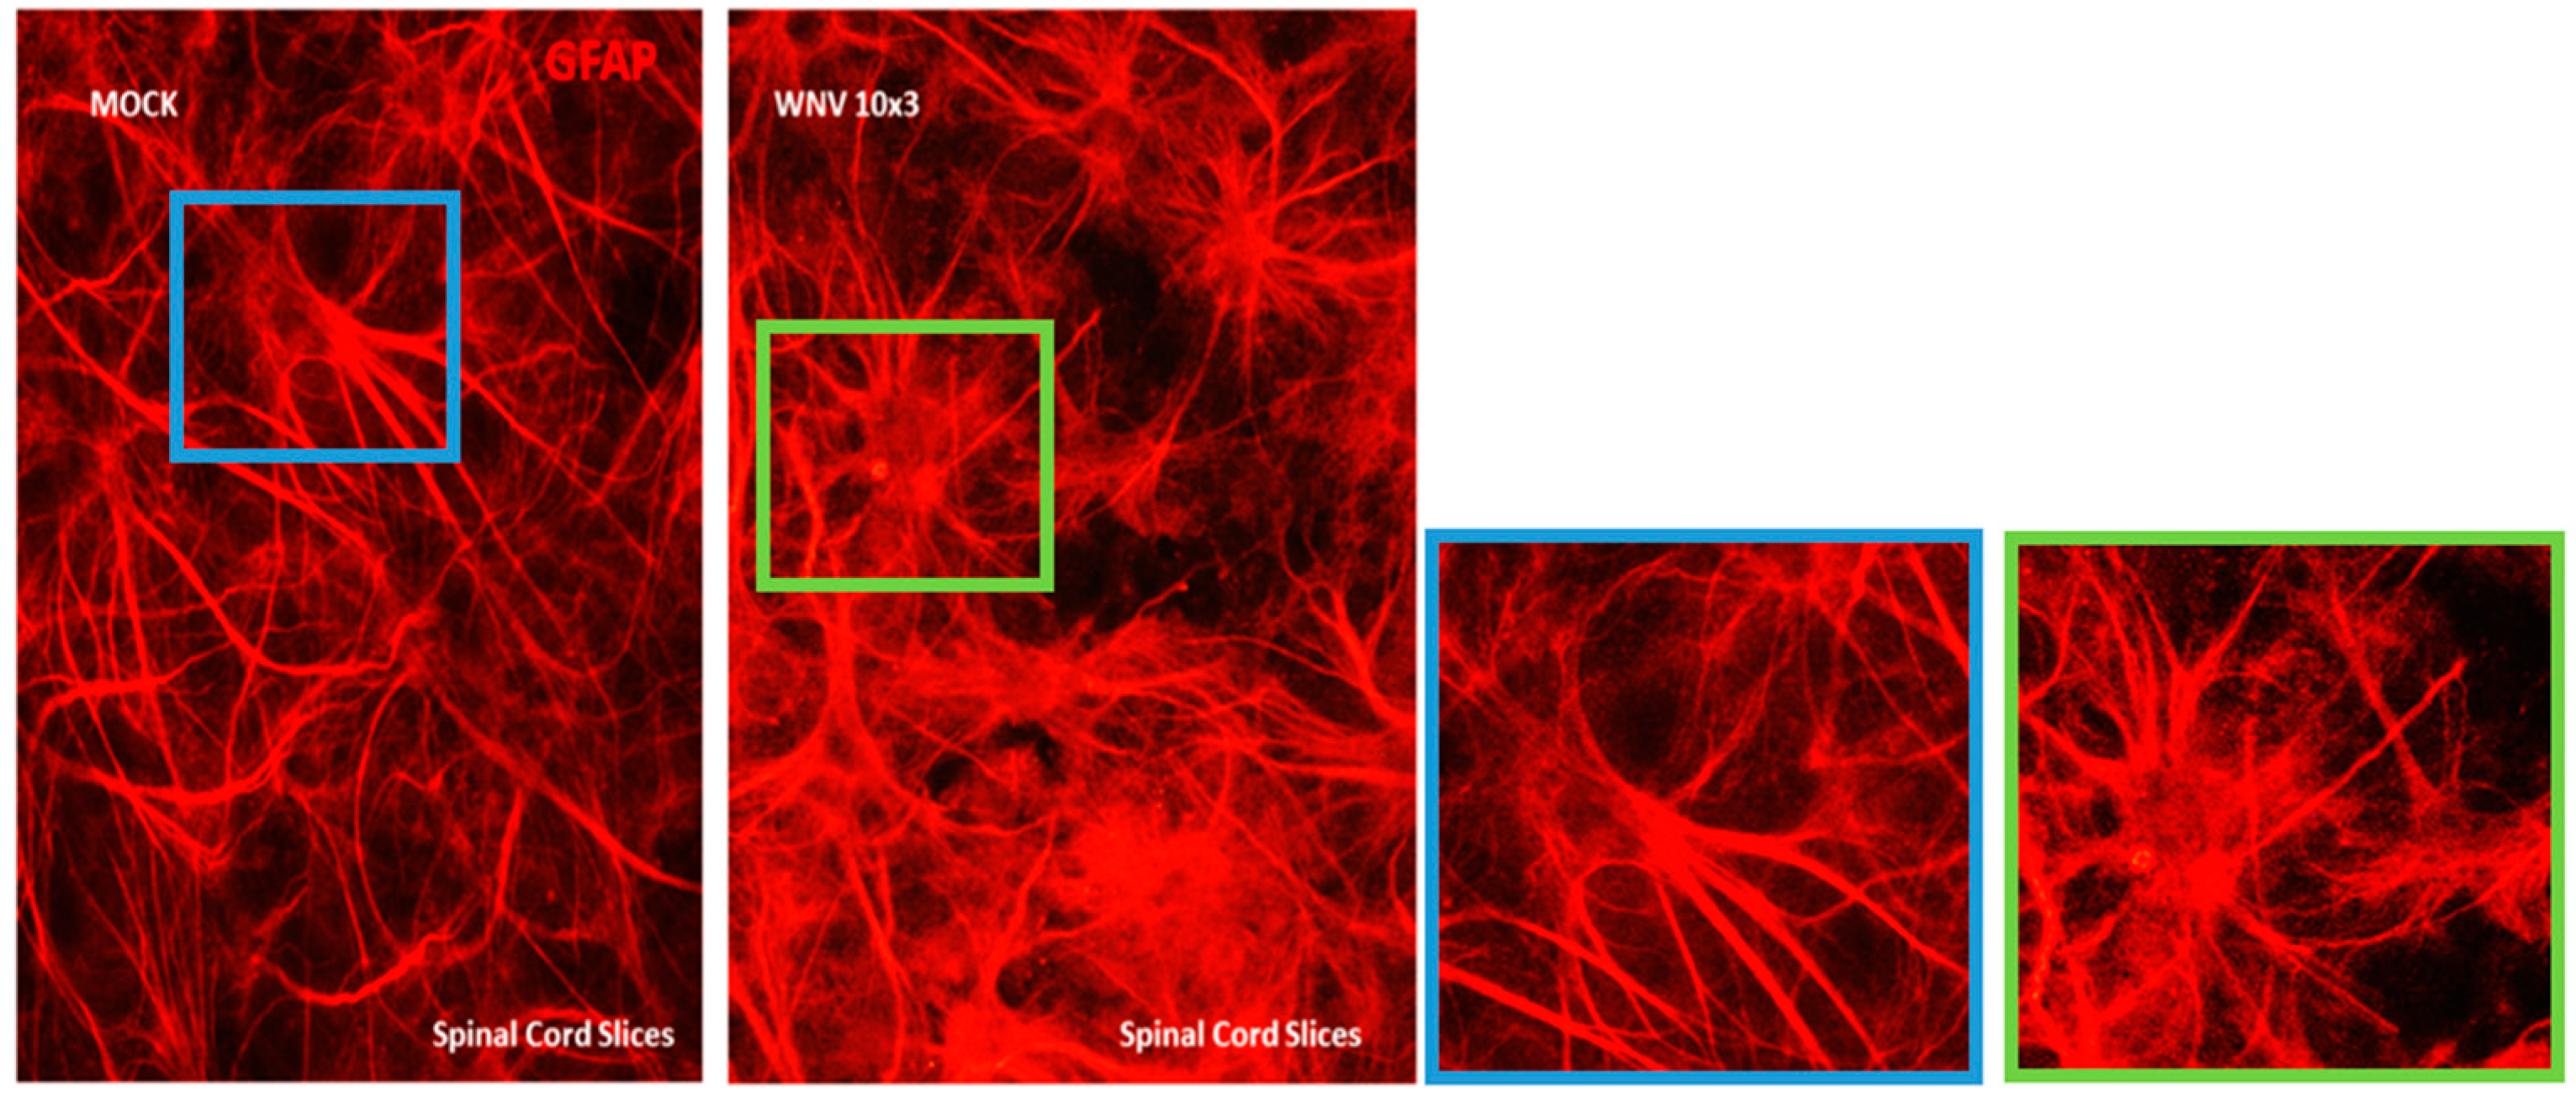
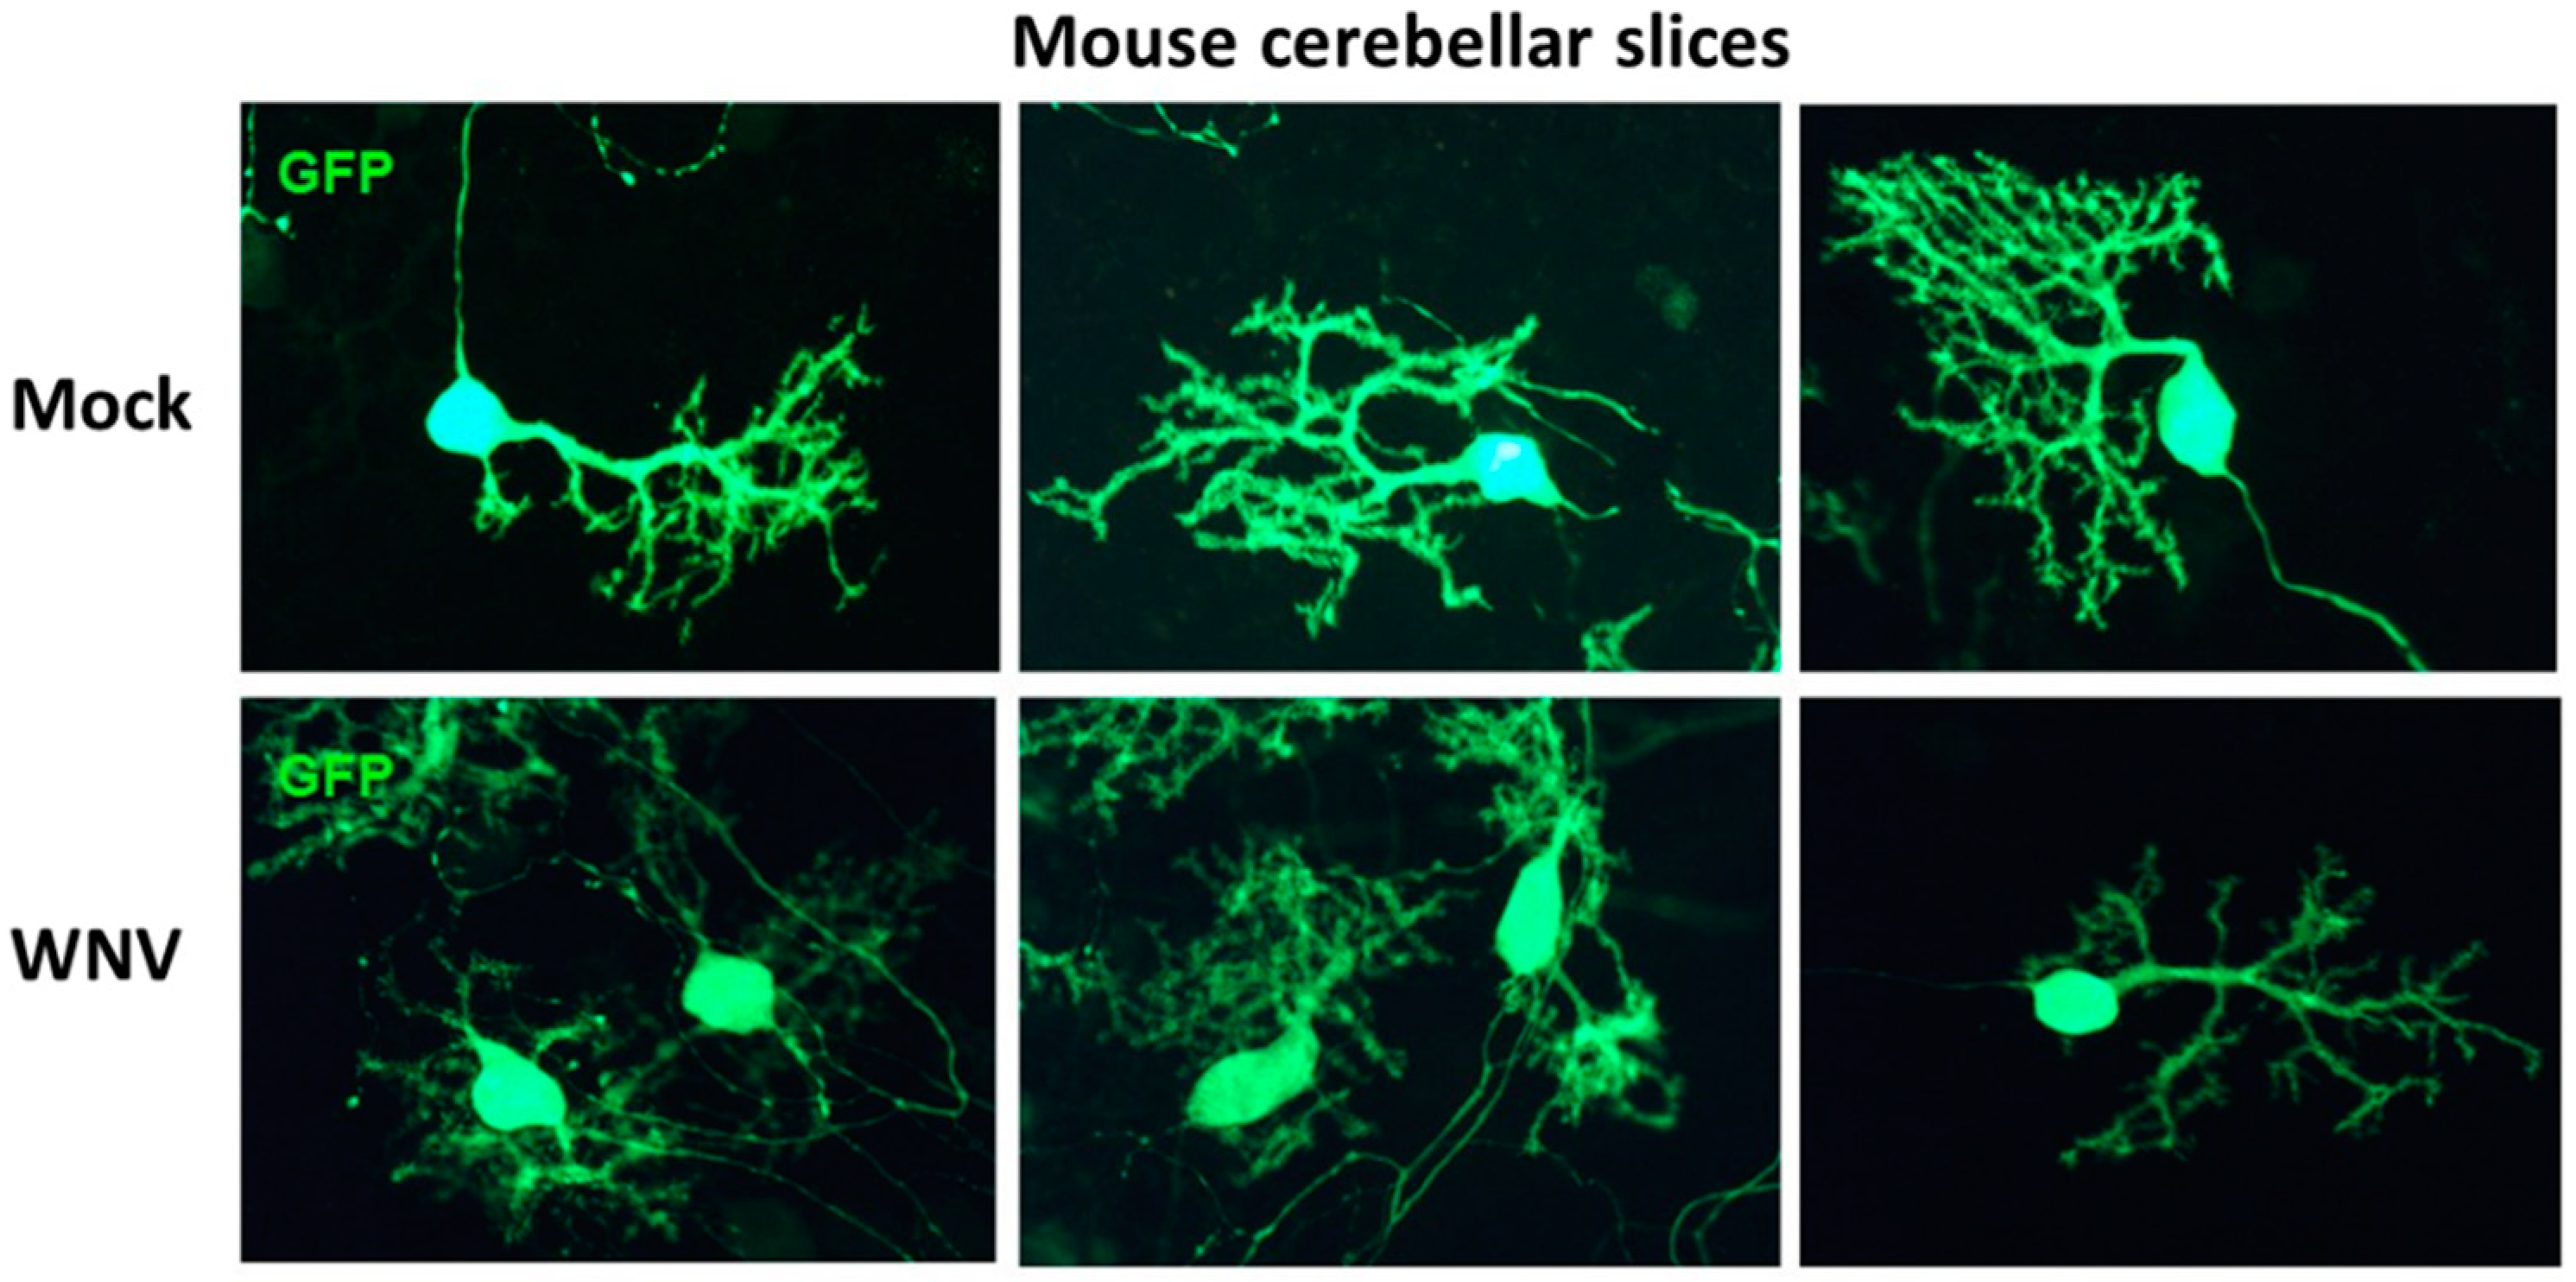
2.3. Immunofluorescence
2.4. RNA Extraction and Gene Array Analysis
3. Results
4. Discussion
5. Conclusions
Author Contributions
Funding
Acknowledgments
Conflicts of Interest
References
- O’Leary, D.R.; Marfin, A.A.; Montgomery, S.P.; Kipp, A.M.; Lehman, J.A.; Biggerstaff, B.J.; Elko, V.L.; Collins, P.D.; Jones, J.E.; Campbell, G.L. The epidemic of West Nile virus in the United States, 2002. Vector-Borne Zoonotic Dis. 2004, 4, 61–70. [Google Scholar] [CrossRef]
- De Filette, M.; Ulbert, S.; Diamond, M.S.; Sanders, N.N. Recent progress in West Nile virus diagnosis and vaccination. Vet. Res. 2012, 43, 16–31. [Google Scholar] [CrossRef] [PubMed]
- Blakely, P.K.; Kleinschmidt-DeMasters, B.K.; Tyler, K.L.; Irani, D.N. Disrupted Glutamate Transporter Expression in the Spinal Cord with Acute Flaccid Paralysis Due to West Nile Virus Infection. J. Neuropathol. Exp. Neurol. 2009, 68, 1061–1072. [Google Scholar] [CrossRef] [PubMed]
- Kleinschmidt-DeMasters, B.K.; Beckham, J.D. West Nile Virus Encephalitis 16 Years Later. Brain Pathol. 2015, 25, 625–633. [Google Scholar] [CrossRef] [PubMed]
- Hayes, E.B.; Sejvar, J.J.; Zaki, S.R.; Lanciotti, R.S.; Bode, A.V.; Campbell, G.L. Virology, pathology, and clinical manifestations of West Nile virus disease. Emerg. Infect. Dis. 2005, 11, 1174. [Google Scholar] [CrossRef] [PubMed]
- Kuo, D.C.; Bilal, S.; Koller, P. Asymmetric Weakness and West Nile Virus Infection. J. Emerg. Med. 2015, 49, 274–276. [Google Scholar] [CrossRef]
- Leis, A.A.; Szatmary, G.; Ross, M.A.; Stokic, D.S. West nile virus infection and myasthenia gravis. Muscle Nerve 2014, 49, 26–29. [Google Scholar] [CrossRef]
- Hawkes, M.A.; Hocker, S.E.; Leis, A.A. West Nile virus induces a post-infectious pro-inflammatory state that explains transformation of stable ocular myasthenia gravis to myasthenic crises. J. Neurol. Sci. 2018, 395, 1–3. [Google Scholar] [CrossRef]
- Fratkin, J.D.; Leis, A.A.; Stokic, D.S.; Slavinski, S.A.; Geiss, R.W. Spinal Cord Neuropathology in Human West NileVirus Infection. Arch. Pathol. Lab. Med. 2004, 128, 533–537. [Google Scholar]
- Armah, H.B.; Wang, G.; Omalu, B.I.; Tesh, R.B.; Gyure, K.A.; Chute, D.J.; Smith, R.D.; Dulai, P.; Vinters, H.V.; Kleinschmidt-DeMasters, B.K.; et al. Systemic distribution of West Nile virus infection: Postmortem immunohistochemical study of six cases. Brain Pathol. 2007, 17, 354–362. [Google Scholar] [CrossRef]
- Leis, A.A.; Stokic, D.S.; Petzold, A. Glial S100B is elevated in serum across the spectrum of West Nile virus infection. Muscle Nerve 2012, 45, 826–830. [Google Scholar] [CrossRef]
- Petzold, A.; Groves, M.; Leis, A.A.; Scaravilli, F.; Stokic, D.S. Neuronal and glial cerebrospinal fluid protein biomarkerare elevated after West Nile virus infection. Muscle Nerve 2010, 41, 42–49. [Google Scholar] [CrossRef] [PubMed]
- Shrestha, B.; Gottlieb, D.; Diamond, M.S. Infection and injury of neurons by West Nile encephalitis virus. J. Virol. 2003, 77, 13203–13213. [Google Scholar] [CrossRef] [PubMed]
- Yang, J.-S.; Ramanathan, M.P.; Muthumani, K.; Choo, A.Y.; Jin, S.H.; Yu, Q.C.; Hwang, D.S.; Choo, D.K.; Lee, M.D.; Dang, K.; et al. Induction of inflammation by West Nile virus capsid through the caspase-9 apoptotic pathway. Emerg. Infect. Dis. 2002, 8, 1379–1384. [Google Scholar] [CrossRef] [PubMed]
- Lobigs, M.; Blanden, R.V.; Müllbacher, A. Flavivirus-Induced Up-regulation of MHC Class I Antigens; Implications for the Induction of CD8+ T-Cell-Mediated Autoimmunity. Immunol. Rev. 1996, 152, 5–19. [Google Scholar] [CrossRef]
- Kesson, A.M.; King, N.J. Transcriptional regulation of major histocompatibility complex class I by flavivirus West Nile is dependent on NF-κB activation. J. Infect. Dis. 2001, 184, 947–954. [Google Scholar] [CrossRef] [PubMed]
- Quick, E.D.; Leser, J.S.; Clarke, P.; Tyler, K.L. Activation of Intrinsic Immune Responses and Microglial Journal of Virology Phagocytosis in an Ex Vivo Spinal Cord Slice Culture Model of West Nile Virus Infection. J. Virol. 2014, 88, 13005–13014. [Google Scholar] [CrossRef] [PubMed]
- Stetson, D.B.; Medzhitov, R. Type I interferons in host defense. Immunity 2006, 25, 373–381. [Google Scholar] [CrossRef] [PubMed]
- Takeuchi, O.; Akira, S. Innate immunity to virus infection. Immunol. Rev. 2009, 227, 75–86. [Google Scholar] [CrossRef] [PubMed] [Green Version]
- Gonzalez-Navajas, J.M.; Lee, J.; David, M.; Raz, E. Immunomodulatory functions of type I. interferons. Nat. Rev. Immunol. 2012, 12, 125–135. [Google Scholar] [CrossRef] [PubMed]
- Platanias, L.C. Mechanisms of type-I- and type-II-interferon-mediated signalling. Nat. Rev. Immunol. 2005, 5, 375–386. [Google Scholar] [CrossRef] [PubMed]
- Lindqvist, R.; Mundt, F.; Gilthorpe, J.D.; Wölfel, S.; Gekara, N.O.; Kröger, A.; Överby, A.K. Fast type I interferon response protects astrocytes from flavivirus infection and virus-induced cytopathic effects. J. Neuroinflam. 2016, 13, 277. [Google Scholar] [CrossRef] [PubMed]
- Choi, J.; Biering, S.B.; Hwang, S. Quovadis? Interferon-inducible GTPases go to their target membranes via the LC3-conjugation system of autophagy. Small GTPases 2017, 8, 199–207. [Google Scholar] [CrossRef] [PubMed]
- Premzl, M. Comparative genomic analysis of eutherianinterferon-gamma-inducible GTPases. Funct. Integr. Genom. 2012, 12, 599–607. [Google Scholar] [CrossRef] [PubMed]
- Li, L.; Wang, H.; Jin, H.; Cao, Z.; Feng, N.; Zhao, Y.; Zheng, X.; Wang, J.; Li, Q.; Zhao, G.; et al. Interferon-inducible GTPase: A novel viral response protein involved in rabies virus infection. Arch Virol. 2016, 161, 1285–1293. [Google Scholar] [CrossRef] [PubMed]
- Vig, P.J.; Hearst, S.; Shao, Q.; Lopez, M.E.; Murphy, H.A.; Safaya, E. Glial S100B protein modulates mutant ataxin-1 aggregation and toxicity: TRTK12 peptide, a potential candidate for SCA1 therapy. Cerebellum 2011, 10, 254–266. [Google Scholar] [CrossRef] [PubMed]
- Clarke, P.; Leser, J.S.; Quick, E.D.; Dionne, K.R.; Beckham, J.D.; Tyler, K.L. Death receptor-mediated apoptotic signaling is activated in the brain following infection with West Nile virus in the absence of a peripheral immune response. J. Virol. 2014, 88, 1080–1089. [Google Scholar] [CrossRef]
- Cui, X.; Churchill, G.A. Statistical tests for differential expression in cDNA microarray experiments. Genome Biol. 2003, 4, 210. [Google Scholar] [CrossRef] [Green Version]
- Li, W. Volcano plots in analyzing differential expressions with mRNA microarrays. J. Bioinform. Comput. Biol. 2012, 10, 1231003. [Google Scholar] [CrossRef]
- Shrestha, B.; Diamond, M.S. Role of CD8_ T cells in control of West Nile virus infection. J. Virol. 2004, 78, 8312–8321. [Google Scholar] [CrossRef]
- Shrestha, B.; Zhang, B.; Purtha, W.E.; Klein, R.S.; Diamond, M.S. Tumor necrosis factor alpha protects against lethal West Nile virus infection by promoting trafficking of mononuclear leukocytes into the central nervous system. J. Virol. 2008, 82, 8956–8964. [Google Scholar] [CrossRef] [PubMed]
- Brien, J.D.; Daffis, S.; Lazear, H.M.; Cho, H.; Suthar, M.S.; Gale, M., Jr.; Diamond, M.S. Interferon regulatory factor-1 (IRF-1) shapes both innate and CD8_ T cell immune responses against West Nile virus infection. PLoS Pathog. 2011, 7, e1002230. [Google Scholar] [CrossRef] [PubMed]
- Szretter, K.J.; Brien, J.D.; Thackray, L.B.; Virgin, H.W.; Cresswell, P.; Diamond, M.S. The interferon-inducible gene viperin restricts West Nile virus pathogenesis. J. Virol. 2011, 85, 11557–11566. [Google Scholar] [CrossRef] [PubMed]
- Dai, J.; Pan, W.; Wang, P. ISG15 facilitates cellular antiviral response to dengue and west Nile virus infection in vitro. Virol. J. 2011, 8, 468–474. [Google Scholar] [CrossRef] [PubMed]
- Kajaste-Rudnitski, A.; Mashimo, T.; Frenkiel, M.P.; Guénet, J.L.; Lucas, M.; Desprès, P. The 2′,5′-oligoadenylate synthetase 1b is a potent inhibitor of West Nile virus replication inside infected cells. J. Biol. Chem. 2006, 281, 4624–4637. [Google Scholar] [CrossRef] [PubMed]
- Daffis, S.; Suthar, M.S.; Szretter, K.J.; Gale, M., Jr.; Diamond, M.S. Induction of IFN-beta and the innate antiviral response in myeloid cells occurs through an IPS-1-dependent signal that does not require IRF-3 and IRF-7. PLoS Pathog. 2009, 5, e1000607. [Google Scholar] [CrossRef] [PubMed]
- Liu, W.J.; Wang, X.J.; Clark, D.C.; Lobigs, M.; Hall, R.A.; Khromykh, A.A. A single amino acid substitution in the West Nile virus nonstructural protein NS2A disables its ability to inhibit alpha/beta interferon induction and attenuates virus virulence in mice. J. Virol. 2006, 80, 2396–2404. [Google Scholar] [CrossRef]
- Scholle, F.; Mason, P.W. West Nile virus replication interferes with both poly (I:C)-induced interferon gene transcription and response to interferon treatment. Virology 2005, 342, 77–87. [Google Scholar] [CrossRef]
- Wilson, J.R.; de Sessions, P.F.; Leon, M.A.; Scholle, F. West Nile virus nonstructural protein 1 inhibits TLR3 signal transduction. J. Virol. 2008, 82, 8262–8271. [Google Scholar] [CrossRef]
- Fredericksen, B.L.; Gale, M., Jr. West Nile virus evades activation of interferon regulatory factor 3 through RIG-I-dependent and -independent pathways without antagonizing host defense signaling. J. Virol. 2006, 80, 2913–2923. [Google Scholar] [CrossRef]
- Guo, J.T.; Hayashi, J.; Seeger, C. West Nile virus inhibits the signal transduction pathway of alpha interferon. J. Virol. 2005, 79, 1343–1350. [Google Scholar] [CrossRef] [PubMed]
- Muñoz-Jordán, J.L.; Laurent-Rolle, M.; Ashour, J.; Martínez-Sobrido, L.; Ashok, M.; Lipkin, W.I.; García-Sastre, A. Inhibition of alpha/beta interferon signaling by the NS4B protein of flaviviruses. J. Virol. 2005, 79, 8004–8013. [Google Scholar] [CrossRef] [PubMed]
- Chan-Tack, K.M.; Forrest, G. Failure of interferon alpha-2b in a patient with West Nile virus meningoencephalitis and acute flaccid paralysis. Scand. J. Infect. Dis. 2005, 37, 944–946. [Google Scholar] [CrossRef] [PubMed]
- Seo, J.Y.; Yaneva, R.; Cresswell, P. Viperin: A. multifunctional, interferon-inducible protein that regulates virus replication. Cell Host Microbe 2011, 10, 534–539. [Google Scholar] [CrossRef] [PubMed]
- Mattijssen, S.; Pruijn, G.J. Viperin, a key player in the antiviral response. Microbes Infect. 2012, 14, 419–426. [Google Scholar] [CrossRef] [PubMed]
- Lindqvist, R.; Kurhade, C.; Gilthorpe, J.D.; Överby, A.K. Cell-type- and region-specific restriction of neurotropic flavivirus infection by viperin. J. Neuroinflam. 2018, 15, 80–91. [Google Scholar] [CrossRef]
- Detje, C.N.; Lienenklaus, S.; Chhatbar, C.; Spanier, J.; Prajeeth, C.K.; Soldner, C.; Tovey, M.G.; Schlüter, D.; Weiss, S.; Stangel, M.; et al. Upon intranasal vesicular stomatitis virus infection, astrocytes in the olfactory bulb are important interferon beta producers that protect from lethal encephalitis. J. Virol. 2015, 89, 2731–2738. [Google Scholar] [CrossRef]
- Kallfass, C.; Ackerman, A.; Lienenklaus, S.; Weiss, S.; Heimrich, B.; Staeheli, P. Visualizing production of beta interferon by astrocytes and microglia in brain of La Crosse virus-infected mice. J. Virol. 2012, 86, 11223–11230. [Google Scholar] [CrossRef]
- Leis, A.A.; Stokic, D.S. Neuromuscular manifestations of West Nile virus infection. Front. Neurol. 2012, 3, 37. [Google Scholar] [CrossRef]


| Gene Name | Gene Designation | 103 PFU | Fold Upregulation 105 PFU | 107 PFU |
|---|---|---|---|---|
| Interferon-induced protein 44 | Ifi44 | 127 | 162 | 156 |
| Lymphocyte antigen 6 complex locus A | Ly6a | 80 | 114 | 136 |
| Interferon-induced protein with tetratricopeptide repeats | Ifit1 | 29 | 37 | 40 |
| Viperin | Rsad2 | 24 | 29 | 33 |
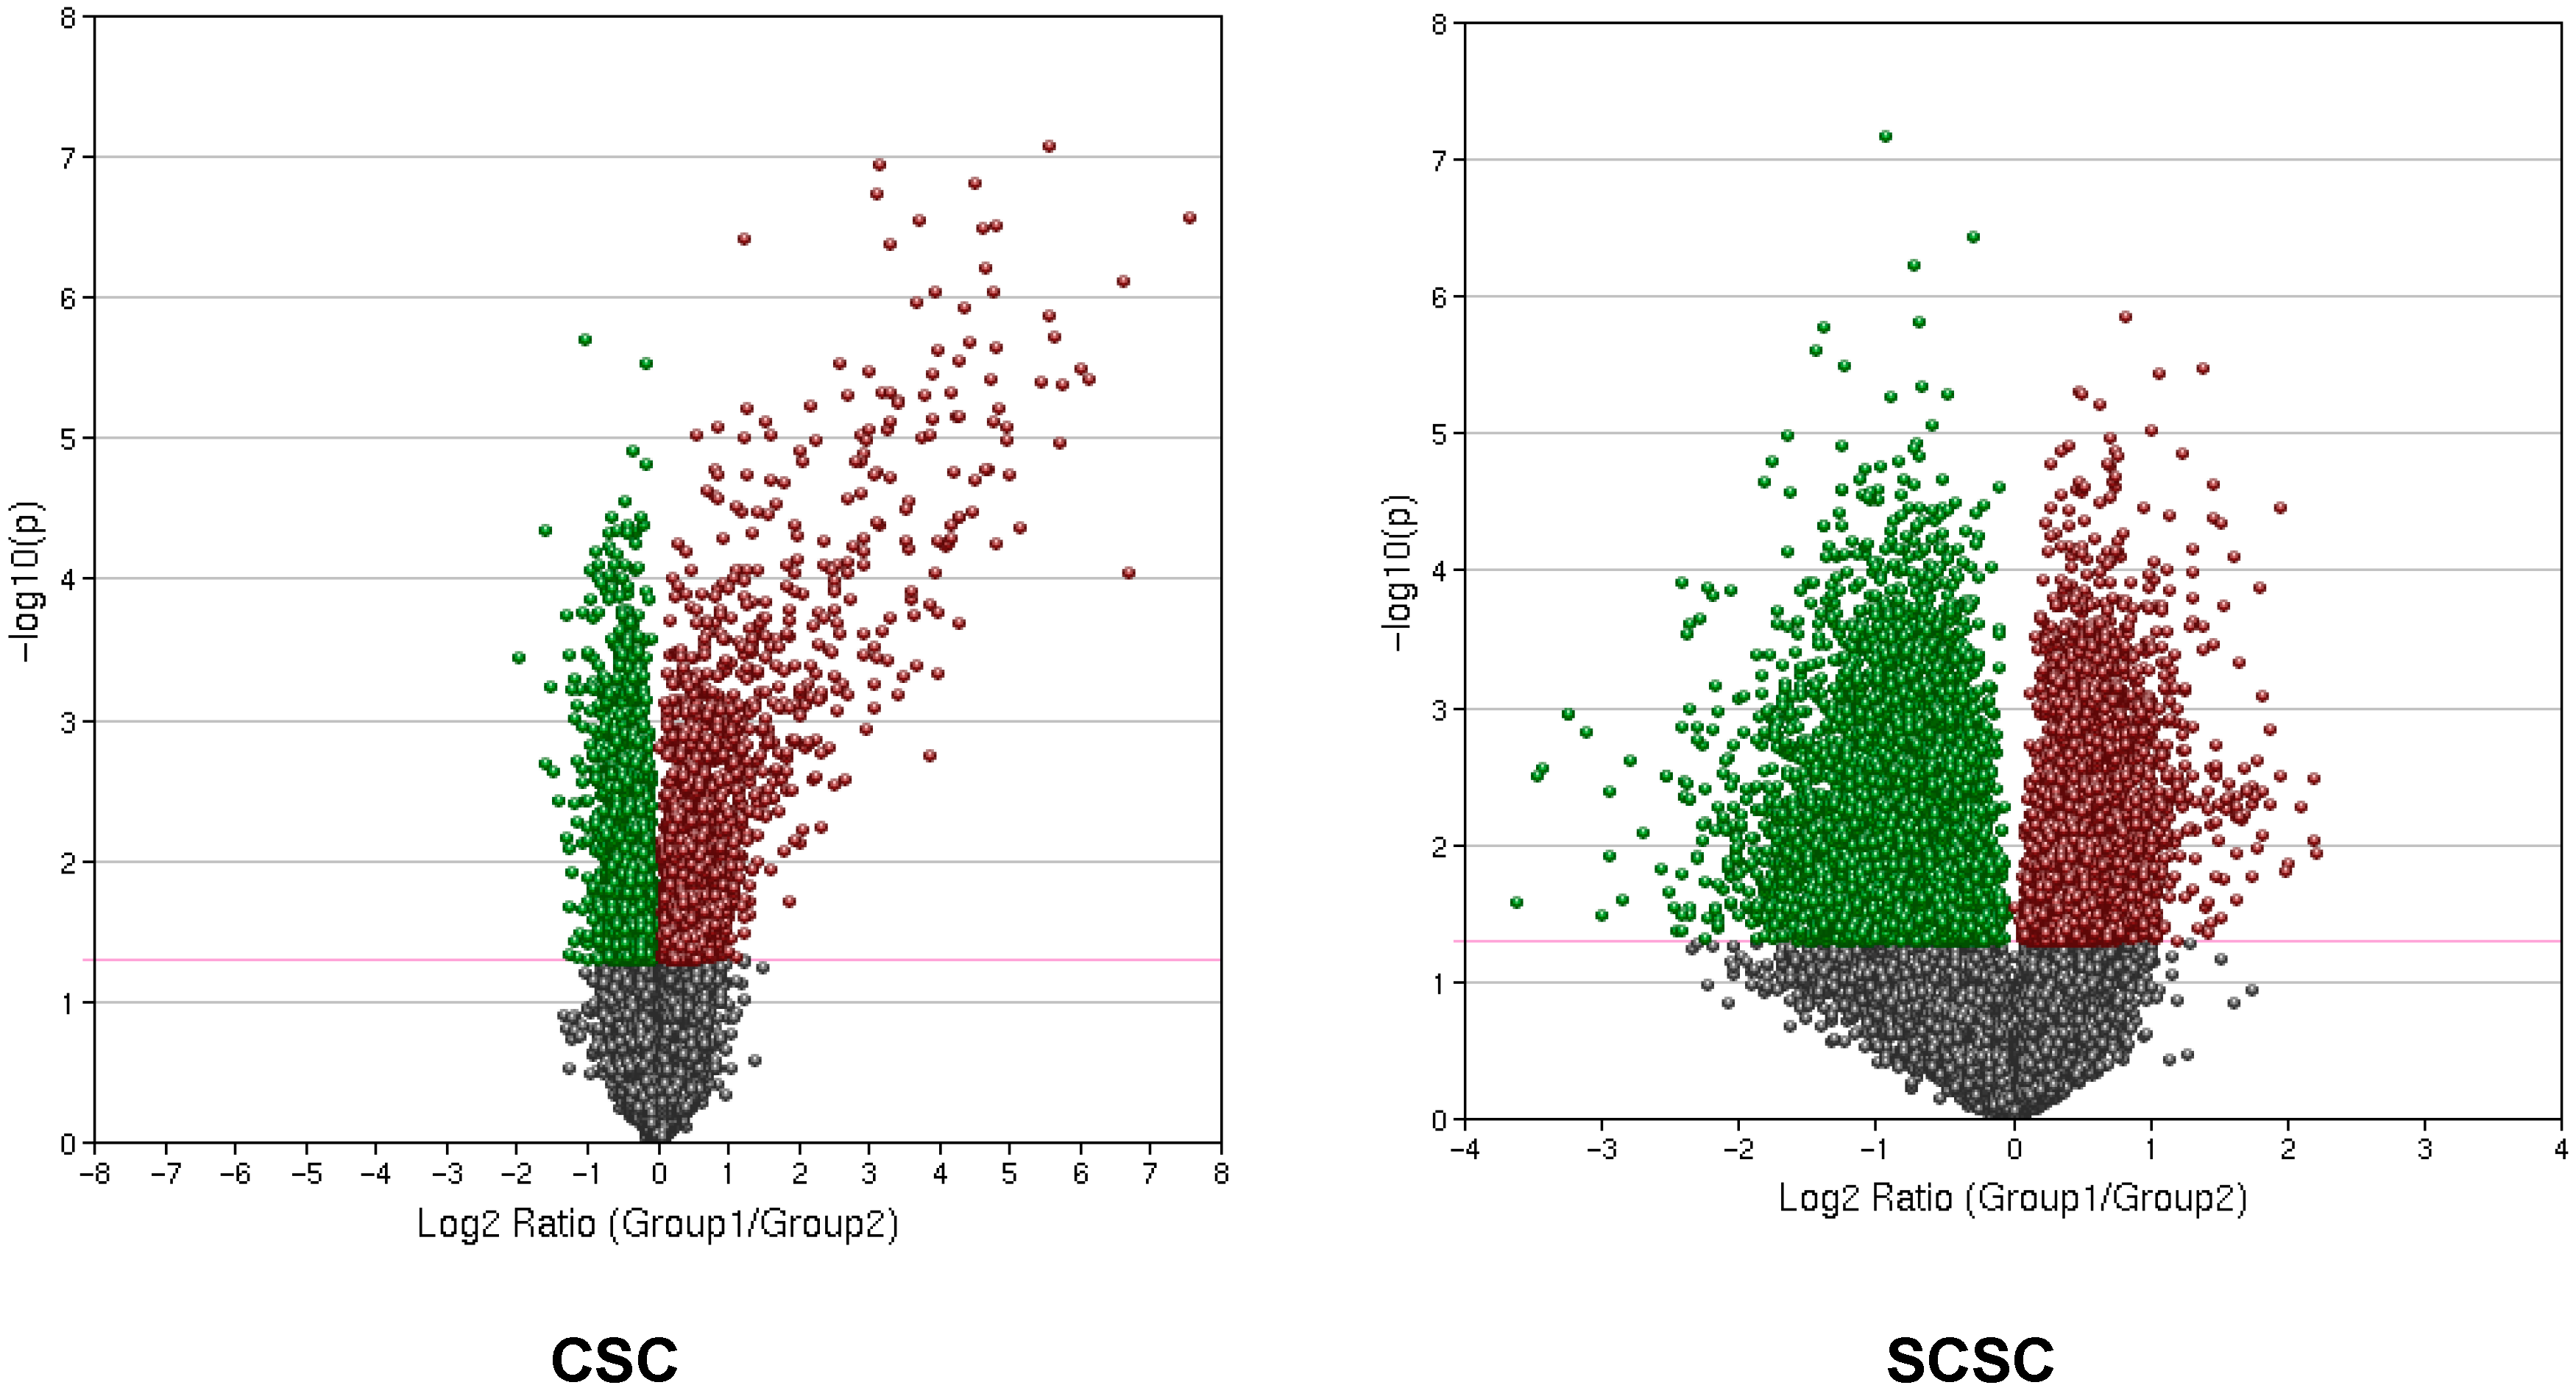
| Gene Category | Cerebellum (Total) | Spinal Cord (Total) |
|---|---|---|
| Upregulated | 2756 | 6884 |
| Downregulated | 3856 | 5853 |
| Function | Gene Designation | Name | Fold Upregulation | p Value |
|---|---|---|---|---|
| Chemoattractant for immune cells | Cxcl10 | C–X–C motif chemokine 10 | 22.86 | 0.0045 |
| Ccl5 | Chemokine (C–C motif) ligand 5 | 27.82 | 5.47 × 10⁻⁵ | |
| IFN-inducible GTPase | Irgm1 | Immunity-related GTPase family M member1 | 12.82 | 1.08 × 10⁻⁶ |
| Irgm2 | Immunity-related GTPase family M member2 | 21.35 | 2.03 × 10⁻⁶ | |
| Gbp2 | Guanylate-binding protein-2 | 26.40 | 3.73 × 10⁻⁶ | |
| Gbp6 | Guanylate-binding protein-6 | 20.26 | 1.19 × 10⁻⁶ | |
| Regulation of IFN signaling | Usp18 | Ubiquitin-specific peptidase 18 | 43.58 | 3.94 × 10⁻⁶ |
| Nlrc5 | NLR family, CARD domain containing 5 | |||
| Ifna2 | Alpha interferon 2 | 1.92 | 0.0235 | |
| Acute-phase response | Saa3 | Serum amyloid A 3 | 3.88 | 0.0071 |
| IFN-induced antiviral activity | Rsad2 | Viperin (radical S-adenosyl methionine domain-containing 2) | 28.11 | 3.09 × 10⁻⁷ |
| Ifit1 | IFN-induced protein with tetratricopeptide repeats1 | 47.51 | 8.25 × 10⁻⁸ | |
| Ifit2 | IFN-induced protein with tetratricopeptide repeats2 | 9.08 | 4.07 × 10⁻⁶ | |
| Osal2 | 2′–5′ oligoadenylate synthase-like 2 | 52.36 | 1.09 × 10⁻⁵ | |
| IFN-induced, unknown function | Slfn4 | Schafen 4 | 2.67 | 0.00047 |
| Ifi44 | Interferon-induced protein 44 | 96.71 | 7.67 × 10⁻⁷ | |
| IFN-induced apoptosis | Lcn2 | Lipocalin2 [27] | 3.65 | 0.00026 |
| Function | Gene Designation | Name | Fold-Change | p Value |
|---|---|---|---|---|
| Chemoattractant for immune cells | Cxcl10 | C–X–C motif chemokine 10 | 1.52↑ | 0.0344 |
| IFN-inducible GTPase | Gbp6 | Guanylate-binding protein-6 | 1.91↓ | 0.0112 |
| IFN-induced apoptosis | Lcn2 | Lipocalin2 | 1.66↑ | 0.0347 |
© 2018 by the authors. Licensee MDPI, Basel, Switzerland. This article is an open access article distributed under the terms and conditions of the Creative Commons Attribution (CC BY) license (http://creativecommons.org/licenses/by/4.0/).
Share and Cite
Vig, P.J.S.; Lu, D.; Paul, A.M.; Kuwar, R.; Lopez, M.; Stokic, D.S.; Leis, A.A.; Garrett, M.R.; Bai, F. Differential Expression of Genes Related to Innate Immune Responses in Ex Vivo Spinal Cord and Cerebellar Slice Cultures Infected with West Nile Virus. Brain Sci. 2019, 9, 1. https://doi.org/10.3390/brainsci9010001
Vig PJS, Lu D, Paul AM, Kuwar R, Lopez M, Stokic DS, Leis AA, Garrett MR, Bai F. Differential Expression of Genes Related to Innate Immune Responses in Ex Vivo Spinal Cord and Cerebellar Slice Cultures Infected with West Nile Virus. Brain Sciences. 2019; 9(1):1. https://doi.org/10.3390/brainsci9010001
Chicago/Turabian StyleVig, Parminder J. S., Deyin Lu, Amber M. Paul, Ram Kuwar, Maria Lopez, Dobrivoje S. Stokic, A. Arturo Leis, Michael R. Garrett, and Fengwei Bai. 2019. "Differential Expression of Genes Related to Innate Immune Responses in Ex Vivo Spinal Cord and Cerebellar Slice Cultures Infected with West Nile Virus" Brain Sciences 9, no. 1: 1. https://doi.org/10.3390/brainsci9010001