Article

Comparative Analysis of Polyphenolic Compounds in Different Amaranthus Species: Influence of Genotypes and Harvesting Year

1
Department of Industrial Plant Science and Technology, Chungbuk National University, Cheongju 28644, Republic of Korea
2
Department of Crop Science and Biotechnology, Dankook University, Cheonan 31116, Republic of Korea
3
Residual Agrochemical Assessment Division, National Institue of Agricultural Science, Rural Development Administration, Wanju 55365, Republic of Korea
4
Department of Information Statistics, Chungbuk National University, Cheongju 28644, Republic of Korea
5
Department of Food Science and Biotechnology, Andong National University, Andong 36729, Republic of Korea
6
Department of Crop Science, Chungbuk National University, Cheongju 28644, Republic of Korea
7
Department of Botany and Microbiology, College of Science, King Saud University, P.O. Box 2455, Riyadh 11451, Saudi Arabia
8
Biomedical Institute of Mycological Resource, International St. Mary’s Hospital, College of Medicine, Catholic Kwandong University, Incheon 22711, Republic of Korea
9
Department of Convergence Science, College of Medicine, Catholic Kwandong University, Gangneung 25601, Republic of Korea
*
Authors to whom correspondence should be addressed.
These authors have contributed equally to this work.
Antioxidants 2024, 13(4), 501; https://doi.org/10.3390/antiox13040501
Submission received: 3 April 2024 / Revised: 18 April 2024 / Accepted: 19 April 2024 / Published: 22 April 2024

Abstract

:
Amaranth is a nutritionally valuable crop, as it contains phenolic acids and flavonoids, yielding diverse plant secondary metabolites (PSMs) like phytosterol, tocopherols, and carotenoids. This study explored the variations in the contents of seventeen polyphenolic compounds within the leaves of one hundred twenty Amaranthus accessions representing nine Amaranthus species. The investigation entailed the analysis of phenolic content across nine Amaranthus species, specifically A. hypochondriacus, A. cruentus, A. caudatus, A. tricolor, A. dubius, A. blitum, A. crispus, A. hybridus, and A. viridis, utilizing ultra performance liquid chromatography with photodiode array detection (UPLC-PDA). The results revealed significant differences in polyphenolic compounds among accessions in which rutin content was predominant in all Amaranthus species in both 2018 and 2019. Among the nine Amaranthus species, the rutin content ranged from 95.72 ± 199.17 μg g−1 (A. dubius) to 1485.09 ± 679.51 μg g−1 (A. viridis) in 2018 and from 821.59 ± 709.95 μg g−1 (A. tricolor) to 3166.52 ± 1317.38 μg g−1 (A. hypochondriacus) in 2019. Correlation analysis revealed, significant positive correlations between rutin and kaempferol-3-O-β-rutinoside (r = 0.93), benzoic acid and ferulic acid (r = 0.76), and benzoic acid and kaempferol-3-O-β-rutinoside (r = 0.76), whereas gallic acid showed consistently negative correlations with each of the 16 phenolic compounds. Wide variations were identified among accessions and between plants grown in the two years. The nine species and one hundred twenty Amaranthus accessions were clustered into six groups based on their seventeen phenolic compounds in each year. These findings contribute to expanding our understanding of the phytochemical traits of accessions within nine Amaranthus species, which serve as valuable resources for Amaranthus component breeding and functional material development.

1. Introduction

Polyphenols or phenolic compounds are present throughout the plant as secondary metabolites that play important roles in the plant’s defense mechanisms against stress, pathogens, and UV radiation [1]. In food, polyphenols contribute to taste, color, and stability and various studies suggest that diets high in plant polyphenols offer protection against numerous diseases [2]. More than 10,000 types of polyphenolic compounds have been identified so far, and they are classified into four types according to their structural characteristics: phenolic acids, flavonoids, stilbenes, and lignans. The determination of polyphenol content in diverse plant species with significant utility is facilitated by studies employing analytical instruments like spectrophotometers, liquid chromatography (LC), and gas chromatography (GC). These investigations, conducted across a spectrum of grain, vegetable, and fruit crops, aim to characterize the specific types and concentrations of polyphenols present in each plant, providing valuable insights into their compositional variations [3,4,5,6].
Amaranth has attracted worldwide attention due to its identification as a source of diverse secondary metabolites, encompassing phytosterols, tocopherols, carotenoids, phenolic acids, and flavonoids [7]. Amaranth, a C4 plant classified within the Amaranthus genus, encompasses around 70 species. Although its primary cultivation occurs in Central and South America, its notable adaptability enables successful growth in diverse environments, extending to temperate–tropical regions globally [8,9]. Three prominent grain Amaranthus species extensively cultivated are A. caudatus, A. cruentus, and A. hypochondriacus. In addition to these, 17 other species are specifically cultivated for their leaves [10]. During the flowering stage, the leaves of amaranth are abundant in vitamins, minerals, and dietary fiber [11]. They exhibit notable moisture and protein content, rendering them well-suited for various applications such as salads, green vegetables, animal feed, and other culinary uses [12,13]. Additionally, amaranth leaves have been found to possess pharmacological values, such as cholesterol reduction, anticancer, and anti-inflammatory properties [14], which can be demonstrated through the high polyphenol content in amaranth [3].
In Amaranthus species, both leaves and flowers are characterized by a high content of flavonoids, with rutin emerging as the predominant compound [15,16]. Analyzing the polyphenol content of Amaranthus plants across various growth stages reveals distinct patterns. Phenolic acids, specifically feruloylquinic acid and hydroxycinnamic acid, are notably high during the vegetative growth phase. In contrast, flavonoids such as rutin and quercetin become abundant during the flowering stage [17]. Furthermore, it has been observed that the polyphenol content in amaranth leaves is subject to variations influenced by both biotic and abiotic stresses, even when derived from the same resource throughout the growth period [18,19,20]. Hence, recognizing the significant differences in polyphenol content among accessions, evaluating different species of Amaranthus is crucial to identify potential variations among them.
The characteristics and concentrations of polyphenols in amaranth leaves can vary depending on the growth environment, necessitating a comparative analysis of findings from different studies. Previous research has focused on quantifying polyphenol content in specific amaranth species and resources [17]. However, discrepancies in sampling procedures, analysis equipment, and methodologies across studies pose challenges in evaluating and comparing new resources based on prior results [21]. This study aims to identify polyphenolic compounds in accessions from nine Amaranthus species. Additionally, we analyze data variations from plants grown in two different years and assess correlations between polyphenolic compounds. The outcomes of this research will contribute valuable insights to breeding initiatives targeting the development of amaranth accessions with enhanced nutritive value.

2. Materials and Methods

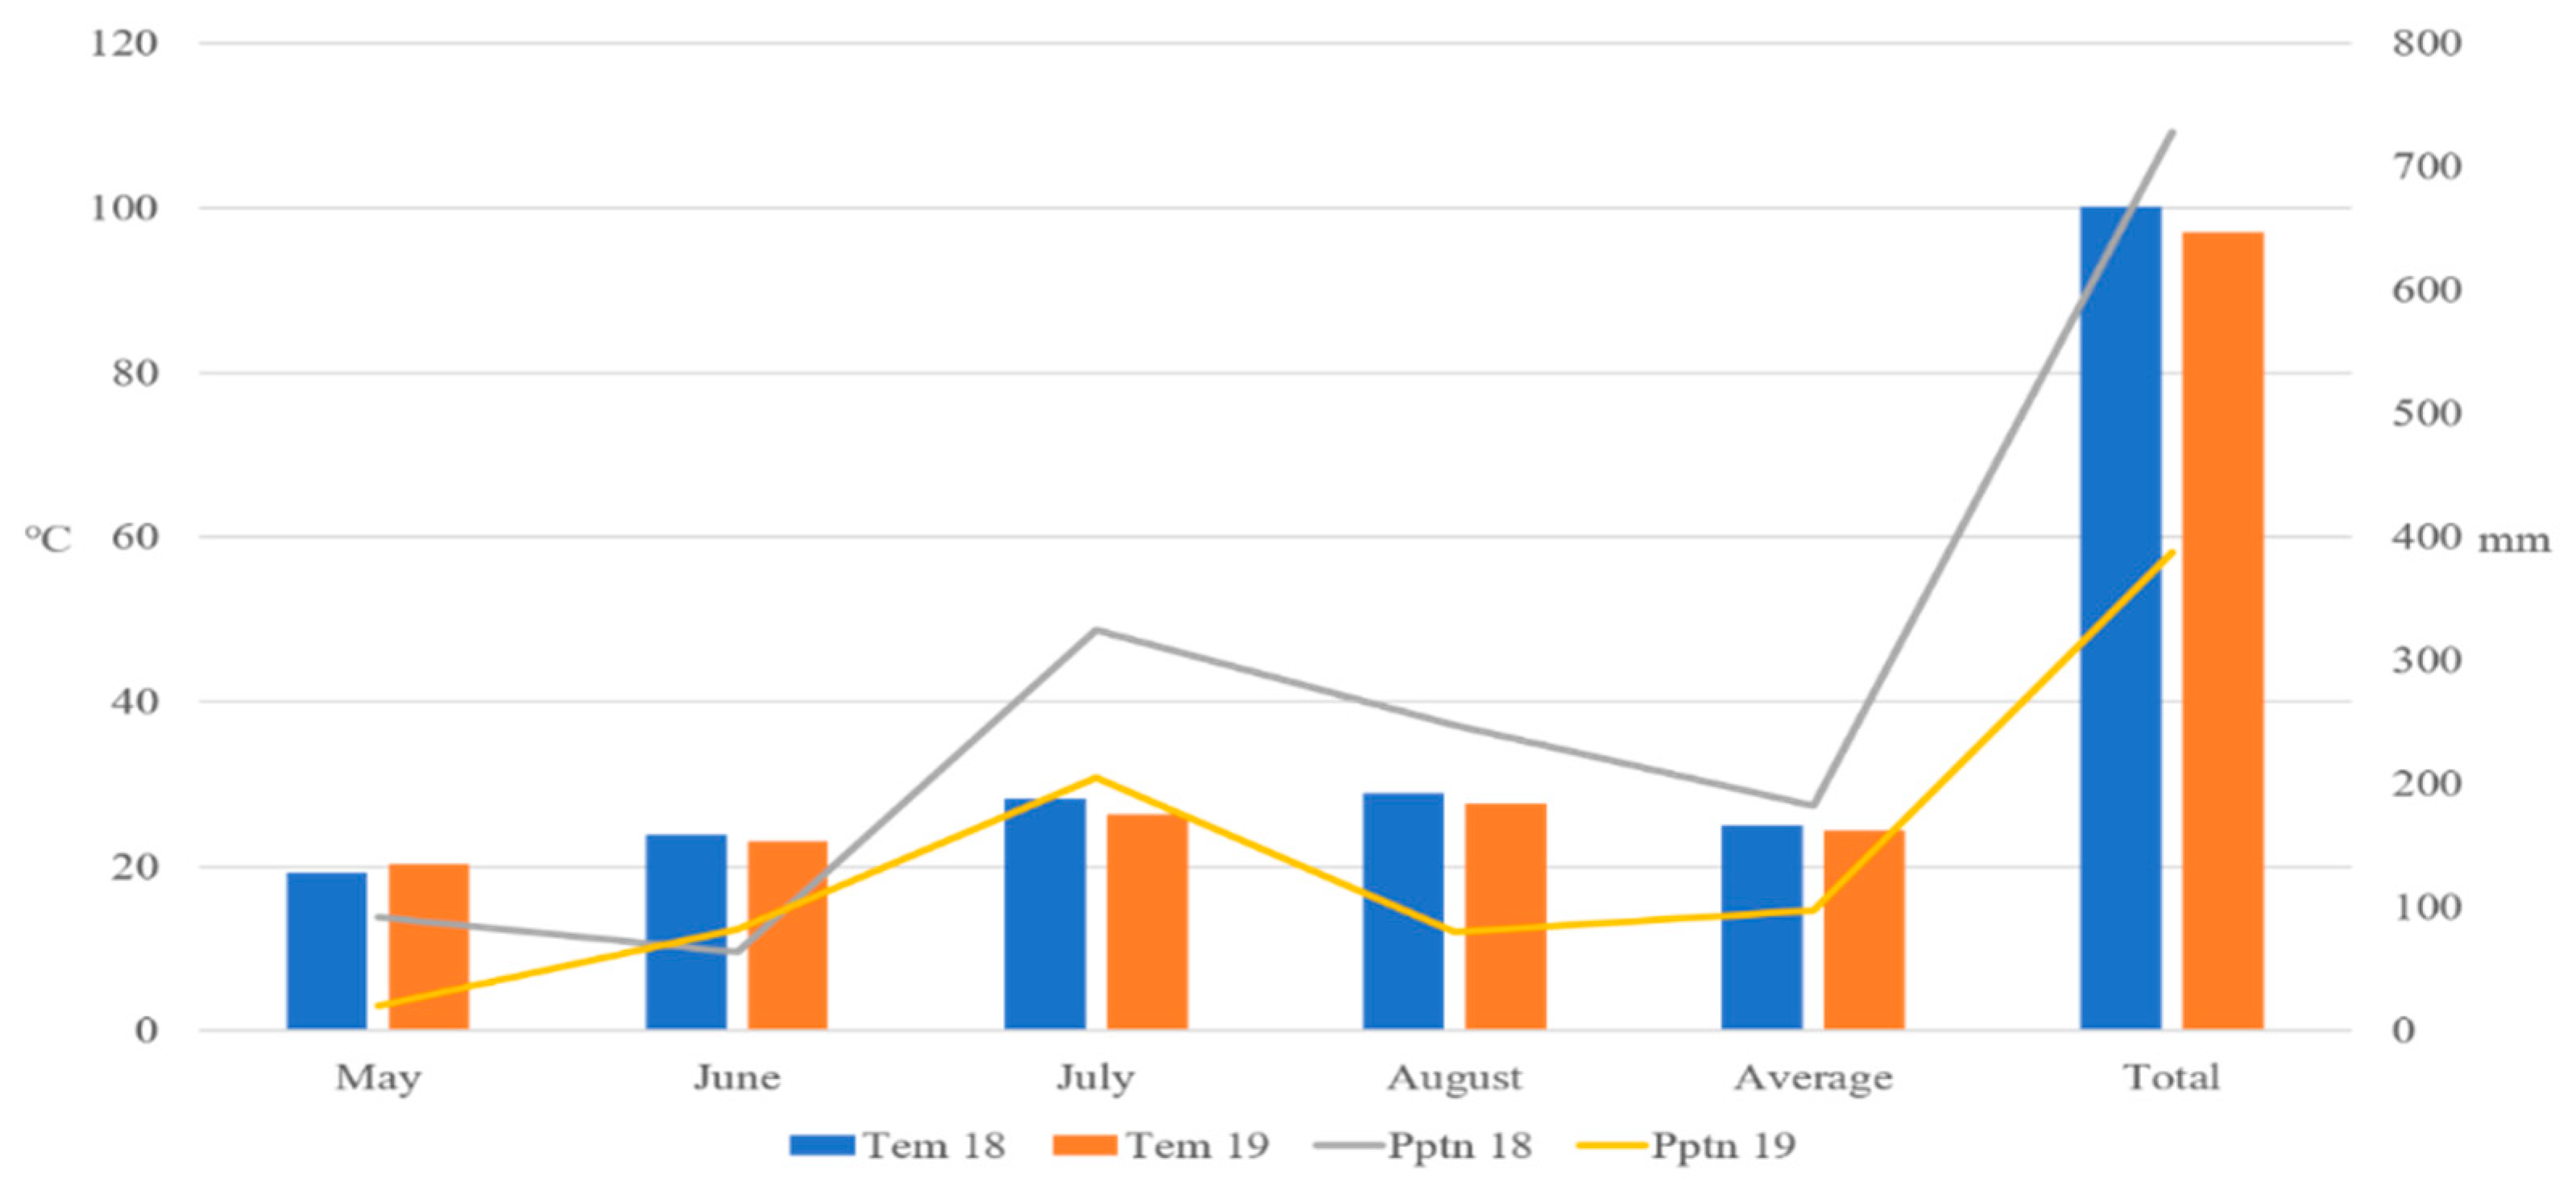
2.1. Plant Materials and Growth Conditions

A total of 120 accessions from 9 Amaranthus species were obtained from the National Agrobiodiversity Center (NAS; http://genebank.rda.go.kr; accessed on 10 January 2022) of the Rural Development Administration (RDA) in the Republic of Korea (Supplementary Table S1). The n9 Amaranthus species included 3 A. blitum, 18 A. caudatus, 11 A. crispus, 7 A. cruentus, 6 A. dubius, 7 A. hybridus, 31 A. hypochondriacus, 30 A. tricolor, and 7 A. viridis accessions. Two weeks after germination, these accessions were transplanted and cultivated in silt loam soil at the experimental field of Chungbuk National University in Korea (36°37′27.7″ N 127°27′15.3″ E) in 2018 and 2019. To enhance the integrity of each accession, six individual plants were established through the transplantation of individual Amaranthus seedlings at 20 cm intervals within the furrows of designated rows, with weekly irrigation applied. Fertilizer was not applied during the experiment to determine the actual genotypic differences throughout the harvesting year. Temperature and precipitation data recorded in Cheongju during the amaranth flowering period (May to August) in 2018 and 2019 were obtained from the Korea Meteorological Administration (Figure 1).

2.2. Sampling and Content Extraction

The sampling was conducted three months after planting, wherein the leaves of six plants per accession were freeze-dried using a FreeZone Freeze Dry System (Labconco, Kansas City, MO, USA), ground into powder, and homogenized; only this conjugated sample was gathered for UPLC-PDA analysis. To extract polyphenols, 100 mg of powdered leaf tissue was combined with 1 mL of 75% methanol and subjected to one hour of sonication. Afterward, the mixture underwent centrifugation at 12,000 rpm for 10 min. The resulting clear supernatant was filtered through a 0.2 μm filter into a clean tube, serving as the sample for determining the polyphenol content.

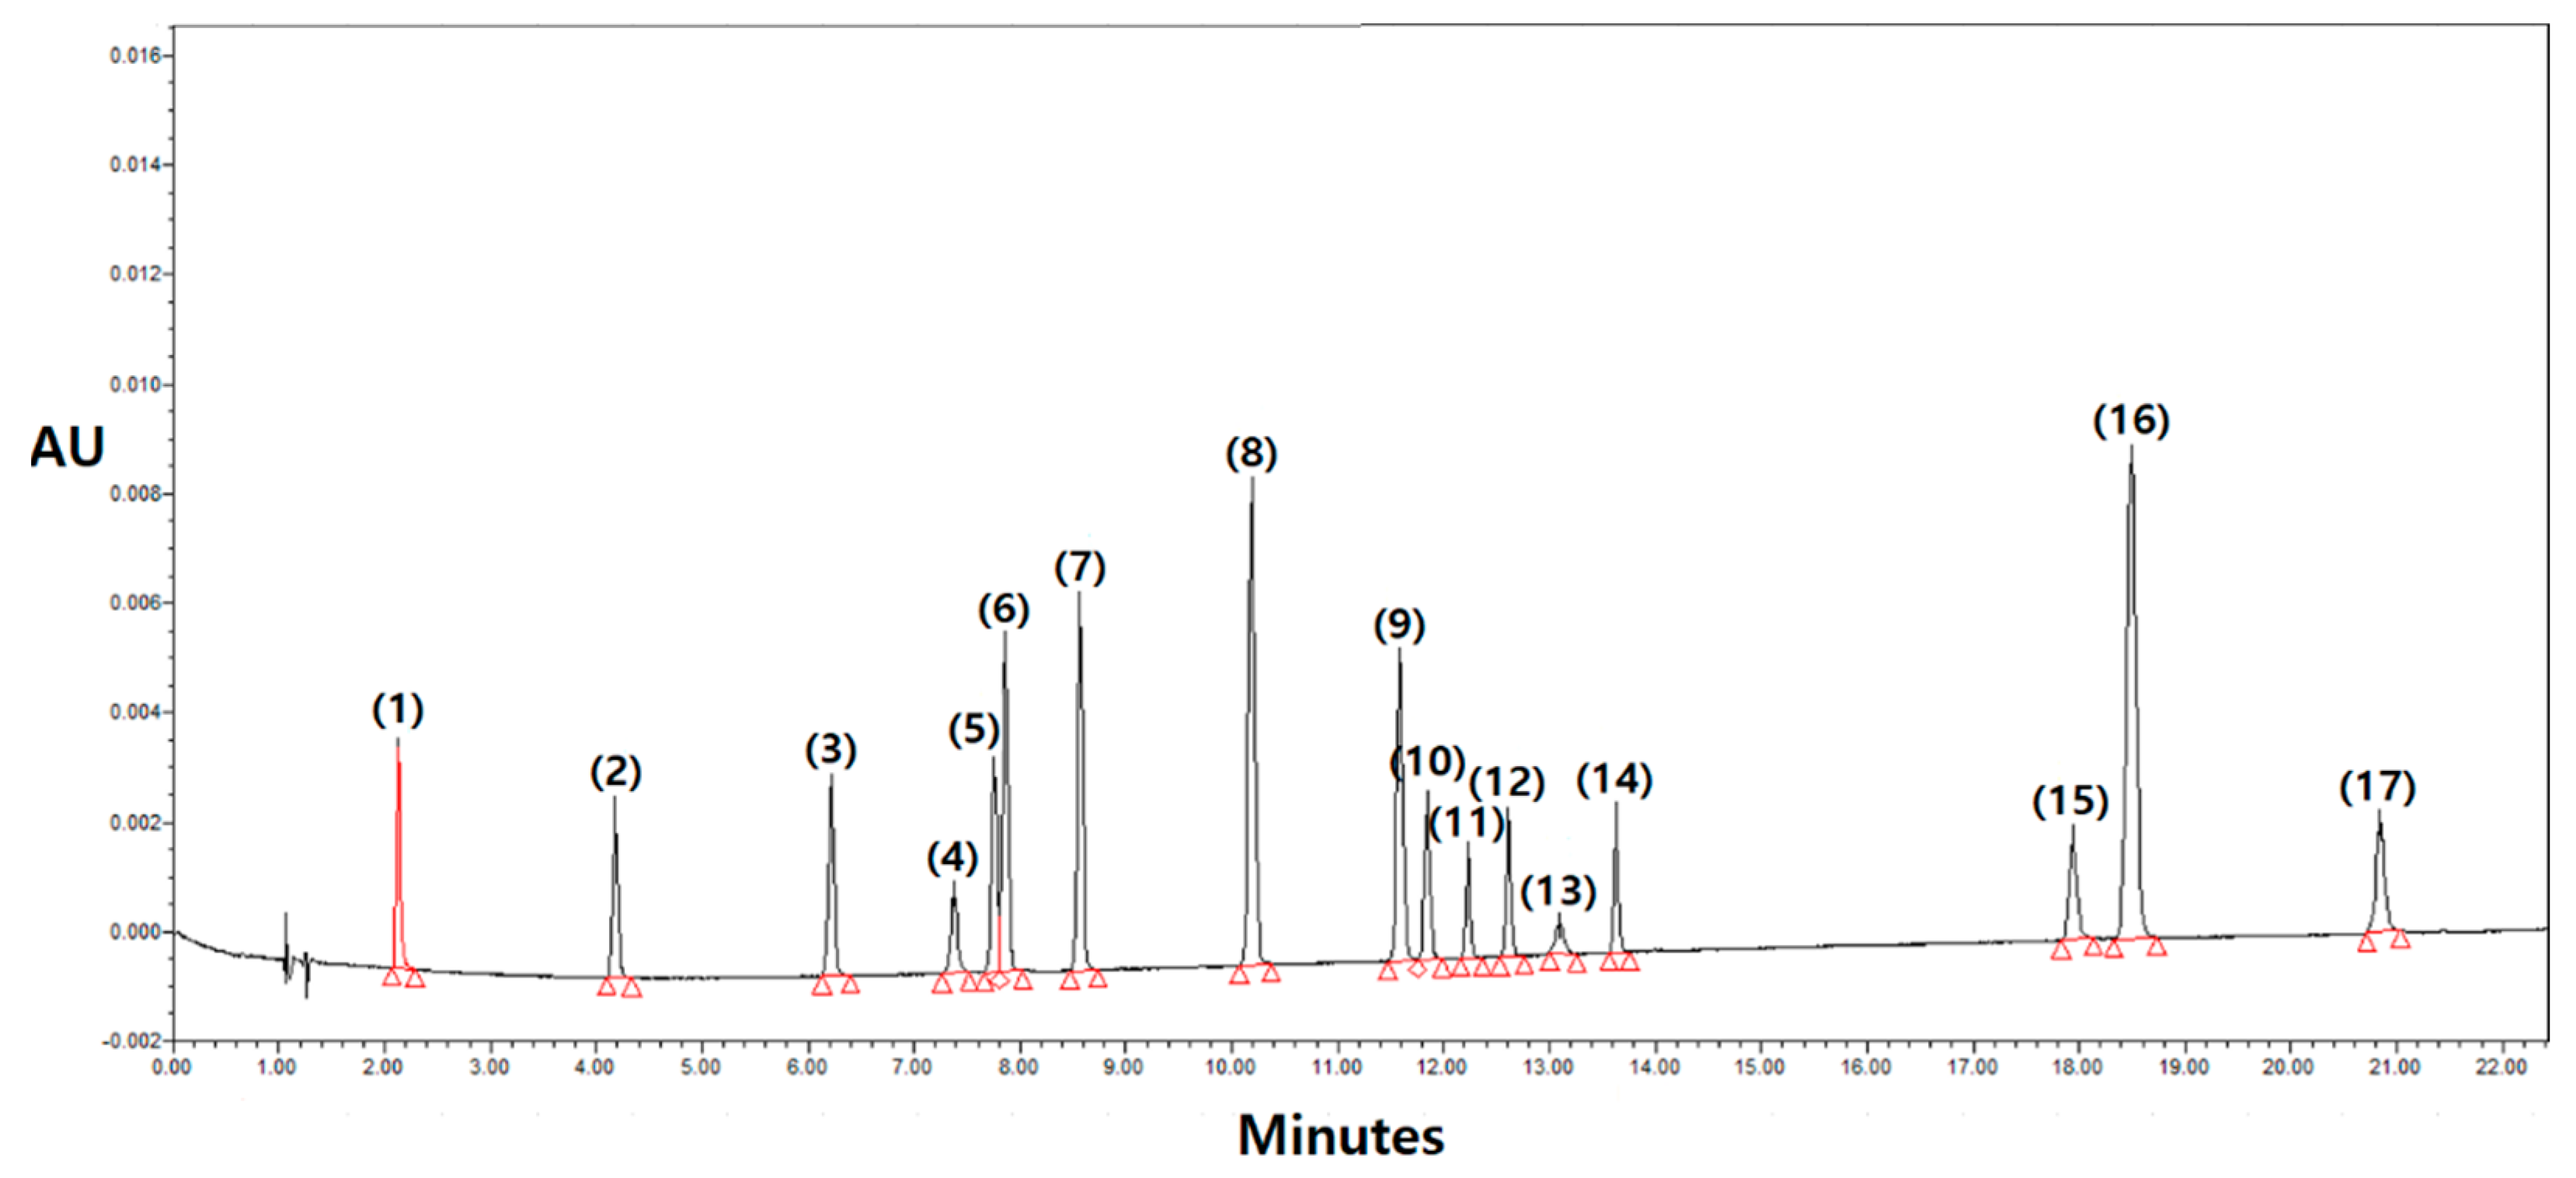
2.3. Sample Analysis by UHPLC-PDA

An ultra performance liquid chromatography (UPLC) system (Waters, Milford, MA, USA) equipped with a binary solvent delivery pump, auto-sampler, and a photodiode array (PDA) detector was used to identify individual polyphenols, as described previously [22]. The UPLC settings used in this study are summarized in Table 1. The mobile phase consisted of a binary solvent system comprising water (Solvent A) and acetonitrile (Solvent B) supplemented with 0.1% formic acid. A total of 17 phenolic compounds such as, gallic acid, 3,4-dihydroxybenzoic acid, 4-hydroxybenzoic acid, 2,4-dihydroxybenzoic acid, vanillic acid, caffeic acid, syringic acid, p-coumaric acid, ferulic acid, sinapic acid, rutin, quercetin 3-β-D-glucoside, benzoic acid, kaempferol 3-O-β-rutinoside, quercetin, cinnamic acid, and kaempferol were purchased from Sigma-Aldrich (St. Louis, MO, USA) and used as standards. For each standard compound, a methanol solution was prepared, resulting in a final concentration of 1000 ng/mL. A mixture of all standard compounds was then utilized to establish the calibration curve. The polyphenol content of each sample was calculated using the method described previously [22] with minor modification.

2.4. Statistical Analysis

To enable comparisons across various phenolic compounds, an analysis of variance (ANOVA) for significance p < 0.05 and Duncan’s multiple range test were carried out. Additionally, for correlation analysis among these compounds, PAST3 software v4.03 [23] was used for principal component analyses (PCA) and hierarchical clustering was performed using R statistical software (Version 4.2.1). The data presented in the figures and tables are represented as mean ± standard deviation. The Relative Polyphenol Content Index (RPCI) was used to compare the levels of 17 polyphenols in the samples using the following formula:
Standard score = (Absorbance − mean)/standard deviation
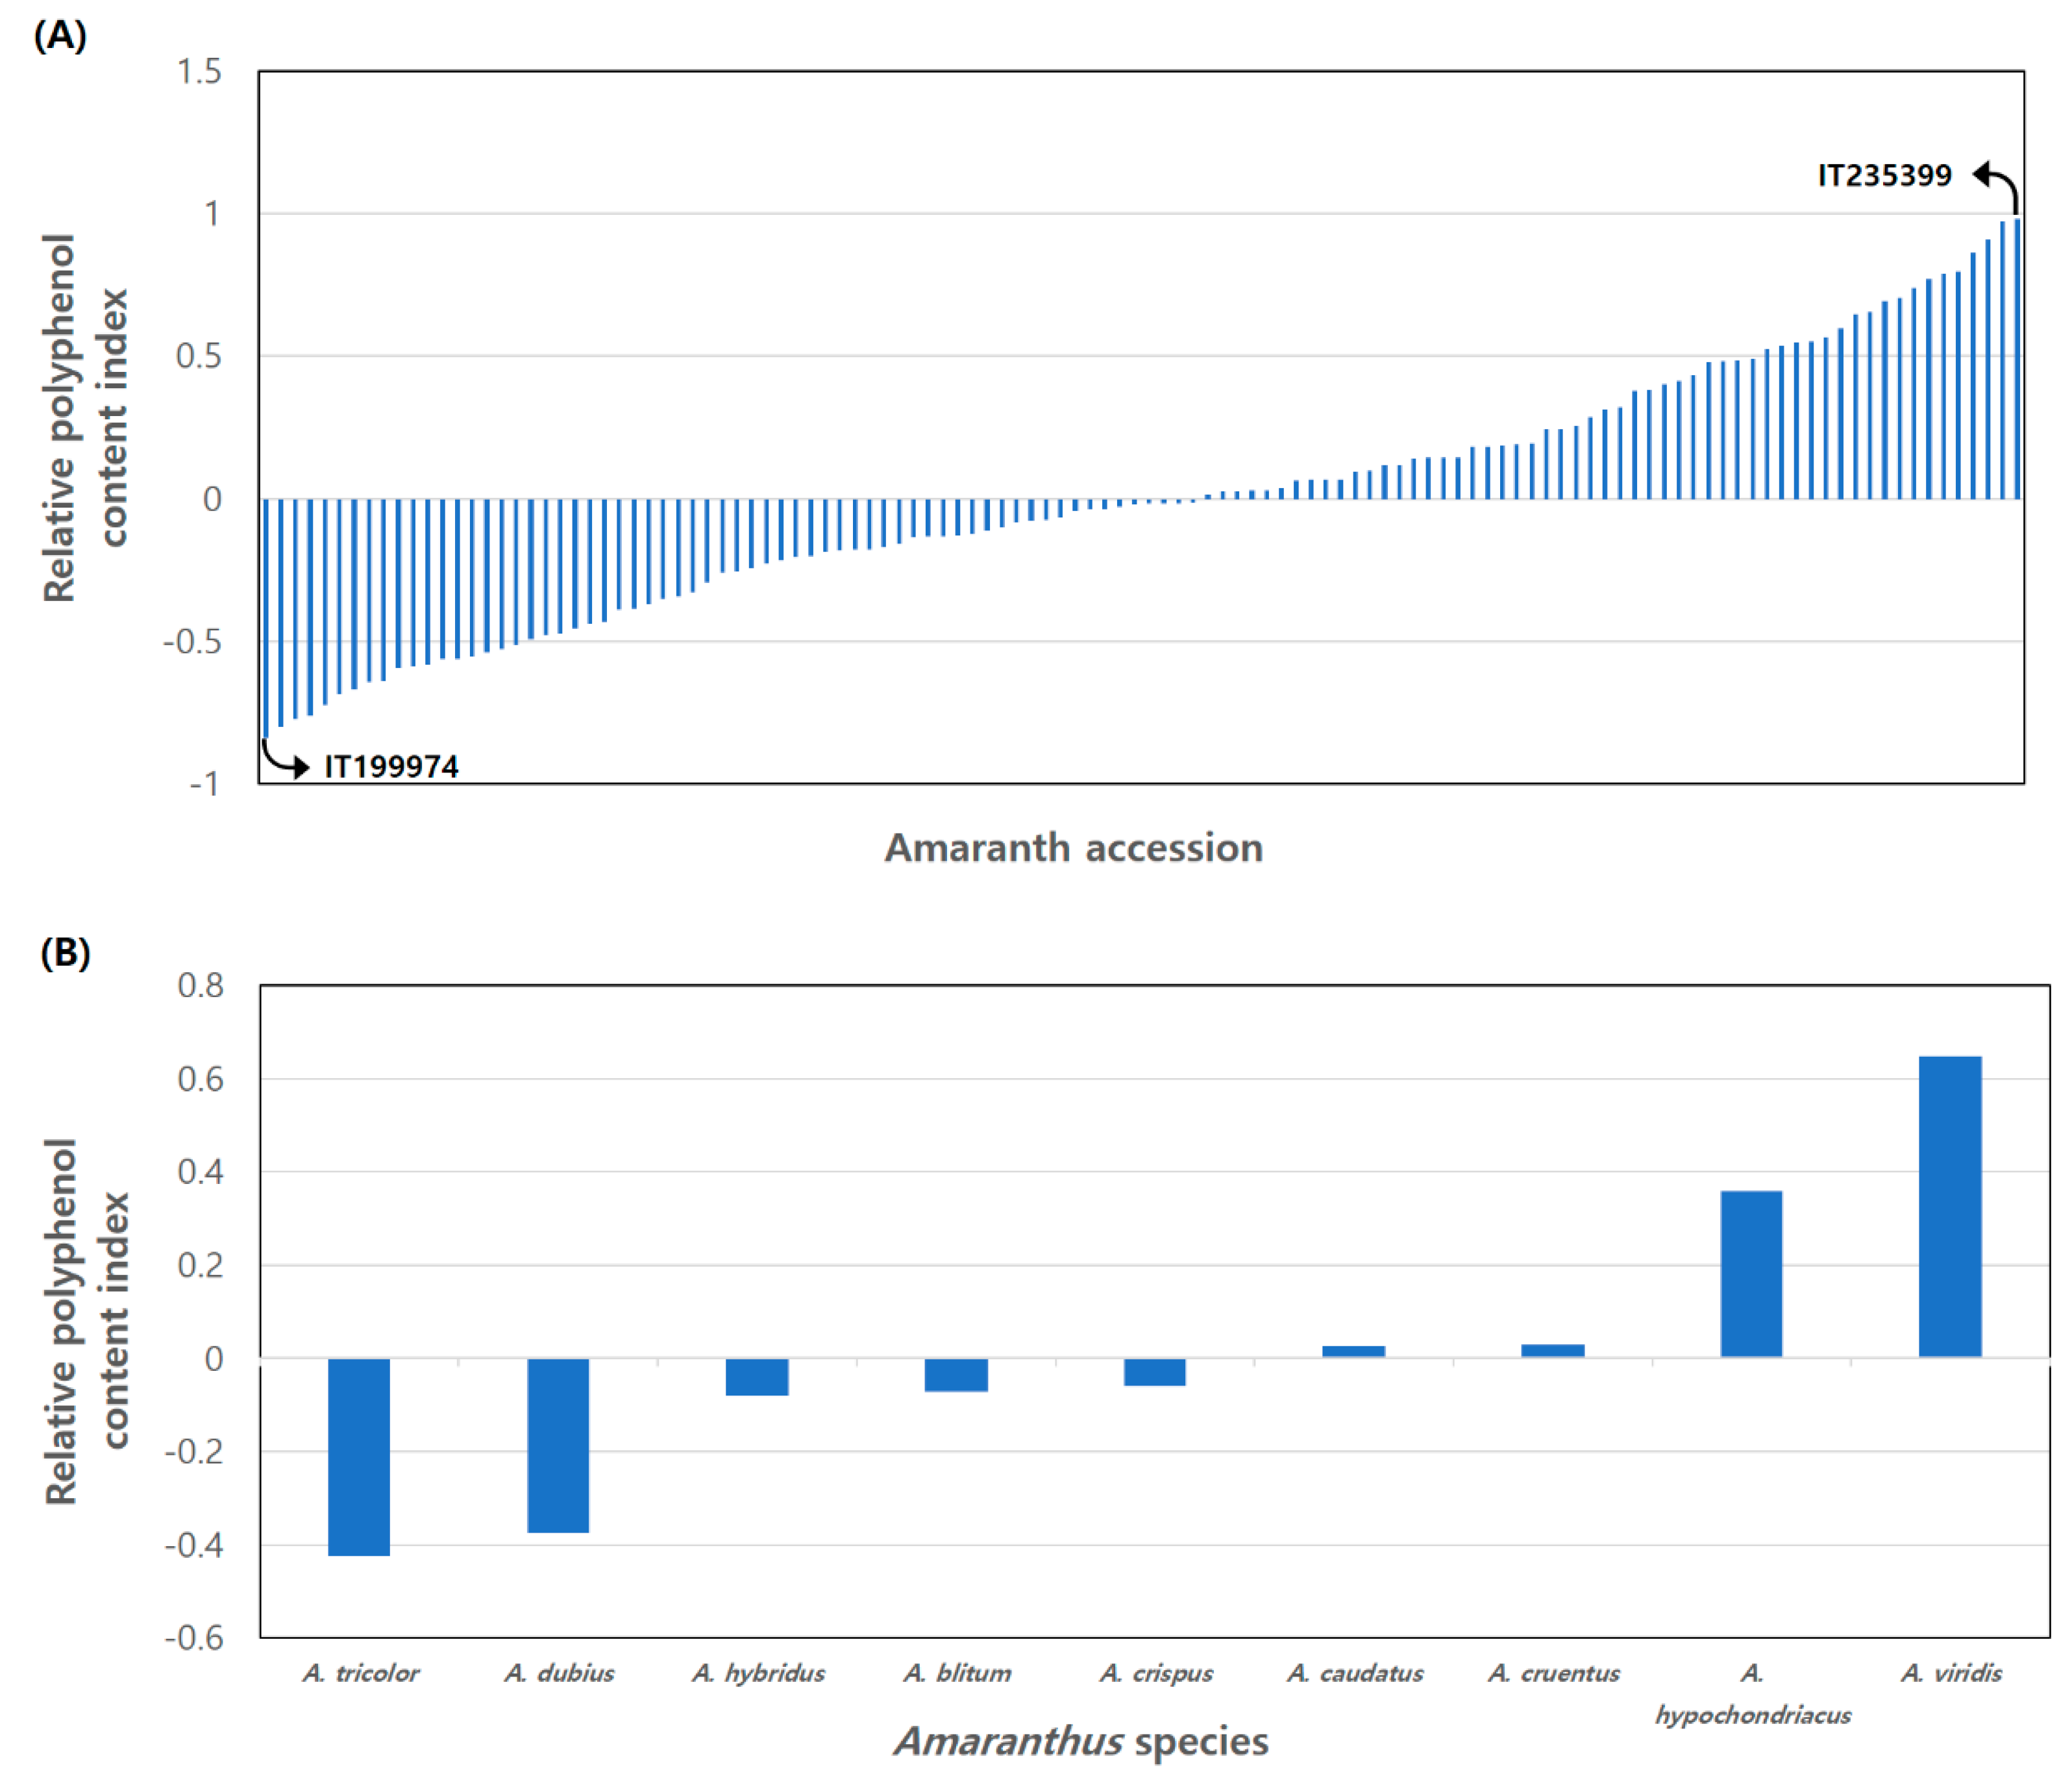
RPCI = Average of standard score.
Furthermore, a comprehensive assessment was conducted to ascertain the statistical significance of the influence exerted by the genotype, year, and their interaction (genotype × year) on the levels of 17 polyphenolic compounds.

3. Results

3.1. Polyphenolics Assessment Using the UPLC-PDA

The compounds investigated in the methanolic extracts were quantified by integrating the peak areas at 260 nm using an external calibration method. Calibration curves were constructed individually for each standard compound to establish a relationship between concentration and peak area (Figure 2). The results obtained from the UPLC-PDA analysis, as presented in Supplementary Table S2, reveal discrepancies in polyphenol profiles across the nine cultivated Amaranthus species during the years 2018 and 2019, as summarized in Table 2. A comprehensive set of seventeen polyphenolic compounds was identified, encompassing seven hydroxybenzoic acids (HBA1–HBA7), five hydroxycinnamic acids (HCA1–HCA5), and five flavonoids (FLA1–FLA5). In addition, UPLC-PDA was used for the qualification and quantification of phenolic compounds in accordance with the previous method [22]. Specifically, hydroxybenzoic acids include gallic acid (HBA1), 3,4-dihydroxybenzoic acid (HBA2), 4-hydroxybenzoic acid (HBA3), 2,4-dihydroxybenzic acid (HBA4), vanillic acid (HBA5), syringic acid (HBA6), and benzoic acid (HBA7). The hydroxycinnamic acids consist of caffeic acid (HCA1), p-coumaric acid (HCA2), ferulic acid (HCA3), sinapic acid (HCA4), and cinnamic acid (HCA5). Lastly, the flavonoids identified are rutin (FLA1), quercetin-3-β-D-glucoside (FLA2), kaempferol-3-O-β-rutinoside (FLA3), quercetin (FLA4), and kaempferol (FLA5). These compounds were documented from the leaves of the nine Amaranthus species under investigation.

3.1.1. Hydroxybenzoic Acid

In the analysis conducted across one hundred twenty Amaranthus accessions spanning the years 2018 and 2019, examination of seven hydroxybenzoic acids revealed notable variations. Gallic acid (HBA1) content was observed to be at its lowest in 2018, ranging from 1.8 to 4.5 μg g−1 with an average of 2.0 μg g−1, while 3,4-dihydroxybenzoic acid (HBA2) content was observed to be at its lowest in 2019, ranged from 2.9 to 14.8 μg g−1 with an average of 6.5 μg g−1. Conversely, benzoic acid (HBA7) exhibited the highest content across both years, with concentrations of 142.5 μg g−1 in 2018 and 173.5 μg g−1 in 2019, yielding an average of 93.6 μg g−1 across the assessed Amaranthus species (Table 2). Notably, the content of 3,4-dihydroxybenzoic acid (HBA2) remained undetectable in A. blitum accessions throughout the cultivation periods under scrutiny.

3.1.2. Hydroxycinnamic Acid

In the comprehensive analysis conducted across one hundred twenty Amaranthus accessions spanning the years 2018 and 2019, scrutiny of five hydroxycinnamic acids showcased significant variability. Cinnamic acid (HCA5) content displayed its nadir ranging from 2.0 to 3.4 μg g−1 in 2018, averaging 1.6 μg g−1, and fluctuating between 1.8 to 6.3 μg g−1 in 2019, averaging 3.1 μg g−1. Conversely, sinapic acid (HCA4) consistently exhibited the highest content across both years, registering concentrations of 55.4 μg g−1 in 2018 and 47.8 μg g−1 in 2019, resulting in an average of 24.3 μg g−1 across the evaluated Amaranthus species (Table 2).

3.1.3. Flavonoid

The UPLC-PDA chromatogram revealed the presence of five flavonoid compounds, which showed significant variability during the assessment period. Kaempferol (FLA5) content ranged from 2.2 to 9.3 μg g−1 in 2018 with an average of 3.5 μg g−1 and from 12.9 to 16.6 μg g−1 in 2019 with an average of 14.7 μg g−1. Remarkably, rutin (FLA1) consistently exhibited the highest content across both years and ranged from 95.7 to 1485.1 μg g−1 in 2018 with an average of 910.4 μg g−1 and from 821.6 to 3166.5 μg g−1 in 2019 with an average of 1869.9 μg g−1.

3.2. Relative Polyphenol Content Index

In 2018, Amaranthus accession A118 (RPCI: 2.236) exhibited the highest RPCI, followed by A120 (RPCI: 2.135), A119 (RPCI: 1.998), and A14 (RPCI: 1.667), while A56 (RPCI: −0.843) displayed the lowest RPCI. In 2019, A7 (RPCI: 1.842) demonstrated the highest RPCI, trailed by A1 (RPCI: 1.557), A12 (RPCI: 1.479), and A6 (RPCI: 1.395), whereas A81 (RPCI: −0.976) exhibited the lowest RPCI (Supplementary Table S3). The cumulative RPCI over both years was greatest for accession A119 (RPCI: 1.006), followed by A118 (RPCI: 0.975), A1 (RPCI: 0.913), and A19 (RPCI: 0.911), while A60 (RPCI: −0.833) recorded the lowest (Figure 3A). Among the nine species, A. viridis (RPCI: 0.621) showcased the highest RPCI, followed by A. hypochondriacus (RPCI: 0.456), A. cruentus (RPCI: 0.024), and A. caudatus (RPCI: 0.021), whereas A. tricolor (RPCI: −0.448) exhibited the lowest RPCI (Figure 3B).

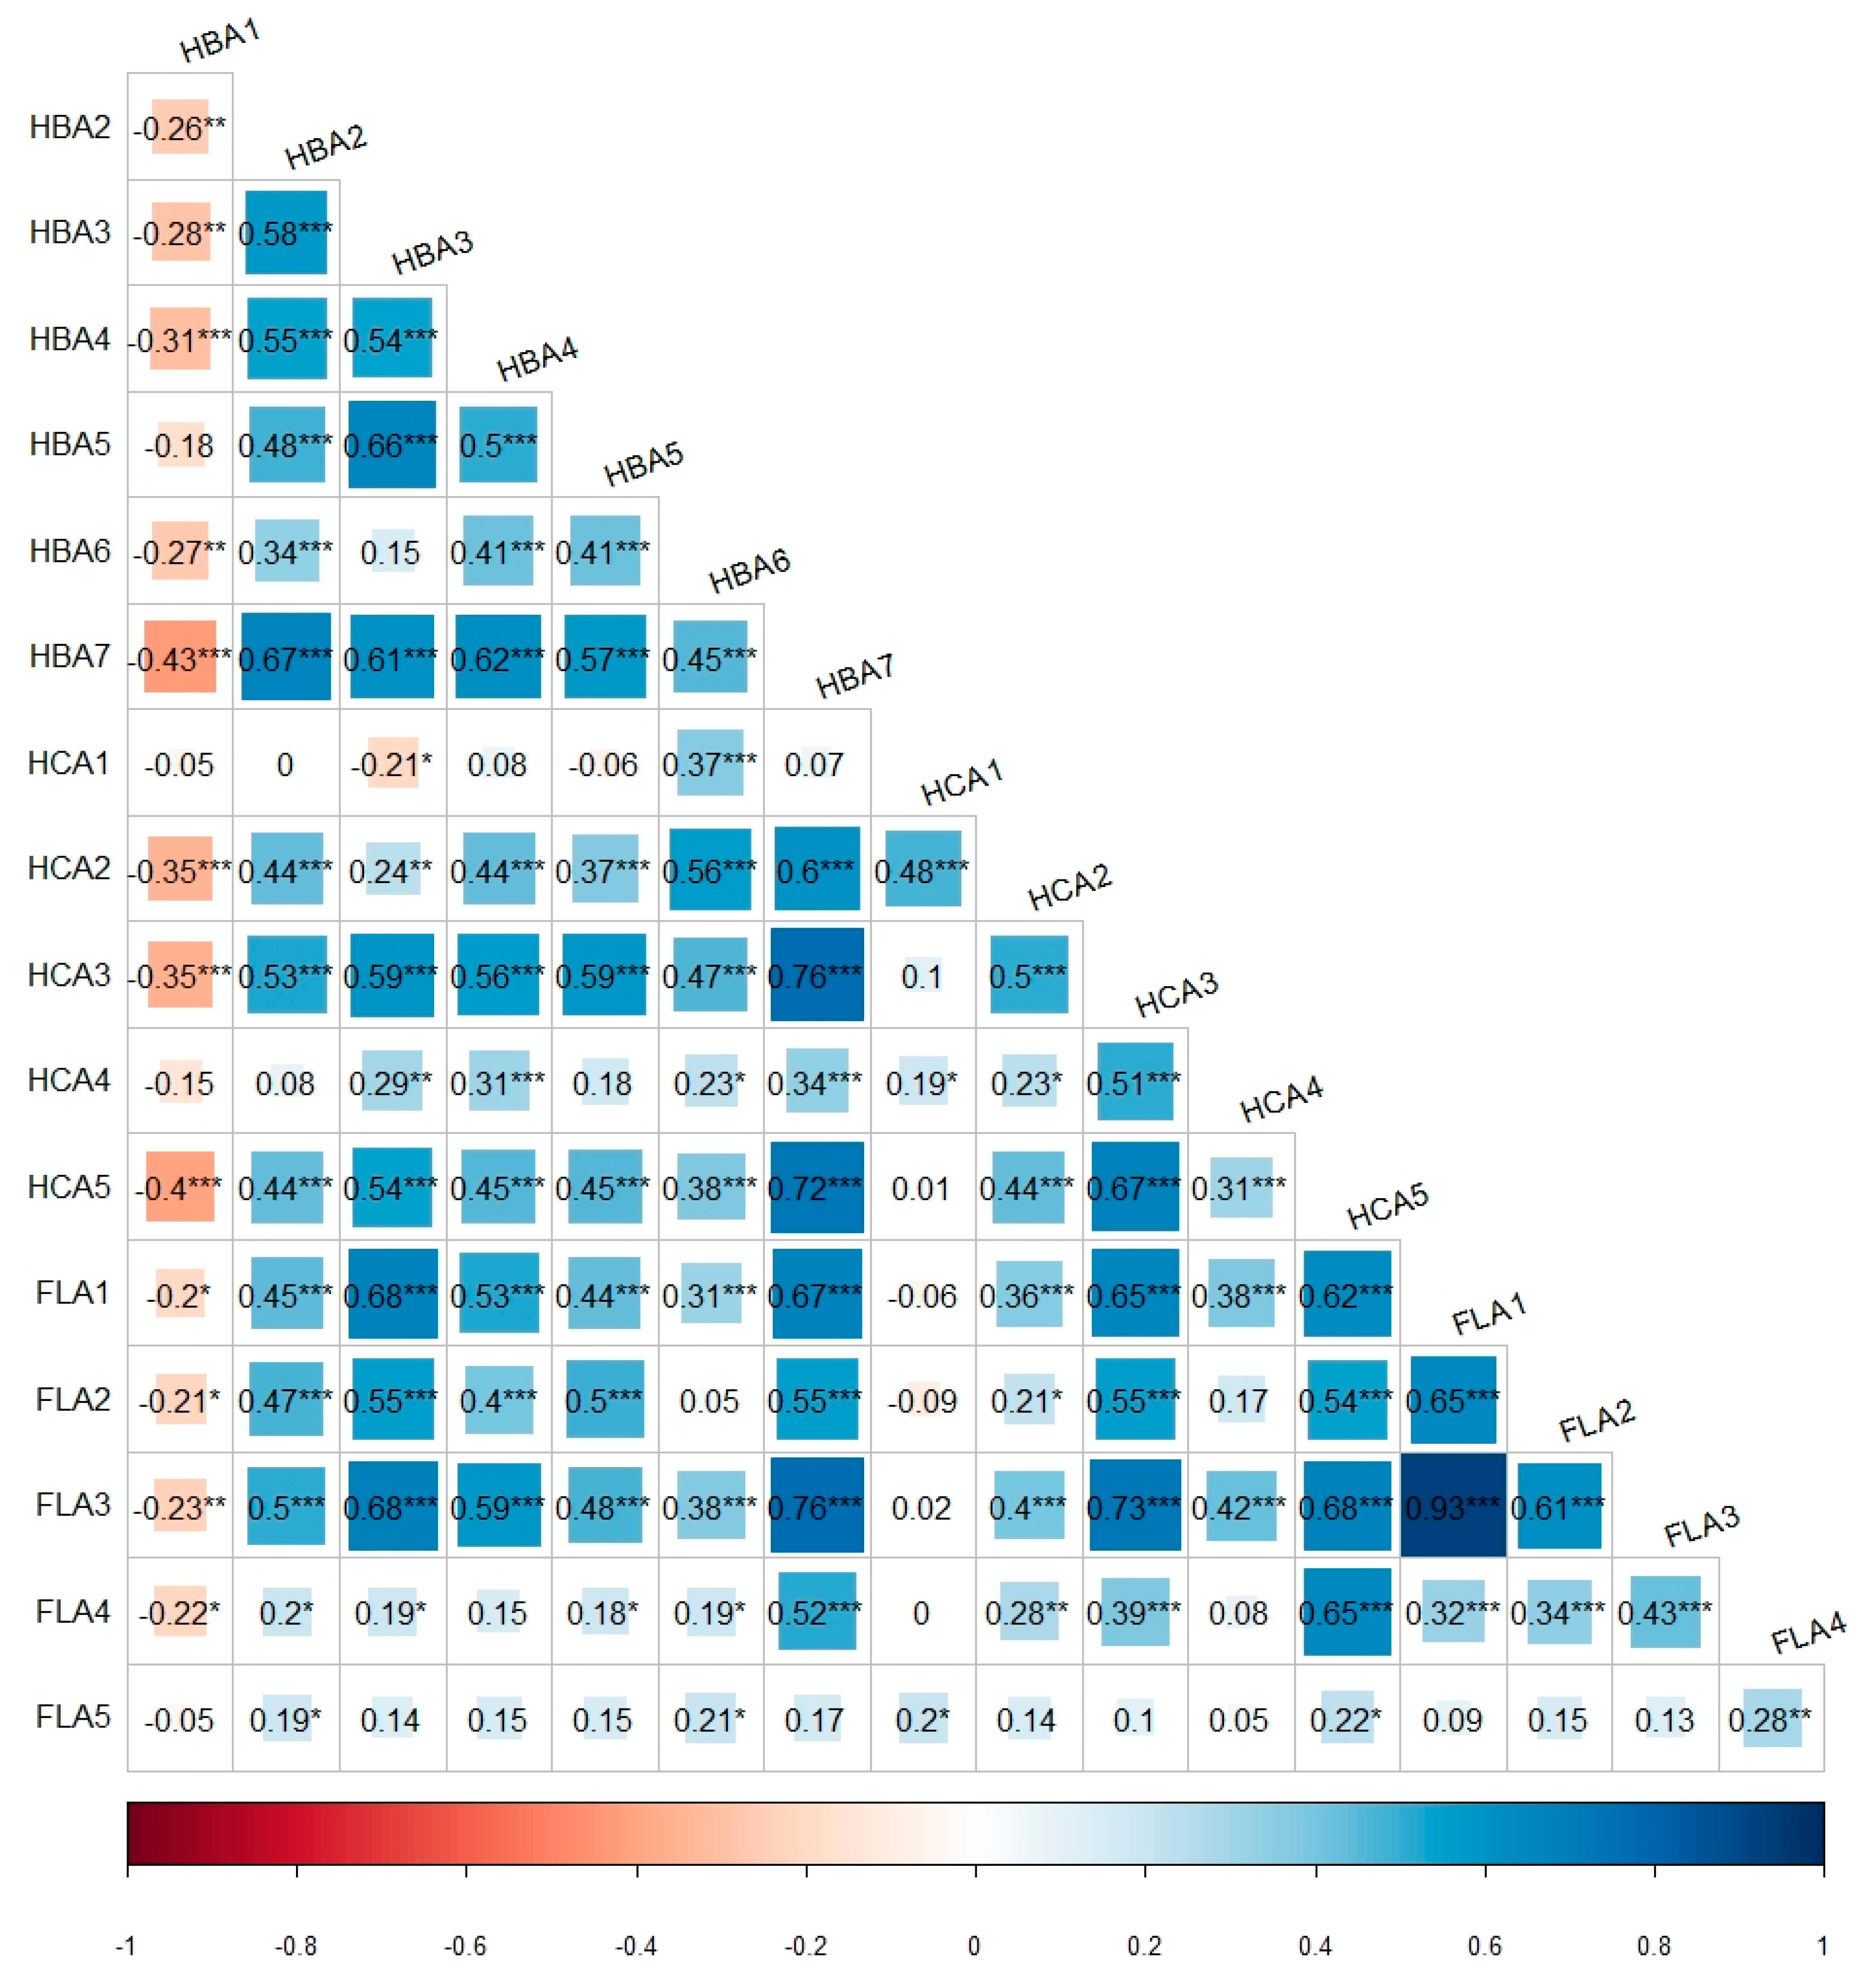
3.3. Correlation Analysis

The correlation analysis (Figure 4) of polyphenol content data over two years unveiled significant positive correlations (p < 0.001) between rutin and kaempferol-3-O-β-rutinoside (r = 0.93), benzoic acid and ferulic acid (r = 0.76), as well as benzoic acid and kaempferol-3-O-β-rutinoside (r = 0.76). However, gallic acid displayed notably negative correlations (p < 0.001) with benzoic acid (r = −0.43), cinnamic acid (r = −0.40), p-coumaric acid (r = −0.35), and ferulic acid (r = −0.35).

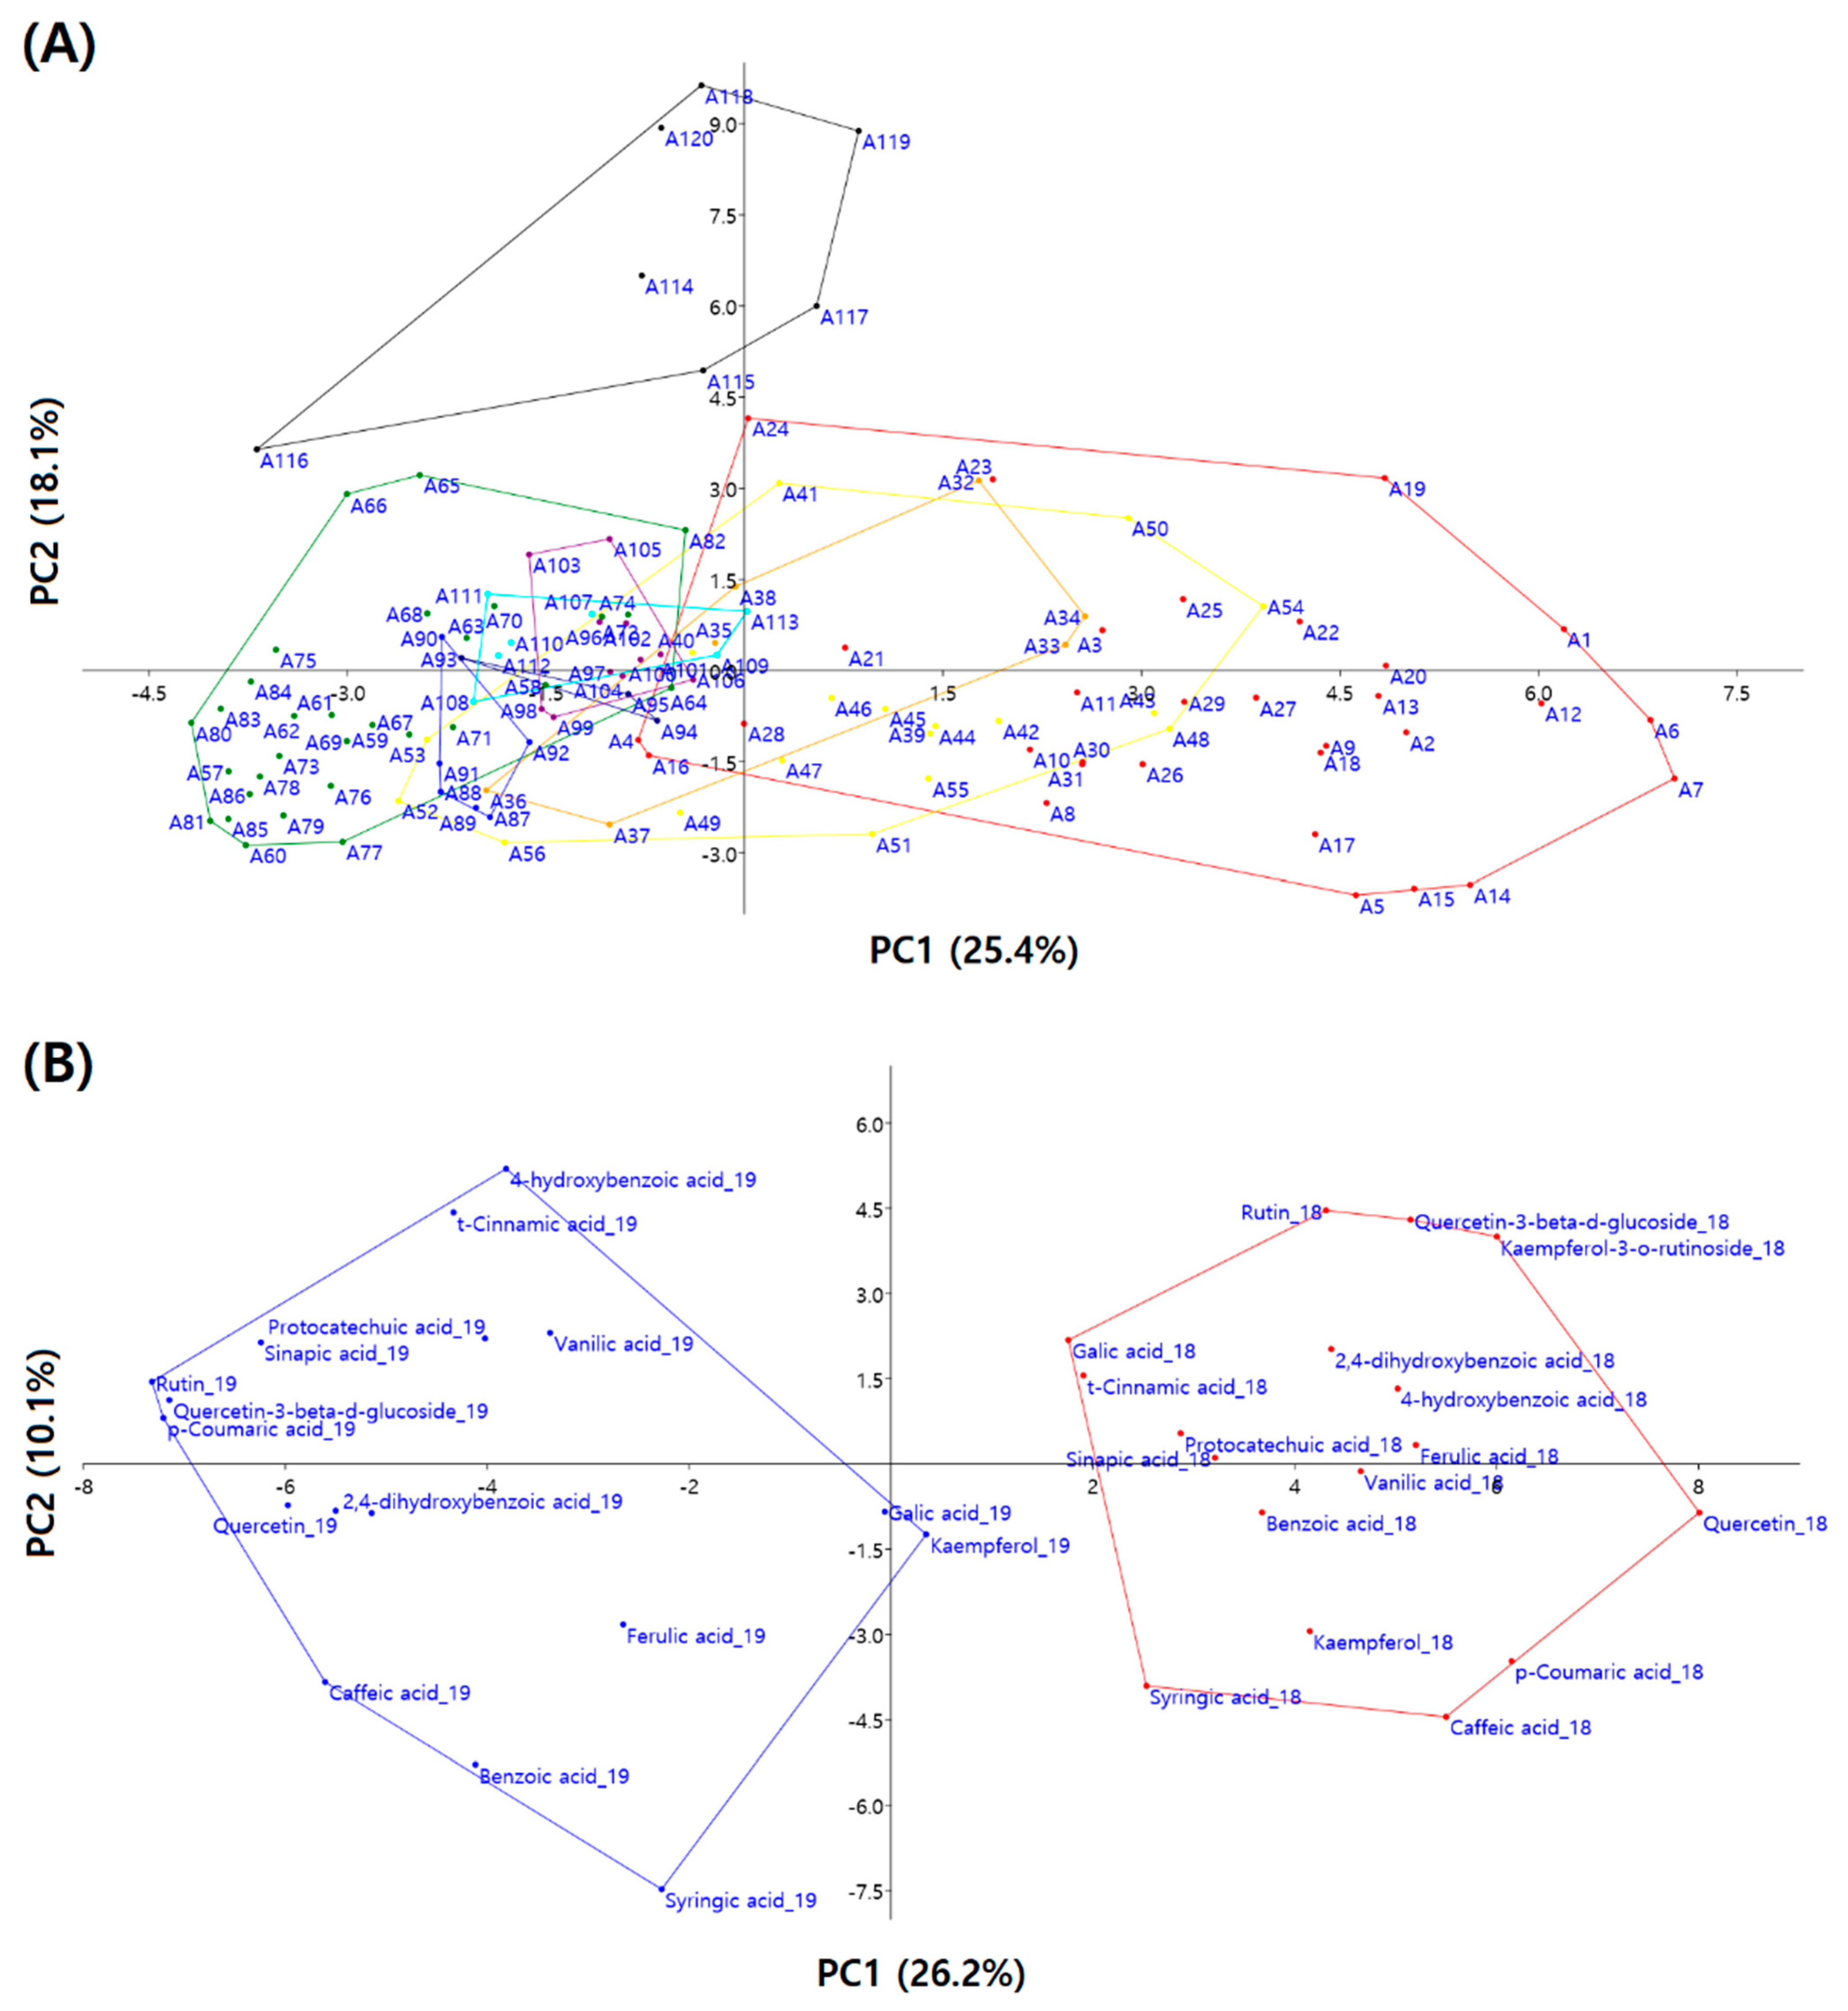
3.4. Principal Component Analysis

PCA was conducted to compare the contents of seventeen polyphenols among one hundred twenty Amaranthus accessions. The analysis revealed eight principal components (PCs), each with eigenvalues > 1.0, collectively explaining 71.69% of the total variance in polyphenol content (Table 3). PC1 (eigenvalue = 7.98) accounted for 25.44% of the total variance. Benzoic acid_19 (0.326) exhibited the highest positive variance, while quercetin_18 (−0.149) displayed the highest negative variance. PC2 (Eigenvalue = 5.67) explained an additional 18.13% of the total variance. Kaempferol-3-O-β-rutinoside_18 (0.323) demonstrated the highest positive variance, whereas cinnamic acid_19 (−0.107) exhibited the highest negative variance. PC3 (Eigenvalue = 2.42) explained an additional 7.71% of the total variance. Caffeic acid_19 (0.421) showed the highest positive variance, while 4-hydroxybenzoic acid_19 (−0.261) displayed the highest negative variance. Moreover, the PCA results unveiled annual variation and diverse patterns that were not segregated by species (Figure 5).

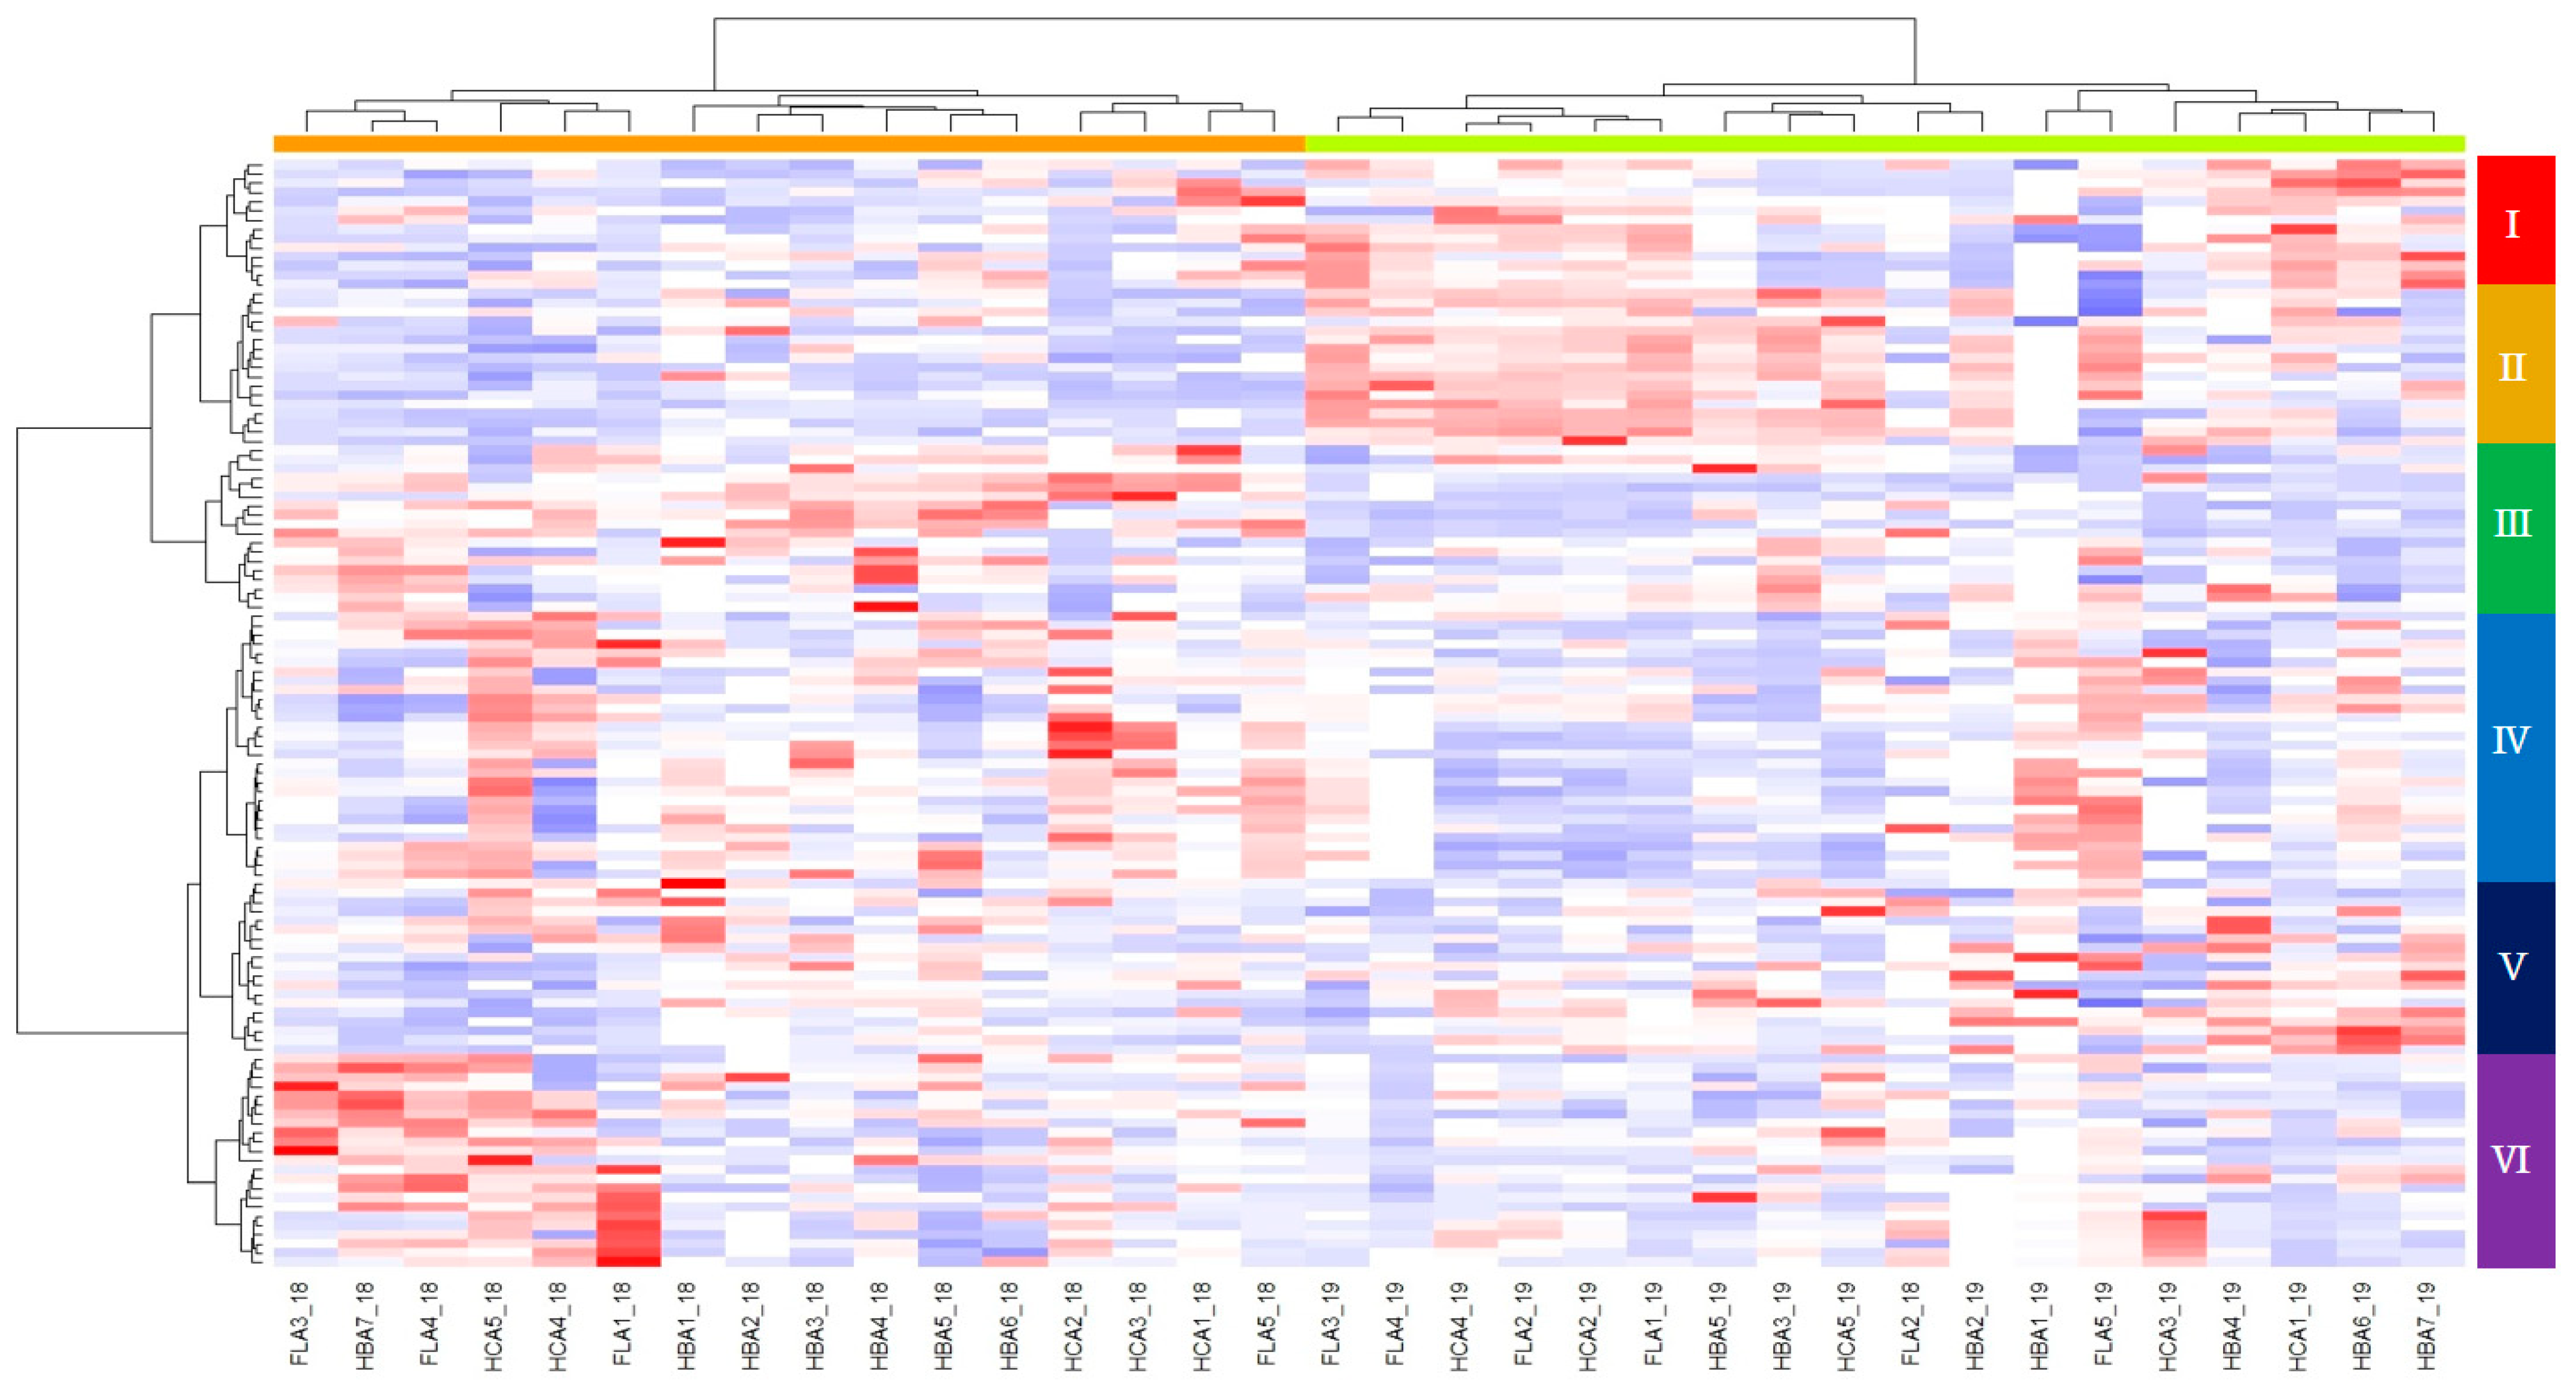
3.5. Heatmap Hierarchical Clustering

The one hundred twenty Amaranthus accessions were categorized into six groups based on their contents of seventeen polyphenols (Table 4 and Figure 6). Group I comprised 14 accessions characterized by high contents of syringic acid (15.7 ± 11.6 μg g−1), caffeic acid (16.4 ± 15.0 μg g−1), and p-coumaric acid (16.8 ± 12.1 μg g−1). Group II, consisting of 17 accessions, showed low contents of gallic acid (1.2 ± 1.9 μg g−1) and caffeic acid (8.1 ± 6.8 μg g−1) but high contents of 3,4-dihydroxybenzoic acid (11.4 ± 7.2 μg g−1), 3,4-hydroxybenzoic acid (64.2 ± 58.8 μg g−1), benzoic acid (133.9 ± 84.2 μg g−1), ferulic acid (32.3 ± 21.5 μg g−1), cinnamic acid (4.5 ± 3.8 μg g−1), rutin (2115.2 ± 1579.9 μg g−1), quercetin-3-β-D-glucoside (221.0 ± 174.1 μg g−1), kaempferol-3-O-β-rutinoside (112.6 ± 77.8 μg g−1), and quercetin (41.6 ± 34.5 μg g−1). Group III, with 18 accessions, demonstrated the highest contents of 2,4-dihydroxybenzic acid (37.8 ± 28.3 μg g−1), vanillic acid (40.3 ± 33.4 μg g−1), and kaempferol (10.7 ± 8.0 μg g−1). Group IV (17 accessions) had the lowest contents of 3,4-dihydroxybenzoic acid (1.8 ± 2.0 μg g−1), 4-hydroxybenzoic acid (7.3 ± 4.9 μg g−1), 2,4-dihydroxybenzic acid (7.5 ± 6.6 μg g−1), vanillic acid (9.8 ± 7.4 μg g−1), syringic acid (3.3 ± 2.1 μg g−1), benzoic acid (34.4 ± 23.0 μg g−1), p-coumaric acid (5.6 ± 4.1 μg g−1), ferulic acid (12.3 ± 8.7 μg g−1), sinapic acid (10.4 ± 15.7 μg g−1), cinnamic acid (0.9 ± 1.2 μg g−1), rutin (553.5 ± 535.4 μg g−1), quercetin-3-β-D-glucoside (43.6 ± 49.5 μg g−1), and kaempferol-3-O-β-rutinoside (41.9 ± 23.9 μg g−1) but had the highest content of gallic acid (4.2 ± 3.7 μg g−1). Group V (19 accessions) showed the lowest contents of quercetin (17.4 ± 11.1 μg g−1) and kaempferol (7.0 ± 6.5 μg g−1). Group VI (23 accessions) showed the highest content of sinapic acid (32.8 ± 30.5 μg g−1).

3.6. Statistical Analysis of Genotype, Year, and Genotype × Year across 17 Polyphenols

In this study, we conducted an examination of the statistical significance of genotype, year, and genotype × year variables for 17 types of polyphenols. The findings revealed very high statistical significance for all variables across all polyphenols (Table 5). However, sinapic acid and kaempferol exhibited differences from the other 15 polyphenols, demonstrating comparatively lower significance in both year and genotype, respectively. These results suggest that sinapic acid and kaempferol may possess unique characteristics compared to the rest of the polyphenols. The study underscores the potential variation in the impact of genotype and year based on the type of polyphenol, indicating the need for further investigation into the distinctive properties and roles of sinapic acid and kaempferol in the context of polyphenol metabolism and biological activity.

4. Discussion

The study found that all genotypes have similar polyphenol profiles, but there were significant differences in polyphenol concentrations between years and genotypes. During the flowering period from the month of May to August, total precipitation decreased by approximately 50% in 2019 (388.1 mm) when compared to 2018 (728.1 mm), while the total temperature remained relatively stable, with no significant change between 2018 and 2019 with an average of 25 and 24.2 °C, respectively (Figure 1). Sarker and Oba, (2018) reported increased antioxidant activities and 16 polyphenol contents with an increase in drought stress [20], and Barba de la Rosa et al. (2019) mentioned that, in addition to drought stress, external factors like insect damage, light limitation, and nutrient limitation can alter the polyphenol content of a given accession [18].
Numerous scientific reports have addressed the influence of factors such as total phenolic and anthocyanin content, maturity, and diverse plant species on antioxidant capacity [10,24]. Phenolic compounds emerge as the predominant antioxidant components, contributing to robust antioxidant activity and stress response in various tested plants [25]. To harness the potential of these substantial natural antioxidant sources, additional characterization of the phenolic composition is essential [3]. In this study, we observed a broad variation in the content of seven hydroxybenzoic acids, five hydroxycinnamic acids, and five flavonoids across one hundred twenty accessions representing nine different Amaranthus species.
Plants accumulate phenolic compounds in response to various stress and climatic conditions, leading to increased production of reactive oxygen and nitrogen species within the host plant’s body [26]. Due to the variations in type and content among different plant species, studies measuring content are being conducted on various plant species to comprehensively understand and quantify these differences [27,28,29]. Previous studies have identified similarities between quinoa and Amaranthus species in terms of several phenolic acids, flavonoids, and their glycosides [7,30]. Similarly, in a study by Khanam et al. (2012), higher contents of gallic acid, vanillic acid, 4-hydroxybenzoic acid, caffeic acid, ferulic acid, sinapic acid, cinnamic acid, and quercetin-3-glucoside were reported in Amaranthus leaves compared to other leafy greens, including komatsuna, mizuna, pok choi, mitsuba, salad spinach, and lettuce [3]. This emphasizes the substantial polyphenol content of Amaranthus and its potential applications.
The levels of various polyphenols in A. hypochondriacus and A. tricolor in this study were found to be higher than those reported by previous studies [3,18,31]. Furthermore, in comparison with previous studies, the levels of 14 types of polyphenols identified in this study were 2–5 times higher, with rutin’s level exceeding 10 times the previously reported amounts. This study facilitates a comprehensive and simultaneous comparison of polyphenol contents among various amaranth species and accessions, offering crucial insights for material development.
This study’s findings also confirmed notably high rutin content in Amaranthus compared to other polyphenols. Recognizing the substantial differences in polyphenol contents among accessions, adjustments were essential to mitigate potential impacts on the overall analysis. Similar to the antioxidant assay utilizing the Relative Antioxidant Capacity Index (RACI) to account for systematic differences in various antioxidant experiments [32], we introduced the concept of the Relative Polyphenol Content Index (RPCI). The highest RPCI values were observed in A. viridis (1.65) in 2018 and A. hypochondriacus (0.98) in 2019. The overall RPCI was elevated in A. viridis and three grain Amaranthus species. Despite a decrease in A. viridis’ polyphenol content in 2019 compared to 2018, its total RPCI value remained the highest among the nine species, indicating that its polyphenol content surpassed that of other species in both years. Seasonal variation significantly influencing flavonoid biosynthesis in Tetrastigma hemsleyanum Diels & Gilg was reported [33].
In this study, a notable and statistically robust positive correlation was observed between rutin and kaempferol-3-O-β-rutinoside, with a correlation coefficient (r) of 0.93. Rutin and kaempferol-3-O-β-rutinoside are rutinosides of quercetin and kaempferol, respectively, which have independent pathways but go through the same biosynthetic mechanism [34]. Interestingly, a strong positive correlation (r = 0.98) of rutin and kaempferol-3-O-β-rutinoside content was observed in A. hybridus and A. caudatus in the present study. Furthermore, a previous study by Chen et al. (2018) reported high accumulations of rutin and kaempferol 3-O-rutinoside in the Wuyi Rock tea cultivar, grown in the same environmental conditions subjected to the same cultivation practices, further supporting the observed correlation in our study [35]. However, it is noteworthy that Gallic acid and benzoic acid displayed the strongest negative correlation (r = −0.43) in our study. Gallic acid also exhibited negative correlations with other polyphenols, likely due to its less frequent detection in 2019 compared to 2018 (Supplementary Table S4). Numerous investigations have explored the impact of seasonal variations on the production of plant secondary metabolites, specifically focusing on the accumulation of specific compounds in plants [36,37,38].
Hierarchical clustering analysis and PCA confirmed annual variation, dividing the accessions into six groups, independent of their species (Figure 4). Grain Amaranthus accessions were evenly distributed in groups 1, 2, 3, and 5, while all A. viridis and A. biltum accessions were clustered in groups 3 and 6, respectively. Groups 4 and 6 included only vegetable Amaranthus accessions. Group 5 was the most diverse, containing accessions belonging to six of the nine species. Compared with 2018, the polyphenol contents of groups 3, 4, and 6 were lower in 2019, while those of groups 1, 2, and 5 were higher in 2019. In contrast, flavonoid contents were higher in 2019 than in 2018 for all groups (Table 4). The inheritability of chemical traits in plants generally surpasses that of morphological, phenological, and life-history traits [39]. This high heritability in chemical traits likely indicates high evolvability, despite potential sensitivity to environmental variation in heritability measures [40]. Studies consistently demonstrate high or moderate estimates of heritability for PSMs production across various plant tissues, including leaves [41]. The significant variability between the year and genotypes variables for 17 types of polyphenols may contribute to these high heritabilities, suggesting ample genetic variation between species. Similarly, in our study, clustering and PCA analysis confirmed variation, dividing the accessions into six groups independent of their species.

5. Conclusions

The findings of this study underscore the potential of one hundred twenty Amaranthus accessions spanning nine different species as valuable sources of polyphenols. Despite the high protein and nutrient contents of various Amaranthus species, the genus remains underutilized and often overlooked. Considering that the Amaranthaceae family comprises approximately 70 Amaranthus species, with 20 producing edible leaves and/or grains [31], our study provides a comprehensive evaluation of polyphenol content across different Amaranthus species under varying environmental conditions. These findings unveil new potential applications of Amaranthus spp. For instance, our study highlights that A. viridis and A. hypochondriacus exhibited higher polyphenol content in 2018 and 2019, respectively, compared to other Amaranthus species. Similarly, based on the overall harvest years (2018–2019) among the nine species, A. viridis showcased the highest RPCI, followed by A. hypochondriacus, suggesting their potential for the development of new health-promoting materials. Overall, the results of this study provide essential insights that can guide decision-making processes in Amaranthus breeding programs.

Supplementary Materials

The following supporting information can be downloaded at: https://www.mdpi.com/article/10.3390/antiox13040501/s1, Table S1: List of 120 Amaranthus accessions used in this study; Table S2: The UPLC-PDA analysis of polyphenol content among 120 Amaranthus accessions between the year of 2018 and 2019; Table S3: Relative polyphenol content index of 120 Amaranthus accessions between the year 2018 and 2019; Table S4: Correlations analysis between 17 polyphenols in 9 Amaranthus species between the year of 2018 and 2019.

Author Contributions

Conceptualization, J.-H.B. and I.-H.J.; methodology, J.S. and W.T.J.; formal analysis, S.O. and T.-Y.H.; validation, T.k.H. and Y.-S.S.; investigation, J.-W.C.; resources, Y.-S.S.; data curation, J.-K.Y.; writing—original draft preparation, J.-H.B. and I.-H.J.; writing—review and editing, R.S.; formal analysis and visualization, A.A.H. and A.M.A.; supervision, G.-H.S.; project administration, J.-W.C.; funding acquisition, J.-W.C. All authors have read and agreed to the published version of the manuscript.

Funding

This research was supported by Basic Science Research Program through the National Research Foundation of Korea (NRF) funded by the Ministry of Education (NRF-2018R1D1A1B07050431). The authors extend their appreciation to the researchers supporting project number (RSPD2024R931) King Saud University, Riyadh, Saudi Arabia.

Institutional Review Board Statement

Not applicable.

Informed Consent Statement

Not applicable.

Data Availability Statement

Data are contained within the article and Supplementary Materials.

Conflicts of Interest

The authors declare no conflicts of interest.

References

  1. Zagoskina, N.V.; Zubova, M.Y.; Nechaeva, T.L.; Kazantseva, V.V.; Goncharuk, E.A.; Katanskaya, V.M.; Baranova, E.N.; Aksenova, M.A. Polyphenols in Plants: Structure, Biosynthesis, Abiotic Stress Regulation, and Practical Applications (Review). Int. J. Mol. Sci. 2023, 24, 13874. [Google Scholar] [CrossRef]
  2. Arts, I.C.; Hollman, P.C. Polyphenols and disease risk in epidemiologic studies. Am. J. Clin. Nutr. 2005, 81, 317s–325s. [Google Scholar] [CrossRef]
  3. Khanam, U.K.S.; Oba, S.; Yanase, E.; Murakami, Y. Phenolic acids, flavonoids and total antioxidant capacity of selected leafy vegetables. J. Funct. Foods 2012, 4, 979–987. [Google Scholar] [CrossRef]
  4. Lee, K.J.; Baek, D.Y.; Lee, G.A.; Cho, G.T.; So, Y.S.; Lee, J.R.; Ma, K.H.; Chung, J.W.; Hyun, D.Y. Phytochemicals and Antioxidant Activity of Korean Black Soybean (Glycine max L.) Landraces. Antioxidants 2020, 9, 213. [Google Scholar] [CrossRef] [PubMed]
  5. Mikulic Petkovsek, M.; Slatnar, A.; Stampar, F.; Veberic, R. The influence of organic/integrated production on the content of phenolic compounds in apple leaves and fruits in four different varieties over a 2-year period. J. Sci. Food Agric. 2010, 90, 2366–2378. [Google Scholar] [CrossRef]
  6. Neugart, S.; Baldermann, S.; Ngwene, B.; Wesonga, J.; Schreiner, M. Indigenous leafy vegetables of Eastern Africa—A source of extraordinary secondary plant metabolites. Food Res. Int. 2017, 100, 411–422. [Google Scholar] [CrossRef]
  7. Tang, Y.; Li, X.; Chen, P.X.; Zhang, B.; Liu, R.; Hernandez, M.; Draves, J.; Marcone, M.F.; Tsao, R. Assessing the Fatty Acid, Carotenoid, and Tocopherol Compositions of Amaranth and Quinoa Seeds Grown in Ontario and Their Overall Contribution to Nutritional Quality. J. Agric. Food Chem. 2016, 64, 1103–1110. [Google Scholar] [CrossRef]
  8. Das, S. Amaranths: The Crop of Great Prospect. In Amaranthus: A Promising Crop of Future; Springer: Singapore, 2016; pp. 13–48. [Google Scholar]
  9. Rastogi, A.; Shukla, S. Amaranth: A new millennium crop of nutraceutical values. Crit. Rev. Food Sci. Nutr. 2013, 53, 109–125. [Google Scholar] [CrossRef] [PubMed]
  10. Shukla, S.; Bhargava, A.; Chatterjee, A.; Pandey, A.C.; Mishra, B.K. Diversity in phenotypic and nutritional traits in vegetable amaranth (Amaranthus tricolor), a nutritionally underutilised crop. J. Sci. Food Agric. 2010, 90, 139–144. [Google Scholar] [CrossRef]
  11. Manyelo, T.G.; Sebola, N.A.; Mabelebele, M. Nutritional and Phenolic Profile of Early and Late Harvested Amaranth Leaves Grown Under Cultivated Conditions. Agriculture 2020, 10, 432. [Google Scholar] [CrossRef]
  12. López-Mejía, O.A.; López-Malo, A.; Palou, E. Antioxidant capacity of extracts from amaranth (Amaranthus hypochondriacus L.) seeds or leaves. Ind. Crop. Prod. 2014, 53, 55–59. [Google Scholar] [CrossRef]
  13. Narwade, S.G.; Pinto, S.V. Amaranth—A Functional Food. Concepts Dairy Vet. Sci. 2018, 1. [Google Scholar] [CrossRef]
  14. Jan, N.; Hussain, S.Z.; Naseer, B.; Bhat, T.A. Amaranth and quinoa as potential nutraceuticals: A review of anti-nutritional factors, health benefits and their applications in food, medicinal and cosmetic sectors. Food Chem. X 2023, 18, 100687. [Google Scholar] [CrossRef] [PubMed]
  15. Kalinova, J.; Dadakova, E. Rutin and total quercetin content in amaranth (Amaranthus spp.). Plant Foods Hum. Nutr. 2009, 64, 68–74. [Google Scholar] [CrossRef]
  16. Li, H.; Deng, Z.; Liu, R.; Zhu, H.; Draves, J.; Marcone, M.; Sun, Y.; Tsao, R. Characterization of phenolics, betacyanins and antioxidant activities of the seed, leaf, sprout, flower and stalk extracts of three Amaranthus species. J. Food Compos. Anal. 2015, 37, 75–81. [Google Scholar] [CrossRef]
  17. Karamać, M.; Gai, F.; Longato, E.; Meineri, G.; Janiak, M.A.; Amarowicz, R.; Peiretti, P.G. Antioxidant Activity and Phenolic Composition of Amaranth (Amaranthus caudatus) during Plant Growth. Antioxidants 2019, 8, 173. [Google Scholar] [CrossRef]
  18. Barba de la Rosa, A.P.; De León-Rodríguez, A.; Laursen, B.B.; Fomsgaard, I.S. Influence of the growing conditions on the flavonoids and phenolic acids accumulation in amaranth (Amaranthus hypochondriacus L.) leaves. Rev. Terra Latinoam. 2019, 37, 449–457. [Google Scholar] [CrossRef]
  19. Netshimbupfe, M.H.; Berner, J.; Van Der Kooy, F.; Oladimeji, O.; Gouws, C. Influence of Drought and Heat Stress on Mineral Content, Antioxidant Activity and Bioactive Compound Accumulation in Four African Amaranthus Species. Plants 2023, 12, 953. [Google Scholar] [CrossRef]
  20. Sarker, U.; Oba, S. Drought stress enhances nutritional and bioactive compounds, phenolic acids and antioxidant capacity of Amaranthus leafy vegetable. BMC Plant Biol. 2018, 18, 258. [Google Scholar] [CrossRef] [PubMed]
  21. Gerrano, A.S.; Rensburg, W.S.J.v.; Mavengahama, S.; Bairu, M.; Venter, S.; Adebola, P.O. Qualitative morphological diversity of Amaranthus species. J. Trop. Agric. 2017, 55, 12–20. [Google Scholar]
  22. Jeong, W.T.; Bang, J.-H.; Han, S.; Hyun, T.K.; Cho, H.; Lim, H.B.; Chung, J.-W. Establishment of a UPLC-PDA/ESI-Q-TOF/MS-Based Approach for the Simultaneous Analysis of Multiple Phenolic Compounds in Amaranth (A. cruentus and A. tricolor). Molecules 2020, 25, 5674. [Google Scholar] [CrossRef] [PubMed]
  23. Hammer, Ø.; Harper, D.A.T.; Ryan, P.D. Past: Paleontological Statistical Software Package for Education and Data Analysis. Palaeontol. Electron. 2001, 4, 1–9. [Google Scholar]
  24. Halliwell, B.; Aeschbach, R.; Löliger, J.; Aruoma, O.I. The characterization of antioxidants. Food Chem. Toxicol. 1995, 33, 601–617. [Google Scholar] [CrossRef] [PubMed]
  25. Heim, K.E.; Tagliaferro, A.R.; Bobilya, D.J. Flavonoid antioxidants: Chemistry, metabolism and structure-activity relationships. J. Nutr. Biochem. 2002, 13, 572–584. [Google Scholar] [CrossRef] [PubMed]
  26. Pasqualini, V.; Robles, C.; Garzino, S.; Greff, S.; Bousquet-Melou, A.; Bonin, G. Phenolic compounds content in Pinus halepensis Mill. needles: A bioindicator of air pollution. Chemosphere 2003, 52, 239–248. [Google Scholar] [CrossRef] [PubMed]
  27. Ju, Y.; Wang, Y.; Ma, L.; Kang, L.; Liu, H.; Ma, X.; Zhao, D. Comparative Analysis of Polyphenols in Lycium barbarum Fruits Using UPLC-IM-QTOF-MS. Molecules 2023, 28, 4930. [Google Scholar] [CrossRef] [PubMed]
  28. Sytar, O.; Hemmerich, I.; Zivcak, M.; Rauh, C.; Brestic, M. Comparative analysis of bioactive phenolic compounds composition from 26 medicinal plants. Saudi J. Biol. Sci. 2018, 25, 631–641. [Google Scholar] [CrossRef]
  29. Zhang, X.; Bian, Z.; Li, S.; Chen, X.; Lu, C. Comparative Analysis of Phenolic Compound Profiles, Antioxidant Capacities, and Expressions of Phenolic Biosynthesis-Related Genes in Soybean Microgreens Grown under Different Light Spectra. J. Agric. Food Chem. 2019, 67, 13577–13588. [Google Scholar] [CrossRef]
  30. Tang, Y.; Tsao, R. Phytochemicals in quinoa and amaranth grains and their antioxidant, anti-inflammatory, and potential health beneficial effects: A review. Mol. Nutr. Food Res. 2017, 61, 1600767. [Google Scholar] [CrossRef]
  31. Sarker, U.; Oba, S. Antioxidant constituents of three selected red and green color Amaranthus leafy vegetable. Sci. Rep. 2019, 9, 18233. [Google Scholar] [CrossRef]
  32. Sun, T.; Tanumihardjo, S.A. An integrated approach to evaluate food antioxidant capacity. J. Food Sci. 2007, 72, R159–R165. [Google Scholar] [CrossRef] [PubMed]
  33. Shi, Y.; Yang, L.; Yu, M.; Li, Z.; Ke, Z.; Qian, X.; Ruan, X.; He, L.; Wei, F.; Zhao, Y.; et al. Seasonal variation influences flavonoid biosynthesis path and content, and antioxidant activity of metabolites in Tetrastigma hemsleyanum Diels & Gilg. PLoS ONE 2022, 17, e0265954. [Google Scholar] [CrossRef]
  34. Lim, W.; Li, J. Synergetic effect of the Onion CHI gene on the PAP1 regulatory gene for enhancing the flavonoid profile of tomato skin. Sci. Rep. 2017, 7, 12377. [Google Scholar] [CrossRef] [PubMed]
  35. Chen, S.; Li, M.; Zheng, G.; Wang, T.; Lin, J.; Wang, S.; Wang, X.; Chao, Q.; Cao, S.; Yang, Z.; et al. Metabolite Profiling of 14 Wuyi Rock Tea Cultivars Using UPLC-QTOF MS and UPLC-QqQ MS Combined with Chemometrics. Molecules 2018, 23, 104. [Google Scholar] [CrossRef] [PubMed]
  36. Gomes, A.F.; Almeida, M.P.; Leite, M.F.; Schwaiger, S.; Stuppner, H.; Halabalaki, M.; Amaral, J.G.; David, J.M. Seasonal variation in the chemical composition of two chemotypes of Lippia alba. Food Chem. 2019, 273, 186–193. [Google Scholar] [CrossRef] [PubMed]
  37. Peters, K.; Gorzolka, K.; Bruelheide, H.; Neumann, S. Seasonal variation of secondary metabolites in nine different bryophytes. Ecol. Evol. 2018, 8, 9105–9117. [Google Scholar] [CrossRef] [PubMed]
  38. Yang, L.; Zheng, Z.-S.; Cheng, F.; Ruan, X.; Jiang, D.-A.; Pan, C.-D.; Wang, Q. Seasonal Dynamics of Metabolites in Needles of Taxus wallichiana var. mairei. Molecules 2016, 21, 1403. [Google Scholar] [CrossRef]
  39. Geber, M.A.; Griffen, L.R. Inheritance and Natural Selection on Functional Traits. Int. J. Plant Sci. 2003, 164, S21–S42. [Google Scholar] [CrossRef]
  40. Moore, B.D.; Andrew, R.L.; Külheim, C.; Foley, W.J. Explaining intraspecific diversity in plant secondary metabolites in an ecological context. New Phytol. 2014, 201, 733–750. [Google Scholar] [CrossRef]
  41. Zangerl, A.R.; Berenbaum, M.R. Furanocoumarin Induction in Wild Parsnip: Genetics and Population Variation. Ecology 1990, 71, 1933–1940. [Google Scholar] [CrossRef]
Figure 1. Temperature and precipitation data in Cheongju over two years (2018 and 2019). Total represents the sum of temperature and precipitation during the Amaranthus growing season (May to August). Tem: temperature; Pptn: precipitation.
Antioxidants 13 00501 g001
Figure 2. Chromatograms show the absorbance of a standard mixture of 17 polyphenols at 260 nm. The peaks were identified as follows: (1) gallic acid, (2) 3,4-dihydroxybenzoic acid, (3) 4-hydroxybenzoic acid, (4) 2,4-dihydroxybenzoic acid, (5) vanillic acid, (6) caffeic acid, (7) syringic acid, (8) p-coumaric acid, (9) feulic acid, (10) sinapic acid, (11) rutin, (12) quercetin 3-β-D-glucoside, (13) benzoic acid, (14) kaempferol 3-O-β-rutinoside, (15) quercetin, (16) cinnamic acid, and (17) kaempferol.
Antioxidants 13 00501 g002
Figure 3. Relative Polyphenol Content Index (RPCI) of 9 Amaranthus species, based on the contents of 17 polyphenols in 2018 and 2019. (A) Comparison between 120 accessions. (B) Comparison between 9 species.
Antioxidants 13 00501 g003
Figure 4. Correlations between 17 polyphenols in 9 Amaranthus species combining 2018 and 2019 data. HBA1: gallic acid; HBA2: 3,4-dihydroxybenzoic acid; HBA3: 4-hydroxybenzoic acid; HBA4: 2,4-dihydroxybenzic acid; HBA5: vanillic acid; HBA6: syringic acid; HBA7: benzoic acid; HCA1: caffeic acid; HCA2: p-coumaric acid; HCA3: ferulic acid; HCA4: sinapic acid; HCA5: cinnamic acid; FLA1: rutin; FLA2: quercetin-3-β-D-glucoside; FLA3: kaempferol-3-O-β-rutinoside; FLA4: quercetin; FLA5: kaempferol. *: p < 0.01, **: p < 0.05, and ***: p < 0.001.
Antioxidants 13 00501 g004
Figure 5. Principal component analysis (PCA) of ni9 Amaranthus species, based on the contents of 17 polyphenols in 2018 and 2019. (A) Comparison between 120 accessions. Red, A. hypochondriacus; Orange, A. cruentus; Yellow, A. caudatus; Green, A. tricolor; Blue, A. dubius; Navy, A. blitum; Purple, A. crispus; Aqua, A. hybridus; Black, A. viridis. (B) Comparison between two years. Red, 2018; Blue, 2019.
Antioxidants 13 00501 g005
Figure 6. Hierarchical clustering analysis of 9 Amaranthus species, based on the contents of 17 polyphenol contents in 2018 and 2019. HBA1: gallic acid; HBA2: 3,4-dihydroxybenzoic acid; HBA3: 4-hydroxybenzoic acid; HBA4: 2,4-dihydroxybenzic acid; HBA5: vanillic acid; HBA6: syringic acid; HBA7: benzoic acid; HCA1: caffeic acid; HCA2: p-coumaric acid; HCA3: ferulic acid; HCA4: sinapic acid; HCA5: cinnamic acid; FLA1: rutin; FLA2: quercetin-3-β-D-glucoside; FLA3: kaempferol-3-O-β-rutinoside; FLA4: quercetin; FLA5: kaempferol.
Antioxidants 13 00501 g006
Table 1. UPLC-PDA operating conditions.
ParametersConditions
UPLC-PDA conditions below
Injection volume5 μL
Column temperature40 °C
Flow rate0.25 mL/min
Column typeBEH C18 column (2.1 mm × 100 mm, 1.7 μm)
Gradient/mobile phase Time (min)Solvent A (%)Solvent B (%)
0982
207525
244060
271090
281090
30982
35re-equilibration
Table 2. Descriptive statistics of the contents of 17 polyphenols in leaf extracts of 9 Amaranthus species in 2018 and 2019.
Phenolic CompoundYearSpecies
A. hypoA. crueA. caudA. tricA. dubiA. blitA. crisA. hybrA. viriAverage
Hydroxybenzoic acid (μg g−1)
HBA120183.0 ± 1.5 ab 14.5 ± 3.9 a2.8 ± 1.6 ab2.3 ± 0.5 b1.8 ± 0.3 b1.9 ± 0.4 b2.0 ± 0.5 b4.5 ± 2.0 a4.3 ± 0.5 a2.0 ± 1.8 g
201924.2 a7.7 ± 8.7 b7.5 ± 7.5 b9.2 ± 0.5 b8.6 b9.0 ± 0.7 b8.8 ± 0.3 b9.5 ± 0.9 b8.9 ± 0.2 b4.3 ± 5.3 fg
HBA220186.2 ± 3.9 bc6.1 ± 5.1 bc5.4 ± 2.3 bc3.0 ± 1.3 c1.9 ± 0.4 c-2.5 ± 1.0 c7.5 ± 5.2 b16.9 ± 4.6 a4.1 ± 4.8 fg
201914.8 ± 6.0 a9.0 ± 4.5 b8.5 ± 6.1 b3.5 ± 1.4 b4.2 ± 0.9 b-2.9 ± 0.2 b5.6 ± 0.3 b3.9 ± 1.2 b6.5 ± 6.9 fg
HBA3201811.1 ± 4.8 bc13.3 ± 4.9 b10.1 ± 9.9 bc6.9 ± 4.5 bc10.2 ± 7.4 bc5.4 ± 1.3 c6.9 ± 3.9 bc7.1 ± 2.6 bc31.9 ± 11.0 a10.3 ± 8.4 ef
2019108.3 ± 43.5 a78.9 ± 33.7 ab36.1 ± 33.6 cd13.0 ± 12.4 d6.3 ± 1.2 d37.2 ± 16.7 cd61.8 ± 18.5 bc27.9 ± 23.5 d38.8 ± 28.1 cd51.1 ± 47.6 b
HBA4201824.6 ± 28.4 b18.4 ± 6.4 b16.1 ± 11.8 b9.2 ± 14.1 b13.7 ± 10.1 b13.6 ± 13.4 b17.6 ± 7.7 b18.1 ± 7.9 b49.4 ± 14.2 a18.3 ± 19.5 d
201942.7 ± 15.9 a19.8 ± 15.6 b38.1 ± 14.2 a10.6 ± 12.3 b12.4 ± 8.1 b21.8 ± 3.6 b21.1 ± 10.2 b23.6 ± 19.7 b16.8 ± 10.6 b25.7 ± 19.0 c
HBA5201816.6 ± 5.6 bc22.7 ± 5.9 b19.4 ± 6.7 bc13.5 ± 8.6 cd4.1 ± 0.5 e13.7 ± 14.9 cd5.9 ± 3.8 de19.8 ± 8.9 bc46.5 ± 14.3 a16.8 ± 11.5 de
201952.2 ± 12.9 a37.4 ± 24.0 ab40.1 ± 41 ab9.4 ± 5.5 cd6.5 ± 1.9 d19.0 ± 3.4 bcd33.0 ± 26.1 abc18.3 ± 15.4 bcd36.7 ± 31.9 ab30.9 ± 27.2 c
HBA620184.9 ± 4.3 b6.0 ± 5.9 b6.0 ± 3.5 b2.9 ± 0.9 b2.7 ± 1.2 b4.5 ± 1.4 b4.6 ± 1.6 b4.5 ± 1.4 b10.6 ± 5.7 a4.5 ± 3.8 fg
201913.4 ± 10.6 ab6.2 ± 1.6 bc20.2 ± 6.8 a5.0 ± 3.4 bc6.3 ± 2.2 bc6.8 ± 4.0 bc6.9 ± 3.5 bc4.1 ± 1.0 c5.3 ± 3.1 bc9.5 ± 8.7 fg
HBA7201861.7 ± 22.2 b64.3 ± 25.8 b64.2 ± 33.2 b39.7 ± 21.7 bc27.5 ± 4.0 c33.3 ± 9.2 bc39.5 ± 28.5 bc52.3 ± 13.2 bc142.5 ± 65.7 a56.5 ± 36.6 b
2019173.5 ± 59.2 a110.5 ± 50.3 b109.9 ± 55.3 b32.5 ± 24.0 c74.2 ± 19.2 bc57.9 ± 3.1 c61.2 ± 16.1 c74.8 ± 18.2 bc44.7 ± 21.7 c93.6 ± 68.1 a
Hydroxycinnamic acid (μg g−1)
HCA120185.2 ± 4.4 c5.1 ± 2.2 c4.5 ± 4.2 c9.5 ± 10.3 bc18.4 ± 16.3 ab14.4 ± 3.7 bc13.8 ± 4.9 bc10.8 ± 7.2 bc27.1 ± 23.0 a9.3 ± 10.6 cd
201914.6 ± 12.8 ab9.4 ± 7.8 b20.9 ± 13.2 a8.2 ± 4.6 b12.4 ± 5.2 ab7.9 ± 0.7 b8.9 ± 5.2 b9.0 ± 4.3 b9.2 ± 3.3 b12.1 ± 10.0 c
HCA220186.3 ± 4.3 b7.8 ± 4.1 b7.1 ± 5.1 b7.8 ± 4.9 b5.0 ± 1.3 b7.0 ± 0.6 b5.3 ± 1.5 b5.2 ± 0.7 b24.9 ± 12.7 a7.4 ± 6.7 d
201917.8 ± 8.0 a10.6 ± 8.5 b18.1 ± 11.2 a4.0 ± 1.9 b8.5 ± 1.5 b5.6 ± 0.6 b4.3 ± 0.8 b6.0 ± 1.6 b5.8 ± 2.6 b10.5 ± 9.0 cd
HCA3201817.5 ± 7.1 bc20.3 ± 9.2 bc17.7 ± 9.8 bc15.6 ± 10.9 c17.0 ± 10.5 bc12.8 ± 10.3 c26.1 ± 6.2 b19.3 ± 8.5 bc35.6 ± 10.2 a19.0 ± 10.2 b
201941.0 ± 16.9 a25.7 ± 7.1 bc28.3 ± 9.9 b9.8 ± 6.8 d18.9 ± 1.1 bcd18.7 ± 8.6 bcd19.9 ± 1.9 bcd19.0 ± 5.8 bcd15.0 ± 6.4 cd24.0 ± 15.6 a
HCA4201817.6 ± 9.6 b21.1 ± 13.8 b15.8 ± 11.5 b15.8 ± 26.2 b14.0 ± 6.8 b51.5 ± 41.9 a55.4 ± 29.2 a14.4 ± 13.4 b29.6 ± 15.6 b20.3 ± 22.0 b
201933.8 ± 14.2 ab29.1 ± 22.6 ab24.2 ± 14.0 b14.5 ± 16.2 b33.8 ± 9.5 ab47.8 ± 22.7 a33.0 ± 19.0 ab21.8 ± 9.3 b24.1 ± 30.3 b24.3 ± 19.2 a
HCA520182.4 ± 0.6 a2.6 ± 0.6 a2.5 ± 0.6 a2.3 ± 0.8 a2.0 ± 0.7 a2.8 ± 0.9 a2.4 ± 0.6 a2.4 ± 0.7 a3.4 ± 2.6 a1.6 ± 1.4 e
20196.3 ± 2.8 a3.9 ± 1.7 ab4.1 ± 1.6 ab2.6 ± 0.7 b1.8 ± 0.2 b2.8 ± 0.5 b2.3 ± 0.5 b2.3 ± 0.4 b1.9 ± 0.3 b3.1 ± 2.8 e
Flavonoid (μg g−1)
FLA120181072.3 ± 799.9 ab788.1 ± 767.4 abc614.6 ± 485.4 bc831.3 ± 854.1 abc95.7 ± 199.2 c973.3 ± 391.0 ab1162.0 ± 495.8 ab1116.6 ± 411.5 ab1485.1 ± 679.5 a910.4 ± 736.9 b
20193166.5 ± 1317.4 a2433.9 ± 576.4 ab1875.5 ± 816.0 bc821.6 ± 710.0 d1360.0 ± 348.6 cd1915.7 ± 941.4 bc1716.7 ± 434.6 bcd1368.6 ± 427.3 cd1201.0 ± 589.4 cd1869.9 ± 1234.9 a
FLA2201874.4 ± 49.2 bc97.5 ± 86.2 bc44.7 ± 30.8 bc48.5 ± 52.2 bc23.2 ± 33.4 c55.2 ± 26.4 bc129.2 ± 160.2 b123.8 ± 104.3 b224.0 ± 157.2 a78.4 ± 89.4 cd
2019310.1 ± 118.1 a229.0 ± 154.8 ab112.9 ± 56.2 c72.6 ± 68.5 c140.7 ± 65.7 bc137.7 ± 51.2 bc181.4 ± 111.3 bc177.3 ± 95.8 bc182.2 ± 117.6 bc176.6 ± 130.4 c
FLA3201854.2 ± 33.2 bc47.3 ± 30.0 bc35.3 ± 21.6 c51.5 ± 33.1 bc34.4 ± 15.5 c57.5 ± 16.3 bc71.0 ± 27.6 ab57.6 ± 19.7 bc100.0 ± 41.2 a53.8 ± 32.7 cd
2019161.1 ± 61.7 a112.0 ± 35.1 b109.3 ± 43.4 b46.9 ± 26.9 c71.6 ± 10.6 bc105.0 ± 45.4 b84.1 ± 14.8 bc68.8 ± 17.7 bc57.6 ± 26.9 c97.6 ± 59.2 cd
FLA420189.3 ± 6.0 c10.5 ± 10.2 c13.9 ± 8.5 bc23.7 ± 10.7 a22.7 ± 1.5 ab28.0 ± 0.7 a24.1 ± 4.2 a22.5 ± 3.9 ab31.5 ± 19.1 a18.1 ± 11.3 d
201956.2 ± 28.1 a23.2 ± 19.7 b41.4 ± 24.1 ab28.8 ± 4.2 b30.6 ± 2.3 b32.0 ± 0.7 b30.7 ± 2.3 b32.4 ± 3.4 b29.7 ± 3.0 b38.1 ± 21.1 d
FLA520183.7 ± 3.3 b2.2 ± 0.7 b4.2 ± 2.6 b3.6 ± 1.3 b2.9 ± 0.4 b3.0 ± 0.3 b2.8 ± 0.1 b3.3 ± 1.4 b9.3 ± 5.0 a3.5 ± 2.8 d
201916.2 ± 10.6 a 112.9 ± 7.1 a13.1 ± 7.7 a14.3 ± 3.0 a16.0 ± 0.6 a16.6 ± 0.4 a16.5 ± 0.5 a13.8 ± 3.4 a13.8 ± 3.3 a14.7 ± 6.8 d
Average201881.82 ± 58.15 a66.93 ± 61.35 a52.02 ± 38.18 a63.95 ± 62.12 a17.48 ± 19.31 a79.87 ± 33.29 a92.42 ± 48.34 a87.63 ± 37.75 a133.68 ± 63.65 ab
2019250.16 ± 108.67 b185.84 ± 57.60 b147.54 ± 68.34 b65.09 ± 53.08 a106.64 ± 29.93 b152.59 ± 68.98 ab134.91 ± 39.16 ab110.75 ± 38.12 ab99.73 ± 51.72 a
1 The same letter in each column indicates no significant difference per Duncan’s multiple range test, p < 0.05. A. hypo: A. hypochondriacus; A. crue: A. cruentus; A. caud: A. caudatus; A. tric: A. tricolor; A. dubi: A. dubius; A. blit: A. blitum; A. cris: A. crispus; A. hybr: A. hybridus; A. viri: A. viridis; HBA1: gallic acid; HBA2: 3,4-dihydroxybenzoic acid; HBA3: 4-hydroxybenzoic acid; HBA4: 2,4-dihydroxybenzic acid; HBA5: vanillic acid; HBA6: syringic acid; HBA7: benzoic acid; HCA1: caffeic acid; HCA2: p-coumaric acid; HCA3: ferulic acid; HCA4: sinapic acid; HCA5: cinnamic acid; FLA1: rutin; FLA2: quercetin-3-β-D-glucoside; FLA3: kaempferol-3-O-β-rutinoside; FLA4: quercetin; FLA5: kaempferol.
Table 3. Eigenvalue and component matrix of the principal component (PC) axes and total variation explained by each PC.
Principal ComponentsPC1PC2PC3PC4PC5PC6PC7PC8
Eigen value7.985.682.421.661.371.271.091.00
% of variance25.4418.137.715.304.374.063.493.19
Cumulative %25.4443.5751.2856.5960.9665.0268.5071.69
Component matrix
gallic acid_180.0520.099−0.135−0.2180.1990.0420.093−0.016
3,4-dihydroxybenzoic acid_180.0540.1790.039−0.1760.2810.091−0.0450.086
4-hydroxybenzoic acid_180.0650.2990.035−0.1120.261−0.0510.204−0.179
2,4-dihydroxybenzoic acid_180.0600.262−0.0480.0030.040−0.1020.1000.335
vanillic acid_180.0670.2840.142−0.3510.024−0.0020.1260.044
caffeic acid_18−0.0950.1230.1540.3760.3420.108−0.2520.040
syringic acid_180.0790.1860.3280.1740.014−0.229−0.0960.214
p-coumaric acid_18−0.0250.2470.2360.1050.2910.177−0.0770.045
ferulic acid_180.0560.2960.0310.212−0.0800.0580.118−0.419
sinapic acid_18−0.0110.115−0.1020.519−0.0380.0180.295−0.259
rutin_180.0850.285−0.2150.109−0.309−0.028−0.0410.280
quercetin-3-β-D-glucoside_180.0410.283−0.199−0.187−0.2100.037−0.129−0.012
benzoic acid_180.1130.2820.1750.0000.0480.0300.0950.018
kaempferol-3-O-β-rutinoside_180.0390.323−0.1860.171−0.228−0.054−0.1290.153
quercetin_18−0.1490.201−0.061−0.030−0.2590.319−0.185−0.160
cinnamic acid_180.0260.139−0.056−0.078−0.1690.073−0.046−0.351
kaempferol_180.0200.2120.263−0.1660.018−0.055−0.291−0.060
gallic acid_19−0.004−0.025−0.036−0.014−0.0490.1040.1220.280
3,4-dihydroxybenzoic acid_190.185−0.073−0.1440.0000.1060.0690.1520.058
4-hydroxybenzoic acid_190.2610.051−0.2610.0370.173−0.1190.1490.130
2,4-dihydroxybenzoic acid_190.249−0.0350.083−0.015−0.070−0.0870.0910.099
vanillic acid_190.2340.043−0.080−0.0700.165−0.1210.349−0.225
caffeic acid_190.115−0.0440.421−0.005−0.3400.0400.1820.025
syringic acid_190.178−0.0650.303−0.047−0.2250.1240.291−0.036
p-coumaric acid_190.251−0.0590.284−0.050−0.160−0.066−0.0680.024
ferulic acid_190.309−0.075−0.0160.0250.049−0.077−0.074−0.069
sinapic acid_190.109−0.0570.1010.3550.0580.0720.0020.094
rutin_190.306−0.026−0.0890.133−0.073−0.090−0.1440.040
quercetin-3-β-D-glucoside_190.2650.032−0.219−0.055−0.0030.006−0.198−0.059
benzoic acid_190.326−0.063−0.042−0.0100.0220.042−0.163−0.066
kaempferol-3-O-β-rutinoside_190.325−0.056−0.0360.124−0.047−0.002−0.114−0.006
quercetin_190.252−0.0850.029−0.0590.0370.322−0.274−0.198
cinnamic acid_190.201−0.1070.043−0.0040.1690.246−0.1470.022
kaempferol_190.0500.009−0.0690.016−0.0190.7090.2510.274
PC: principal component.
Table 4. Average cluster values of 17 polyphenol contents of 9 Amaranthus species.
Phenolic CompoundsGroup 1Group 2Group 3Group 4Group 5Group 6
Hydroxybenzoic acid (μg g−1)
HBA11.7 ± 4.6 a 11.2 ± 1.9 bc2.4 ± 3.3 a4.2 ± 3.7 d4.0 ± 5.7 ab4.1 ± 3.6 cd
HBA25.1 ± 4.0 c11.4 ± 7.2 b8.3 ± 6.5 a1.8 ± 2.0 c6.5 ± 6.7 bc1.9 ± 3.0 bc
HBA327.4 ± 33.9 b64.2 ± 58.8 b56.0 ± 50.1 a7.3 ± 4.9 b22.0 ± 22.0 b25.0 ± 25.0 b
HBA431.2 ± 18.3 b26.1 ± 16.7 b37.8 ± 28.3 a7.5 ± 6.6 b22.3 ± 16.1 b19.1 ± 13.8 b
HBA529.6 ± 13.9 b36.7 ± 23.0 bc40.3 ± 33.4 a9.8 ± 7.4 d22.3 ± 13.7 bc17.1 ± 17.4 cd
HBA615.7 ± 11.6 a7.1 ± 6.9 b7.5 ± 5.6 a3.3 ± 2.1 b7.8 ± 7.2 b5.1 ± 3.4 b
HBA7115.2 ± 50.0 b133.9 ± 84.2 bc98.0 ± 51.9 a34.4 ± 23.0 d60.0 ± 31.2 cd52.8 ± 22.2 cd
Hydroxycinnamic acid (μg g−1)
HCA116.4 ± 15.0 b8.1 ± 6.8 b10.2 ± 13.4 a10.6 ± 9.4 ab10.0 ± 10.3 b10.03 ± 5.9 ab
HCA216.8 ± 12.1 b11.3 ± 7.5 bc11.8 ± 10.3 a5.6 ± 4.1 bc7.3 ± 5.8 c5.8 ± 2.5 bc
HCA328.5 ± 9.2 b32.3 ± 21.5 bc25.9 ± 9.9 a12.3 ± 8.7 c18.2 ± 8.9 c20.1 ± 8.6 b
HCA425.6 ± 11.7 bc25.6 ± 15.8 c27.6 ± 17.6 ab10.4 ± 15.7 c17.5 ± 14.7 c32.8 ± 30.5 a
HCA53.7 ± 2.4 a4.5 ± 3.8 a2.6 ± 2.2 a0.9 ± 1.2 a1.6 ± 1.3 a2.1 ± 1.0 a
Flavonoid (μg g−1)
FLA11931.1 ± 1483.9 b2115.2 ± 1579.9 bc1785.0 ± 812.5 a553.5 ± 535.4 d979.7 ± 788.4 cd1609.9 ± 599.1 a
FLA2108.5 ± 78.9 b221.0 ± 174.1 b191.0 ± 107.9 a43.6 ± 49.5 b93.0 ± 98.3 b154.7 ± 109.5 a
FLA3103.6 ± 73.3 b112.6 ± 77.8 b92.3 ± 37.7 a41.9 ± 23.9 b53.0 ± 33.2 b79.7 ± 24.3 a
FLA436.7 ± 27.2 cd41.6 ± 34.5 d23.7 ± 16.5 bc24.8 ± 4.9 ab17.4 ± 11.1 d29.4 ± 8.5 a
FLA59.3 ± 7.2 a9.9 ± 11.6 b10.7 ± 8.0 a8.8 ± 6.2 b7.0 ± 6.5 b9.3 ± 6.4 b
1 The same letter in each column indicates no significant difference per Duncan’s multiple range test, p < 0.05. HBA1: gallic acid; HBA2: 3,4-dihydroxybenzoic acid; HBA3: 4-hydroxybenzoic acid; HBA4: 2,4-dihydroxybenzic acid; HBA5: vanillic acid; HBA6: syringic acid; HBA7: benzoic acid; HCA1: caffeic acid; HCA2: p-coumaric acid; HCA3: ferulic acid; HCA4: sinapic acid; HCA5: cinnamic acid; FLA1: rutin; FLA2: quercetin-3-β-D-glucoside; FLA3: kaempferol-3-O-β-rutinoside; FLA4: quercetin; FLA5: kaempferol.
Table 5. Exploring the differential impact of genotype and year on polyphenol variability.
Type of PolyphenolGenotypeYearGenotype × Year
gallic acid1.958 ***8.907 ***1.484 ***
3,4-dihydroxybenzoic acid10.93 ***9.652 ***6.756 ***
4-hydroxybenzoic acid326.4 ***2996.4 ***293.1 ***
2,4-dihydroxybenzic acid78.37 ***98.77 ***41.32 ***
vanillic acid104.8 ***356.7 ***63.9 ***
syringic acid9.53 ***45.32 ***7.18 ***
benzoic acid910.6 ***2483.8 ***686.2 ***
caffeic acid6.228 ***14.131 ***18.443 ***
p-coumaric acid9.933 ***17.154 ***17.368 ***
ferulic acid34.32 ***45.07 ***39.23 ***
sinapic acid102.93 ***30.22 *33.32 ***
cinnamic acid0.885 ***3.742 ***1.163 ***
rutin221,815 ***1,656,986 ***168,219 ***
quercetin-3-β-D-glucoside2878 ***17,369 ***1785 ***
kaempferol-3-O-β-rutinoside431 ***3445 ***532 ***
quercetin13 ***716.8 ***72 ***
kaempferol0.71 *222.69 ***1.17 ***
*: p < 0.01 and ***: p < 0.001.
Disclaimer/Publisher’s Note: The statements, opinions and data contained in all publications are solely those of the individual author(s) and contributor(s) and not of MDPI and/or the editor(s). MDPI and/or the editor(s) disclaim responsibility for any injury to people or property resulting from any ideas, methods, instructions or products referred to in the content.

