1. Introduction
Euphorbia tirucalli L., belonging to the family of Euphorbiaceae, is a very popular plant in Northern and Northeastern Brazil. It is widely used as a traditional and natural biomedicine, not only in Brazil, but also in several other tropical countries where it is well adapted to the climate. In Brazil, it is also popularly known as avelóz, cachorro-pelado, árvore-do-lápis, cega-olho, or espinho-italiano [
1]. It has been used against several kinds of diseases, infectious and non-infectious, such as syphilis, asthma, rheumatism [
2], chancre, and some types of cancer [
3], mainly due to the pharmacological properties of its latex. Knowledge about this plant stems mostly from studies of its latex [
4], and, to the best of our knowledge, there are no reports in the literature describing systematic experiments characterizing other extracts of
Euphorbia tirucalli L. with respect to antioxidant properties and identification of subcomponents related to that capacity.
Free radicals and other oxidants are molecules formed by the body’s normal metabolism that can cause harm if not well-controlled. However, the body produces other molecules to destroy the oxidants and defend itself from this damage. These molecules are known as antioxidants [
5]. In some situations, though, an unbalanced state between the production and elimination of oxidants may occur [
6]. This is known as oxidative stress, where non-eliminated or non-neutralized oxidants can damage many kinds of molecules. For instance, oxidation of lipids leads to lipid peroxidation and membrane disruption, of proteins and enzymes causes fragmentation and loss of biological activity, and of DNA results in random cross linking, leading to cell death [
7]. Secondary effects of oxidative stress are believed to be the molecular basis in the development of chronic and degenerative diseases, such as cancer, neurodegenerative disorders, cardiovascular diseases, diabetes, and autoimmune disorders [
5,
8].
Several studies have strongly evidenced a correlation between polyphenols, mainly those found in herbs, spices, cereals, fruits, and vegetables, and their high antioxidant capacities. Others have indicated that their regular consumption can help to significantly reduce the incidence of diseases linked to oxidative stress, because polyphenols act as potent free radical scavengers [
9,
10]. Given that, there has been a significant increase in research focused on natural antioxidants, not only for their health benefits, but also as replacements for synthetic additives in food and pharmaceuticals. By definition, antioxidants are substances that counteract free radicals and prevent the damage caused by them. These molecules can greatly reduce the damage caused by oxidants, neutralizing them before they react with biologic targets, either by preventing chain reactions or by preventing the activation of oxygen to highly reactive products [
5,
11].
The term “antioxidant” encompasses a vast array of substances which are divided into exogenous and endogenous antioxidants, and can be classified into two major groups, enzymatic and non-enzymatic antioxidants [
5]. The endogenous antioxidants include enzymes, low-molecular-weight molecules, and enzyme cofactors. Exogenous antioxidants can be classified into various classes [
12], of which polyphenols are the largest. The secondary metabolism of plants is responsible for the production of phenols and polyphenols, which contain multiple structures, but commonly one or more aromatic rings, respectively [
13]. These molecules are classified as flavonoids and phenolic acids [
5,
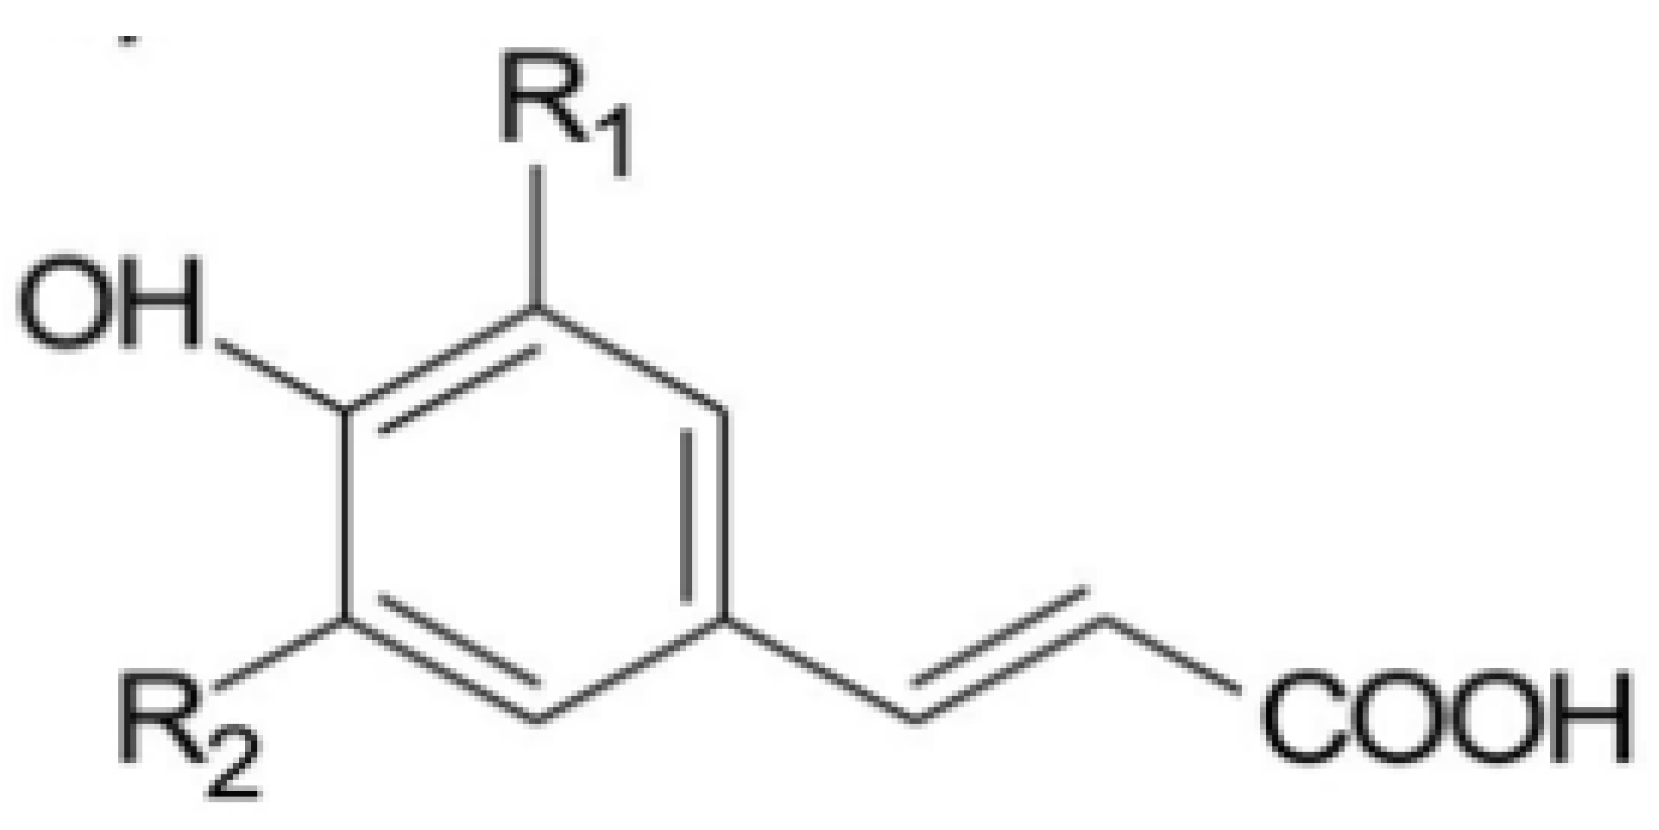
11]. Flavonoids and their glycosides are complex molecules, such as catechins, proanthocyanidins, anthocyanins, and flavonols, containing multiple aromatic rings. Among phenolic acids are the hydroxycinnamic acids, the most common compounds found in fruits and seeds, and the monophenols, which possess a single benzene ring (
Figure 1). Caffeic and ferulic acids are included in this class [
13]. Hydroxybenzoic acids, such as ellagic acid and gallic acid, are the second group of phenolic acids, but their content in plants are very low [
5].
Figure 1.
Chemical structure of hydroxycinnamic acid [
14].
Figure 1.
Chemical structure of hydroxycinnamic acid [
14].
To date, identification of the phenolic compounds and resultant antioxidant activities in Euphorbia tirucalli L. extracts have not been performed. Therefore, this study was devised to evaluate the antioxidant potential in the aerial part of the plant using various assays, such as free radical scavenging DPPH•, ABTS•+, and Rancimat methods, followed by the identification of phenolic compounds through high-performance liquid chromatography (HPLC). In addition, the biological activity and pharmacological potential were determined by testing the extracts on different pathogenic bacterial strains to evaluate their inhibitory effects on the growth of these microorganisms.
2. Experimental Section
2.1. Equipment, Chemicals, and Reagents
HPLC was performed using a Shimadzu Class-VP HPLC system (Tokio, Japan), a computer-controlled system with LC solution Release 1.24 SP1 (Shimadzu Corporation, Kyoto, Japan) and a CBM-20A VP system controller (Shimadzu Corporation, Kyoto, Japan). Other accessories included a Shimadzu DGU-20A degasser, an FCV-20AL mixer, two LC-6AD Shimadzu liquid chromatography pumps, an SIL-10F auto-injector, a CTO-20 column oven, and an SPD-M20A VP diode array detector, all from Shimadzu Corporation, Kyoto, Japan.
The following phenolic standards were obtained from Sigma Chemical Co. (St Louis, MO, USA): gallic acid, vanillic acid, benzoic acid, quercetin, ferulic acid, caffeic acid, p-coumaric acid, catechin, ellagic acid, and chlorogenic acid. HPLC-grade acetonitrile and acetic acid were used for HPLC, whereas all other reagents were analytical grade.
Aerial parts of the Euphorbia tirucalli L. were collected from Teresina, State of Piauí, Brazil, at 0°04′20.16′′ S and 42°45′39.67′′ W, between November and December, 2011. They were identified by Professor Ivanilza Moreira de Andrade, PhD, Laboratory of Taxonomy, Federal University of Piauí. A voucher specimen was deposited (protocol number 27939) in the Herbarium Graziela Barroso, at the Center of Natural Sciences, Federal University of Piauí, Piauí, Brazil.
2.3. Determination of Total Phenolics
Total phenolic content of the extracts was measured using Folin–Denis reagent [
15], adapted by Lima [
16]. First, either 0.5 mL of the extract or an appropriate gallic acid standard was added to 8.0 mL deionized water. To this, 0.5 mL of Folin–Denis reagent was added and mixed for 3 min, after which 1 mL of saturated Na
2CO
3 solution was added and mixed. After dark incubation for 60 min at room temperature, absorbance was measured at 720 nm
versus a prepared blank. The blank consisted of 0.5 mL 50% (v/v) methanol. Gallic acid at 5, 10, 20, 40, 60, and 80 μg/mL in 50% (v/v) methanol was used as a standard by which a calibration curve was obtained daily. Total phenolics was expressed as mg gallic acid equivalent (GAE)/100 g of dry sample. All samples were analyzed in triplicate.
2.4. Evaluation of Antioxidant Activity: DPPH• Method
The colorimetric 1,1-diphenyl-2-picrylhydrazyl (DPPH) radical scavenging assay was carried out according to the protocol described by Blois [
17] and adapted by Brand-Williams
et al. [
18]. Briefly, 0.5 mL of ethanol containing different concentrations (2.5, 5, 10, 20, and 40 μg/mL) of each extract (v/v) was mixed with 1.5 mL of DPPH
• ethanol solution (6 × 10
−5 M). The DPPH
• solution served as a control. Absorbance was measured at 517 nm after the mixture was kept at room temperature for 2, 5, 10, 20, and 30 min. Antioxidant activity, expressed as percentage of DPPH radical scavenging activity (RSA), was calculated as follows, Equation 1:
where Abs blank is the absorbance of the control and Abs sample is the absorbance of the DPPH solution with the extract.
Extract concentrations providing 50% inhibition (IC50) were found by interpolation from the plot of inhibition percentage. All tests were run in triplicate, and the average value calculated.
2.5. Evaluation of Antioxidant Activity: ABTS•+ Method
The ABTS assay was based on the method described by Re
et al. [
19]. Briefly, 7 mM of ABTS was mixed with 140 mM of potassium persulfate an in aqueous solution. The mixture was incubated at room temperature for 12 h, allowing formation of the radical ABTS
•+. The blue-green ABTS
+ solution was diluted with ethanol until the absorbance reached 0.700 ± 0.020 at 734 nm. Then, either 40 μL of Trolox
® standard (concentrations ranging from 50 to 800 μM) or extracts were mixed with 1960 μL of ABTS
•+ solution and kept at room temperature. The decrease of absorbance was monitored at 734 nm after 2, 5, 10, 20, and 30 min. Due to a gradual decrease in absorbance of the ABTS stock solution (2%/h), blanks were recorded for each measurement, and consisted of 40 μL of ethanol in 1960 μL of radical solution. Results were expressed in μM Trolox/g sample.
2.6. Evaluation of Antioxidant Activity: Rancimat Method
Antioxidant activities in oil oxidations of the extracts were found using a Rancimat model test (Metrohm model 873, Herisan, Switzerland), at 110 °C, a slight adaptation of Jardini and Mancini-Filho [
20]. The air flow rate was fixed at 20 L/h. Five grams of antioxidant-free soybean oil (Dureino
® industry) was used as the lipid substrate. Concentrations of the test extracts were 0.01% and 0.02% (w/w) on a dry weight basis. Butylated hydroxytoluene (BHT) was used as a comparative synthetic antioxidant. The effects of the samples on retarding oil oxidation, expressed as the protection factor (PF), was calculated as follows, Equation 2:
where IP
antiox and IP
contrl are the induction periods (IPs) of oil oxidation with and without antioxidant, respectively.
2.7. Identification and Quantification of Phenolic Compounds Using HPLC
This methodology was adapted from Dóbias
et al. [
21], and Mira
et al. [
22]. The wavelength selected for the detection of phenolic acids was 253 nm while the column oven temperature was set to 35 °C. Phenolic acid standards used for the detection and identification of peaks were gallic acid, vanillic acid, benzoic acid, quercetin, ferulic acid, caffeic acid,
p-coumaric acid, catechin, ellagic acid, and chlorogenic acid. An auto injector was used to inject 40 μL of the extract onto the HPLC column while the eluent flow rate was set to 1.0 mL/min. Aqueous acetic acid was used as mobile phase A and acetonitrile as mobile phase B. Elution consisted of the following gradient: 80:20 A:B for 5.0 min, ramped to 50:50 over 5–7 min, then set to a constant 28:72 for 7–20 min. The column was washed with 100% acetonitrile for 30 min and reconditioned with 20% acetonitrile for 20 min between runs. Each standard was recorded and stored in the HPLC spectrum library. The criteria for identification of
Euphorbia tirucalli L. compounds were established by comparing the retention time and spectra of unknown compounds with those in the HPLC library of standards. The purity of the peaks was determined to ensure identification. For close peaks, an integration program in the HPLC software was used to split them and produce data for calculations. Phenolic acids contained in the extracts were quantified by an external standard method. The concentration selected for identifying phenolic acid in all samples was 0.001%, whereas the calibration curves were constructed at 10, 50, 200, and 325 μg/mL. Calibration curves were built by plotting the phenolic acid peak at 253 nm against the phenolic acid standard. Data were analyzed by linear regression.
2.8. Antibacterial Assay
Antibacterial assays were conducted using 10 mL of each extract submitted to solvent evaporation over 10 h in a vacuum concentrator (Centrivap®, Kansas City, MO, USA) after which 5 and 10 mg of each dried extract was resuspended in 1.0 mL of 15% dimethyl sulfoxide (DMSO) in sterile distilled water, reaching final concentrations of 5000 μg/mL and 10,000 μg/mL for further testing.
Extracts were tested for activity against Staphylococcus aureus (ATCC 29213), Staphylococcus epidermidis (ATCC 12228), Enterococcus faecalis (ATCC 29212), Escherichia coli (ATCC 25922), and Pseudomonas aeruginosa (ATCC 27853). Bacteria were spread over Muellen-Hinton agar (DIFCO®) and aerobically incubated for 24 h at 37 °C, after which they were collected and suspended in sterile saline [0.85% NaCl (w/v)] until an absorbance of 0.080 to 0.100, at 625 nm, representing approximately 1 × 10⁸ CFU/mL. This bacterium solution was used for the following procedures.
2.8.1. Agar Dilution
This method is recommended by the NCCLS [
23] with some adaptations from Maia-Araújo
et al. [
24]. Approximately 1 × 10
8 CFU was inoculated
per spot for each microorganism followed by 60 μL of extract with a concentration of phenolic compounds between 5 and 10 mg/mL. The plates were incubated for 24 h at 37 °C in ambient conditions. A 15% DMSO solution (v/v) was used as a control. All experiments were performed in triplicate.
2.8.2. MIC through Microdilution Method
Minimum inhibitory concentrations (MICs) were measured through microdilution of the Mueller–Hinton broth following the recommendations of the NCCLS [
25] and Ostrosky
et al. [
26]. Each extract was diluted to 6.25 to 800 μg/mL by dispensing 16 μL of extract into each of the 96 wells of a standard microtiter tray containing 179 μL of Mueller-Hinton broth followed by 2-fold dilutions. The standardized inoculum (5 μL) was added to give a final concentration of 5 × 10
5 CFU/mL, reaching a final volume of 100 μL in each well. As a positive control, 95 μL and 5 μL of bacteria inoculums were added to a well. After ambient incubation at 37 °C for 24 h, MIC was recorded as the lowest concentration of extract inhibiting visible growth compared to the control.
2.9. Statistical Analysis
Means and standard deviations (SDs) were obtained for all experiments. Results were analyzed using a one-way analysis of variance (ANOVA) using a beta version of ASSISTAT software version 7.8 (2012) (Federal University of Campina Grande City, Campina Grande, Brazil) in order to assess the differences between the types of extracts. When statistically significant differences were found (p < 0.05), Tukey tests were performed.
3. Results and Discussion
Phenolic compounds are molecules widespread in the plant kingdom. These compounds are produced in the secondary metabolism of fruits, herbs, and vegetables [
14]. Several studies have indicated beneficial health effects of increasing consumption of these foods. In plants, they can contribute to growth, reproduction, and pigmentation, whereas in foods, they are responsible for maintaining oxidative stability [
14]. They also exert influence on flavor and astringency [
27]. In the pharmacological or food industries, the discovery or even description of new sources of bioactive compounds are always welcome, principally in view of replacing synthetic compounds or overcoming pharmaceutical dilemmas, such as the resistance of some microorganisms to antibiotics. In this context, the rationale of our experiment is to screen and describe the antioxidant activities of various extracts of
Euphorbia tirucalli L., as such information is not currently reported in the literature. The use of dry and fresh aerial parts of
Euphorbia tirucalli L., and solvents of different polarities such as water, methanol, and acetone, target extraction of compounds from different compartments in the plant.
3.1. Determination of Total Phenolics
Table 1 shows that the total phenolic content found in the extracts of
Euphorbia tirucalli L. was 7.7 and 30.5 mg GAE/100 g sample and 9.4 and 27.6 mg GAE/100 g sample for FAE and DAE, and FHE and DHE, respectively. Higher phenolic concentrations were found in dry extracts as compared to fresh ones (
p < 0.05).
Table 1.
Total phenolic content present in different extracts of aerial part of Euphorbia tirucalli L., reported in gallic acid equivalents (GAE).
Table 1.
Total phenolic content present in different extracts of aerial part of Euphorbia tirucalli L., reported in gallic acid equivalents (GAE).
| Samples | Total Phenolics (mg GAE/100 g Sample) * |
|---|
| Dry acetonic extract | 30.54 ± 0.64 a |
| Fresh acetonic extract | 7.73 ± 1.21 b |
| Dry hydromethanolic extract | 27.6 ± 2.34 a |
| Fresh hydromethanolic extract | 9.47 ± 0.65 b |
3.2. Evaluation of Antioxidant Activity: DPPH• Method
Table 2 shows that all extracts exhibited significantly higher antioxidant activity than the control, catechin (10.78 μg/mL) (
p < 0.05), but dry extracts (DAE and DHE) showed lower EC
50 values, 13.95 μg/mL and 12.15 μg/mL, respectively.
Table 2.
Percentage of Radical Scavenging Activity (% RSA), and EC50 of different extracts of aerial part of Euphorbia tirucalli L., determined by DPPH method.
Table 2.
Percentage of Radical Scavenging Activity (% RSA), and EC50 of different extracts of aerial part of Euphorbia tirucalli L., determined by DPPH method.
| Samples | Concentrations % RSA |
|---|
| 2.5 μg/mL | 5.0 μg/mL | 10 μg/mL | 20 μg/mL | 40 μg/mL | EC50 (μg/mL) |
|---|
| DAE | 11.42 ± 2.38 | 25.65 ± 2.99 | 58.57 ± 5.02 | 83.53 ± 1.81 | 85.03 ± 1.15 | 13.95 ± 0.33 a,b |
| FAE | 13.93 ± 5.99 | 19.38 ± 5.91 | 38.11 ± 8.14 | 77.08 ± 0.84 | 96.23 ± 3.50 | 15.91 ± 1.86 a,c |
| DHE | 20.42 ± 0.9 | 24.93 ± 0.89 | 55.81 ± 0.60 | 87.64 ± 0.68 | 95.13 ± 0.13 | 12.15 ± 0.09 b,d |
| FHE | 9.06 ± 2.27 | 17.74 ± 2.66 | 43.49 ± 3.13 | 74.05 ± 2.60 | 94.14 ± 1.69 | 16.51 ± 0.53 c |
| Catechin | 19.9 ± 2.83 | 32.74 ± 1.44 | 60.11 ± 5.57 | 88.90 ± 1.30 | 91.90 ± 0.16 | 10.78 ± 0.57 d |
In general, the best results in terms of either the phenolic content or antioxidant activity were obtained from dry plant extracts. The effects of drying fresh herbs (more specifically rosemary, oregano, sage, marjoram, basil, and thyme) before extraction of their constituents [
28] have been well recognized and reported in the literature. Fawole
et al. [
29] analyzed different medicinal plants from South Africa, in which all tested methanolic extracts showed EC
50 values ranging from 5.0 μg/mL to 10.0 μg/mL. In comparison,
Euphorbia tirucalli L. showed slightly less antioxidant activity. Another study, performed by Akinmoladun
et al. [
30] used medicinal plants from Nigerian Indigenous. The reported RSA was 21.0% to 88.0%, but in that case, an extract concentration of 300 μg/mL was used. The extract from
Euphorbia tirucalli L. demonstrated an RSA above 85.0% using a maximum concentration of 40 μg/mL. These results confirm that
Euphorbia tirucalli L. has high antioxidant potential. Melo
et al. [
31] analyzed other Euphorbiaceae species, such as
Croton blanchetianus Baill and
Jatropha mollissima (Pohl) Baill, finding an IC
50 of 94.0 and 55.0 μg/mL, respectively. These values are comparable to results found for
Euphorbia tirucalli L.
3.3. Evaluation of Antioxidant Activity: ABTS•+ Method
Table 3 shows the antioxidant activity evaluated by the ABTS
•+ method. Again, dry extracts showed higher antioxidant activity. After 30 min, dry extracts showed Trolox Equivalent Antioxidant Capacity (TEAC) values of 716 and 718 μM Trolox/g sample for DAE and DHE, respectively. The reaction was saturated after 10 and 20 min for FHE and FAE, respectively.
As no previous studies have reported the specific antioxidant activity of other species of
Euphorbia sp., and taking into consideration results of antioxidant activities found in other medicinal plants, the results found in this study show a strong antioxidant potential in this plant family, particularly if first dried. Gulati
et al. [
32] evaluated the antioxidant activity by ABTS
•+ methodology in twelve medicinal plant extracts, including some from Euphorbiaceae, and found maximum TEAC values of 374 μg/mL for ethanolic extracts, using ascorbic acids and BHT as controls. In
Euphorbia tirucalli L., extracts of dried samples exhibited TEAC values above 500 μg/mL after only 2 min of reaction, proving high antioxidant potential. One fact that must be considered from
Table 3 is that after two minutes of reaction, all extracts continued neutralizing free radicals, consequently increasing TEAC values. Some authors prefer to analyze TEAC at 2 min while others prefer reaction times up to 60 min, explaining that antioxidants in the extracts continue to neutralize free radicals present in the solution [
33]. Song
et al. [
34] studied fifty-six Chinese medicinal plants and found TEAC values to vary widely according to the type of plant, however, an optimal correlation between total phenolic quantification and antioxidant activity was found, indicating that these molecules are responsible for that activity. With respect to
Euphorbia tirucalli L., it was found that higher phenolic content in the extracts coincided with higher antioxidant activity.
Table 3.
Antioxidant capacity by TEAC (Trolox Equivalent Antioxidant Capacity) of different extracts of aerial part of Euphorbia tirucalli L., using ABTS•+ method reported as μM TROLOX/g sample.
Table 3.
Antioxidant capacity by TEAC (Trolox Equivalent Antioxidant Capacity) of different extracts of aerial part of Euphorbia tirucalli L., using ABTS•+ method reported as μM TROLOX/g sample.
| Samples | TEAC Value—μM Trolox/g Sample |
|---|
| 2 min | 5 min | 10 min | 20 min | 30 min |
|---|
| DAE | 45,344 ± 8513 a,A | 54,566 ± 1,0333 a,A | 59,566 ± 12,662 a,A | 67,566 ± 15,377 a,A | 71,677 ± 17,160 a,A |
| FAE | 7002 ± 488 b,B | 10,085 ± 419 b,C | 11,336 ± 474 b,A | 11,766 ± 555 b,A | 11,891 ± 300 b,A |
| DHE | 52,008 ± 1892 a,C | 60,344 ± 4525 a,A,C | 64,010 ± 6185 a,A,C | 68,788 ± 7395 a,A | 71,899 ± 7688 b,A |
| FHE | 7502 ± 801 b,C | 9307 ± 577 b,A,C | 10,224 ± 416b,A | 10,363 ± 947 b,A | 10,447 ± 1748 a,A |
3.4. Evaluation of Antioxidant Activity: Rancimat Method
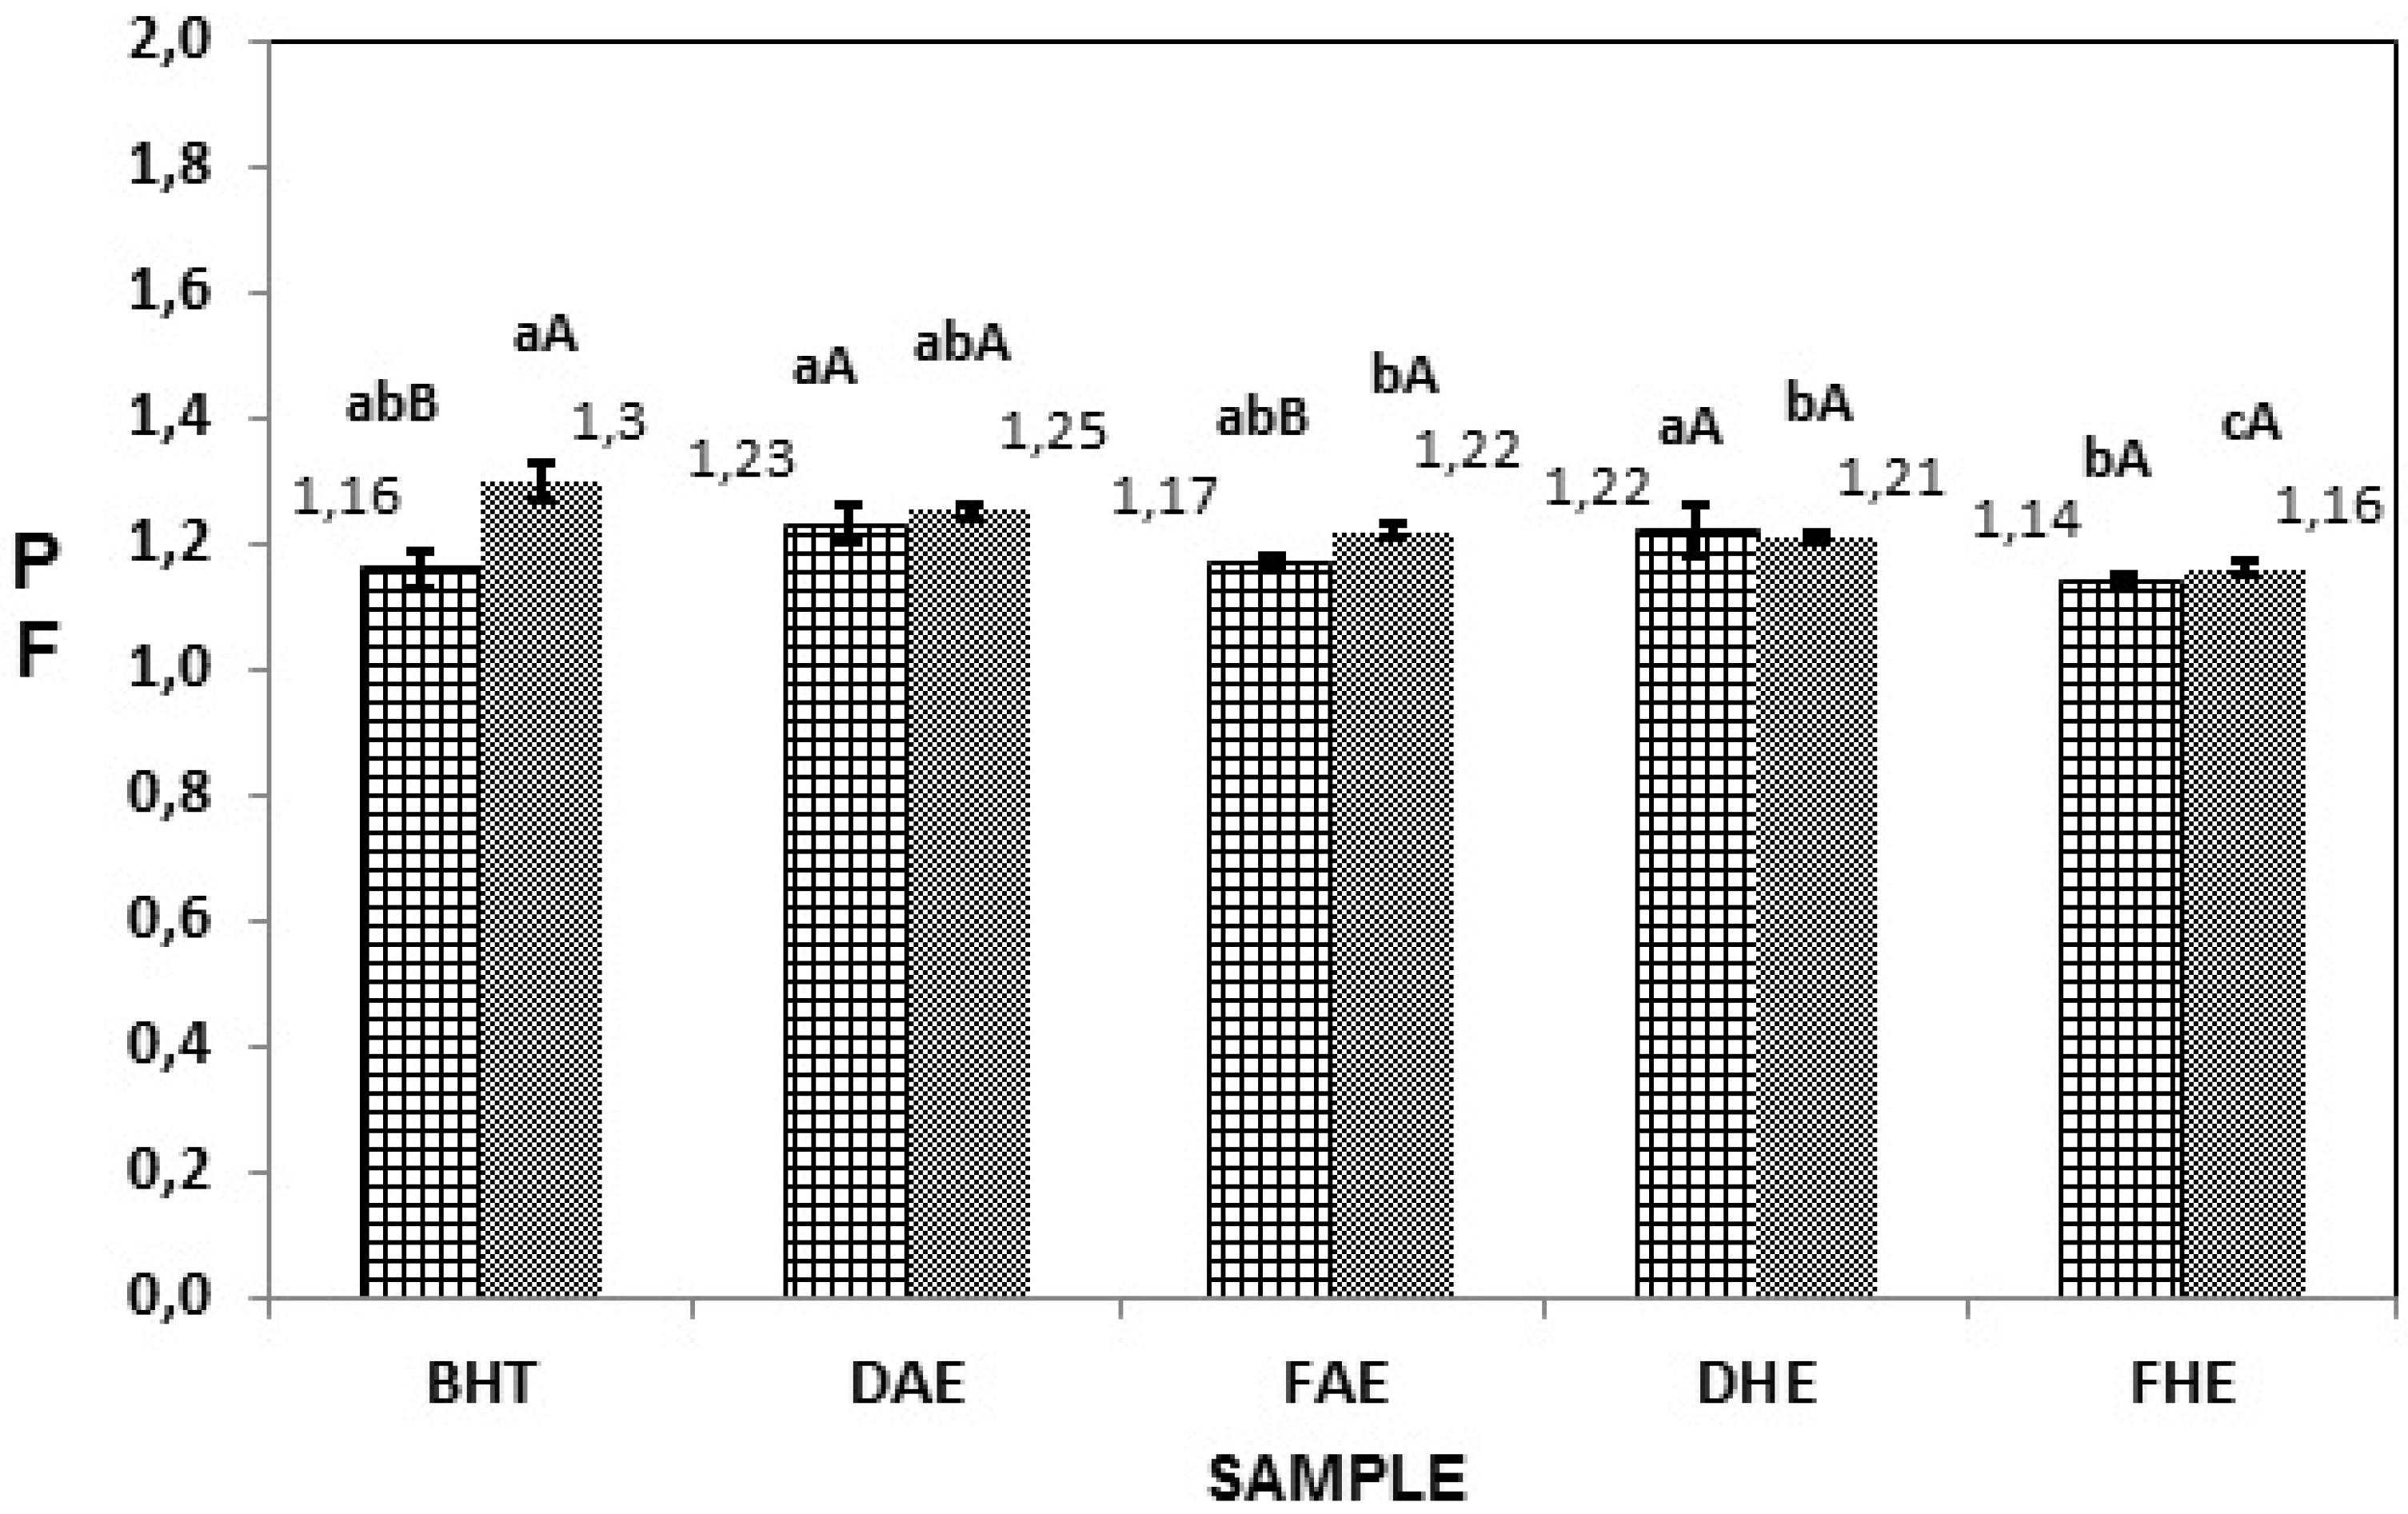
This methodology verified that soybean oil without antioxidant, used as control, oxidized after an IP of 6.4 h. As extracts having antioxidant capacities or synthetic antioxidants are added to soybean oil, the IP rises, and the PF, calculated from difference between synthetic and tested antioxidants, rises above 1.0. Extracts in different concentrations (0.01% and 0.02%), were tested and shown to be effective. See
Figure 2. The highest PF values were found in DAE, at 1.23 and 1.25 for concentrations of 0.01% and 0.02%, respectively. The order of stability obtained as a result of the addition of the extracts at 0.01% was BHT > DAE > DHE > FAE > FHE, while at 0.02%, it was BHT > DAE > FAE > DHE > FHE.
Confirming the results of DPPH
• and ABTS
•+ methodologies, the antioxidant potential of extracts from
Euphorbia tirucalli L. were found to be high when tested in an oil matrix, representing an industrial approach. Very common in the food industry is the use of synthetic antioxidants such as BHT, BHA, or TBHQ in edible vegetable oils, in order to extend shelf life [
27]. Such antioxidants help protect them against oxidation. On the other hand, studies have demonstrated possible undesirable health effects of these synthetic additives [
35,
36]. For this reason, consumers have given preference to natural additives in foods [
37]. This shows the importance of continuously seeking other sources of antioxidants, particularly from natural sources. A test commonly used in the food industry is the Rancimat
® method.
Figure 2.
Protection factor (PF) of different extracts of aerial part of
Euphorbia tirucalli L., in the concentration of (
![Antioxidants 03 00159 i001]()
) 0.01% (
![Antioxidants 03 00159 i002]()
) 0.02% using Rancimat method sample. Mean values (
n = 3, error bars represent standard deviation). BHT: Synthetic Antioxidant Control; FHE: Hydromethanolic fresh extract; DHE: Hydromethanolic dry extract; FAE: Acetonic fresh extract; DAE: Acetonic dry extract. Different capital letters (A–C) differ significantly among the concentrations tested within the same extract (
p < 0.05); different small letters (a, b) mean significant differences among extracts (
p < 0.05).
Beddows
et al. [
38] performed the Rancimat
® method on different herbs and spices, finding maximum Pf values of 1.81 using a concentration of 0.2% of thyme. No extracts of
Euphorbia tirucalli L. obtained PF values higher than BHT (1.16 and 1.30 for concentrations of 0.01% and 0.02%, respectively), but taking into consideration that BHT is a synthetic antioxidant with recognizable antioxidant capacity, extracts with Pf values nearing that of BHT must be considered good protection against oxidation.
3.5. Identification and Quantification of Phenolic Compounds Using HPLC
Figure 3 shows the HPLC chromatogram of the standard phenolic acids used for the identification of the compounds in the extracts. Ten standard phenolics were analyzed to determine their retention times under the same conditions as that of the extracts.
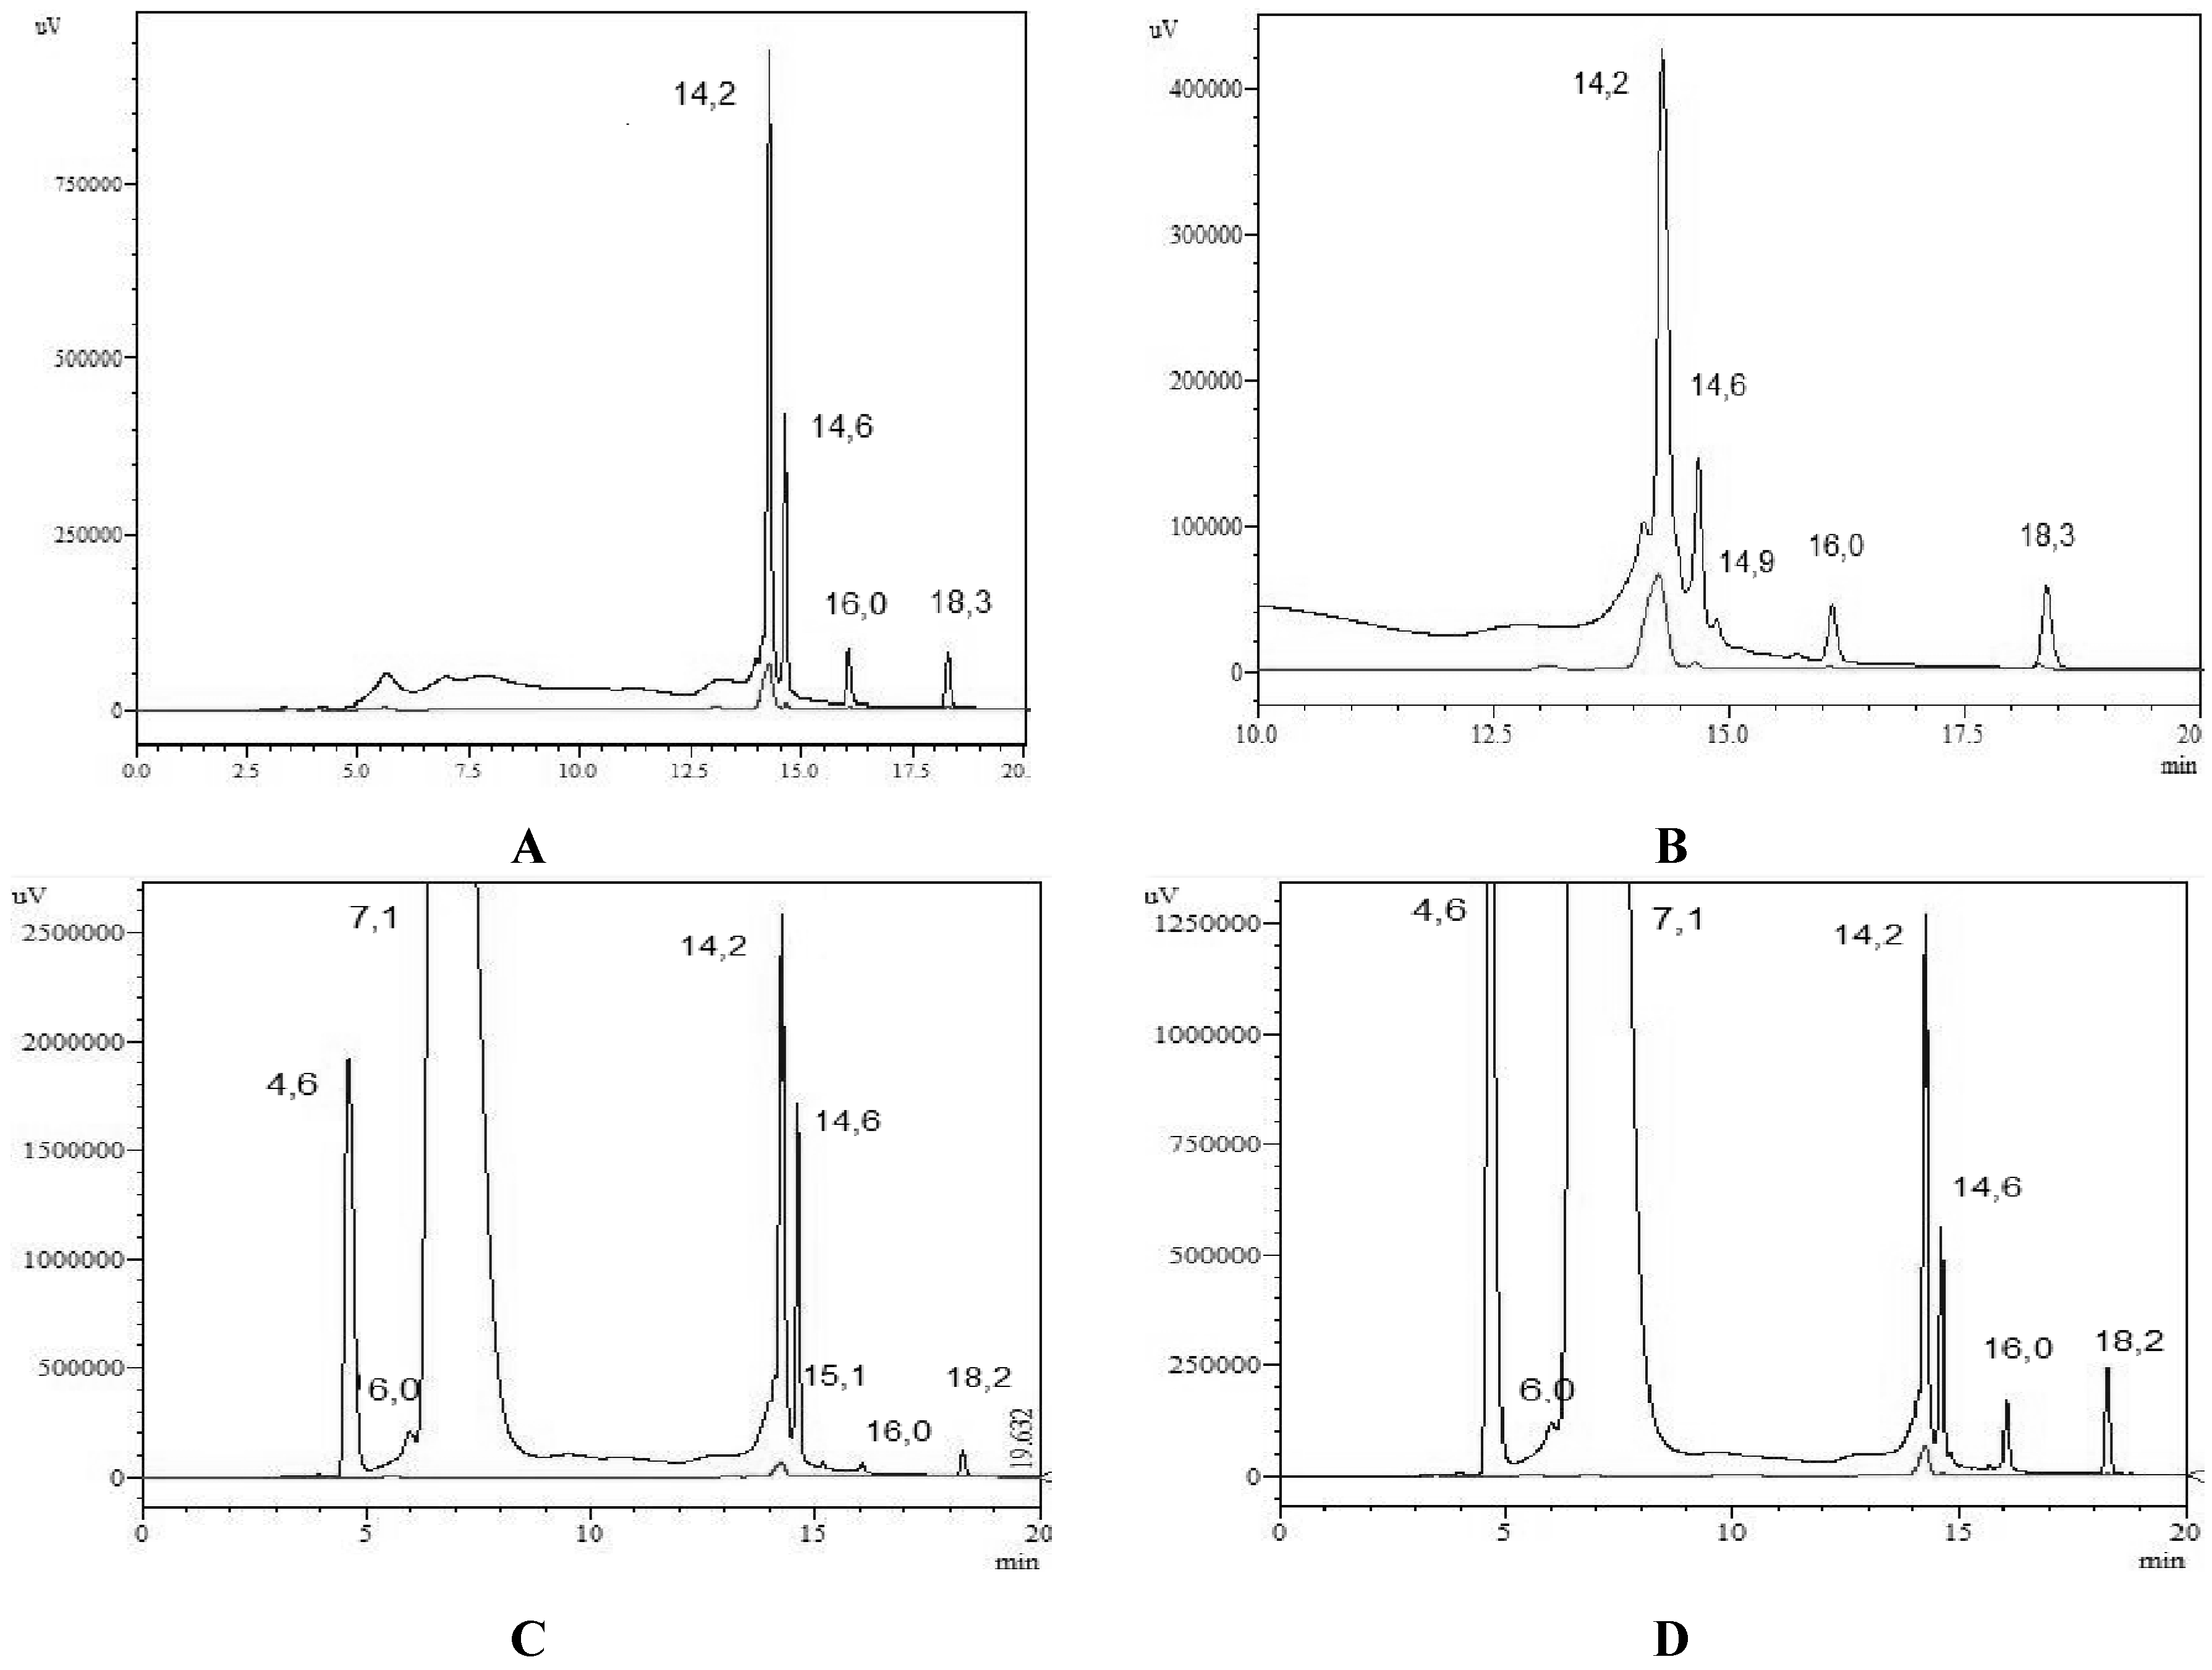
Under these analytical conditions, ferulic acid was the only phenolic acid identified, with a standard retention time of 14.2 min. Its peak coincided with the more abundant peak in extracts from
Euphorbia tirucalli L. Chromatographic peaks of dry extracts were more prominent (mAU) than those of fresh extracts, confirming previous results obtained by DPPH, ABTS, and Rancimat
® methods. Comparative chromatograms of the extracts and the standards are presented in
Figure 4A–D.
Figure 3.
Schematization of the HPLC chromatogram showing the ten standard phenolic acids and their respective retention times used for identification of these compounds in the extracts.
Figure 3.
Schematization of the HPLC chromatogram showing the ten standard phenolic acids and their respective retention times used for identification of these compounds in the extracts.
Figure 4.
Identification of phenolic compounds by comparison of the BPC (base peak chromatogram) of standard phenolics and different extracts of aerial part of Euphorbia tirucalli L., resolved by HPLC system. (A) DHE: Hydromethanolic dry extract; (B) FHE: Hydromethanolic fresh extract; (C) DAE: Acetonic dry extract; (D) FAE: Acetonic fresh extract. (Superior line) Extract; (Baseline) Standard ferulic acid.
The concentration of the principal phenolic compound found in
Euphorbia tirucalli L. was calculated using a calibration curve obtained from standard ferulic acid (
Table 4).
Table 4.
Quantification of ferulic acid in different extracts from aerial part of Euphorbia tirucalli L., by high-performance liquid chromatography (HPLC) expressed in g/100 g sample.
Table 4.
Quantification of ferulic acid in different extracts from aerial part of Euphorbia tirucalli L., by high-performance liquid chromatography (HPLC) expressed in g/100 g sample.
| Samples | Ferulic Acid (g/100 g Sample) * |
|---|
| Dry acetonic extract | 0.40 ± 0.014 a |
| Fresh acetonic extract | 0.12 ± 0.000 b |
| Dry hydromethanolic extract | 0.59 ± 0.028 c |
| Fresh hydromethanolic extract | 0.08 ± 0.007 b |
To identify phenolic compounds present in different extracts from
Euphorbia tirucalli L., the HPLC/UV-Vis method was adapted from other methodologies found in the literature, where some changes in the elution gradient was used. Phenolic acids contained in the extracts of
Euphorbia tirucalli L. were identified by comparing retention times to those of standard phenolics. According to Broinizi
et al. [
39], ferulic acid is a strong free-radical scavenger, even in low concentrations. This statement reinforces the assumed relationship between antioxidant activities described in
Euphorbia tirucalli L. and the presence of this phenolic compound in all the analyzed extracts. As stated before, phenolic acids are divided into two groups: derivatives of hydroxybenzoic acid and those of hydroxycinnamic acid. These molecules are characterized by a benzene ring, a grouping containing one or more carboxylic groups, and a hydroxyl/methoxyl group, which explains the fact that vegetables are strongly associated with antioxidant activity. The ferulic acid belongs to the hydroxycinnamic acid group, which consists of aromatic compounds with three carbon atoms on the side chain. These molecules are more active as antioxidants because they have a double bond in their structure, providing stability for the free radical [
14]. Our results are in agreement with studies performed by Ranilla
et al. [
40] which identified in
Chancapiedra, a plant of family Euphorbiaceae, large quantities of hydroxycinnamic acid (2.9 mg/g sample). In another study performed by Nazemiyeh
et al. [
41], hydroxycinnamic acid was identified in extracts of
Euphorbia petiolata.
3.6. Antibacterial Assay
Table 5 shows the antibacterial activities of the extracts, expressed in size of inhibition zone of bacterial growth. None of the gram-negative bacteria were sensitive to any of the tested extracts; however the gram-positive
S. aureus and
S. epidermidis were susceptible. At a concentration of 10 mg/mL,
S. epidermidis was susceptible in an inhibition zone of 12.8 to 16.0 mm while
S. aureus was susceptible in an inhibition zone of 13.2 to 13.7 mm. At a concentration of 5 mg/mL, none of the tested strains were sensitive.
Table 5.
Antibacterial activity of different extracts of aerial part of Euphorbia tirucalli L., against pathogenic microorganism strains.
Table 5.
Antibacterial activity of different extracts of aerial part of Euphorbia tirucalli L., against pathogenic microorganism strains.
| Samples | Extract (10 mg/mL) * |
|---|
| FAE | DAE | FHE | DHE |
|---|
| S. epidermidis | 15.2 ± 0.17 | 16.0 ± 0.70 | 12.8 ± 0.17 | 14.0 ± 0.70 |
| S. aureus | 13.7 ± 0.55 | 13.4 ± 0.28 | 13.2 ± 0.50 | 13.4 ± 0.26 |
| E. faecalis | - | - | - | - |
| E. coli | - | - | - | - |
| P. aeruginosa | - | - | - | - |
S. aureus was most affected by FAE, which produced a larger inhibition zone, whereas S. epidermidis was most affected by DAE. The MIC was measurable only with respect to S. epidermidis. FAE, DAE, and DHE exhibited a MIC of 200 μg/mL while FHE measured 400 μg/mL MIC. All other strains showed no sensitivity to any of the extracts used.
The resistance of pathogens to human and animal drugs is a problem affecting both developed and developing countries. The indiscriminate and uncontrolled use of antibiotics has generated strains of multi-resistant bacteria, causing serious public health problems. This has stemmed increasing research focused on finding new antimicrobial substances [
42]. Most plants produce secondary metabolites for self-defense against bacteria, viruses, and parasites. These metabolites have been associated with beneficial medicinal and health effects. Currently, there are many studies exploring plant extracts in order to find those with the best antibacterial activities. For instance, Upadhyay
et al. [
43] analyzed the action of methanolic extracts of leaves and stem bark of
Euphorbia tirucalli L. on different bacterial strains at concentrations of 2.5, 5, and 7.5 mg/mL showing that strains of
S. aureus,
P. aeruginosa, and
E. coli were sensitive to the effects of the tested extracts. These results coincide with those presented here, specifically with those found for
S. aureus. Upadhyay
et al. [
43] also reported that gram-negative bacteria are more resistant to the actions of the extracts, explaining that this is possibly due to outer membrane lipopolysaccharide (LPS) structures, which hinder toxic and antimicrobial effects. Vale and Orlanda [
44] also evaluated the antibacterial activity of fresh and dry ethanolic extracts from aerial parts of
Euphorbia tirucalli L. at 0.09 mg/mL, showing that dry extracts have no inhibition on bacterial growth, with the exception of
Vibrio parahaemolyticus. Fresh extracts showed antimicrobial activity against
Salmonella typhi,
S. aureus,
Vibrio parahaemolyticus,
Citrobacter freundii, and
Serratia odorífera, whereas
Escherichia coli and
Pseudomonas aeruginosa were less susceptible.
Phenolic compounds and polyphenols in plants are toxic products to pathogenic microorganisms, insects, and herbivores. In general, this toxicity is correlated to the position and number of hydroxyl groups in the molecule [
45]. The antimicrobial activity found in this study can be attributed to the large quantity of ferulic acids as active constituents in
Euphorbia tirucalli L., as identified by HPLC.


 ,
, 


 ) 0.01% (
  ) 0.02% using Rancimat method sample. Mean values (n = 3, error bars represent standard deviation). BHT: Synthetic Antioxidant Control; FHE: Hydromethanolic fresh extract; DHE: Hydromethanolic dry extract; FAE: Acetonic fresh extract; DAE: Acetonic dry extract. Different capital letters (A–C) differ significantly among the concentrations tested within the same extract (p < 0.05); different small letters (a, b) mean significant differences among extracts (p < 0.05).


