Fluctuations in Serum Chloride and Acute Kidney Injury among Critically Ill Patients: A Retrospective Association Study

1
Department of Anesthesiology and Pain Medicine, Seoul National University Bundang Hospital, Seoul 13620, Korea
2
Department of Emergency Medicine, Seoul National University Bundang Hospital, Seoul 13620, Korea
*
Author to whom correspondence should be addressed.
J. Clin. Med. 2019, 8(4), 447; https://doi.org/10.3390/jcm8040447
Submission received: 3 March 2019
/
Revised: 25 March 2019
/
Accepted: 1 April 2019
/
Published: 2 April 2019
(This article belongs to the Special Issue Diagnostics, Risk Factors, Treatment and Outcomes of Acute Kidney Injury in a New Paradigm)
Abstract
:Exposure to dyschloremia among critically ill patients is associated with an increased risk of acute kidney injury (AKI). We aimed to investigate how fluctuations in serum chloride (Cl−) are associated with the development of AKI in critically ill patients. We retrospectively analyzed medical records of adult patients admitted to the intensive care unit (ICU) between January 2012 and December 2017. Positive and negative fluctuations in Cl− were defined as the difference between the baseline Cl- and maximum Cl- levels and the difference between the baseline Cl− and minimum Cl− levels measured within 72 h after ICU admission, respectively. In total, 19,707 patients were included. The odds of developing AKI increased 1.06-fold for every 1 mmol L−1 increase in the positive fluctuations in Cl− (odds ratio: 1.06; 95% confidence interval: 1.04 to 1.08; p < 0.001) and 1.04-fold for every 1 mmol L−1 increase in the negative fluctuations in Cl− (odds ratio: 1.04; 95% confidence interval: 1.02 to 1.06; p < 0.001). Increases in both the positive and negative fluctuations in Cl- after ICU admission were associated with an increased risk of AKI. Furthermore, these associations differed based on the functional status of the kidneys at ICU admission or postoperative ICU admission.
1. Introduction
Acute kidney injury (AKI) is defined as an impairment of renal function [1], and is reported to occur in 2–18% of all inpatients, and 35.7–57% of all critically ill patients [2,3,4,5]. AKI that affects patients in intensive care units (ICUs) not only increases the duration of hospitalization and medical costs [6], but also increases in-hospital mortality [7]. Therefore, adequate prevention of AKI in ICUs is an important challenge in ICU patient management [8].
Serum chloride (Cl−) is the most common anion in the human body. Dyschloremia is a collective term for hypochloremia, in which the Cl− level is below the normal range, and hyperchloremia, in which the Cl− level is above the normal range [9]. Increased Cl− levels induce hyperchloremic metabolic acidosis through physiologic compensation, whereas decreased Cl− levels induce hypochloremic metabolic alkalosis. Both conditions are associated with increased risks of AKI [10,11]. It is important to understand the association between dyschloremia and AKI in the ICU because the Cl− level can provide important information in the planning of a fluid management strategy [12].
It is well known that increases in Cl− levels after ICU admission are associated with the development of AKI [13,14,15], while the association between a decrease in Cl− levels and the development of AKI has not been extensively studied. Critically ill patients may experience a reduction in Cl− levels after ICU admission due to the active loss of Cl− in the gastrointestinal tract, impaired renal Cl− reabsorption, hypotonic fluid infusion, excessive diuretics therapy, and malnutrition [16,17]. These conditions may be associated with the development of AKI. Thus, when studying the association between Cl− levels and the incidence of AKI among critically ill patients, fluctuations of Cl− levels (increases and decreases) must be considered.
Therefore, this study aimed to investigate the association between the total, positive, and negative fluctuations in Cl− levels and the incidence of AKI.
2. Materials and Methods
2.1. Study Design and Subjects
This retrospective observational study was approved by the Institutional Review Board (IRB) of Seoul National University Bundang Hospital (IRB approval number B-1806/474-105). The IRB exempted the need for informed consent, considering the retrospective study design. The medical records of adult patients aged ≥18 years admitted to the ICU between January 2012 and December 2017 were analyzed. For single patients admitted to the ICU twice or more during the study period, only the last ICU admission in which the patient could be in the most critical condition was included in the analysis. Patients whose medical records, regarding Cl− and creatinine, were incomplete or missing were excluded from the analysis. Patients with an estimated glomerular filtration rate (eGFR) <15 mL min−1 1.73 m−2, patients with end-stage renal disease (ESRD) who underwent chronic renal replacement therapy (RRT) before ICU admission, and patients with undiagnosed AKI before ICU admission were also excluded.
This study succeeds a previous study [18] that analyzed the medical records of patients in the surgical ICU at our institution from 2011 to 2016. The previous study reported that exposure to hyperchloremia in the postoperative period in the surgical ICU was not associated with the incidence of AKI. This study differs from the previous study that analyzed the positive or negative fluctuations in Cl− within 72 h after ICU admission; previous studies have analyzed the increases in the preoperative Cl− to the maximum Cl− in 0–3 days postoperatively.
2.2. Fluctuations in Cl- Levels (Independent Variables)
For the purpose of this study, the Cl- level on ICU admission (baseline Cl-) was defined as that measured within 24 h after ICU admission, and the Cl- level closest to the ICU admission time. Positive fluctuations in Cl- were defined as the difference between the baseline Cl- and the maximum Cl- levels measured within 72 h after ICU admission, while negative fluctuations in Cl- were defined as the difference between the baseline Cl- and the minimum Cl- levels measured within 72 h after ICU admission. Lastly, the total fluctuations in Cl- were defined as the difference between the minimum and maximum Cl- levels measured within 72 h after ICU admission. For example, if baseline Cl-, maximum Cl-, and minimum Cl- levels were 107 mmol L−1, 111 mmol L−1, and 105 mmol L−1, respectively, the total positive and negative fluctuations were 6 mmol L−1 (111–105 mmol L−1), 4 mmol L−1 (111–107 mmol L−1), and 2 mmol L−1 (107–105 mmol L−1), respectively. In situations where no maximum or minimum value of Cl- within 72 h after ICU admission was noted, the positive or negative fluctuation of Cl-, respectively, was considered as 0. In those cases, the total fluctuation was calculated using baseline Cl- level. For example, if baseline Cl-, maximum Cl-, and minimum Cl- levels were 105 mmol L−1, 111 mmol L−1, and 107 mmol L−1, respectively, the total, positive, and negative fluctuations were 6 mmol L−1 (111–105 mmol L−1), 6 mmol L−1 (111–105 mmol L−1), and 0 mmol L−1 (no minimum Cl- level), respectively.
2.3. Potential Covariates
Data regarding demographics (sex, age, and body mass index), Acute Physiology, Chronic Health Evaluation II, comorbidities at ICU admission (eGFR, mL min−1 1.73 m−2, hypertension, diabetes mellitus, history of ischemic heart disease and cerebrovascular disease, chronic obstructive lung disease, liver disease (liver cirrhosis, hepatitis, and fatty liver), anemia (hemoglobin <10 g dL−1), cancer status regarding hospital admission through the emergency department, postoperative admission status, and the admission department (internal medicine/neurologic center/postcardiothoracic surgery/post-other surgery) at the time of ICU admission were collected. Information regarding fluid administration (i.e., NaCl 0.9%, balanced crystalloid, and hydroxyethyl starch (all in mL)) for 72 h after ICU admission was collected. Additionally, the maximum value of the cystatin c level (mg dL−1) for 72 h after ICU admission was collected. Finally, the number of Cl- level measurements taken for 72 h after ICU admission were collected. The Modification of Diet in Renal Disease equation was used to calculate the eGFR before ICU admission [19]: eGFR (mL min−1 1.73 m−2) = 186 × (Creatinine)−1.154 × (Age)−0.203 × (0.742 if female).
2.4. Acute Kidney Injury within 72 h after ICU Admission (Dependent Variable)
The Kidney Disease: Improving Global Outcomes (KDIGO) criteria and grading method were used to diagnose AKI (Appendix A) [20]. Considering the differences in the duration of urinary catheterization among the patients, only the serum creatinine (mg dL−1) level was used to diagnose AKI. The serum creatinine value measured within 1 month before ICU admission closest to the time of ICU admission was used as the baseline creatinine concentration for AKI diagnosis. The serum creatinine level measured within 72 h after ICU admission was used to diagnose AKI.
2.5. Endpoint
This study investigated the associations between total, positive, and negative fluctuations in Cl- within 72 h after ICU admission and the total incidence of AKI and AKI stage ≥2. In addition, we investigated relationships between total, positive, and negative fluctuations in serum Cl− with the maximum serum cystatin C level for 72 h after ICU admission.
2.6. Statistical Analysis
The patients’ baseline characteristics were expressed as means and standard deviations (SDs) or numbers and proportions. The log odds of AKI occurrence and fluctuations in Cl− were presented as restricted cubic splines (RCSs). After confirming a linear relationship between the fluctuation in Cl− and log odds of developing AKI in RCSs, the fluctuation in Cl− was included in the logistic regression model as a continuous variable. A univariable logistic regression analysis was performed to investigate the association of each covariate with the incidence of the dependent variable (AKI). Covariates with p < 0.1 were selected from the univariable logistic regression model, and were controlled for in the final multivariable logistic regression analysis. In the multivariable logistic regression analysis, total fluctuations in Cl− were included in another multivariable logistic regression model with positive and negative fluctuations in Cl− to avoid multicollinearity within variables.
Next, considering that baseline kidney function is a major risk factor of AKI [21], the interaction between fluctuations in Cl− and eGFR and the incidence of AKI before ICU admission were investigated. After confirming that there was a significant interaction between fluctuations in Cl− and eGFR with the incidence of AKI, we performed a subgroup analysis with four eGFR groups (eGFR ≥90, <90, <60, and <30 mL min−1 1.73 m−2). Lastly, the interaction between fluctuations in Cl− and postoperative ICU admission for the incidence of AKI were investigated, and the significant interactions were also confirmed. Therefore, we performed a subgroup analysis based on postoperative ICU admission. To reduce type I errors due to multiple comparisons in the subgroup analysis, the Bonferroni correction was used [22]. The same method was used in the analysis of stage ≥2 as a dependent variable. The results of the logistic regression analysis were expressed as odds ratios (ORs) and 95% confidence intervals (CIs). Additionally, considering that the serum cystatin C was a marker of renal function in the detection of early AKI [23], we performed a generalized linear regression analysis to investigate the association between fluctuation in serum Cl− and the maximum serum cystatin C level for 72 h after ICU admission. In this generalized linear model (GLM), gamma distribution and the log link function were assumed for the dependent variable (maximum cystatin C level within 72 h after ICU admission). All covariates were included in the GLM. The results of GLM were expressed as the exponentiated (exp) regression coefficient (coef) with 95% CIs. All analyses were performed using SPSS version 24.0 (IBM Corp., Armonk, NY) and R program (version 3.5.2 with R packages), with the level of statistical significance set at p < 0.05.
3. Results
There was a total of 40,533 ICU admissions between 2012 and 2017. Of these, 10,135 admission cases in which a single patient was admitted twice or more were excluded. Next, 5440 patients younger than 17 years, 44 ESRD patients who received RRT before ICU admission, 4730 patients with incomplete medical records regarding serum Cl- or creatinine levels, and 477 patients with undiagnosed AKI before admission were excluded, and the remaining 19,707 patients were finally included. There was a total of 5284 (26.8%) AKI cases within 72 h after ICU admission; 2233 (11.4%) patients had AKI stage ≥2 (Figure 1). Table 1 shows the baseline characteristics of these patients. The mean (SD) values of the total, positive, and negative fluctuations in Cl- were 7.0 (5.7), 4.4 (4.1), and 2.9 (4.6), respectively.
3.1. AKI within 72 h after ICU Admission Based on Cl- Fluctuations
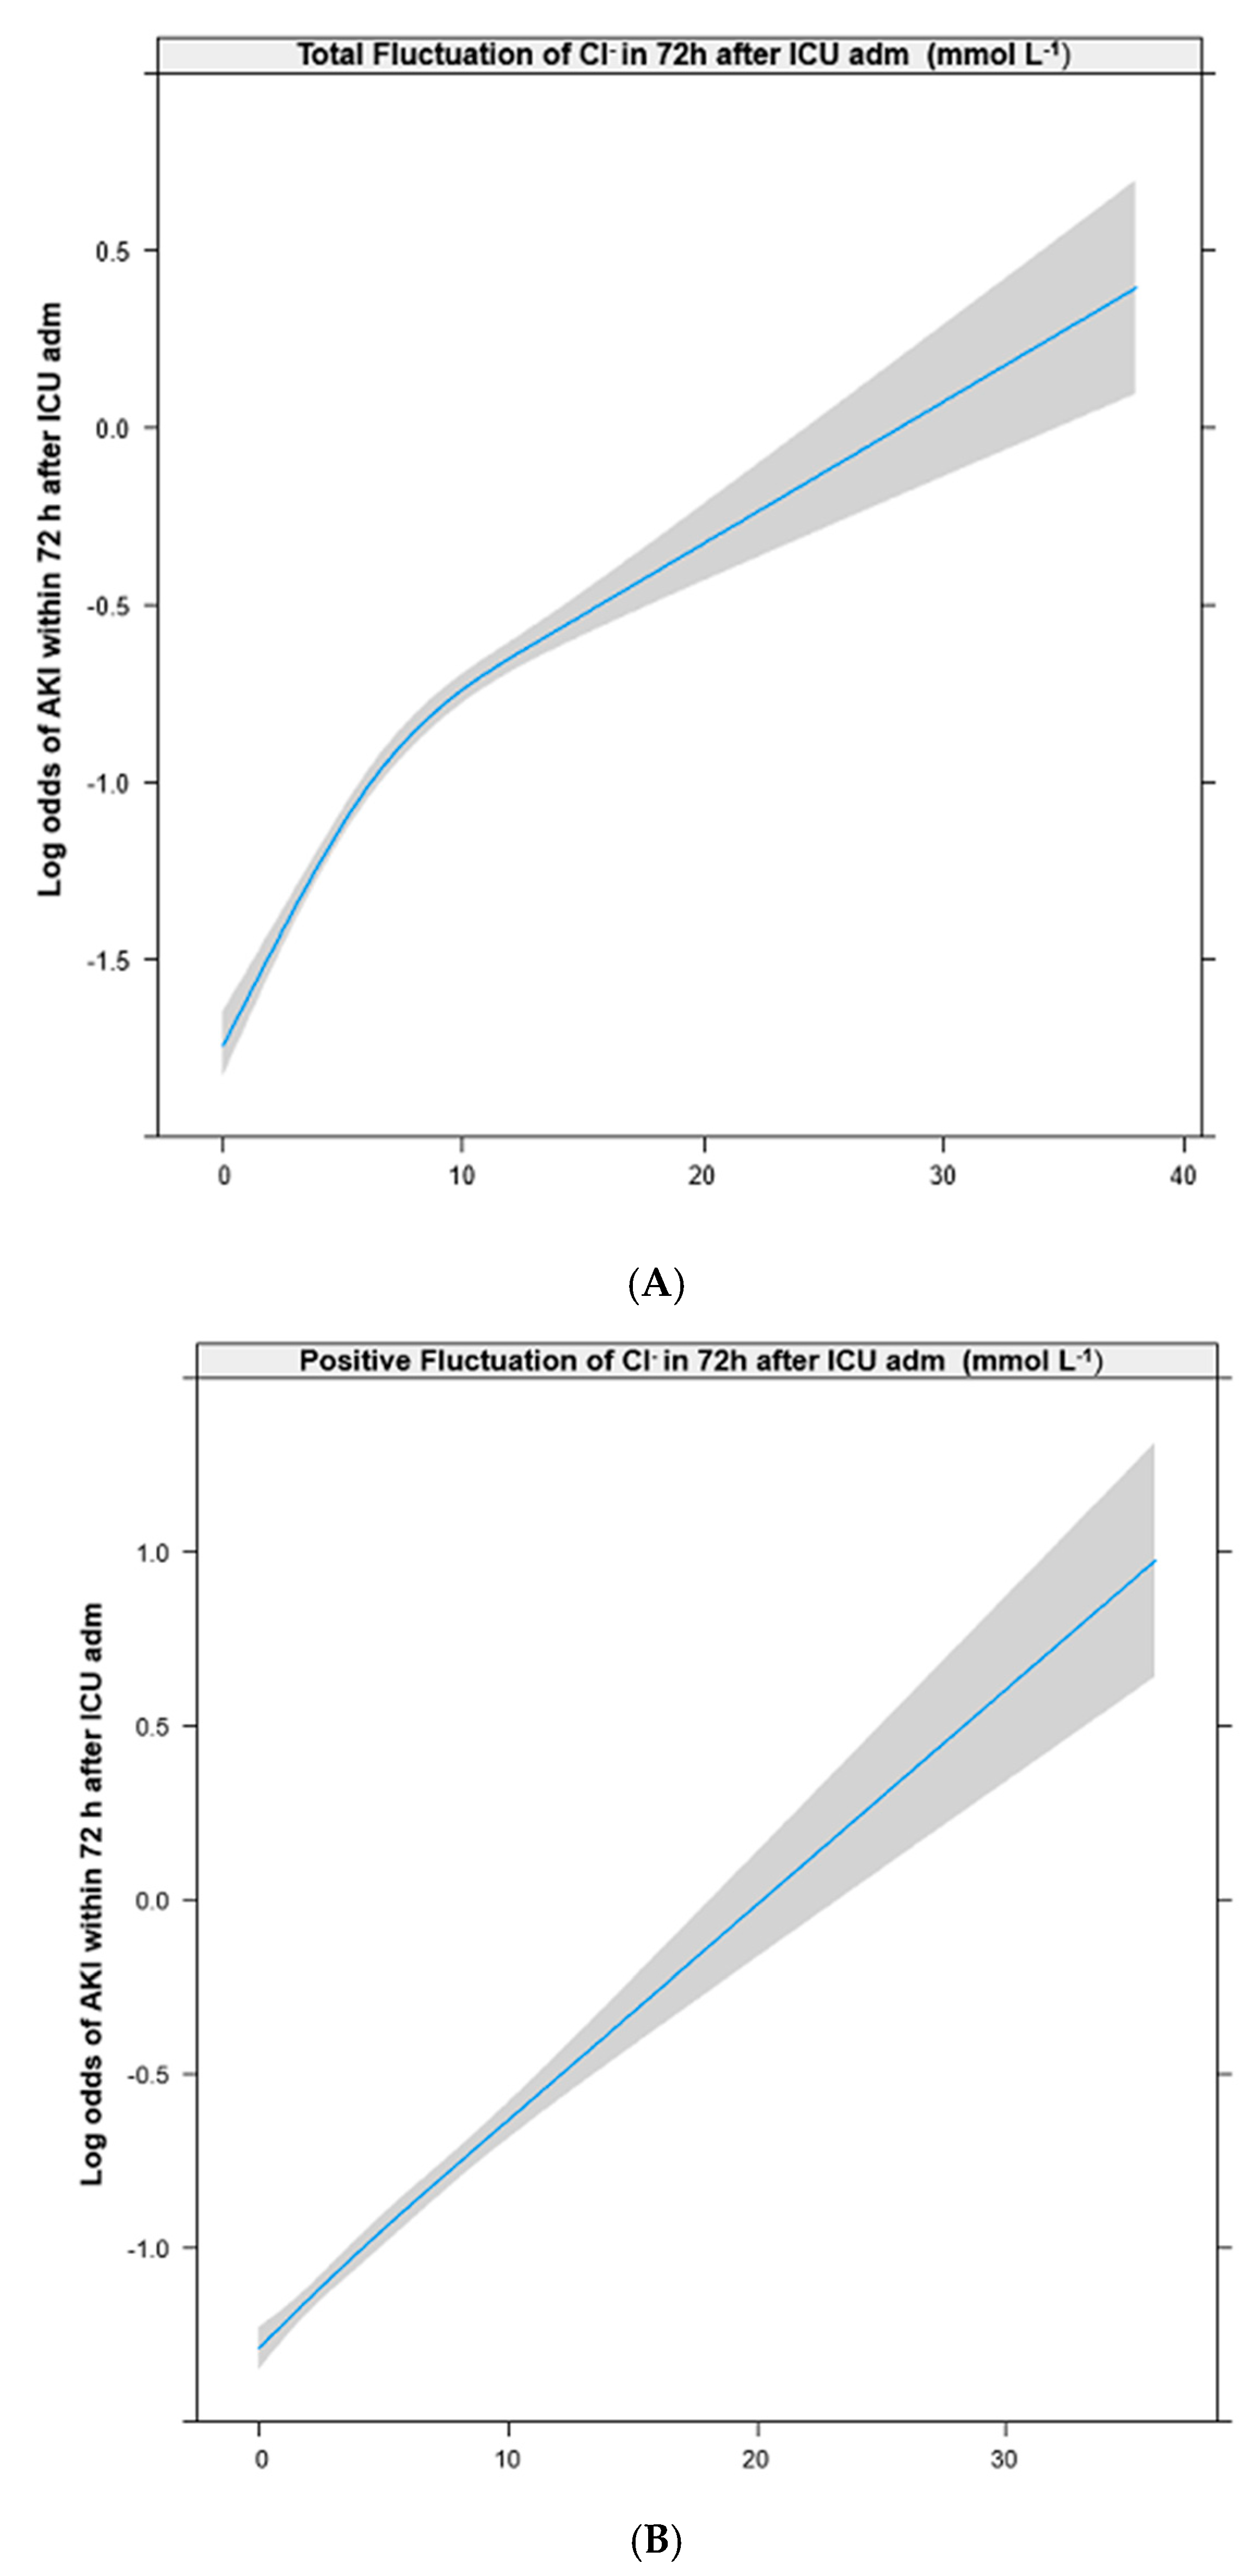
The RCSs in Figure 2 show that the log odds of developing AKI had positive and linear relationships with total (A), positive (B), and negative fluctuations (C) in Cl− levels. Appendix B shows the results of the univariable logistic regression analysis of the associations between the individual covariates and AKI. Table 2 shows the results of the multivariable logistic regression analysis adjusted for the covariates selected from the univariable logistic regression analysis. The odds of developing AKI increased 1.05-fold for every 1 mmol L−1 increase in the total fluctuations in Cl− (OR: 1.05; 95% CI: 1.03 to 1.06; p < 0.001), 1.06-fold for every 1 mmol L−1 increase in the positive fluctuations in Cl− (OR: 1.06; 95% CI: 1.04 to 1.08; p < 0.001), and 1.04-fold for every 1 mmol L−1 increase in the negative fluctuations in Cl− (OR: 1.04; 95% CI: 1.02 to 1.06; p < 0.001). The results of the subgroup analysis for total AKI based on the preadmission eGFR status and the postoperative ICU admission status are shown in Table 3 and Table 4, respectively.
3.2. AKI Stage ≥2 within 72 h after ICU Admission According to Cl− Fluctuation
Appendix B shows the results of the univariable logistic regression analysis of the associations between the individual covariates and AKI stage ≥2. Table 2 shows the results of the multivariable logistic regression analysis adjusted for the covariates selected from the univariable logistic regression analysis. The odds of developing stage ≥2 AKI increased 1.08-fold for every 1 mmol L−1 increase in the total fluctuations in Cl− (OR: 1.08; 95% CI: 1.06 to 1.10; p < 0.001), 1.09-fold for every 1 mmol L−1 increase in the positive fluctuations in Cl− (OR: 1.09; 95% CI: 1.07 to 1.11; p < 0.001), and 1.09-fold for every 1 mmol L−1 increase in the negative fluctuations in Cl− (OR: 1.09; 95% CI: 1.06 to 1.11; p < 0.001). The results of the subgroup analysis for AKI stage ≥2 according to preadmission eGFR grouping and postoperative ICU admission status are shown in Table 3 and Table 4, respectively.
3.3. Fluctuation in Cl− and Maximum Serum Cystatin Level during the 72 h after ICU Admission
Serum cystatin C was measured in the 2021 patients at least once within 72 h after ICU admission. In these patients, generalized linear regression analysis was performed, and the results of the GLM are presented in Table 5. A 1 mmol L−1 increase in the negative fluctuation in Cl− was associated with a 1.4% increase of maximum cystatin C level (exp coef: 0.014, 95% CI: 0.002 to 0.026; p = 0.026), while total fluctuation of Cl− (p = 0.374) and positive fluctuation of Cl− (0.682) were not associated with the maximum cystatin C level.
4. Discussion
This study showed that both positive and negative fluctuations in Cl− within 72 h after ICU admission were significantly associated with the potential risk of AKI in a mixed ICU adult population. This association was also observed for AKI stage ≥2. In the subgroup analysis based on preadmission eGFR grouping, the association between positive fluctuations in Cl− and AKI was more evident in the eGFR ≥90 mL min−1 1.73 m−2 group, while the association between negative fluctuations in Cl− and AKI was more evident in the eGFR <90 or <60 mL min−1 1.73 m−2 group. Additionally, both positive and negative fluctuations in Cl− were associated with the risk of AKI in patients without postoperative ICU admission, while only positive fluctuations in Cl− were significantly associated with the risk of AKI in patients with postoperative admissions.
The most novel finding of this study is that we reported that the negative fluctuations in Cl− could also be associated with the risk of AKI in critically ill patients. While the association between positive fluctuations in Cl− and AKI were reported in previous studies [13,14,15], the association regarding the negative fluctuations has yet to be reported. While positive fluctuations in Cl− could be caused by fluid resuscitation [24], negative fluctuations in Cl− could be caused by a loss of active Cl− from the gastrointestinal tract, impaired renal Cl− reabsorption, and an infusion of hypotonic fluid [16,17], which might be related to AKI [25]. Additionally, hypochloremia might be caused by negative fluctuations in Cl−, which is a common and independent poor prognostic factor in critically ill patients [26]. Although our findings regarding positive fluctuations in CI− were consistent with those of a meta-analysis published in 2015 [27], there was another meta-analysis, published in 2018, which concluded that the relationship between the use of chloride-rich solution and AKI remains controversial [28]. Therefore, future studies should investigate the effect of positive or negative fluctuations in Cl− on AKI.
Another interesting finding was that the interactions related to AKI existed between the eGFR status at the time of ICU admission and total fluctuations in Cl−. The results of the subgroup analysis based on eGFR grouping showed that the positive fluctuations in Cl− tended to be more frequently associated with AKI in patients with normal kidney function (eGFR ≥90 mL min−1 1.73 m−2). In contrast, negative fluctuations in Cl− tended to be more frequently associated with AKI in patients with CKD (eGFR <90 or 60 mL min−1 1.73 m−2). There are several potential explanations for our findings. First, patients with normal kidney function at ICU admission might have received more chloride-rich fluid resuscitation than CKD patients; this might have impacted the positive fluctuations in Cl−. Secondly, since CKD patients often had disruptions in their acid–base balance [25], the negative fluctuations in Cl− might have had a greater impact on the patients with CKD. Lastly, the impact of both positive and negative fluctuations in Cl− was not significant in patients with CKD 4 or 5 (<30). There is a possibility that the fluctuations in Cl− were minimized by physicians for such severe CKD patients, thus impacting these results in patients with CKD 4 or 5.
The difference in the results regarding positive fluctuations in Cl− between this study and our previous study is also interesting [18]. In our previous study, we found that hyperchloremia (>110 mmol L−1) was not associated with postoperative AKI in the surgical ICU, and there was a positive association in the increase from the preoperative Cl− (which was measured within 1 month prior to surgery) to the maximum Cl− measured 0–3 days postoperatively in patients with a CKD stage ≥3. The differences between two studies might be caused by the study designs. Our previous study might have been affected by fluid resuscitation or blood loss during surgery, while the present study was not affected by these factors. In general, more fluid administration is required to replace ongoing bleeding or insensible loss of fluid during surgery [29], so that the impact of the Cl− load on AKI would be different from that in the ICU.
Although the serum cystatin C level was measured in only 2021 patients (10.2%) for 72 h after ICU admission in this study, our results regarding the relationship between Cl− fluctuation and cystatin level were also notable. In this study, only the negative Cl− fluctuation was associated with an increase in serum cystatin level during the 72 h after ICU admission. Considering that cystatin C is known as a marker of renal function in AKI [23], our results suggest that a decrease of Cl− level might be an associated factor for development of AKI after ICU admission. In addition, the relationship between AKI and the increase of Cl− could be caused by fluid administration. Furthermore, the significant relationship between the positive fluctuation and development of AKI could be related to clinical situations that require fluid administration. However, a decrease of Cl− was more related to kidney damage via hypochloremic metabolic alkalosis [10] than to an increase in Cl−. Considering the relatively small sample size of patients who had their serum cystatin C measured for 72 h after ICU admission in this study, more studies should be performed in the future to confirm the relationship between dyschloremia, cystatin C levels, and AKI.
This study had a number of limitations. First, due to the retrospective cohort design, selection bias may have occurred during the data collection process. To minimize this bias, all data were collected by a medical record technician blinded from the purpose of this study. Second, this study was performed at a single center, and therefore its results may have limited generalizability. Third, Cl− levels were not measured during the same period, using the same method for all patients included in this study. Fourth, since patients who developed AKI were much more likely to develop dyschloremia due to the inability of their kidneys to effectively regulate Cl− levels, there is a possibility that AKI may precede changes in Cl−, and thus might confound our study conclusions. Fifth, we could only use serum creatinine concentrations for the accurate diagnosis of AKI in accordance with the KDIGO criteria due to a lack of accurate urine output data. The exclusion of urine output data may reduce the accuracy and sensitivity of AKI diagnosis, especially for the diagnosis of more severe stages of AKI (stage 2 or 3) [30,31]. Lastly, in this study, we did not evaluate various biomarkers for AKI such as beta-2 microglobulin, liver-type fatty acid binding protein, and neutrophil gelatinase-associated lipocalin. Considering there are many biomarkers for the early detection of AKI [32], more biomarkers are needed to evaluate the direct effect of Cl− fluctuation on AKI development.
5. Conclusions
This study showed that an increase in both the positive and negative fluctuations in Cl- after ICU admission were associated with an increased risk of AKI after ICU admission. Furthermore, these associations differed based on the kidney functionality at ICU admission or postoperative ICU admission. However, the results should be interpreted carefully considering the retrospective design, and future studies should be performed using biomarkers for AKI.
Author Contributions
T.K.O. and I.A.S. designed the study, analyzed and interpreted the data, and drafted the manuscript. Y.T.J. and Y.H.J. contributed to the acquisition of data. All authors have given approval of the final version of the manuscript.
Conflicts of Interest
The authors declare no conflicts of interest.
Appendix A

Table A1.
Staging of postoperative acute kidney injury (KDIGO).
| Stage | Serum Creatinine |
|---|---|
| 1 | 1.5–1.9 times baseline or ≥0.3 mg dL−1 increase within 72 h after ICU admission |
| 2 | 2.0–2.9 times baseline within 72 h after ICU admission |
| 3 | 3.0 times baseline or increase in serum creatinine to ≥4.0 mg dL−1 or initiation of RRT within 72 h after ICU admission |
KDIGO, kidney disease: improving global outcomes; RRT, renal replacement therapy.
Appendix B
Table A2.
Univariable logistic regression analysis of covariates for occurrence of total AKI and AKI stage ≥2 during 72 h after ICU admission.
Table A2.
Univariable logistic regression analysis of covariates for occurrence of total AKI and AKI stage ≥2 during 72 h after ICU admission.
| Variables | Total AKI | AKI Stage ≥2 | ||||
|---|---|---|---|---|---|---|
| OR (95% CI) | p-Value | OR (95% CI) | p-Value | |||
| Sex: male | 1.09 (1.02–1.16) | 0.012 | 1.08 (0.99–1.18) | 0.093 | ||
| Age, year | 1.02 (1.02–1.02) | <0.001 | 1.01 (1.01–1.02) | <0.001 | ||
| Body mass index, kg m−2 | 0.96 (0.95–0.97) | <0.001 | 0.93 (0.92–0.95) | <0.001 | ||
| APACHE II | 1.04 (1.04–1.04) | <0.001 | 1.04 (1.03–1.04) | <0.001 | ||
| Comorbidities at ICU admission | ||||||
| Hypertension | 1.30 (1.22–1.38) | <0.001 | 1.16 (1.06–1.26) | 0.001 | ||
| Diabetes mellitus | 1.51 (1.36–1.67) | <0.001 | 1.42 (1.23–1.63) | <0.001 | ||
| Ischemic heart disease | 1.20 (0.98–1.46) | 0.076 | 1.01 (0.76–1.34) | 0.942 | ||
| Cerebrovascular disease | 1.31 (1.14–1.52) | <0.001 | 1.13 (0.92–1.38) | 0.250 | ||
| Chronic obstructive lung disease | 1.12 (0.97–1.30) | 0.131 | 0.96 (0.77–1.19) | 0.713 | ||
| Liver disease | 2.46 (2.10–2.88) | <0.001 | 3.21 (2.68–3.83) | <0.001 | ||
| Anemia (Hb <10 g dL−1) | 3.73 (3.49–4.00) | <0.001 | 4.77 (4.33–5.25) | <0.001 | ||
| Cancer | 1.83 (1.70–1.97) | <0.001 | 2.06 (1.88–2.27) | <0.001 | ||
| eGFR mL min−1 1.73 m−2 | ||||||
| ≥90 | 1 | (<0.001) | 1 | (<0.001) | ||
| 60–90 | 1.04 (0.96–1.13) | 0.343 | 0.77 (0.68–0.88) | <0.001 | ||
| 30–60 | 2.21 (2.01–2.44) | <0.001 | 1.17 (1.02–1.35) | 0.029 | ||
| <30 | 5.33 (4.73–6.00) | <0.001 | 3.69 (3.24–4.22) | <0.001 | ||
| Admission through ED | 1.51 (1.41–1.61) | <0.001 | 1.91 (1.73–2.10) | <0.001 | ||
| Postoperative admission | 0.86 (0.81, 0.92) | <0.001 | 0.68 (0.62, 0.74) | <0.001 | ||
| Fluid administration for 72 h | ||||||
| NaCl 0.9%, per 100 ml increase | 1.00 (1.00, 1.00) | 0.018 | 1.01 (1.00, 1.01) | 0.001 | ||
| Balanced crystalloid, per 100 mL | 0.99 (0.99, 1.00) | 0.014 | 0.98 (0.97, 0.98) | <0.001 | ||
| Hydroxyethyl starch, per 100 mL | 0.98 (0.97, 0.99) | 0.002 | 0.96 (0.95, 0.98) | <0.001 | ||
| Transfusion of packed RBC | 2.43 (2.28, 2.60) | <0.001 | 2.34 (2.14, 2.57) | <0.001 | ||
| The number of measurements of Cl− | 1.93 (1.86, 2.01) | <0.001 | 1.63 (1.54, 1.72) | <0.001 | ||
| Admission department | ||||||
| Internal medicine | 1 | (<0.001) | 1 | (<0.001) | ||
| Neurologic center | 0.23 (0.21–0.26) | <0.001 | 0.19 (0.16–0.22) | <0.001 | ||
| Cardiothoracic surgical department | 0.79 (0.73–0.86) | <0.001 | 0.52 (0.47–0.59) | <0.001 | ||
| Other surgical departments | 0.77 (0.71–0.85) | <0.001 | 0.64 (0.57–0.72) | <0.001 | ||
AKI, acute kidney injury; ICU, intensive care unit; APACHE, acute physiology and chronic health evaluation; eGFR, estimated glomerular filtration rate; ED, emergency department; Hb, hemoglobin; RBC, red blood cell; RRT, renal replacement therapy.
References
- Waikar, S.S.; Bonventre, J.V. Creatinine kinetics and the definition of acute kidney injury. J. Am. Soc. Nephrol. 2009, 20, 672–679. [Google Scholar] [CrossRef] [PubMed]
- Bellomo, R.; Kellum, J.A.; Ronco, C. Acute kidney injury. Lancet 2012, 380, 756–766. [Google Scholar] [CrossRef]
- Lewington, A.J.; Cerda, J.; Mehta, R.L. Raising awareness of acute kidney injury: A global perspective of a silent killer. Kidney Int. 2013, 84, 457–467. [Google Scholar] [CrossRef] [PubMed]
- Nash, K.; Hafeez, A.; Hou, S. Hospital-acquired renal insufficiency. Am. J. Kidney Dis. 2002, 39, 930–936. [Google Scholar] [CrossRef] [PubMed]
- Ostermann, M.; Chang, R.W. Acute kidney injury in the intensive care unit according to rifle. Crit. Care Med. 2007, 35, 1837–1843, quiz 1852. [Google Scholar] [CrossRef] [PubMed]
- Rewa, O.; Bagshaw, S.M. Acute kidney injury-epidemiology, outcomes and economics. Nat. Rev. Nephrol. 2014, 10, 193–207. [Google Scholar] [CrossRef] [PubMed]
- Thakar, C.V.; Christianson, A.; Freyberg, R.; Almenoff, P.; Render, M.L. Incidence and outcomes of acute kidney injury in intensive care units: A veterans administration study. Crit. Care Med. 2009, 37, 2552–2558. [Google Scholar] [CrossRef]
- Macedo, E.; Mehta, R.L. Preventing acute kidney injury. Crit. Care Clin. 2015, 31, 773–784. [Google Scholar] [CrossRef]
- Pfortmueller, C.A.; Uehlinger, D.; von Haehling, S.; Schefold, J.C. Serum chloride levels in critical illness-the hidden story. Intensive Care Med. Exp. 2018, 6, 10. [Google Scholar] [CrossRef]
- Shao, M.; Li, G.; Sarvottam, K.; Wang, S.; Thongprayoon, C.; Dong, Y.; Gajic, O.; Kashani, K. Dyschloremia is a risk factor for the development of acute kidney injury in critically ill patients. PLoS ONE 2016, 11, e0160322. [Google Scholar] [CrossRef]
- Toyonaga, Y.; Kikura, M. Hyperchloremic acidosis is associated with acute kidney injury after abdominal surgery. Nephrology 2017, 22, 720–727. [Google Scholar] [CrossRef] [PubMed]
- Yunos, N.M.; Bellomo, R.; Glassford, N.; Sutcliffe, H.; Lam, Q.; Bailey, M. Chloride-liberal vs. Chloride-restrictive intravenous fluid administration and acute kidney injury: An extended analysis. Intensive Care Med. 2015, 41, 257–264. [Google Scholar] [CrossRef]
- De Vasconcellos, K.; Skinner, D.L. Hyperchloraemia is associated with acute kidney injury and mortality in the critically ill: A retrospective observational study in a multidisciplinary intensive care unit. J. Crit. Care 2018, 45, 45–51. [Google Scholar] [CrossRef]
- Jaynes, M.P.; Murphy, C.V.; Ali, N.; Krautwater, A.; Lehman, A.; Doepker, B.A. Association between chloride content of intravenous fluids and acute kidney injury in critically ill medical patients with sepsis. J. Crit. Care 2018, 44, 363–367. [Google Scholar] [CrossRef] [PubMed]
- Sadan, O.; Singbartl, K.; Kandiah, P.A.; Martin, K.S.; Samuels, O.B. Hyperchloremia is associated with acute kidney injury in patients with subarachnoid hemorrhage. Crit. Care Med. 2017, 45, 1382–1388. [Google Scholar] [CrossRef]
- Berend, K.; van Hulsteijn, L.H.; Gans, R.O. Chloride: The queen of electrolytes? Eur. J. Intern. Med. 2012, 23, 203–211. [Google Scholar] [CrossRef] [PubMed]
- Yunos, N.M.; Bellomo, R.; Story, D.; Kellum, J. Bench-to-bedside review: Chloride in critical illness. Crit. Care 2010, 14, 226. [Google Scholar] [CrossRef] [PubMed]
- Oh, T.K.; Song, I.-A.; Kim, S.J.; Lim, S.Y.; Do, S.-H.; Hwang, J.-W.; Kim, J.; Jeon, Y.-T. Hyperchloremia and postoperative acute kidney injury: A retrospective analysis of data from the surgical intensive care unit. Crit. Care 2018, 22, 277. [Google Scholar] [CrossRef] [PubMed]
- Hallan, S.; Asberg, A.; Lindberg, M.; Johnsen, H. Validation of the modification of diet in renal disease formula for estimating gfr with special emphasis on calibration of the serum creatinine assay. Am. J. Kidney Dis. 2004, 44, 84–93. [Google Scholar] [CrossRef] [PubMed]
- Kellum, J.A.; Lameire, N.; Group, K.A.G.W. Diagnosis, evaluation, and management of acute kidney injury: A kdigo summary (part 1). Crit. Care 2013, 17, 204. [Google Scholar] [CrossRef]
- Chawla, L.S.; Eggers, P.W.; Star, R.A.; Kimmel, P.L. Acute kidney injury and chronic kidney disease as interconnected syndromes. N. Engl. J. Med. 2014, 371, 58–66. [Google Scholar] [CrossRef] [PubMed]
- Armstrong, R.A. When to use the bonferroni correction. Ophthalmic Physiol. Opt. 2014, 34, 502–508. [Google Scholar] [CrossRef] [PubMed]
- Murty, M.S.; Sharma, U.K.; Pandey, V.B.; Kankare, S.B. Serum cystatin c as a marker of renal function in detection of early acute kidney injury. Indian J. Nephrol. 2013, 23, 180–183. [Google Scholar] [CrossRef]
- Nagami, G.T. Hyperchloremia—Why and how. Nefrologia 2016, 36, 347–353. [Google Scholar] [CrossRef] [PubMed]
- Bank, N.; Better, O.S. Acid-base balance and acute renal failure. Miner Electrolyte Metab. 1991, 17, 116–123. [Google Scholar]
- Tani, M.; Morimatsu, H.; Takatsu, F.; Morita, K. The incidence and prognostic value of hypochloremia in critically ill patients. Sci. World J. 2012, 2012, 474185. [Google Scholar] [CrossRef]
- Krajewski, M.L.; Raghunathan, K.; Paluszkiewicz, S.M.; Schermer, C.R.; Shaw, A.D. Meta-analysis of high- versus low-chloride content in perioperative and critical care fluid resuscitation. Br. J. Surg. 2015, 102, 24–36. [Google Scholar] [CrossRef] [PubMed]
- Kawano-Dourado, L.; Zampieri, F.G.; Azevedo, L.C.P.; Correa, T.D.; Figueiro, M.; Semler, M.W.; Kellum, J.A.; Cavalcanti, A.B. Low- versus high-chloride content intravenous solutions for critically ill and perioperative adult patients: A systematic review and meta-analysis. Anesth. Analg. 2018, 126, 513–521. [Google Scholar] [CrossRef]
- Chappell, D.; Jacob, M.; Hofmann-Kiefer, K.; Conzen, P.; Rehm, M. A rational approach to perioperative fluid management. Anesthesiology 2008, 109, 723–740. [Google Scholar] [CrossRef]
- Bagshaw, S.M.; George, C.; Bellomo, R.; Committee, A.D.M. Changes in the incidence and outcome for early acute kidney injury in a cohort of australian intensive care units. Crit. Care 2007, 11, R68. [Google Scholar] [CrossRef]
- Kellum, J.A.; Sileanu, F.E.; Murugan, R.; Lucko, N.; Shaw, A.D.; Clermont, G. Classifying aki by urine output versus serum creatinine level. J. Am. Soc. Nephrol. 2015, 26, 2231–2238. [Google Scholar] [CrossRef] [PubMed]
- Vaidya, V.S.; Ferguson, M.A.; Bonventre, J.V. Biomarkers of acute kidney injury. Annu. Rev. Pharmacol. Toxicol. 2008, 48, 463–493. [Google Scholar] [CrossRef] [PubMed]
Figure 1.
Flow chart of patient selection.

Figure 2.
Restricted cubic spline between total (A), positive (B), and negative (C) fluctuations in serum chloride within 72 h after ICU admission and occurrence of AKI. ICU, intensive care unit; AKI, acute kidney injury. RRT, renal replacement therapy.
Figure 2.
Restricted cubic spline between total (A), positive (B), and negative (C) fluctuations in serum chloride within 72 h after ICU admission and occurrence of AKI. ICU, intensive care unit; AKI, acute kidney injury. RRT, renal replacement therapy.


Table 1.
Baseline characteristics of adult patients admitted to the ICU between 2012 and 2017.
| Variable | Total (19,707) | Mean | SD | |
|---|---|---|---|---|
| Sex: male | 11,412 (57.9%) | |||
| Age, year | 63.8 | 15.9 | ||
| Body mass index, kg m−2 | 23.6 | 3.9 | ||
| Comorbidities at ICU admission | ||||
| APACHE II | 20.3 | 10.0 | ||
| eGFR a: ≥90 | 12,164 (61.7%) | |||
| 60–90 | 4079 (20.7%) | |||
| 30–60 | 2163 (11.0%) | |||
| <30 | 1301 (6.6%) | |||
| Hypertension | 8511 (43.2%) | |||
| Diabetes mellitus | 1775 (9.0%) | |||
| Ischemic heart disease | 481 (2.4%) | |||
| Cerebrovascular disease | 886 (4.5%) | |||
| Chronic obstructive lung disease | 868 (4.4%) | |||
| Liver disease (LC, hepatitis, fatty liver) | 649 (3.3%) | |||
| Anemia (Hb <10 g dL−1) | 7266 (36.9%) | |||
| Cancer | 4137 (21.0%) | |||
| Characteristics of ICU admission | ||||
| Admission through emergency department | 11,435 (58.0%) | |||
| Postoperative admission | 8728 (44.3%) | |||
| Admission department | ||||
| Internal medicine | 4231 (21.5%) | |||
| Neurologic center | 4805 (24.4%) | |||
| Cardiothoracic surgical department | 6093 (30.9%) | |||
| Other surgical departments | 4578 (23.2%) | |||
| Length of ICU stay, day | 3.2 | 10.4 | ||
| Length of hospital stay, day | 13.3 | 20.5 | ||
| Fluid administration for 72 h after ICU admission | ||||
| NaCl 0.9%, mL | 1745.5 | 2124.1 | ||
| Balanced crystalloid, mL | 505.5 | 862.5 | ||
| Hydroxyethyl starch, mL | 79.4 | 270.1 | ||
| Transfusion of packed RBC | 8530 (43.3%) | |||
| Serum chloride (Cl−) in ICU, mmol L−1 | ||||
| Cl− on ICU admission | 106.4 | 6.2 | ||
| The number of measurements for 72 h after ICU admission | 3.2 | 1.0 | ||
| Total fluctuation of Cl− for 72 h after ICU admission b | 7.0 | 5.7 | ||
| Positive fluctuation of Cl− for 72 h after ICU admission c | 4.4 | 4.1 | ||
| Negative fluctuation of Cl− for 72 h after ICU admission d | 2.9 | 4.6 | ||
| Max cystatin C level mg dL−1 for 72 h after ICU adm (n = 2,021) | 2.0 | 1.2 | ||
| Total AKI within 72 h after ICU admission | 5284 (26.8%) | |||
| AKI stage ≥2 within 72 h after ICU admission | 2233 (11.4%) | |||
| RRT after ICU admission (within 72 h) | 468 (2.4%) | |||
a eGFR (mL min −1 1.73 m−2): 186 × (Creatinine)−1.154 × (Age)−0.203 × (0.742 if female). b Total fluctuation of Cl−: (Maximum Cl−– Minimum Cl−) for 72 h after ICU admission. c Positive fluctuation of Cl−: (Maximum Cl− – Preadmission Cl−) for 72 h after ICU admission. d Negative fluctuation of Cl−: (Preadmission Cl− – Minimum Cl−) for 72 h after ICU admission. ICU, intensive care unit; APACHE, acute physiology and chronic health evaluation; eGFR, estimated glomerular filtration rate; LC, liver cirrhosis; Hb, hemoglobin; RBC, red blood cell; Max, maximum; AKI, acute kidney injury; RRT, renal replacement therapy.
Table 2.
Multivariable logistic regression analysis for total AKI and AKI stage ≥2 after ICU admission according to fluctuations of serum chloride (mmol L−1).
Table 2.
Multivariable logistic regression analysis for total AKI and AKI stage ≥2 after ICU admission according to fluctuations of serum chloride (mmol L−1).
| Variables | Odds Ratio (95% CI) | p-Value |
|---|---|---|
| Dependent variables: Total AKI | ||
| Total fluctuation of Cl− a (model 1) | 1.05 (1.03, 1.06) | <0.001 |
| Interaction: Total fluctuation of Cl− a,* eGFR b ≥90 | 1 | (<0.001) |
| Total fluctuation of Cl− a,* eGFR b: 60–90 | 1.02 (1.00, 1.04) | 0.114 |
| Total fluctuation of Cl− a,* eGFR b: 30–60 | 1.02 (1.00, 1.05) | 0.153 |
| Total fluctuation of Cl− a,* eGFR b: <30 | 0.90 (0.88, 0.93) | <0.001 |
| Interaction: Total fluctuation of Cl− a,* postoperative admission | 0.96 (0.95, 0.98) | <0.001 |
| Positive fluctuation of Cl− c (model 2) | 1.06 (1.04, 1.08) | <0.001 |
| Interaction: Positive fluctuation of Cl− a,*eGFR b ≥90 | 1 | (<0.001) |
| Positive fluctuation of Cl− a,* eGFR b:60–90 | 1.02 (0.99, 1.04) | 0.259 |
| Positive fluctuation of Cl− a,* eGFR b:30–60 | 1.00 (0.97, 1.03) | 0.812 |
| Positive fluctuation of Cl− a,* eGFR b:<30 | 0.87 (0.84, 0.90) | <0.001 |
| Interaction: Positive fluctuation of Cl− a,* postoperative admission | 0.98 (0.96, 1.00) | 0.095 |
| Negative fluctuation of Cl− c (model 2) | 1.04 (1.02, 1.06) | <0.001 |
| Interaction: Negative fluctuation of Cl− a,*eGFR b ≥90 | 1 | (<0.001) |
| Negative fluctuation of Cl− a,* eGFR b: 60–90 | 1.02 (0.99, 1.06) | 0.145 |
| Negative fluctuation of Cl− a,* eGFR b: 30–60 | 1.05 (1.01, 1.09) | 0.006 |
| Negative fluctuation of Cl− a,* eGFR b: <30 | 0.94 (0.91, 0.98) | 0.003 |
| Interaction: Negative fluctuation of Cl− a,* postoperative admission | 0.94 (0.92, 0.97) | <0.001 |
| Dependent variables: AKI stage ≥2 | ||
| Total fluctuation of Cl− a | 1.08 (1.06, 1.10) | <0.001 |
| Interaction: Total fluctuation of Cl− a,* eGFR b: ≥90 | 1 | (<0.001) |
| Total fluctuation of Cl− a,* eGFR b: 60–90 | 1.00 (0.97, 1.03) | 0.853 |
| Total fluctuation of Cl− a,* eGFR b: 30–60 | 0.96 (0.92, 0.99) | 0.022 |
| Total fluctuation of Cl− a,* eGFR b: <30 | 0.89 (0.86, 0.92) | <0.001 |
| Interaction: Total fluctuation of Cl− a,* postoperative admission | 0.96 (0.93, 0.98) | <0.001 |
| Positive fluctuation of Cl− c | 1.09 (1.07, 1.11) | <0.001 |
| Interaction: Positive fluctuation of Cl− a,*eGFR b ≥90 | 1 | (<0.001) |
| Positive fluctuation of Cl− a,* eGFR b: 60–90 | 1.00 (0.96, 1.03) | 0.881 |
| Positive fluctuation of Cl− a,* eGFR b: 30–60 | 0.92 (0.88, 0.96) | <0.001 |
| Positive fluctuation of Cl− a,* eGFR b: <30 | 0.87 (0.84, 0.91) | <0.001 |
| Interaction: Positive fluctuation of Cl− a,* postoperative admission | ||
| Negative fluctuation of Cl− d | 1.09 (1.06, 1.11) | <0.001 |
| Interaction: Negative fluctuation of Cl− a,*eGFR b ≥90 | 1 | (<0.001) |
| Negative fluctuation of Cl− a,* eGFR b: 60–90 | 0.99 (0.95, 1.04) | 0.789 |
| Negative fluctuation of Cl− a,* eGFR b: 30–60 | 1.00 (0.95, 1.04) | 0.853 |
| Negative fluctuation of Cl− a,* eGFR b: <30 | 0.91 (0.87, 0.95) | <0.001 |
| Interaction: Negative fluctuation of Cl− a,* postoperative admission | 0.91 (0.89, 0.94) | <0.001 |
Covariates of p < 0.1 in univariable logistic regression analysis (Appendix B) were included to adjust the multivariable logistic regression model. a Total fluctuation of Cl− (mmol L−1): (Maximum Cl−– Minimum Cl−) for 72 h after ICU admission. b eGFR (mL min −1 1.73 m−2): 186 × (Creatinine)−1.154 × (Age)−0.203 × (0.742 if female). c Positive fluctuation of Cl− (mmol L−1): (Maximum Cl− – Preadmission Cl−) for 72 h after ICU admission. d Negative fluctuation of Cl− (mmol L−1): (Preadmission Cl− – Minimum Cl−) for 72 h after ICU admission. AKI, acute kidney injury; ICU, intensive care unit; eGFR, estimated glomerular filtration rate.
Table 3.
Multivariable logistic regression analysis for total AKI and AKI stage ≥2 after ICU admission according to preadmission eGFR a group.
Table 3.
Multivariable logistic regression analysis for total AKI and AKI stage ≥2 after ICU admission according to preadmission eGFR a group.
| Variables | Odds Ratio (95% CI) | p * |
|---|---|---|
| Dependent variable: Total AKI | ||
| eGFR a ≥90 (n = 12,164) | ||
| Total fluctuation of Cl− b (per 1 mmol L−1) | 1.04 (1.02, 1.05) | <0.001 |
| Positive fluctuation of Cl− c (per 1 mmol L−1) | 1.05 (1.03, 1.06) | <0.001 |
| Negative fluctuation of Cl− d (per 1 mmol L−1) | 1.01 (0.99, 1.03) | 0.204 |
| eGFR a <90 (n = 7,543) | ||
| Total fluctuation of Cl− b (per 1 mmol L−1) | 1.02 (1.01, 1.04) | 0.002 |
| Positive fluctuation of Cl− c (per 1 mmol L−1) | 1.02 (1.00, 1.04) | 0.024 |
| Negative fluctuation of Cl− d (per 1 mmol L−1) | 1.03 (1.01, 1.05) | 0.004 |
| eGFR a: <60 (n = 3,464) | ||
| Total fluctuation of Cl− b (per 1 mmol L−1) | 1.01 (0.99, 1.03) | 0.239 |
| Positive fluctuation of Cl− c (per 1 mmol L−1) | 0.99 (0.97, 1.01) | 0.529 |
| Negative fluctuation of Cl− d (per 1 mmol L−1) | 1.03 (1.01, 1.06) | 0.004 |
| eGFR a: <30 (n = 1,301) | ||
| Total fluctuation of Cl− b (per 1 mmol L−1) | 0.98 (0.95, 1.01) | 0.150 |
| Positive fluctuation of Cl− c (per 1 mmol L−1) | 0.99 (0.91, 1.01) | 0.052 |
| Negative fluctuation of Cl− d (per 1 mmol L−1) | 1.01 (0.98, 1.05) | 0.469 |
| Dependent variables: AKI stage ≥2 | ||
| eGFR a ≥90 (n = 12,164) | ||
| Total fluctuation of Cl− b (per 1 mmol L−1) | 1.06 (1.04, 1.08) | <0.001 |
| Positive fluctuation of Cl− c (per 1 mmol L−1) | 1.07 (1.05, 1.09) | <0.001 |
| Negative fluctuation of Cl− d (per 1 mmol L−1) | 1.04 (1.02, 1.06) | 0.001 |
| eGFR a <90 (n = 7,543) | ||
| Total fluctuation of Cl− b (per 1 mmol L−1) | 1.03 (1.01, 1.05) | 0.002 |
| Positive fluctuation of Cl− c (per 1 mmol L−1) | 1.02 (1.00, 1.04) | 0.059 |
| Negative fluctuation of Cl− d (per 1 mmol L−1) | 1.04 (1.02, 1.06) | 0.001 |
| eGFR a: <60 (n = 3,464) | ||
| Total fluctuation of Cl− b (per 1 mmol L−1) | 1.01 (0.99, 1.03) | 0.317 |
| Positive fluctuation of Cl− c (per 1 mmol L−1) | 0.99 (0.96, 1.01) | 0.280 |
| Negative fluctuation of Cl− d (per 1 mmol L−1) | 1.04 (1.01, 1.07) | 0.003 |
| eGFR a: <30 (n = 1,301) | ||
| Total fluctuation of Cl− b (per 1 mmol L−1) | 1.00 (0.97, 1.04) | 0.788 |
| Positive fluctuation of Cl− c (per 1 mmol L−1) | 0.99 (0.95, 1.03) | 0.489 |
| Negative fluctuation of Cl− d (per 1 mmol L−1) | 1.02 (0.98, 1.06) | 0.247 |
* p < 0.013 was considered as statistically significant after Bonferroni correction. Covariates of p < 0.1 in univariable logistic regression analysis (Appendix B) were included to adjust the multivariable logistic regression model. a eGFR (mL min −1 1.73m−2): 186 × (Creatinine)−1.154 × (Age)−0.203 × (0.742 if female). b Total fluctuation of Cl− (mmol L−1): (Maximum Cl− – Minimum Cl−) for 72 h after ICU admission. c Positive fluctuation of Cl− (mmol L−1): (Maximum Cl− – Preadmission Cl−) for 72 h after ICU admission. d Negative fluctuation of Cl− (mmol L−1): (Preadmission Cl− – Minimum Cl−) for 72 h after ICU admission.
Table 4.
Multivariable logistic regression analysis for total AKI and AKI (stage ≥2) after ICU admission according to postoperative admission.
Table 4.
Multivariable logistic regression analysis for total AKI and AKI (stage ≥2) after ICU admission according to postoperative admission.
| Variables | Odds ratio (95% CI) | p * |
|---|---|---|
| Dependent variable: Total AKI | ||
| Postoperative admission (n = 8,728) | ||
| Total fluctuation of Cl− a (per 1 mmol L−1) | 1.01 (1.00, 1.02) | 0.170 |
| Positive fluctuation of Cl− b (per 1 mmol L−1) | 1.03 (1.01, 1.04) | 0.002 |
| Negative fluctuation of Cl− c (per 1 mmol L−1) | 0.99 (0.97, 1.01) | 0.254 |
| Non-postoperative admission (n = 10,992) | ||
| Total fluctuation of Cl− a (per 1 mmol L−1) | 1.04 (1.02, 1.05) | <0.001 |
| Positive fluctuation of Cl− b (per 1 mmol L−1) | 1.04 (1.02, 1.05) | <0.001 |
| Negative fluctuation of Cl− c (per 1 mmol L−1) | 1.04 (1.02, 1.05) | <0.001 |
| Dependent variables: AKI stage ≥2 | ||
| Postoperative admission (n = 8,728) | ||
| Total fluctuation of Cl− a (per 1 mmol L−1) | 1.01 (0.99, 1.03) | 0.300 |
| Positive fluctuation of Cl− b (per 1 mmol L−1) | 1.03 (1.00, 1.05) | 0.023 |
| Negative fluctuation of Cl− c (per 1 mmol L−1) | 0.99 (0.96, 1.02) | 0.396 |
| Non-postoperative admission (n = 10,992) | ||
| Total fluctuation of Cl− a (per 1 mmol L−1) | 1.05 (1.04, 1.07) | <0.001 |
| Positive fluctuation of Cl− b (per 1 mmol L−1) | 1.05 (1.03, 1.07) | <0.001 |
| Negative fluctuation of Cl− c (per 1 mmol L−1) | 1.06 (1.04, 1.08) | <0.001 |
* p < 0.025 was considered as statistically significant after Bonferroni correction. Covariates of p < 0.1 in univariable logistic regression analysis (Appendix B) were included to adjust the multivariable logistic regression model. a Total fluctuation of Cl− (mmol L−1): (Maximum Cl− – Minimum Cl−) for 72 h after ICU admission. b Positive fluctuation of Cl− (mmol L−1): (Maximum Cl− – Preadmission Cl−) for 72 h after ICU admission. c Negative fluctuation of Cl− (mmol L−1): (Preadmission Cl− – Minimum Cl−) for 72 h after ICU admission. AKI, acute kidney injury; ICU, intensive care unit; eGFR, estimated glomerular filtration rate.
Table 5.
Generalized linear regression model for maximum cystatin C level within 72 h after ICU admission according to fluctuation of Cl− (n = 2,021).
Table 5.
Generalized linear regression model for maximum cystatin C level within 72 h after ICU admission according to fluctuation of Cl− (n = 2,021).
| Variables | Exp Coef (95% CI) | p * |
|---|---|---|
| Dependent variable: maximum cystatin C level (mmol L−1) | ||
| Total fluctuation of Cl− a (per 1 mmol L−1, model 1) | 0.004 (−0.005, 0.013) | 0.374 |
| Positive fluctuation of Cl− b (per 1 mmol L−1, model 2) | −0.002 (−0.012, 0.008) | 0.682 |
| Negative fluctuation of Cl− c (per 1 mmol L−1, model 2) | 0.014 (0.002, 0.026) | 0.026 |
* In the generalized linear model, gamma distribution and the log link function were assumed for the dependent variable (maximum cystatin C level within 72 h after ICU admission). All covariates were included in the model. a Total fluctuation of Cl− (mmol L−1): (maximum Cl− – minimum Cl−) for 72 h after ICU admission. b Positive fluctuation of Cl− (mmol L−1): (maximum Cl− – preadmission Cl−) for 72 h after ICU admission. c Negative fluctuation of Cl− (mmol L−1): (preadmission Cl− – minimum Cl−) for 72 h after ICU admission. Exp, exponentiated; Coef, coefficient; APACHE, acute physiology and chronic health evaluation; eGFR, estimated glomerular filtration rate.
© 2019 by the authors. Licensee MDPI, Basel, Switzerland. This article is an open access article distributed under the terms and conditions of the Creative Commons Attribution (CC BY) license (http://creativecommons.org/licenses/by/4.0/).
Share and Cite
MDPI and ACS Style
Oh, T.K.; Song, I.-A.; Jeon, Y.-T.; Jo, Y.H. Fluctuations in Serum Chloride and Acute Kidney Injury among Critically Ill Patients: A Retrospective Association Study. J. Clin. Med. 2019, 8, 447. https://doi.org/10.3390/jcm8040447
AMA Style
Oh TK, Song I-A, Jeon Y-T, Jo YH. Fluctuations in Serum Chloride and Acute Kidney Injury among Critically Ill Patients: A Retrospective Association Study. Journal of Clinical Medicine. 2019; 8(4):447. https://doi.org/10.3390/jcm8040447
Chicago/Turabian StyleOh, Tak Kyu, In-Ae Song, Young-Tae Jeon, and You Hwan Jo. 2019. "Fluctuations in Serum Chloride and Acute Kidney Injury among Critically Ill Patients: A Retrospective Association Study" Journal of Clinical Medicine 8, no. 4: 447. https://doi.org/10.3390/jcm8040447
Note that from the first issue of 2016, this journal uses article numbers instead of page numbers. See further details here.