Abstract
Fatty acids and glucose are the main bioenergetic substrates in mammals. Impairment of mitochondrial fatty acid oxidation causes mitochondrial myopathy leading to decreased physical performance. Here, we report that haploinsufficiency of ADCK2, a member of the aarF domain-containing mitochondrial protein kinase family, in human is associated with liver dysfunction and severe mitochondrial myopathy with lipid droplets in skeletal muscle. In order to better understand the etiology of this rare disorder, we generated a heterozygous Adck2 knockout mouse model to perform in vivo and cellular studies using integrated analysis of physiological and omics data (transcriptomics–metabolomics). The data showed that Adck2+/− mice exhibited impaired fatty acid oxidation, liver dysfunction, and mitochondrial myopathy in skeletal muscle resulting in lower physical performance. Significant decrease in Coenzyme Q (CoQ) biosynthesis was observed and supplementation with CoQ partially rescued the phenotype both in the human subject and mouse model. These results indicate that ADCK2 is involved in organismal fatty acid metabolism and in CoQ biosynthesis in skeletal muscle. We propose that patients with isolated myopathies and myopathies involving lipid accumulation be tested for possible ADCK2 defect as they are likely to be responsive to CoQ supplementation.
1. Introduction
The liver, adipose tissue, and skeletal muscle regulate systemic metabolic flexibility in order to maintain energy homeostasis during the fast–fed transition [1]. The ability to switch between glucose and fatty acid (FA) catabolism defines metabolic flexibility in times of energy abundance (e.g., feeding) and restriction. [2]. Mitochondria play a central role in cellular energy metabolism by providing reducing equivalents from the tricarboxylic acid cycle and FA β-oxidation to the respiratory chain (MRC). Mitochondrial respiration is directly involved in the ATP supply to match energy demand during excitation–contraction coupling in cardiac [3] and skeletal muscle [4]. Coenzyme Q (CoQ) is a fat-soluble compound that transfers electrons between complex I and II to complex III of the MRC, and also receives electrons from dihydroorotate dehydrogenase and sulfide: quinone oxidoreductase [5]. Mitochondria are the site for substrate selection, namely glucose or FA, depending upon energy demand [6] and CoQ contributes to determine the source of electrons from complex I (NADH) vs. complex II (FADH2) [7].
Defects in the mitochondrial β-oxidation pathway elicit clinically heterogeneous myopathies resulting from either multiple acyl-CoA dehydrogenase deficiency (MADD), an autosomal recessive disorder caused by mutations in ETFDH, a gene encoding electron-transfer flavoprotein: ubiquinone oxidoreductase, or mutations in ETFA or ETFB, which encode the alpha or beta subunit of electron transfer flavoprotein (ETF) [8,9]. Deficiency in ETF or the electron-transfer flavoprotein: ubiquinone oxidoreductase (ETFDH) leads to impaired FA oxidation and elevated levels of acyl-carnitines in plasma. The myopathic form of CoQ deficiency has been linked to a defect in FA oxidation in skeletal muscle [10,11,12]. Moreover, impaired lipid metabolism associated with aberrant mitochondrial morphology have been found in response to the loss of mitofusin 2 (Mfn2), resulting in MRC defects due to a secondary deficiency in CoQ [13]. Mitochondrial diseases associated with CoQ deficiency are rare and exhibit clinical heterogeneity that can be caused by mutations in COQ genes or genes encoded by either nuclear DNA or mitochondrial DNA [14,15,16,17].
The ADCK genes encode the aarF domain-containing mitochondrial protein kinases (ADCK1-5). Both human ADCK3 (COQ8A) and ADCK4 (COQ8B) show high homology to yeast coq8 and can rescue the growth of Δcoq8 yeast strain [18,19] by contributing to the stabilization of the CoQ biosynthesis complex [20]. ADCK3 has an unorthodox kinase function by harboring an ATPase activity [21]. Mutations in ADCK3 cause autosomal recessive cerebellar ataxia with CoQ deficiency [20,22,23,24,25,26,27,28] whereas mutations in ADCK4 promote CoQ-responsive, steroid-resistant nephrotic syndrome due to CoQ deficiency [29]. Silencing of ADCK1 affects epithelial cell migration [30] while ADCK2 silencing reduces the viability of both glioblastoma-derived cancer cells [31] and estrogen receptor-positive breast tumors [32]. The depletion in ADCK2 also significantly decreases the effect of tumor necrosis factor α (TNFα) on hypoxia-inducible factor-1 (HIF-1α) stability in osteosarcoma and prostate cancer cell lines [33]. However, no information is available about the role of ADCK2 in CoQ biosynthesis and, so far, there is no disease associated with this gene [15,34,35].
Here, we report that Adck2 haploinsufficiency in mice caused mitochondrial dysfunction that affected mainly the skeletal muscle with evidence of liver steatosis without cognitive deficits or impairment in brain function. Mitochondrial myopathy associated with CoQ deficiency in skeletal muscle was observed along with marked perturbation in whole animal mitochondrial β-oxidation. This phenotype was reminiscent of that seen in a male patient with ADCK2 haploinsufficiency that was partially rescued by CoQ supplementation. Our results showed that ADCK2 exerts a unique role in lipid homeostasis through control of the mitochondrial CoQ pool in muscle and organismal FA oxidation.
2. Materials and Methods
2.1. Study Approval
We obtained blood, muscle samples, and pedigrees following informed consent from individuals of the family of the patient with severe myopathy. The Ethical Committee of the Carl Gustav Carus University, Dresden, approved human subject research. A reference pathologist evaluated muscle biopsies. The Ethical Committee for Animal Experimentation of the University Pablo de Olavide approved the mouse studies on 27 May 2013, according to the European Union Directive of 22 September 2010 (2010/63/UE) and with the Spanish Royal Decree of 1 February 2013 (53/2013). All efforts were made to minimize the number of animals used and their suffering.
2.2. Mouse Model
The Adck2 knockout mouse model was produced at the University of Michigan Transgenic Animal Model Core, Biomedical Research Core Facilities (Ann Arbor, MI, USA). All experiments were carried out in male mice from 6–12 months of age. Chimeras were produced by microinjecting C57BL/6-derived mutant embryonic stem (ES) cells into albino C57BL/6 host blastocysts obtained from the mating of C57BL/6-BrdCrHsd-Tyrc females with C57BL/6-BrdCrHsd-Tyrc males. Any white pups from chimera breeding have contribution from both the ES cells and the host embryos and were labeled as C57BL/6-BrdCrHsd. The ES cell clones Adck2 ACB, Adck2 AB3, Adck2 AG2 were obtained from Knockout Mouse Project (KOMP) repository, Mouse Biology Program, University of California (www.komp.org). These cells were heterozygous for the Adck2 deletion, and the host blastocysts were wild type (WT) for the introduced mutation. The breeding of chimeric males with albino C57BL/6 females produced black pups, which were derived from the ES cells. Because the ES cells were heterozygous for the mutation, half of the black pups were expected to be positive for the mutation. Mice were supplemented with 15 mg/kg/day of CoQ10 (Kaneka QH stabilized powder type P30) (Kaneka Pharma Europe, Brussels, Belgium) dissolved daily in the drinking water when indicated.
2.3. Cell Strains and Culture
Dermal fibroblasts from the study participant (subject II-3) and his sister (subject II-2), primary human fibroblasts MRC-5 (CCL-171, American Type Culture Collection (ATCC Manassas, VA, USA), and neonatal human dermal fibroblasts (HDFs) (PCS-210-010 and PCS-210-012, ATCC) were plated in separate six-well plates (40,000 cells/well) and cultured using Dulbecco’s modified Eagle’s medium (DMEM) with 20% fetal calf serum (FCS). Mice embryonic fibroblast (MEF) preparations from WT, Adck2+/− and Adck2−/− mice were obtained from fetuses at day 9 postcoitum as described elsewhere [36].
2.4. Targeted Gene Sequencing
Total DNA preparation was carried out following standard procedures. The mitochondrial and the exons and intron–exon boundaries of ETFA, ETFB, ETFDH, ADCK1, ADCK3, ADCK4, ADCK5, decaprenyl-diphosphate synthase subunit 1 (PDSS1), and subunit 2 (PDSS2), COQ2, COQ3, COQ4, COQ5, COQ6, COQ7, COQ8A, COQ8B, COQ9, COQ10A, COQ10B, and PPTC7 were analyzed by Sanger sequencing. For quantification of the ADCK2 and Adck2 transcripts, RNA was extracted with easy-BLUE Total RNA extraction kit (iNtRON Biotechnology) according to manufacturer’s instructions. One microgram of total RNA was used to obtain cDNA of human ADCK2 gene with the iScript cDNA Synthesis Kit (Bio-Rad) following the manufacturer’s instructions. For sequencing of ADCK2 mRNA from the index patient and other family members, RNA was isolated from cultured fibroblasts (RNeasy Plus Mini Kit-Qiagen) or from whole blood (PAXgene Blood RNA kit, PreAnalytiX), and reverse transcription was performed using the Quantitect Reverse Transcription kit (Qiagen). The entire ADCK2 mRNA was amplified using four primer pairs with one primer from each pair spanning adjacent exons [37], and the amplicon was sequenced in the forward and reverse direction.
2.5. Measurement of Plasma Acyl-Carnitine and Urinary Organic Acids
Analysis of plasma acyl-carnitines in the index patient and other family members was performed on dry blood spots (Screening Labor, Hannover, Germany). For the animal studies, analysis of acyl-carnitines in plasma was performed by high-performance liquid chromatography, electrospray ionization, and tandem mass spectrometry in the underivatized form using a commercial kit of deuterated acyl-carnitines (Perkin Elmer, Barcelona, Spain). The trimethylsilylated derivatives of organic acids were determined in mouse urine by gas chromatography/mass spectrometry (5975C Agilent Technologies, Madrid, Spain). The signals (m/z) of the specific ions for every compound were corrected by the amount of the internal standard (undecanodioic; ion 345). For all urine samples, the same amount of creatinine was loaded onto the gas chromatograph/mass spectrometer. Plasma lactate levels were measured with a lactate oxidase–peroxidase (colorimetric) assay kit (Spinreact, Barcelona, Spain) as indicated by the manufacturer.
2.6. Yeast Functional Complementation
Yeast YPL109c mutants were transformed with the pYES2 vector containing the different versions of human ADCK2, and either the WT, site-directed mutant yeast YPL109c, or the empty vector for complementation experiments. Growth rate in non-fermentable carbon source (YPG medium) was determined as a marker of functional complementation.
2.7. Physical and Behavioral Tests
The rotarod performance test was performed to assess motor activity and coordination in mice. Animals were placed on an accelerating rotating rod (45 rpm max), and the time it took the mice to fall off of the rod was recorded. In the treadmill exhaustion test, the mice were forced to run on a treadmill (Treadmill Columbus 1055M-E50; Cibertec SA, Madrid, Spain) at 8% inclination until exhaustion, starting at 10 m/min and increasing the speed by 5 m/min every 5 min until it reached 25 m/min. Exhaustion was achieved when animals who quit running refused to move back to the treadmill 5 sec after receiving an electric foot shock [38]. Muscle force in mice was measured in vivo using a Grip Strength Columbus apparatus (Cibertec SA) as indicated [39]. Behavior was analyzed by passive avoidance to test associative memory and other tasks such as hot-plate sensitivity, exploratory locomotor activity by the open field actimeter [40]. Associative short- and long-term memories were determined by novel object recognition (NOR) task as described [41]. (n = 10 per group).
2.8. CoQ Determination and Biosynthesis
CoQ concentrations and biosynthesis rate were determined as described by Rodríguez-Aguilera et al. [42]. Moreover, CoQ biosynthesis rate was also calculated upon cell incubation with (3H)–mevalonate, an approach that allowed the measurement of cholesterol biosynthesis as well [43]. Specific activities were expressed as disintegrations per minute (DPM) min−1·mg protein−1. Stable expression of ADCK2 in human fibroblasts was achieved using lentiviral particles. The wild-type allele of human ADCK2 was cloned in using the lentivirus transfer vector containing chimeric Rous sarcoma virus (pRRL), with the promoter sequence required for ADCK2 expression EF1a, and the promoter of phosphoglycerate kinase (PGK) required for the green fluorescent protein (GFP) expression (pRRL.sin.EF1a-PGK-GFP) plasmid to obtain the production of lentiviral particles (II-3-pRRL-ADCK2). Cell type 293T (5 × 10⁶ cells per plate) were transfected with the II-3-pRRL-ADCK2 plasmid, along with the plasmid required to the lentivirus packaging (psPAX2) and the required to produce the virus capsid (pMD2.G). After 16 h of incubation, the culture medium was replaced with fresh medium, which was collected 48 h later and subjected to filtration and centrifugation (26,000 rpm, 2 h, 4 °C) in order to recover lentiviral particles. Human fibroblasts were seeded at 50,000 cells per well and expanded until reaching ~90% confluency, after which the medium was changed and lentiviral particles (400 µL per well) were added. Twenty-four hours later, more than 98% GFP-positive cells (a direct measure of transfection) were collected by cell sorting.
2.9. Mitochondrial Biochemistry
Activities of NADH: coenzyme Q1 oxidoreductase (Complex I), succinate dehydrogenase (Complex II), ubiquinol: cytochrome c oxidoreductase (Complex III), NADH: cytochrome c reductase (Complex I–III), succinate: cytochrome c reductase (Complex II–III), cytochrome c oxidase (Complex IV), and citrate synthase (CS) were determined in muscle biopsy from patients, in mouse skeletal muscle, and in fibroblast lysates by spectrophotometric assays as described [44]. Oxygen consumption rate (OCR) based on glucose as energy substrate was determined with an XFe24 Extracellular Flux Analyzer (Seahorse Bioscience), as specified by the manufacturer. FA oxidation was determined by palmitate-dependent OCR in permeabilized cells as described [45]. MEFs or fibroblasts were seeded in XFe24 cell culture microplates at the density of 7.5 × 10³ cells per well. Data were normalized to the number of cells in each well counted at the end of the experiment. In order to perform immunostaining, cells were plated at a density of 10 × 10 cells on coverslips and were immunostained with antibodies against GFP and TOM20 as indicated [44]. Western blots were carried out as described [5].
2.10. Microarray Analysis
RNA was extracted from liver and skeletal muscles of six-month-old Adck2+/− (n = 5) and WT (n = 5) mice. Probe-target hybridization with GeneChip Mouse Genome Plus 2.0 (Affymetrix) was performed as we previously described [46]. Statistical analyses were performed comparing each signal of Adck2+/− with the corresponding signal of WT. Data have been deposited with the National Center for Biotechnology Information, Gene Expression Omnibus database repository (NCBI-GEO) [47] with accession number GSE104996. Microarrays results were validated by quantitative RT-PCR analysis of 10 significant genes (Table S7).
2.11. Untargeted Metabolomics Assay
Metabolomics analysis on mouse liver, skeletal muscle, and plasma extracts was performed by the University of California Davis, West Coast Metabolomics Center (Davis, CA, USA) according to established procedures [46]. Twelve-month-old Adck2+/− and WT mice were used (n = 6).
2.12. Metabolic Cages
Mouse metabolic rate was assessed in vivo by indirect calorimetry in open-circuit oxymax chambers using the Comprehensive Lab Animal Monitoring System (CLAMS; Columbus Instruments, Columbus, OH, USA) as previously described [48].
2.13. Quantitative Real-Time PCR
Quantitative real-time PCR was performed to measure the expression of select target genes [49]. The primers were designed with the Beacon Designer software, and the primer pair sequences used in this study were as followed: human ADCK2, forward primer 5’-CAGGAAGAACACCATCAC-3′ and reverse primer 5’-TGAGTCATCAGCAACTTAA-3’; mouse Adck2, forward primer 5’-TAAGTCAGATCACCTCAT-3’ and reverse primer 5’-CAATCTTCATCAGCAGTA-3’; human glyceraldehyde 3-phosphate dehydrogenase (GAPDH), forward primer 5’-TGCACACCACCAACTGCTTAGC-3′ and reverse primer 5′-GGCATGGACTGTGGTCATGAG-3′; and mouse Gapdh, forward primer 5′-TGACGTGCCGCCTGGAGAAA-3′ and reverse primer 5’-AGTGTAGCCCAAGATGCCCTTCAG-3′.
The following primer pairs were used (F, forward orientation; R, reverse orientation; sequence 5′ to 3’) to validate microarray results (Table S7): apolipoprotein (apo-) A-II, ApoA2-F (TGGTCGCACTGCTGGTAAC), ApoA2-R (TTTGCCATATTCAGTCATGCTCT), homeobox protein, Cdx4-F (TGACATGACCTCCCCAGTTTT), Cdx4-R (GCCGGAGTCAAGAGAAACCA), Cathepsin H, Ctsh-F (ACCGTGAACGCCATAGAAAAG), Ctsh-R (TGAGCAATTCTGAGGCTCTGA), glutathione S-transferase P 1, Gstp1-F (ATGCCACCATACACCATTGTC), Gstp1-R (GGGAGCTGCCCATACAGAC), melanoma inhibitory activity protein 2, Mia2-F (GTGTCTGGAGGGTACAAAGTTG), Mia2-R (TCGGGTCCTGTGTAATCTCTC), NADH:ubiquinone oxidoreductase subunit B2, Ndufb2-F (CCCCGGTACAGGGAGTTTC), Ndufb2-R (GCCAAAATCGCCAAAGAATCCA), pleckstrin homology-like domain family A member 2, Phlda2-F (CTCCGACGAGATCCTTTGCG), Phla2-R (ACACGTACTTAGAGGTGTGCTC), solute carrier family 2 member 2, Slc2a2-F (TCAGAAGACAAGATCACCGGA) Slc2a2-R (GCTGGTGTGACTGTAAGTGGG), translocase of outer mitochondrial membrane 7, Tomm7-F (ATCCGCTGGGGCTTTATTCC), Tomm7-R (CGACGGTTCAGGCATTCCA), transferrin, Trf-F (GCTGTCCCTGACAAAACGGT), Trf-R (CGGAAGGACGGTCTTCATGTG).
2.14. ADCK2 Silencing by siRNA
Small inhibitory RNAs (siRNA) against human ADCK2 (Hs_ADCK2_6) were purchased from Qiagen (Hilden, Germany) and had the following sequences: sense strand 5’-GAUUGACCUGCGUUACGAA-3′, antisense strand 5′-UUCGUAACGCAGGUCAAUC-3’, and the target sequence 5’-CAGATTGACCTGTACGAA-3’. Cells were seeded in a 60-mm dish at 3.5 × 10⁵ cells/plate 24 h prior to transfection and were then transfected with 0.4 nmol of siRNA using oligofectamine (Invitrogen) as transfection reagent. Cells were harvested and analyzed 72 h after transfection. The knockdown of ADCK2 was confirmed by quantitative real-time PCR.
2.15. Antibodies
Primary antibodies were used against ADCK2 (custom antibody from Biomedal, 1:1000), ADCK2 (Byorbit, orb100461, 1:500), translocase of outer mitochondrial membrane 20 (Tomm20) (Santa Cruz, sc-11415, 1:10000), mitochondrial dynamin like GTPase (Opa1) (BD Biosciences, 612606, 1:1000), ornithine aminotransferase (OAT) (Acris Antibodies, AMO9362PU-S, 1:1000), Calnexin (Stressgen, ADI-SPA-860, 1:1500), mitofusin 2 (Mfn2) (Abcam, ab50843, 1:1000) and lactate dehydrogenase (LDH) (Rockland, 100-1173, 1:2000).
2.16. Statistics
Statistical comparisons between animals of both genotypes were assessed using paired Student’s t-test. Analyses were performed using Excel 2010 (Microsoft Corp., Redmond, WA, USA). LogRank statistical analyses were performed using Sigmastat 3.5 (Systat Software Inc, San Jose, CA, USA). For behavior tests, comparisons between groups were made using a Student’s t-test, and the differences between sessions were analyzed with repeated measures ANOVA using SPSS 18 software (Madrid, Spain). Results are expressed as the mean ± SD and differences were considered significant at p values ≤ 0.05.
3. Results
3.1. Haploinsufficiency of Human ADCK2 Caused a Defect in Lipid Catabolism and CoQ10-Deficient Myopathy
The index patient, a 50-year-old man, (subject II-3 (Figure S1A)), developed a slow, progressive proximal muscle weakness with permanent myalgia both at rest and during muscular exertion, resulting in permanent disability. In the end, the patient required a wheelchair. Muscle MRI revealed severe fatty degeneration of the shoulder girdle, deltoid, biceps, hamstring, and calf muscles, whilst the triceps was well preserved (Figure S1B). The patient developed a lipid storage myopathy and liver dysfunction. Histological analysis of skeletal muscle demonstrated mitochondrial myopathy associated with lipid droplets (Figure 1A). The patient had normal cognitive function and did not show ataxia. Analysis of the mitochondrial genome was negative. Sequencing of a set of genes potentially involved with primary or secondary CoQ deficiency showed the heterozygous NM_052853.3:c.997C>T; p. (Arg333*) mutation in exon 2 of ADCK2 in both the forward and reverse sequences, which was absent in 50 subjects from the same ancestry. The variant is absent among the ~13,005 alleles listed on the National Heart, Lung, and Blood Institute (NHLBI) exome sequencing project exome variant server [50] and is not listed on the 1000 genomes project database, and has a minor allelic frequency (MAF) of 2:251,006 according to the Genome Aggregation Database of Broad Institute of Harvard University and Massachusetts Institute of Technology [51]. Although his mother and sister harbor the same mutation, they do not currently have any neuromuscular symptoms (Figure S1C). The mutation produced a termination codon that led to a significant decrease in ADCK2 mRNA and protein levels in dermal fibroblasts of the patient (II-3) and his sister (II-2) (Figure 1B–D), both showing a significant reduction in CoQ10 levels (Figure 1E). Transfection of these dermal fibroblasts with the WT ADCK2 allele rescued the ADCK2 mRNA levels (Figure 1F) and CoQ10 content (Figure 1G). The reduction in complexes I+III and II+III activities of muscle (Figure 1H) and dermal fibroblasts (Figure 1I) from II-3 and II-2 was indicative of a CoQ deficiency.
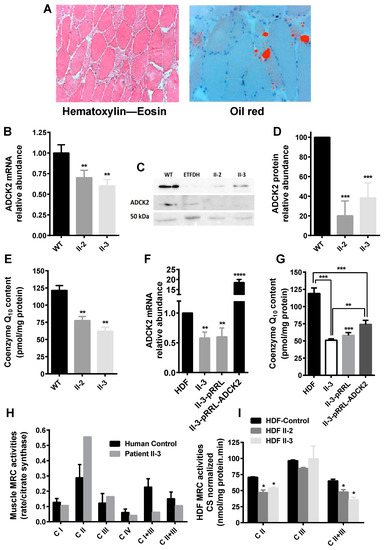
Figure 1.
Laboratory findings in the index patient. (A) Histological findings in muscle of patient II-3: (left picture) some fiber atrophy and fibers containing numerous vacuoles were apparent with the haematoxylin–eosin stain (×10); (right picture) Gomori trichrome stain showing lipid droplets in some muscle fibers (×20). (B) Measurement of the amount of aarF domain-containing mitochondrial protein kinase 2 (ADCK2) mRNA in cultured fibroblasts from II-3 and II-2 relative to controls. (C) Western blotting of ADCK2 in cultured fibroblasts from II-3 and II-2. (D) Quantification of the protein expression levels measured in (C). (E) Coenzyme Q (CoQ) content in dermal fibroblasts from patients II-3 and II-2 (n = 5). Expression level of ADCK2 mRNA (F) and CoQ content (G) in patient fibroblasts transformed with the ADCK2 wild type (WT) allele (n = 5). (H) Mitochondrial respiratory chain (MRC) activities in muscle biopsy of patient II-3 normalized to citrate synthase (CS). The complexes III and IV values shown are ×10−2. (I) MRC activities in human dermal fibroblasts (HDF) from control, patient II-3, and his sister II-2. * p < 0.05, ** p ≤ 0.01, *** p ≤ 0.005 vs. control/WT, **** p < 0.001 vs. non-transformed/empty vector; n = 10. Data were analyzed using Student’s t test.
We observed a moderate elevation in plasma levels of saturated short- and medium-chain length acyl-carnitine species (Table S1, Column 1), consistent with multiple acyl-CoA dehydrogenase deficiencies. Patient II-3 was treated with 75 mg CoQ10 per day (Figure S1B–E), showing an improvement in the plasma lactate and myoglobin levels (Figure S1). One month later, the patient stopped taking CoQ10, but after three weeks his pain worsened, his muscle strength decreased, and he lost the ability to lift his arms. Thus, it would appear that the symptoms were partially dependent on CoQ10. A complete description of the pathological phenotype of the patient is presented in the Supplementary Materials.
3.2. A Heterozygous Adck2 Knockout Mouse Model Recapitulated the Phenotype Observed in Patient II-3
A heterozygous (Adck2+/−) knockout mouse model was developed based on the high homology and sequence conservation of this gene across different species. The Adck2 mRNA expression was significantly lower in liver and heart, with a trend toward reduced expression in skeletal muscle, but without change in brain and kidney (Figure 2A). Adck2 protein was also decreased in heart, liver, and skeletal muscle, but was increased in both brain and kidney as compared to wild type (WT) littermates (Figure 2B,C). Heterozygote pups weighed significantly less at weaning than WT (Adck2+/−: 15.84 ± 0.64 g (n = 10), WT: 18.23 ± 0.35 g (n = 13), p ≤ 0.003) and showed a trend toward greater weight gain with age (Figure 2D). No significant difference in body weight was noted for most of the time points analyzed (Figure S2A) despite visceral fat accumulation (Figure S2B). Male Adck2+/− mice (12-month-old) showed significantly reduced overall endurance, as evidenced by shorter running distance on a treadmill due to exhaustion (Figure 2E) and poorer motor coordination on a rotarod (Figure 2F). A decline in two and four limb grip strength tests was also observed in the mutant mice (Figure 2G). Thus, Adck2 haploinsufficiency caused locomotor dysfunction in mice.
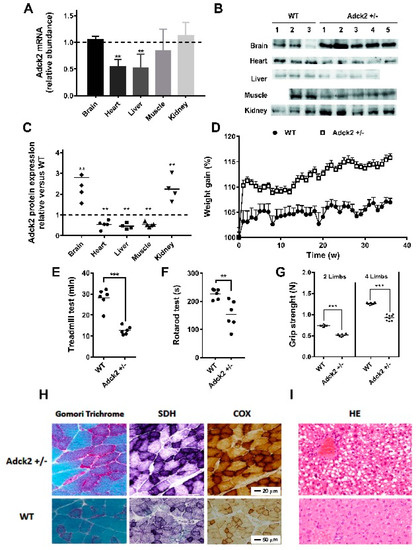
Figure 2.
Characteristics of the Adck2+/− mouse model. (A) Relative abundance of Adck2 mRNA levels in different tissues of Adck2+/− mice after normalization to WT controls, depicted as a dotted line. Bars represent mean + SD; ** p < 0.01 (n = 5 per group). (B) Western blot of ADCK2 protein in different mouse tissues. (C) Densitometry of ADCK2 protein levels from panel (B) (n = 4–5). (D) Weight gain trajectories of WT and Adck2+/− male mice on standard diet (n = 15). (E) Physical activity as determined by the running time on a treadmill until exhaustion. (F) The latency period before falling off an accelerating rotarod. (G) Grip strength capacity. ** p < 0.01 vs. WT; *** p < 0.005 vs. WT; n = 6. Data were analyzed by one-way ANOVA (D) and Student’s t test (panels A, B and E–G). (H) Skeletal muscle of Adck2+/− mice stained with Gomori trichrome, succinate dehydrogenase (SDH), and cytochrome c oxidase (COX) were compared to WT; 60× magnification. (I) Light microscopy of mouse Adck2+/− liver showing extensive steatosis compared to WT liver after hematoxylin and eosin (HE) staining; 40× magnification.
Pathological laboratory findings in the Adck2+/− mice included significant increases in plasma lactate (in mmol/L, 7.1 ± 0.2 for Adck2+/− vs. 3.4 ± 0.08 for WT; p < 0.05, n = 7) and accumulation of organic acids in the urine (Table S2). A non-significant increase in transaminases was observed in the plasma of six-month-old mice: glutamate-pyruvate transaminase/alanine transaminase (GPT/ALT) (in mg/dL, 52.2 ± 6.1 in WT and 56.3 ± 5.5 in Adck2+/−; p = 0.937, n = 5) and glutamic oxaloacetic transaminase/aspartate transaminase (GOT/AST) (in mg/dL, 464.8 ± 120 in WT and 660.7 ± 122 in Adck2+/−; p = 0.426, n = 5).
Gomori trichrome stain of gastrocnemius muscle from Adck2+/− mice showed a mild variation in fiber size, and some fibers might have been classified as ragged red fibers (Figure 2H). Both the succinate dehydrogenase (SDH) and cytochrome c oxidase (COX) staining were increased in Adck2+/− muscle fibers compared with WT (Figure 2H), consistent with mitochondrial proliferation. Hematoxylin and eosin (HE) analysis of liver from Adck2+/− mice showed an accumulation of large lipid droplets in periportal and perivenular hepatocytes compared to WT littermates (Figure 2I).
We performed memory and neurobehavioral assessments in 12-month-old Adck2+/− mice. Using the hot-plate test to measure the pain response, no differences were observed in both the latency period and the behavioral reaction to pain caused by heat (Figure S3A), indicating unaltered nociceptive information and emotional response in the Adck2+/− mice. The fear-conditioning test indicated that both groups of mice entered the dark compartment with similar latencies, and in the retention test WT and Adck2+/− mice displayed the same responses (Figure S3A). The novel object recognition (NOR) task evaluated short- and long-term memories. The total number of object contacts made by Adck2+/− mice was somewhat higher during the training session and after a latency period (Figure S3B). A tendency toward more extensive exploratory behavior of Adck2+/− mice in the open field test was recorded when compared to WT controls (Figure S3B). Similarly, there were no differences in the Recognition Index in any session in both groups of mice (Figure S3C). Taken together, these results demonstrated the absence of overt central nervous system pathology in Adck2+/− mice.
3.3. Adck2 Deficiency Caused CoQ Deficiency in MEFs and Skeletal Muscle
Similar to the patient’s fibroblasts and muscle, cultures of mouse embryonic fibroblasts (MEFs) isolated from nine day-old Adck2−/− and Adck2+/− embryos exhibited a significant reduction in both CoQ9 and CoQ10 levels (Figure 3A) and in their biosynthetic rates as determined by the incorporation of 14C-p-hydroxybenzoate (p-HB) (Figure 3B). ADCK2 knockdown by siRNA interference induced a significant decrease in CoQ biosynthesis rate in human MRC5 cells (Figure 3C). The rate of incorporation of the isoprenoid moiety in CoQ was measured by incubating MEFs with 3H-mevalonate in the presence of an excess of non-labeled p-HB. Regardless of the genotype, the levels of radiolabeled CoQ and cholesterol were unchanged in total MEF homogenates; however, the mitochondrial fraction of Adck2-deficient MEFs had significantly lower levels of both molecules, which indicated a defect in intracellular trafficking of isoprenoid and cholesterol from the cytoplasm, where they are synthesized de novo, in mitochondria (Figure 3D).
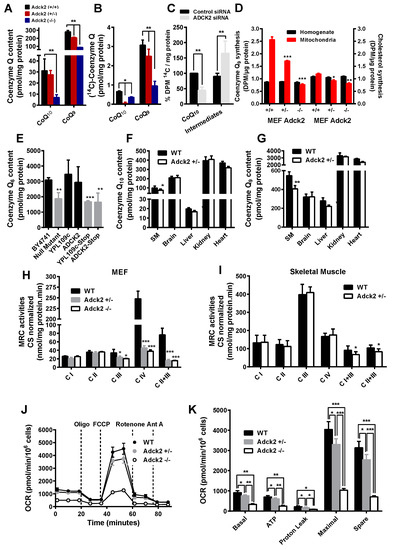
Figure 3.
Coenzyme Q content and MRC activities in cells and tissues. CoQ9 and CoQ10 content (A) and biosynthesis (B) in mice embryonic fibroblasts (MEFs) isolated from Adck2−/−, Adck2+/− and WT mice (n = 5). (C) Effect of siRNA silencing of ADCK2 on the rate of CoQ10 biosynthesis, measured by incorporation of 14C-p-hydroxybenzoate (14C-p-HB) intermediate, in MRC5 human fibroblasts (n = 4). (D) Levels of CoQ (first three sets of bars) and cholesterol (second three sets of bars) produced in the presence of 3H-mevalonate in total homogenates and mitochondrial fractions from MEFs. (E) CoQ6 content in BY4741 WT and ΔYPL109c (null mutant) yeast strains after transformation of ΔYPL109c with YPL109c WT or human ADCK2. Also, ΔYPL109c was transformed with mutant alleles of either YPL109c (YPL109c-stop) or ADCK2 (ADCK2-stop) (n = 7). The content in CoQ10 (F) and CoQ9 (G) was determined in various tissues and organs of Adck2+/− and WT mice (n = 5). MRC activities normalized to citrate synthase in MEFs (H) and skeletal muscle (I) of both WT and Adck2+/− mice. (J) and (K) Oxygen consumption rate (OCR) in WT, Adck2+/− and Adck2−/− MEFs. Bars are mean + SD. Data was analyzed by using repeated-measures ANOVA test. (n = 5); * p < 0.05, ** p < 0.01, and *** p < 0.005 vs. WT.
Complementation assays in Saccharomyces cerevisiae null strains have been employed to validate the role of ADCK2 in CoQ biosynthesis. The deletion of YPL109c, the S. cerevisiae homolog of human ADCK2, caused a 40% decrease in the production of CoQ6, the specific isoform in yeast (Figure 3E). Transformation of the ΔYPL109c yeast strain with wild type YPL109c or human ADCK2 construct rescued CoQ6 biosynthesis, whereas a mutant allele with a stop codon or the yeast gene with an equivalent stop codon failed to complement the mutant strain (Figure 3E).
CoQ9 and CoQ10 concentrations were also significantly lower in skeletal muscle of Adck2+/− mice compared to WT controls, with a downward trend in the heart and liver, but not in the brain or kidney of Adck2+/− animals (Figure 3F,G). Collectively, these results supported the role of ADCK2-encoded protein in the biosynthesis of mitochondrial CoQ in both mammal and yeast cells, mainly affecting skeletal muscle of Adck2+/− mice.
3.4. Adck2 Haploinsufficiency Caused Mitochondrial Dysfunction
Immunoblotting in various subcellular fractions of HEK293 cells showed a distribution of ADCK2 similar to the mitochondrial TOM20 and Mfn2 (Figure S4A,B). The presence of ADCK2 was not detected in the endoplasmic reticulum and cytosolic fraction. Both the translocase of outer mitochondrial membrane 20 (Tomm20) and calnexin, a protein present in the mitochondrial-enriched fraction and endoplasmic reticulum, were susceptible to proteinase K treatment, whereas the inner mitochondrial membrane protein OPA1, the matrix protein ornithine aminotransferase, and ADCK2 were resistant to this treatment. However, mitochondrial membrane disruption with the detergent Triton X-100 prior to proteinase K treatment caused the digestion of ADCK2, consistent with its presence in the mitochondrial matrix or bound to the inner mitochondrial membrane (Figure S4C).
The urinary excretion of organic acids, such as lactate, was significantly increased in Adck2+/− mice (Table S2), as was the blood lactate level (in mmol/L, 7.1 ± 0.2 for Adck2+/− versus 3.4 ± 0.08 for WT; p < 0.05, n = 7), indicating possible defects in mitochondrial oxidative metabolism. MEFs isolated from mutant mice embryos showed a significant decrease in mitochondrial complexes III, II+III, and IV activities (Figure 3H). Mitochondrial complex I+III and II+III activities were significantly decreased in Adck2+/− skeletal muscle, but the activities of the individual complexes were normal (Figure 3I). In contrast, complex I, II, and I+III activities were significantly higher in kidney mitochondria of Adck2+/− mice, whilst those of complex III, IV, and II+III were not affected (Figure S5A). The mitochondrial respiratory complexes were unaffected in the brain and liver of Adck2+/− mice (Figure S5B,C). The analysis of oxygen consumption rate (OCR) using the Seahorse XF Extracellular Flux Analyzer showed a significant difference in basal and maximum respiration in WT compared to Adck2+/− and Adck2−/− MEFs when glucose was used as substrate (Figure 3J,K). Taken together, these data suggested that ADCK2 deficiency impaired the normal MRC function in MEFs and skeletal muscle mitochondria ultimately leading to mitochondrial dysfunction.
3.5. Adck2 Haploinsufficiency Decreased Mitochondrial Fatty Acid β-Oxidation Required to Promote Cellular Growth
Here, we tested the hypothesis that ADCK2 is required to meet the energy demands for cellular growth by upregulating mitochondrial FA β-oxidation. As anticipated, WT and Adck2+/− MEF growth rate was reduced when maintained in low glucose medium (e.g., 1 g/L glucose) (Figure 4A). Addition of FA to medium at a low glucose concentration increased the proliferation of WT, but not mutant MEFs, whereas FA supplementation to glucose-free medium caused more than 50% growth arrest of Adck2+/− MEFs compared to WT cells (Figure 4A). Moreover, palmitate-dependent OCR decreased in permeabilized MEFs lacking Adck2 compared to WT cells (Figure 4B). The results of these combined studies indicated that ADCK2 was required to meet the energy demands for cell growth via FA β-oxidation.
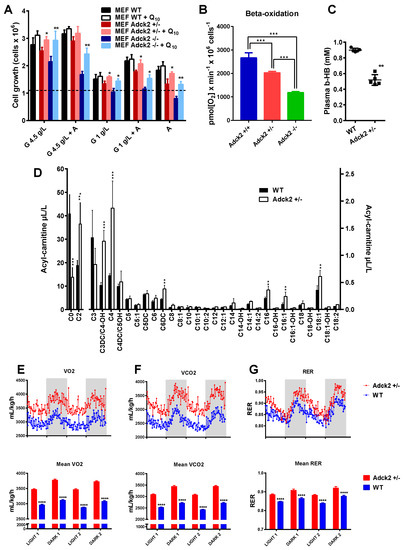
Figure 4.
Metabolic changes associated with Adck2 insufficiency. (A) Effects of glucose and FA as carbon source on cell proliferation. MEFs were grown for 72 h in media containing either high glucose (4.5g/L), low glucose (1g/L), or 1 mg/mL fatty acids (‘A’, AlbuMax©) supplemented or not with 30 nM CoQ10. * p ≤ 0.05, ** p ≤ 0.01 vs. non-supplemented; (n = 5). (B) Oxygen consumption rate of MEFs using palmitate as substrate. (C) Circulating concentrations of β-hydroxybutyrate in Adck2+/− and WT mice. ** p ≤ 0.01 vs. WT. (D) Acyl-carnitine profile measured in plasma of WT and Adck2+/− mice. ** p ≤ 0.01, *** p ≤ 0.005 vs. WT. Metabolic cages analysis of O2 consumption (E), CO2 production (F), and respiratory exchange ratio (RER) (G) during two fed–fasted periods comparing Adck2+/− and WT mice (n = 6). **** p < 0.001 vs. WT. Data were analyzed using Student’s t test.
Defects in mitochondrial FA oxidation have been linked with lower plasma β-hydroxybutyrate levels [52]. Here, circulating concentrations of β-hydroxybutyrate (Figure 4C) and free carnitine (Figure 4D) were significantly reduced, while short- and long-chain fatty acid levels were higher in male Adck2+/− mice compared to WT littermates (Figure 4D). Significantly higher urinary excretion of adipic and ethylmalonic acids was found in Adck2+/− mice (Table S2). These phenotypic changes were reminiscent of the patient’s impairment in FA oxidation.
Next, we used the indirect respiration calorimetry system (CLAMS metabolic chamber) to determine the preferred source of energy (fat vs. carbohydrates) for WT and Adck2+/− mice [48]. The respiratory exchange ratio (RER) is calculated using the ratio of CO2 produced over O2 consumed; RER of 1.0 indicates the predominant use of carbohydrates for energy production while RER of 0.7 is indicative of the preferential use of lipids as fuel source. Adck2+/− mice showed significantly higher oxygen consumption (Figure 4E), CO2 production (Figure 4F), and RER (~0.9) as compared to WT mice that had a RER of ~0.85 (Figure 4G). These data were consistent with greater use of carbohydrates by the mutant mice and consumption of a mix of fat and carbohydrates by the WT.
3.6. Adck2 Haploinsufficiency Affected the Gene Expression Profile in Muscle and Liver
To further characterize the effect of Adck2 haploinsufficiency, we performed microarray assays of RNA isolated from skeletal muscle and liver of WT and Adck2+/− mice. Heat map analysis showed extensive changes in the global transcript expression levels between WT and Adck2+/− in these tissues (Figure S6A,B). Principal component analysis based on significant Z-scores demonstrated a clear effect of Adck2 haploinsufficiency in muscle (Figure 5A) and liver (Figure 5C). Ingenuity pathway analysis indicated a robust induction in the expression of genes related to muscle development and different myopathic conditions upon Adck2 depletion (Figure 5B, Table S3). Major regulated genes included several biomarkers of muscle diseases, such as Car3, Fbxo32, and Ttid, which are overexpressed in Duchene muscle dystrophy and muscle atrophy. Additionally, Gde1, which is involved in skeletal muscle development, Pdlim5, a promoter of cardiac hypertrophy, and Ppp1cb, a regulator of cell division, glycogen metabolism, and muscle contractility, were overexpressed. Among the repressed genes included those implicated in muscle contractility such as Phpt1 and Fxyd1. Several subunits of both cytosolic and mitochondria ribosomes (Rps26, Mrpl52, and Rpl28) and genes related to the control of cell proliferation, apoptosis, and mitochondrial morphology (Romo1 and Lgals1) were also repressed in Adck2+/− muscle. Gene ontology enrichment analysis demonstrated that mitochondrial metabolism and diverse ion transport pathways were affected with concomitant repression in the activities of mitochondrial respiratory complexes, ribosomes, and protein synthesis (Table S4). Figure S6C summarizes the metabolic pathways affected by Adck2 insufficiency in mouse skeletal muscle based on the information obtained from microarrays (Table S4).
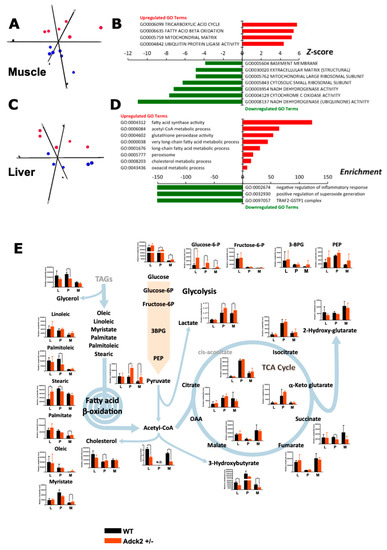
Figure 5.
Transcriptome and metabolomics analyses in Adck2+/− mice. (A) Principal component analysis from microarray results in skeletal muscle of Adck2+/− (red symbols) and WT (blue symbols) mice (n = 6 per group). (B) Bars depict gene ontology (GO) pathways significantly regulated in skeletal muscle of Adck2+/− vs. WT animals. (C) Principal component analysis from microarray results in liver of Adck2+/− (red) and WT (blue) mice (n = 6 per group). (D) Bars depict GO pathways significantly regulated in liver of Adck2+/− vs. WT animals. (E) Metabolite profiles in skeletal muscle (M), liver (L), and plasma (P) of Adck2+/− and WT mice at 12 months of age are depicted. Results indicated major affected components of glycolysis and FA β-oxidation pathways, as well as the Krebs cycle (n = 6 per group). Acetyl-CoA was determined independently by HPLC in liver and skeletal muscle. N.D. Non determined. All data are n = 5–6 biological replicates per experimental group. * p < 0.05, ** p < 0.01 vs. WT. Data were analyzed using Student’s t test.
Among the most significantly activated genes in the liver of Adck2+/− mice (Table S5) were four cytochrome P450s, two genes related with lipoproteins (Vldlr, Srebp2), a number of genes involved in the metabolism of cholesterol (Mvd), fatty acids (Aacs, Acot1, Acot2, Acot4, Crat, Elovl1, Fasn) and other organic acids (Pgpep1, Pdk4). Gene ontology analysis showed a general activation of FA metabolism (Figure 5D, Table S6), which could explain the liver steatosis in Adck2+/− mice. There was also an enrichment of genes associated with the metabolism of organic acid, purine, and cholesterol. Top down-regulated genes featured those implicated both in the repression of interleukin production and inactivation of the c-Jun N-terminal kinase pathway, consistent with activation of the hepatic inflammatory response (Figure 5D. Table S6). Expression of the DNA methyltransferase Dnmt3b was significantly higher and that of Gstp1 was significantly lower in the Adck2+/− liver, supporting the idea of an uptick in hepatic inflammation [53]. Microarray gene expression profiles in muscle and liver were validated by quantitative real-time PCR (Table S7).
3.7. Adck2 Haploinsufficiency Affected the Metabolomics Profile
To better understand the metabolic adaptation of mice to Adck2 insufficiency, we performed untargeted metabolomics in the liver, plasma, and skeletal muscle of 12-month-old mice of both genotypes. The metabolite profile was compatible with mitochondrial dysfunction in skeletal muscle and defective mitochondrial fatty acid oxidation in the liver and muscle of Adck2+/− mice (Figure 5E).
Accumulation of pyruvate and lactate in plasma and skeletal muscle of the mutant mice was consistent with mitochondrial dysfunction, which decreased acetyl-CoA availability for the Krebs cycle in muscle and liver (Figure 5E). The altered production and/or clearance of these intermediates may have accounted for the significant accumulation of glucose and glucose-6-phosphate, along with a positive trend toward other glycolytic intermediates. The decrease in the Krebs cycle intermediate succinate, a mitochondrial complex II substrate and novel regulator of metabolic signaling [54], is worth of mention.
The defect in mitochondrial FA β-oxidation in Adck2+/− mice (Figure 4) was consistent with the significant decrease of β-hydroxybutyrate and glycerol, and a trend of cholesterol increase in plasma of Adck2+/− mice supported a lipid metabolism disorder. This was further evidenced by the accumulation of free FA such as linoleic, myristic, and palmitic in tissues (notably stearic acid in the liver) and their decrease in plasma. Such bioenergetics defects in Adck2+/− mice may have explained the in vivo metabolic cage data (Figure 4G).
3.8. CoQ Supplementation Partially Rescued the Adck2+/− Phenotype
The effect of CoQ10 supplementation in Adck2+/− mice was carried out to determine whether CoQ deficiency per se contributed to the overall phenotypic changes. Daily treatment of male Adck2+/− mice with 15 mg/kg CoQ10 for three months induced a significant decrease in plasma lactate levels (Figure 6A), significantly improved both the treadmill endurance exercise time (Figure 6B) and grip strength (Figure 6C). Significant incorporation of CoQ10 was found in skeletal muscle of Adck2+/−, but not WT mice (Figure 6D).
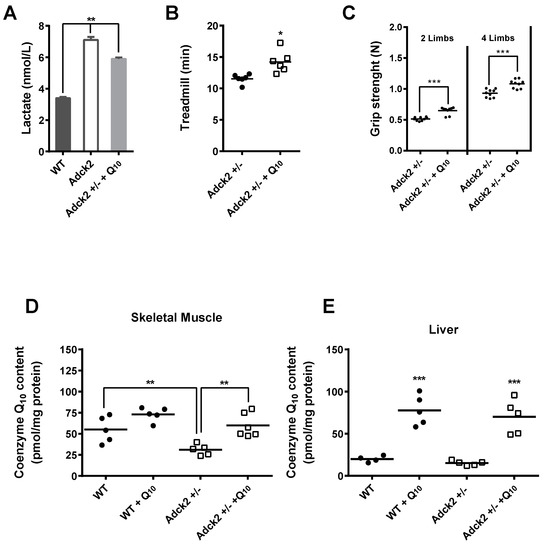
Figure 6.
Supplementation with CoQ10 partially rescued the Adck2+/− phenotype. (A) Six-month-old Adck2+/− mice were treated or not with 15 mg/kg of CoQ daily for three months followed by the determination of plasma lactate. (B) Running capacity on treadmill. (C) Grip strength (n = 6). CoQ10 content in skeletal muscle (D) and liver (E) of both WT and Adck2+/− mice in the absence and presence of CoQ supplementation (n = 7). * p ≤ 0.05, ** p ≤ 0.01, *** p ≤ 0.005 vs. non-treated animals. Data were analyzed by Student’s t test.
Supplementation also induced an increase of CoQ10 in liver of both Adck2+/− and WT mice (Figure 6E). Although the effect was not significant, CoQ ingestion caused a ~11% reduction in serum transaminases in Adck2+/− mice: GPT/ALT (in mg/dL, 50.5 ± 4.7 in CoQ-treated vs. 56.3 ± 5.5 in non-treated; p = 0.851, n = 7) and GOT/AST (in mg/dL, 578 ± 120 in CoQ-treated vs. 660.7 ± 122 in non-treated; p = 0.236, n = 7). These results demonstrated a partial role of CoQ deficiency in the pathogenesis of the Adck2+/− mouse myopathy and liver dysfunction.
4. Discussion
In the work herein, we have demonstrated the involvement of ADCK2 in the mitochondrial import of CoQ precursors and the impact that a heterozygous nonsense mutation in ADCK2 has on mitochondrial function and the rate of FA oxidation in skeletal muscle of a patient and in a mouse model. As the patient showed a late onset of the disease, we have studied adult animals ranging from 6 to 12 months old. A nonsense mutation in one ADCK2 allele led to the development of severe mitochondrial myopathy in a human patient that appeared responsive to CoQ supplementation.
The sister of this patient also harbors the ADCK2 mutation, but she did not complain of neuromuscular symptoms at this time. Nevertheless, she displayed CoQ deficiency in cultured fibroblasts. Adult onset autosomal dominant diseases often display incomplete penetrance and variable expressivity. This is consistent with the detection of the same ADCK2 mutation in two apparently healthy controls in the gnomAD database. Several factors may act as phenotype modifiers in dominant disorders. In the case of facioscapulohumeral dystrophy, estrogens appear to have a protective role [55], but many other genetic and environmental factors may influence the phenotype.
There are at least two reports of patients with isolated myopathy associated with muscle CoQ deficiency and abnormal acyl-carnitine profile in the absence of brain involvement [56,57], both were isolated cases as our patient, and a definite genetic diagnosis was never achieved.
All proteins participating in the CoQ biosynthesis pathway are nuclear-encoded and are differentially expressed in various tissues and organs, and CoQ content in liver and muscle can fluctuate in response to nutritional or other stressful conditions [58,59]. ADCK2 was demonstrated here to participate in CoQ biosynthesis and its deficiency in mice worsened physical performance, consistent with muscle dysfunction without behavioral abnormalities [38], resembling the phenotype of the patient. CoQ deficiency is produced as a secondary consequence of defects in components of either oxidative phosphorylation or other mitochondrial pathways [16,17]. There is evidence for tissue-specific expression and function of various members of the ADCK family. Mutations in COQ8A and COQ8B (previously known as ADCK3 and ADCK4) have been shown to induce a decrease of CoQ in the cerebellum and kidney causing cerebellar ataxia and nephrotic syndrome, respectively [15,20,29]. Interestingly, Mfn2 has been demonstrated to contribute to the maintenance of the mitochondrial CoQ pool [13] and regulation of phospholipid transport into mitochondria through mitochondrial-associated membranes [60], in which both Mfn2 and ADCK2 colocalize (Figure S4). Furthermore, yeast strains lacking components of the endoplasmic reticulum–mitochondria encounter structure show destabilization of the CoQ6 biosynthesis complex (synthome), leading to impaired synthesis and depletion of mitochondrial CoQ6 pool [61]. We found that MEFs depended on Adck2 for the mitochondrial availability of mevalonate-derived isoprenoid side chain of CoQ and cholesterol, which would indicate its role in lipid transport into mitochondria.
Impairment in lipid metabolism associated with defects in both hepatic and skeletal muscle functions were observed in the patient and in Adck2 +/− mice. Defects in mitochondrial FA oxidation impair physical performance, causing exercise intolerance and reduced strength [62,63]. The mechanism by which ADCK2 haploinsufficiency alters FA catabolism implicates the accumulation of long- and short-chain fatty acids with lower free carnitine levels as noted in the plasma of the study participant and Adck2+/− mice. Substantial alterations in the urinary excretion of metabolites linked to the Krebs cycle and FA β-oxidation were found in mutant mice along with significant reduction in circulating β-hydroxybutyrate, which is derived from β–oxidation. Mice with muscle-specific deletion of acyl-CoA synthetase isoform-1 (Acsl1M−/−) or carnitine palmitoyltransferase-1 (Cpt1bM−/−) are less physically active and have higher circulating non-esterified FA and mitochondrial dysfunction [64,65]. Cpt1bM−/− mice also show poor metabolic adaptation and remodeling of glucose metabolism than when amino acids are used as fuel [64,66]. Similarly, Acsl1M−/− mice are severely hypoglycemic and have poor physical endurance combined with an increase in protein catabolism [65,67]. Here, we found that Adck2 deficiency caused defects in pathways of glucose metabolism in the liver and muscle and in MEFs, as shown by plasma lactate accumulation, decrease in respiration, and altered metabolomics profiles. The notion that Adck2 participates in skeletal muscle energy homeostasis was supported by comparative transcriptome and metabolome analyses together with measurement of mitochondrial activities in muscle fibers of WT and Adck2+/− mice.
Moreover, we carried out microarray analysis and metabolomics profile in liver to identify genes and metabolites impacted by Adck2 insufficiency, ultimately leading to hepatic mitochondrial dysfunction. These genes encoded enzymes involved in FA metabolism and Krebs cycle, detoxification pathways, mainly P450 genes, and inflammatory response via interleukin production and JNK pathway activation [68,69].
The phenotypes observed in response to ADCK2 depletion indicated the importance of this gene in pathways involved in mitochondrial FA oxidation and skeletal muscle metabolic regulation. The partial recovery in physical performance combined with the lowering in plasma lactate levels in the II-3 patient and Adck2+/− mice upon CoQ supplementation indicated the possibility of improving some of the defects stemming from CoQ deficiency.
In conclusion, ADCK2 haploinsufficiency caused an adult onset myopathy with CoQ deficiency, and an overall defect in mitochondrial lipid metabolism, with incomplete penetrance. The heterozygous inactivation of Adck2 in mouse model recapitulated the human disease. We surmise that ADCK2 participates in the control of mitochondrial FA β-oxidation and CoQ levels in skeletal muscle by affecting the transport of lipids into mitochondria, which is required for both the formation of CoQ isoprenoids side chain and FA oxidation. From a clinical point of view, isolated myopathies and myopathies with lipid accumulation should be tested for this ADCK2 gene defect because they are likely to be responsive to CoQ supplementation.
Supplementary Materials
The following are available online at https://www.mdpi.com/2077-0383/8/9/1374/s1, Figure S1: Laboratory findings in the index patient, Figure S2: Adck2+/− mouse phenotype, Figure S3: Behavioral properties of Adck2+/− mice, Figure S4: DCK2 protein is located inside mitochondria, Figure S5: Mitochondria properties of mouse tissues, Figure S6: Microarray analysis in mouse skeletal muscle and liver, Table S1: Acyl-carnitine analysis in plasma from the index patient II-3, Table S2: Metabolites (mmol/mol creatinine) in urine of Adck2+/− and WT mice. (Reference internal standard ion: undecanodioic, 345), Table S3: Regulated genes in Adck2+/− mouse skeletal muscle, Table S4: Gene ontologies affected by Adck2 haploinsufficiency in mouse muscle, Table S5: Regulated genes in Adck2+/− mouse liver, Table S6: Gene ontologies affected by Adck2 haploinsufficiency in mouse liver, Table S7: Validation of gene expression analysis by quantitative real-time PCR.
Author Contributions
L.V.-F., C.S.-O., I.N.-E., I.G., M.V.C., A.S.-C., E.S., P.G.-R., A.B.C., J.C.R.-A., and Z.H. performed various biochemical analyses in cells and tissues. Mitochondrial localization experiments were carried out by L.S. Metabolite and lipid analyses in mice were done by A.R. and R.A. Z.H. performed DNA. and RNA. sequencing of the patient and family members. J.S. was responsible for the clinical investigations and S.J. organized and participated in the molecular and biochemical studies in the patient and his family. C.J. performed histological analysis in mice. I.N.-E. executed physical fitness testing in mice while the behavior tests were performed by S.Y.P.-S. and E.D.-d.-T. G.B.-C. and C.M. developed CoQ supplementation experiments and tissue incorporation of CoQ. J.D.H.-C. and G.L.-L. performed hepatic studies. D.J.M.F.-A., A.d.F., and R.d.C. carried out microarray analysis and interpretation of data. M.B., S.J., and P.N. wrote and edited the manuscript. P.N. coordinated the work and designed the mouse model. Funding acquisition: M.C.; Writing-review & editing, M.A.A.
Funding
This research was supported by grants from the Spanish Ministry of Health, Instituto de Salud Carlos III (ISCIII), PI17/01286 and Andalussian Government Excellence grant P12-CTS-943 to P.N., FIS PI17/00190 to R.A., by grants from Istituto di Ricerca Pediatrica Città della Speranza and Telethon Italy (GGP13222 and GGP14187c) to L.S., and the Intramural Research Program of National Institute on Aging, National Institutes of Health (NIA/NIH) (M.A.A., M.B. and R.d.C.). L.V.-F. doctoral thesis was directed by C.S.-O. I.N.-E. and A.d.F. were postdoctoral fellows at National Institute on Aging, National Institutes of Health (NIA/NIH).
Acknowledgments
The authors thank the patient and his family for their participation. We would also like to thank GeriMed for their kind gift of ubiquinol to the patient.
Conflicts of Interest
The authors declare no competing financial interest.
References
- Smith, R.L.; Soeters, M.R.; Wust, R.C.I.; Houtkooper, R.H. Metabolic Flexibility as an Adaptation to Energy Resources and Requirements in Health and Disease. Endocr. Rev. 2018, 39, 489–517. [Google Scholar] [CrossRef] [PubMed]
- Mitchell, S.J.; Bernier, M.; Mattison, J.A.; Aon, M.A.; Kaiser, T.A.; Anson, R.M.; Ikeno, Y.; Anderson, R.M.; Ingram, D.K.; de Cabo, R. Daily Fasting Improves Health and Survival in Male Mice Independent of Diet Composition and Calories. Cell Metab. 2019, 29, 221–228. [Google Scholar] [CrossRef] [PubMed]
- Cortassa, S.; Aon, M.A.; O’Rourke, B.; Jacques, R.; Tseng, H.J.; Marban, E.; Winslow, R.L. A computational model integrating electrophysiology, contraction, and mitochondrial bioenergetics in the ventricular myocyte. Biophys. J. 2006, 91, 1564–1589. [Google Scholar] [CrossRef] [PubMed]
- Barclay, C.J. Energy demand and supply in human skeletal muscle. J. Muscle. Res. Cell Motil. 2017, 38, 143–155. [Google Scholar] [CrossRef] [PubMed]
- Alcazar-Fabra, M.; Navas, P.; Brea-Calvo, G. Coenzyme Q biosynthesis and its role in the respiratory chain structure. Biochim. Biophys. Acta 2016, 1857, 1073–1078. [Google Scholar] [CrossRef] [PubMed]
- Kuzmiak-Glancy, S.; Willis, W.T. Skeletal muscle fuel selection occurs at the mitochondrial level. J. Exp. Biol. 2014, 217, 1993–2003. [Google Scholar] [CrossRef] [PubMed]
- Lapuente-Brun, E.; Moreno-Loshuertos, R.; Acin-Perez, R.; Latorre-Pellicer, A.; Colas, C.; Balsa, E.; Perales-Clemente, E.; Quiros, P.M.; Calvo, E.; Rodriguez-Hernandez, M.A.; et al. Supercomplex assembly determines electron flux in the mitochondrial electron transport chain. Science 2013, 340, 1567–1570. [Google Scholar] [CrossRef] [PubMed]
- Grunert, S.C. Clinical and genetical heterogeneity of late-onset multiple acyl-coenzyme A dehydrogenase deficiency. Orph. J. Rare Dis. 2014, 9, 117. [Google Scholar] [CrossRef] [PubMed]
- Chokchaiwong, S.; Kuo, Y.T.; Hsu, S.P.; Hsu, Y.C.; Lin, S.H.; Zhong, W.B.; Lin, Y.F.; Kao, S.H. ETF-QO Mutants Uncoupled Fatty Acid beta-Oxidation and Mitochondrial Bioenergetics Leading to Lipid Pathology. Cells 2019, 8, 106. [Google Scholar] [CrossRef]
- Gempel, K.; Topaloglu, H.; Talim, B.; Schneiderat, P.; Schoser, B.G.; Hans, V.H.; Palmafy, B.; Kale, G.; Tokatli, A.; Quinzii, C.; et al. The myopathic form of coenzyme Q10 deficiency is caused by mutations in the electron-transferring-flavoprotein dehydrogenase (ETFDH) gene. Brain 2007, 130, 2037–2044. [Google Scholar] [CrossRef]
- Liang, W.C.; Ohkuma, A.; Hayashi, Y.K.; Lopez, L.C.; Hirano, M.; Nonaka, I.; Noguchi, S.; Chen, L.H.; Jong, Y.J.; Nishino, I. ETFDH mutations, CoQ10 levels, and respiratory chain activities in patients with riboflavin-responsive multiple acyl-CoA dehydrogenase deficiency. Neuromuscul. Disord. 2009, 19, 212–216. [Google Scholar] [CrossRef] [PubMed]
- Wen, B.; Li, D.; Shan, J.; Liu, S.; Li, W.; Zhao, Y.; Lin, P.; Zheng, J.; Li, D.; Gong, Y.; et al. Increased muscle coenzyme Q10 in riboflavin responsive MADD with ETFDH gene mutations due to secondary mitochondrial proliferation. Mol. Genet. Metab. 2013, 109, 154–160. [Google Scholar] [CrossRef] [PubMed]
- Mourier, A.; Motori, E.; Brandt, T.; Lagouge, M.; Atanassov, I.; Galinier, A.; Rappl, G.; Brodesser, S.; Hultenby, K.; Dieterich, C.; et al. Mitofusin 2 is required to maintain mitochondrial coenzyme Q levels. J. Cell Biol. 2015, 208, 429–442. [Google Scholar] [CrossRef] [PubMed]
- Gorman, G.S.; Chinnery, P.F.; DiMauro, S.; Hirano, M.; Koga, Y.; McFarland, R.; Suomalainen, A.; Thorburn, D.R.; Zeviani, M.; Turnbull, D.M. Mitochondrial diseases. Nature reviews. Dis. Primers 2016, 2, 16080. [Google Scholar] [CrossRef] [PubMed]
- Salviati, L.; Trevisson, E.; Doimo, M.; Navas, P. Primary Coenzyme Q10 Deficiency. In GeneReviews (R); Pagon, R.A., Adam, M.P., Ardinger, H.H., Wallace, S.E., Amemiya, A., Bean, L.J.H., Bird, T.D., Ledbetter, N., Mefford, H.C., Smith, R.J.H., et al., Eds.; University of Washington: Seattle, WA, USA, 2017. [Google Scholar]
- Kuhl, I.; Miranda, M.; Atanassov, I.; Kuznetsova, I.; Hinze, Y.; Mourier, A.; Filipovska, A.; Larsson, N.G. Transcriptomic and proteomic landscape of mitochondrial dysfunction reveals secondary coenzyme Q deficiency in mammals. Elife 2017, 6, e30952. [Google Scholar] [CrossRef]
- Yubero, D.; Montero, R.; Martin, M.A.; Montoya, J.; Ribes, A.; Grazina, M.; Trevisson, E.; Rodriguez-Aguilera, J.C.; Hargreaves, I.P.; Salviati, L.; et al. Secondary coenzyme Q10 deficiencies in oxidative phosphorylation (OXPHOS) and non-OXPHOS disorders. Mitochondrion 2016, 30, 51–58. [Google Scholar] [CrossRef] [PubMed]
- Vazquez Fonseca, L.; Doimo, M.; Calderan, C.; Desbats, M.A.; Acosta, M.J.; Cerqua, C.; Cassina, M.; Ashraf, S.; Hildebrandt, F.; Sartori, G.; et al. Mutations in COQ8B (ADCK4) found in patients with steroid-resistant nephrotic syndrome alter COQ8B function. Hum. Mut. 2018, 39, 406–414. [Google Scholar] [CrossRef]
- Xie, L.X.; Hsieh, E.J.; Watanabe, S.; Allan, C.M.; Chen, J.Y.; Tran, U.C.; Clarke, C.F. Expression of the human atypical kinase ADCK3 rescues coenzyme Q biosynthesis and phosphorylation of Coq polypeptides in yeast coq8 mutants. Biochim. Biophys. Acta 2011, 1811, 348–360. [Google Scholar] [CrossRef]
- Stefely, J.A.; Licitra, F.; Laredj, L.; Reidenbach, A.G.; Kemmerer, Z.A.; Grangeray, A.; Jaeg-Ehret, T.; Minogue, C.E.; Ulbrich, A.; Hutchins, P.D.; et al. Cerebellar Ataxia and Coenzyme Q Deficiency through Loss of Unorthodox Kinase Activity. Mol. Cell 2016, 63, 608–620. [Google Scholar] [CrossRef]
- Stefely, J.A.; Reidenbach, A.G.; Ulbrich, A.; Oruganty, K.; Floyd, B.J.; Jochem, A.; Saunders, J.M.; Johnson, I.E.; Minogue, C.E.; Wrobel, R.L.; et al. Mitochondrial ADCK3 Employs an Atypical Protein Kinase-like Fold to Enable Coenzyme Q Biosynthesis. Mol. Cell 2015, 57, 83–94. [Google Scholar] [CrossRef]
- Blumkin, L.; Leshinsky-Silver, E.; Zerem, A.; Yosovich, K.; Lerman-Sagie, T.; Lev, D. Heterozygous Mutations in the ADCK3 Gene in Siblings with Cerebellar Atrophy and Extreme Phenotypic Variability. JIMD Rep. 2014, 12, 103–107. [Google Scholar] [CrossRef] [PubMed]
- Gerards, M.; van den Bosch, B.; Calis, C.; Schoonderwoerd, K.; van Engelen, K.; Tijssen, M.; de Coo, R.; van der Kooi, A.; Smeets, H. Nonsense mutations in CABC1/ADCK3 cause progressive cerebellar ataxia and atrophy. Mitochondrion 2010, 10, 510–515. [Google Scholar] [CrossRef]
- Horvath, R.; Czermin, B.; Gulati, S.; Demuth, S.; Houge, G.; Pyle, A.; Dineiger, C.; Blakely, E.L.; Hassani, A.; Foley, C.; et al. Adult-onset cerebellar ataxia due to mutations in CABC1/ADCK3. J. Neurol. Neurosurg. Psychiatry 2012, 83, 174–178. [Google Scholar] [CrossRef] [PubMed]
- Lagier-Tourenne, C.; Tazir, M.; Lopez, L.C.; Quinzii, C.M.; Assoum, M.; Drouot, N.; Busso, C.; Makri, S.; Ali-Pacha, L.; Benhassine, T.; et al. ADCK3, an ancestral kinase, is mutated in a form of recessive ataxia associated with coenzyme Q10 deficiency. Am. J. Hum. Genet. 2008, 82, 661–672. [Google Scholar] [CrossRef] [PubMed]
- Liu, Y.T.; Hersheson, J.; Plagnol, V.; Fawcett, K.; Duberley, K.E.; Preza, E.; Hargreaves, I.P.; Chalasani, A.; Laura, M.; Wood, N.W.; et al. Autosomal-recessive cerebellar ataxia caused by a novel ADCK3 mutation that elongates the protein: Clinical, genetic and biochemical characterisation. J. Neurol. Neurosurg. Psychiatry 2014, 85, 493–498. [Google Scholar] [CrossRef]
- Mignot, C.; Apartis, E.; Durr, A.; Marques Lourenco, C.; Charles, P.; Devos, D.; Moreau, C.; de Lonlay, P.; Drouot, N.; Burglen, L.; et al. Phenotypic variability in ARCA2 and identification of a core ataxic phenotype with slow progression. Orphanet J. Rare Dis. 2013, 8, 173. [Google Scholar] [CrossRef]
- Mollet, J.; Delahodde, A.; Serre, V.; Chretien, D.; Schlemmer, D.; Lombes, A.; Boddaert, N.; Desguerre, I.; de Lonlay, P.; de Baulny, H.O.; et al. CABC1 gene mutations cause ubiquinone deficiency with cerebellar ataxia and seizures. Am. J. Hum. Genet. 2008, 82, 623–630. [Google Scholar] [CrossRef]
- Ashraf, S.; Gee, H.Y.; Woerner, S.; Xie, L.X.; Vega-Warner, V.; Lovric, S.; Fang, H.; Song, X.; Cattran, D.C.; Avila-Casado, C.; et al. ADCK4 mutations promote steroid-resistant nephrotic syndrome through CoQ10 biosynthesis disruption. J. Clin. Investig. 2013, 123, 5179–5189. [Google Scholar] [CrossRef]
- Simpson, K.J.; Selfors, L.M.; Bui, J.; Reynolds, A.; Leake, D.; Khvorova, A.; Brugge, J.S. Identification of genes that regulate epithelial cell migration using an siRNA screening approach. Nat. Cell biol. 2008, 10, 1027–1038. [Google Scholar] [CrossRef]
- Wiedemeyer, W.R.; Dunn, I.F.; Quayle, S.N.; Zhang, J.; Chheda, M.G.; Dunn, G.P.; Zhuang, L.; Rosenbluh, J.; Chen, S.; Xiao, Y.; et al. Pattern of retinoblastoma pathway inactivation dictates response to CDK4/6 inhibition in GBM. Proc. Natl. Acad. Sci. USA 2010, 107, 11501–11506. [Google Scholar] [CrossRef]
- Brough, R.; Frankum, J.R.; Sims, D.; Mackay, A.; Mendes-Pereira, A.M.; Bajrami, I.; Costa-Cabral, S.; Rafiq, R.; Ahmad, A.S.; Cerone, M.A.; et al. Functional viability profiles of breast cancer. Cancer Discov. 2011, 1, 260–273. [Google Scholar] [CrossRef] [PubMed]
- Schoolmeesters, A.; Brown, D.D.; Fedorov, Y. Kinome-wide functional genomics screen reveals a novel mechanism of TNFalpha-induced nuclear accumulation of the HIF-1alpha transcription factor in cancer cells. PLoS ONE 2012, 7, e31270. [Google Scholar] [CrossRef] [PubMed]
- Hughes, B.G.; Harrison, P.M.; Hekimi, S. Estimating the occurrence of primary ubiquinone deficiency by analysis of large-scale sequencing data. Sci. Rep. 2017, 7, 17744. [Google Scholar] [CrossRef] [PubMed]
- Alcazar-Fabra, M.; Trevisson, E.; Brea-Calvo, G. Clinical syndromes associated with Coenzyme Q10 deficiency. Essays Biochem. 2018, 62, 377–398. [Google Scholar] [CrossRef] [PubMed]
- Qiu, L.Q.; Lai, W.S.; Stumpo, D.J.; Blackshear, P.J. Mouse Embryonic Fibroblast Cell Culture and Stimulation. Bio-protocol 2016, 6, e1859. [Google Scholar] [CrossRef] [PubMed]
- Wrobel, G.; Kokocinski, F.; Lichter, P. AutoPrime: Selecting primers for expressed sequences. Genome Biol. 2004, 5, 11. [Google Scholar] [CrossRef]
- Richardson, A.; Fischer, K.E.; Speakman, J.R.; de Cabo, R.; Mitchell, S.J.; Peterson, C.A.; Rabinovitch, P.; Chiao, Y.A.; Taffet, G.; Miller, R.A.; et al. Measures of Healthspan as Indices of Aging in Mice-A Recommendation. J. Gerontol. A Biol. Sci. Med. Sci. 2016, 71, 427–430. [Google Scholar] [CrossRef]
- Aartsma-Rus, A.; van Putten, M. Assessing functional performance in the mdx mouse model. J. Vis. Exp. 2014, 85, e51303. [Google Scholar] [CrossRef]
- Calvino-Nunez, C.; Dominguez-del-Toro, E. Clonidine treatment delays postnatal motor development and blocks short-term memory in young mice. PLoS ONE 2014, 9, e114869. [Google Scholar] [CrossRef]
- Dornelles, A.; de Lima, M.N.; Grazziotin, M.; Presti-Torres, J.; Garcia, V.A.; Scalco, F.S.; Roesler, R.; Schroder, N. Adrenergic enhancement of consolidation of object recognition memory. Neurobiol. Learn. Mem. 2007, 88, 137–142. [Google Scholar] [CrossRef]
- Rodriguez-Aguilera, J.C.; Cortes, A.B.; Fernandez-Ayala, D.J.; Navas, P. Biochemical Assessment of Coenzyme Q10 Deficiency. J. Clin. Med. 2017, 6, 27. [Google Scholar] [CrossRef] [PubMed]
- Bentinger, M.; Tekle, M.; Brismar, K.; Chojnacki, T.; Swiezewska, E.; Dallner, G. Polyisoprenoid epoxides stimulate the biosynthesis of coenzyme Q and inhibit cholesterol synthesis. J. Biol. Chem. 2008, 283, 14645–14653. [Google Scholar] [CrossRef] [PubMed]
- Spinazzi, M.; Casarin, A.; Pertegato, V.; Salviati, L.; Angelini, C. Assessment of mitochondrial respiratory chain enzymatic activities on tissues and cultured cells. Nat. Protoc. 2012, 7, 1235–1246. [Google Scholar] [CrossRef] [PubMed]
- Salabei, J.K.; Gibb, A.A.; Hill, B.G. Comprehensive measurement of respiratory activity in permeabilized cells using extracellular flux analysis. Nat. Protoc. 2014, 9, 421–438. [Google Scholar] [CrossRef] [PubMed]
- Mitchell, S.J.; Madrigal-Matute, J.; Scheibye-Knudsen, M.; Fang, E.; Aon, M.; Gonzalez-Reyes, J.A.; Cortassa, S.; Kaushik, S.; Gonzalez-Freire, M.; Patel, B.; et al. Effects of Sex, Strain, and Energy Intake on Hallmarks of Aging in Mice. Cell Metab. 2016, 23, 1093–1112. [Google Scholar] [CrossRef]
- NCBI-GEO Database Repository. Available online: http://www.ncbi.nlm.nih.gov/geo/ (accessed on 1 August 2019).
- Mitchell, S.J.; Bernier, M.; Aon, M.A.; Cortassa, S.; Kim, E.Y.; Fang, E.F.; Palacios, H.H.; Ali, A.; Navas-Enamorado, I.; Di Francesco, A.; et al. Nicotinamide Improves Aspects of Healthspan, but Not Lifespan, in Mice. Cell Metab. 2018, 27, 667–676. [Google Scholar] [CrossRef]
- Fernandez-Ayala, D.J.; Guerra, I.; Jimenez-Gancedo, S.; Cascajo, M.V.; Gavilan, A.; Dimauro, S.; Hirano, M.; Briones, P.; Artuch, R.; De Cabo, R.; et al. Survival transcriptome in the coenzyme Q10 deficiency syndrome is acquired by epigenetic modifications: A modelling study for human coenzyme Q10 deficiencies. BMJ Open 2013, 3, e002524. [Google Scholar] [CrossRef]
- The National Heart, Lung, and Blood Institute (NHLBI) exome sequencing project exome variant server. Available online: http://evs.gs.washington.edu/EVS/ (accessed on 1 August 2019).
- The Genome Aggregation Database of Broad Institute of Harvard University and Massachusetts Institute of Technology. Available online: http://gnomad.broadinstitute.org (accessed on 1 August 2019).
- Newman, J.C.; Verdin, E. beta-Hydroxybutyrate: A Signaling Metabolite. Annu. Rev. Nutr. 2017, 37, 51–76. [Google Scholar] [CrossRef]
- Yu, Q.; Zhou, B.; Zhang, Y.; Nguyen, E.T.; Du, J.; Glosson, N.L.; Kaplan, M.H. DNA methyltransferase 3a limits the expression of interleukin-13 in T helper 2 cells and allergic airway inflammation. Proc. Natl. Acad. Sci. USA 2012, 109, 541–546. [Google Scholar] [CrossRef]
- Murphy, M.P.; O’Neill, L.A.J. Krebs Cycle Reimagined: The Emerging Roles of Succinate and Itaconate as Signal Transducers. Cell 2018, 174, 780–784. [Google Scholar] [CrossRef]
- Teveroni, E.; Pellegrino, M.; Sacconi, S.; Calandra, P.; Cascino, I.; Farioli-Vecchioli, S.; Puma, A.; Garibaldi, M.; Morosetti, R.; Tasca, G.; et al. Estrogens enhance myoblast differentiation in facioscapulohumeral muscular dystrophy by antagonizing DUX4 activity. J. Clin. Investig. 2017, 127, 1531–1545. [Google Scholar] [CrossRef] [PubMed]
- Horvath, R.; Schneiderat, P.; Schoser, B.G.; Gempel, K.; Neuen-Jacob, E.; Ploger, H.; Muller-Hocker, J.; Pongratz, D.E.; Naini, A.; DiMauro, S.; et al. Coenzyme Q10 deficiency and isolated myopathy. Neurology 2006, 66, 253–255. [Google Scholar] [CrossRef] [PubMed]
- Lalani, S.R.; Vladutiu, G.D.; Plunkett, K.; Lotze, T.E.; Adesina, A.M.; Scaglia, F. Isolated mitochondrial myopathy associated with muscle coenzyme Q10 deficiency. Arch. Neurol. 2005, 62, 317–320. [Google Scholar] [CrossRef] [PubMed]
- Stefely, J.A.; Pagliarini, D.J. Biochemistry of Mitochondrial Coenzyme Q Biosynthesis. Trends Biochem. Sci. 2017, 42, 824–843. [Google Scholar] [CrossRef] [PubMed]
- Parrado-Fernandez, C.; Lopez-Lluch, G.; Rodriguez-Bies, E.; Santa-Cruz, S.; Navas, P.; Ramsey, J.J.; Villalba, J.M. Calorie restriction modifies ubiquinone and COQ transcript levels in mouse tissues. Free Radic. Biol. Med. 2011, 50, 1728–1736. [Google Scholar] [CrossRef] [PubMed]
- Hernandez-Alvarez, M.I.; Sebastian, D.; Vives, S.; Ivanova, S.; Bartoccioni, P.; Kakimoto, P.; Plana, N.; Veiga, S.R.; Hernandez, V.; Vasconcelos, N.; et al. Deficient Endoplasmic Reticulum-Mitochondrial Phosphatidylserine Transfer Causes Liver Disease. Cell 2019, 177, 881–895. [Google Scholar] [CrossRef]
- Eisenberg-Bord, M.; Tsui, H.S.; Antunes, D.; Fernandez-Del-Rio, L.; Bradley, M.C.; Dunn, C.D.; Nguyen, T.P.T.; Rapaport, D.; Clarke, C.F.; Schuldiner, M. The Endoplasmic Reticulum-Mitochondria Encounter Structure Complex Coordinates Coenzyme Q Biosynthesis. Contact (Thousand Oaks) 2019, 2, 2515256418825409. [Google Scholar] [CrossRef] [PubMed]
- Rinaldo, P.; Matern, D.; Bennett, M.J. Fatty acid oxidation disorders. Annu. Rev. Physiol. 2002, 64, 477–502. [Google Scholar] [CrossRef]
- Schatz, U.A.; Ensenauer, R. The clinical manifestation of MCAD deficiency: Challenges towards adulthood in the screened population. J. Inherit. Metab. Dis. 2010, 33, 513–520. [Google Scholar] [CrossRef]
- Wicks, S.E.; Vandanmagsar, B.; Haynie, K.R.; Fuller, S.E.; Warfel, J.D.; Stephens, J.M.; Wang, M.; Han, X.; Zhang, J.; Noland, R.C.; et al. Impaired mitochondrial fat oxidation induces adaptive remodeling of muscle metabolism. Proc. Natl. Acad. Sci. USA 2015, 112, E3300–E3309. [Google Scholar] [CrossRef]
- Zhao, L.; Pascual, F.; Bacudio, L.; Suchanek, A.L.; Young, P.A.; Li, L.O.; Martin, S.A.; Camporez, J.P.; Perry, R.J.; Shulman, G.I.; et al. Defective fatty acid oxidation in mice with muscle-specific acyl-CoA synthetase 1 deficiency increases amino acid use and impairs muscle function. J. Biol. Chem. 2019, 294, 8819–8833. [Google Scholar] [CrossRef] [PubMed]
- Ghosh, S.; Wicks, S.E.; Vandanmagsar, B.; Mendoza, T.M.; Bayless, D.S.; Salbaum, J.M.; Dearth, S.P.; Campagna, S.R.; Mynatt, R.L.; Noland, R.C. Extensive metabolic remodeling after limiting mitochondrial lipid burden is consistent with an improved metabolic health profile. J. Biol. Chem. 2019, 294, 12313–12327. [Google Scholar] [CrossRef] [PubMed]
- Li, L.O.; Grevengoed, T.J.; Paul, D.S.; Ilkayeva, O.; Koves, T.R.; Pascual, F.; Newgard, C.B.; Muoio, D.M.; Coleman, R.A. Compartmentalized acyl-CoA metabolism in skeletal muscle regulates systemic glucose homeostasis. Diabetes 2015, 64, 23–35. [Google Scholar] [CrossRef] [PubMed]
- Kozawa, S.; Honda, A.; Kajiwara, N.; Takemoto, Y.; Nagase, T.; Nikami, H.; Okano, Y.; Nakashima, S.; Shimozawa, N. Induction of peroxisomal lipid metabolism in mice fed a high-fat diet. Mol. Med. Rep. 2011, 4, 1157–1162. [Google Scholar] [CrossRef] [PubMed]
- Schuster, S.; Cabrera, D.; Arrese, M.; Feldstein, A.E. Triggering and resolution of inflammation in NASH. Nat. Rev. Gastroenterol. Hepatol. 2018, 15, 349–364. [Google Scholar] [CrossRef] [PubMed]
© 2019 by the authors. Licensee MDPI, Basel, Switzerland. This article is an open access article distributed under the terms and conditions of the Creative Commons Attribution (CC BY) license (http://creativecommons.org/licenses/by/4.0/).