Article

Does the Organ-Based N Dilution Curve Improve the Predictions of N Status in Winter Wheat?

1
National Engineering and Technology Center for Information Agriculture, Nanjing Agricultural University, Nanjing 210095, China
2
Faculty of Veterinary and Agricultural Sciences, The University of Melbourne, Parkville, VIC 3010, Australia
3
Engineering Research Center of Smart Agriculture, Ministry of Education, Nanjing Agricultural University, Nanjing 210095, China
4
Key Laboratory for Crop System Analysis and Decision Making, Ministry of Agriculture and Rural Affairs, Nanjing Agricultural University, Nanjing 210095, China
5
Jiangsu Key Laboratory for Information Agriculture, Nanjing Agricultural University, Nanjing 210095, China
6
Jiangsu Collaborative Innovation Center for Modern Crop Production, Nanjing Agricultural University, Nanjing 210095, China
7
Institute for Sustainable Agro-ecosystem Services, The University of Tokyo. Department of Global Agricultural Studies, Graduate School of Agricultural and Life Sciences, The University of Tokyo, Tokyo 113-8654, Japan
*
Author to whom correspondence should be addressed.
Agriculture 2020, 10(11), 500; https://doi.org/10.3390/agriculture10110500
Submission received: 8 September 2020 / Revised: 12 October 2020 / Accepted: 22 October 2020 / Published: 26 October 2020
(This article belongs to the Special Issue Nitrogen Fertilization in Crop Production)

Abstract

:
Accurately summarizing Nitrogen (N) content as a prelude to optimal N fertilizer application is complicated during the vegetative growth period of all the crop species studied. The critical nitrogen (N) concentration (Nc) dilution curve is a stable diagnostic indicator, which performs plant critical N concentration trends as crop grows. This study developed efficient technologies for different organ-based (plant dry matters (PDM), leaf DM (LDM), stem DM (SDM), and leaf area index (LAI)) estimation of Nc curves to enrich the practical applications of precision N management strategies. Four winter wheat cultivars were planted with 10 different N treatments in Jiangsu province of eastern China. Results showed the SDM-based curve had a better performance than the PDM-based curve in N nutrition index (NNI) estimation, accumulated N deficit (AND) calculation, and N requirement (NR) determination. The regression coefficients ‘a’ and ‘b’ varied among the four critical N dilution models: Nc = 3.61 × LDM–0.19, R2 = 0.77; Nc = 2.50 × SDM–0.44, R2 = 0.89; Nc = 4.16 × PDM–0.41, R2 = 0.87; and Nc = 3.82 × LAI–0.36, R2 = 0.81. In later growth periods, the SDM-based curve was found to be a feasible indicator for calculating NNI, AND, and NR, relative to curves based on the other indicators. Meanwhile, the lower LAI-based curve coefficient variation values stated that leaf-related indicators were also a good choice for developing the N curve with high efficiency as compared to other biomass-based approaches. The SDM-based curve was the more reliable predictor of relative yield because of its low relative root mean square error in most of the growth stages. The curves developed in this study will provide diverse choices of indicators for establishing an integrated procedure of diagnosing wheat N status, and improving the accuracy and efficiency of wheat N fertilizer management.

1. Introduction

Nitrogen (N) is the main limiting nutrient element for crop production globally [1,2,3]. N management has always been a significant trouble in Chinese agricultural production, which has attracted the attention of crop scientists [4,5]. Excess N application negatively affects the growth of wheat and degrades natural environments [6]. Hence, N nutrient diagnosis is essential for crop N fertilizer precision application.
N uptake indicators (e.g., plant N uptake, leaf N uptake) are used to assess the N status of crops [4,7,8], though these indicators cannot comprehensively explain the trends in each growth stage. In 1981, Salette and Lemaire reported the ‘N dilution’ phenomenon, which was caused by changes in the biomass ratio of leaf to shoot during crop growth and self-shading of leaves [9,10]. In 1994, Justes et al. described that the critical N concentration (Nc) represents the minimum N level necessary to attain the maximum crop growth rate [11]. The N concentration of different crop organs shows different time-series trends during the various crop growing stages [12,13]. In recent years, agronomists have used the crop growth rate, leaf area index (LAI), and plant dry matter (PDM or DM) to calculate the Nc and its changes during crop growth [14,15]. These diagnostic indicators for crop N can be derived from the N concentration of different crop tissues (e.g., leaf, stem, and spike) or whole crops [15]. Furthermore, it was shown that critical N concentration trends are efficient for real-time estimation of N deficit, yield, or yield targets depending on various N rates in different sites [16,17].
Relative to the typical critical N calculation methods (plant dry matter (PDM)-based N dilution curves), many scholars have explored PDM (or DM) of different organs and leaf area index-based N dilution curves [15,18,19,20]. These new approaches redefined the N dilution concept and helped to develop crop simulation dynamic models in a physiologically functional manner, to overcome differences associated with genotypic and environmental factors [21]. Although PDM-based methods provide detailed information regarding N uptake in a crop, they ignore variations in the seasonal and spatial distribution of the crop N status [22]. Therefore, PDM-based approaches are hard to adapt to modern mechanized field production. Leaf area index (LAI) can be estimated by both non-destructive or destructive methods, and the latter generally relies on its relative accuracy and convenience [4]. Notably, LAI is a fundamental agronomic parameter for monitoring plant growth status, yield prediction, and optimization of fertilizer N management in agricultural management practices [17]. Vegetation remote sensing technology can be used to calculate PDM and LAI directly. However, the effect from the interaction between the sun radiance and plant canopies decreased the accuracy of PDM and LAI estimation [17,23,24].
The critical N dilution curves developed in recent decades are different from the classic ones, and most previous studies monitored the N concentration of individual leaves by non-destructive field methods [21,25,26]. While these methods exaggerated the proportion of N in structural tissues, they ignored the effects of the shading of upper leaves, abiotic stress, and decreased N concentration during the various growth stages [27]. Moreover, the partitioning of dry matter transforms the trends in dilution curve changes by redistributing the PDM/N and LAI/N relations, which declines the reliability of these methods [12]. Total aboveground PDM consists of leaf DM (LDM) [18], stem DM (SDM) [28], and spike DM [29], though the critical N concentration dilution curves are typically based on PDM. Although leaves are the major photosynthetic organs, LDM- and SDM-based curves of wheat have rarely been reported in recent years. Besides, leaves have a high response to N fertilization [30,31], while SDM is the main factor for determining whole-plant DM in later growth stages [19]. While both SDM and LDM significantly affect PDM during vegetative growth, SDM is considered the determinant of N dilution in the entire plant because SDM is always significantly higher than LDM in most growth stages [28]. However, the application of crop models is limited because most Nc curves in existing crop models were established more than 20 years ago, and were mostly developed based on PDM [32,33]. Thus, the development of new Nc models based on different organs is required to ensure multi-source data for the application of crop models. Besides, more studies are required to evaluate whether only one critical Nc dilution curve can be applied based on different crop parameters. Further, updates of the parameters of critical N dilution models are urgently required to expand the application of this concept.
To quantify the N dynamics in cropping systems, an understanding of N supply and demand, and the fundamental processes controlling N absorption and distribution in crop organs is required. Previous studies conducted under different climates developed the N dilution curves of winter wheat using PDM, LAI, and specific organs (leaf and stem). Subsequently, we comprehensively explored wheat N dilution curves on different tissues bases to determine the differences and the relationship among them. Furthermore, this present work also proposed to investigate the more reliable and robust plant basis or approach for in-season estimation of wheat N nutrition. This study was also the first-ever most comprehensive comparison of critical N curves in different genotypes and tissues in winter wheat. These results will provide various indicator choices for diagnosing wheat N status and guide the sustainability of intensive agricultural management.

2. Materials and Methods

2.1. Experimental Design and Crop Management

These field experiments involved 10 multi-N rates (0 to 360 kg ha−1), 4 winter wheat cultivars (including Ningmai13 (NM13), Xumai30 (XM30), Yangfumai4 (YFM4), and Huaimai20 (HM20)), and were carried out at 3 different locations in the Jiangsu province of eastern China. These four cultivars are the most farmer-preferred in the local planting region. Among them, NM13 and YFM4 are middle-maturing types, while XM30 and HM20 are mid-latter maturing types [34]. A plot size of 6 m × 8 m (48 m2) and a row spacing of 0.25 m were used in all experiments. All five trials were conducted in a completely randomized block design in three replications per experiment. Two equal splits were applied (50% before sowing and 50% at the jointing stage) for N fertilizer management. Before application, soil sampling was measured at a depth of 20 cm (this depth captures the potential root zone). For all treatments, potassium and phosphorus fertilizers were compounded into the soil before sowing as monocalcium phosphate (Ca(H2PO4)2, 105 kg P2O5 ha–1) and potassium chloride (KCl, 135 kg K2O ha–1). Detailed information on N rates, sampling, and soil characteristics are summarized in Table 1. Experiments 1, 2, and 3 were used to develop Nc curves based on different organ values; experiments 4 and 5 were applied to validate the performance of the established models.

2.2. Weather Information of Study Site

These three eco-sites (Rugao, Huai’an, and Sihong) are typically characterized by a subtropical monsoon climate with a hot rainy summer and a mild light rainy winter. The cumulated rainfall of these three sites ranged from 812.25 to 1143.25 mm, and a similar average temperature of these three sites approached to 15 °C. However, the daily distribution of rainfall and average temperature during the wheat growing season varies considerably among the three sites [35].

2.3. Plant Sampling and Measurement

About 20 coherent plants were taken at the tillering (Feekes 3), early jointing (before dressing, Feekes 6), late jointing (Feekes 7), booting (Feekes 10), heading (Feekes 10.5), and flowering (Feekes 10.7) stages as samples from each plot during the vegetative period in three sites. The samples included leaf (green leaf blade), spikes (when Feekes ≥ 10), and stems (culm plus sheath). The green leaf area was determined by a leaf meter (LI-3000, LI-COR, Lincoln, NE, USA), then the LAI was calculated by the number of plants and tillers per square meter. Samples were dried at 105 °C for about 30 min to halt metabolic processes, then drying was continued in an 80 °C forced-draft oven until a constant weight was attained. After, each sample was ground to powder, stored in a dried room at 20 °C, and then passed through a 1-mm-diameter sieve in a Wiley mill. During the N concentration-determined process, 0.2 g of powder were digested with H2O2 and H2SO4, then a continuous-flow auto-analyzer AA3 was used to determine N concentration (Bran + Luebbe, Hamburg, Germany). Grain yield was calculated at maturity based on the harvest from a 1 m2 random section in each plot, then dried to a 14% moisture content.

2.4. Statistical Analysis

According to the method proposed by Justes et al. in 1994 [11], the critical N points were measured by IBM, and SPSS Version 20.0 (IBM Corporation, Armonk, New York, NY, USA) was used for the analysis of variance in each year, sampling date, winter wheat cultivar, and general linear model (GLM) among agronomic indicators (like PDM, LDM, SDM, and LAI). Multiple comparisons tests were used (least-significant difference, LSD; p < 0.05) to detect significant pairwise treatment parameters.
The linear regression relationships between NNI and accumulated N deficit (AND) on a plant basis and those based on SDM, LDM, and LAI at each growth stage during the vegetative period were established using GraphPad Prism 5 software (GraphPad Software, San Diego, CA, USA).

2.4.1. Constructing Critical N Dilution Curves

Critical Nc curves (Equation (1)): where Nc means critical nitrogen (N) concentration, DM represents dry matters) were constructed following the procedures reported by Justes et al. [11]. Data of N sub-optimal N growth and supra-optimum N growth plots were used to develop the new models. This work defined sub-optimal N growth treatment according to whether N application significantly increased crop growth. Meanwhile, the supra-optimal N growth treatment represents N application, which cannot affect crop growth substantially. Since the measured Nc decreased with increasing LAI, LDM, PDM, and SDM, the allometric function (Freundlich model) was optimal.
N c = a × D M b ,

2.4.2. Maximum and Minimum N Dilution Curves

The maximum (Nmax) and minimum N dilution curves (Nmin) were established to set the ranges for the upper and lower limits. Nmax (the maximum or upper N uptake curve) was attained by increasing N treatments for the crop to achieve maximum N accumulation rates. Meanwhile, Nmin curves are described as a lower limit when N metabolism would soon stop. In this study, Nmin corresponds to the minimum N taken up by plants. The most excess N treatment data points represent Nmax, while Nmin was calculated using the most sub-optimal treatment data points for which the N rate was zero (N0 check plots) [11,36,37].

2.4.3. N Nutrition Index Calculation

NNI at each growth stage was calculated using Equation (2) [11]:
NNI = Na Nc ,
where Na represents the observed N concentration, while Nc means the critical or optimal N concentration. Once NNI = 1, N nutrition levels are optimal. Meanwhile, NNI < 1 or NNI > 1 represent limited and excess N status, respectively.

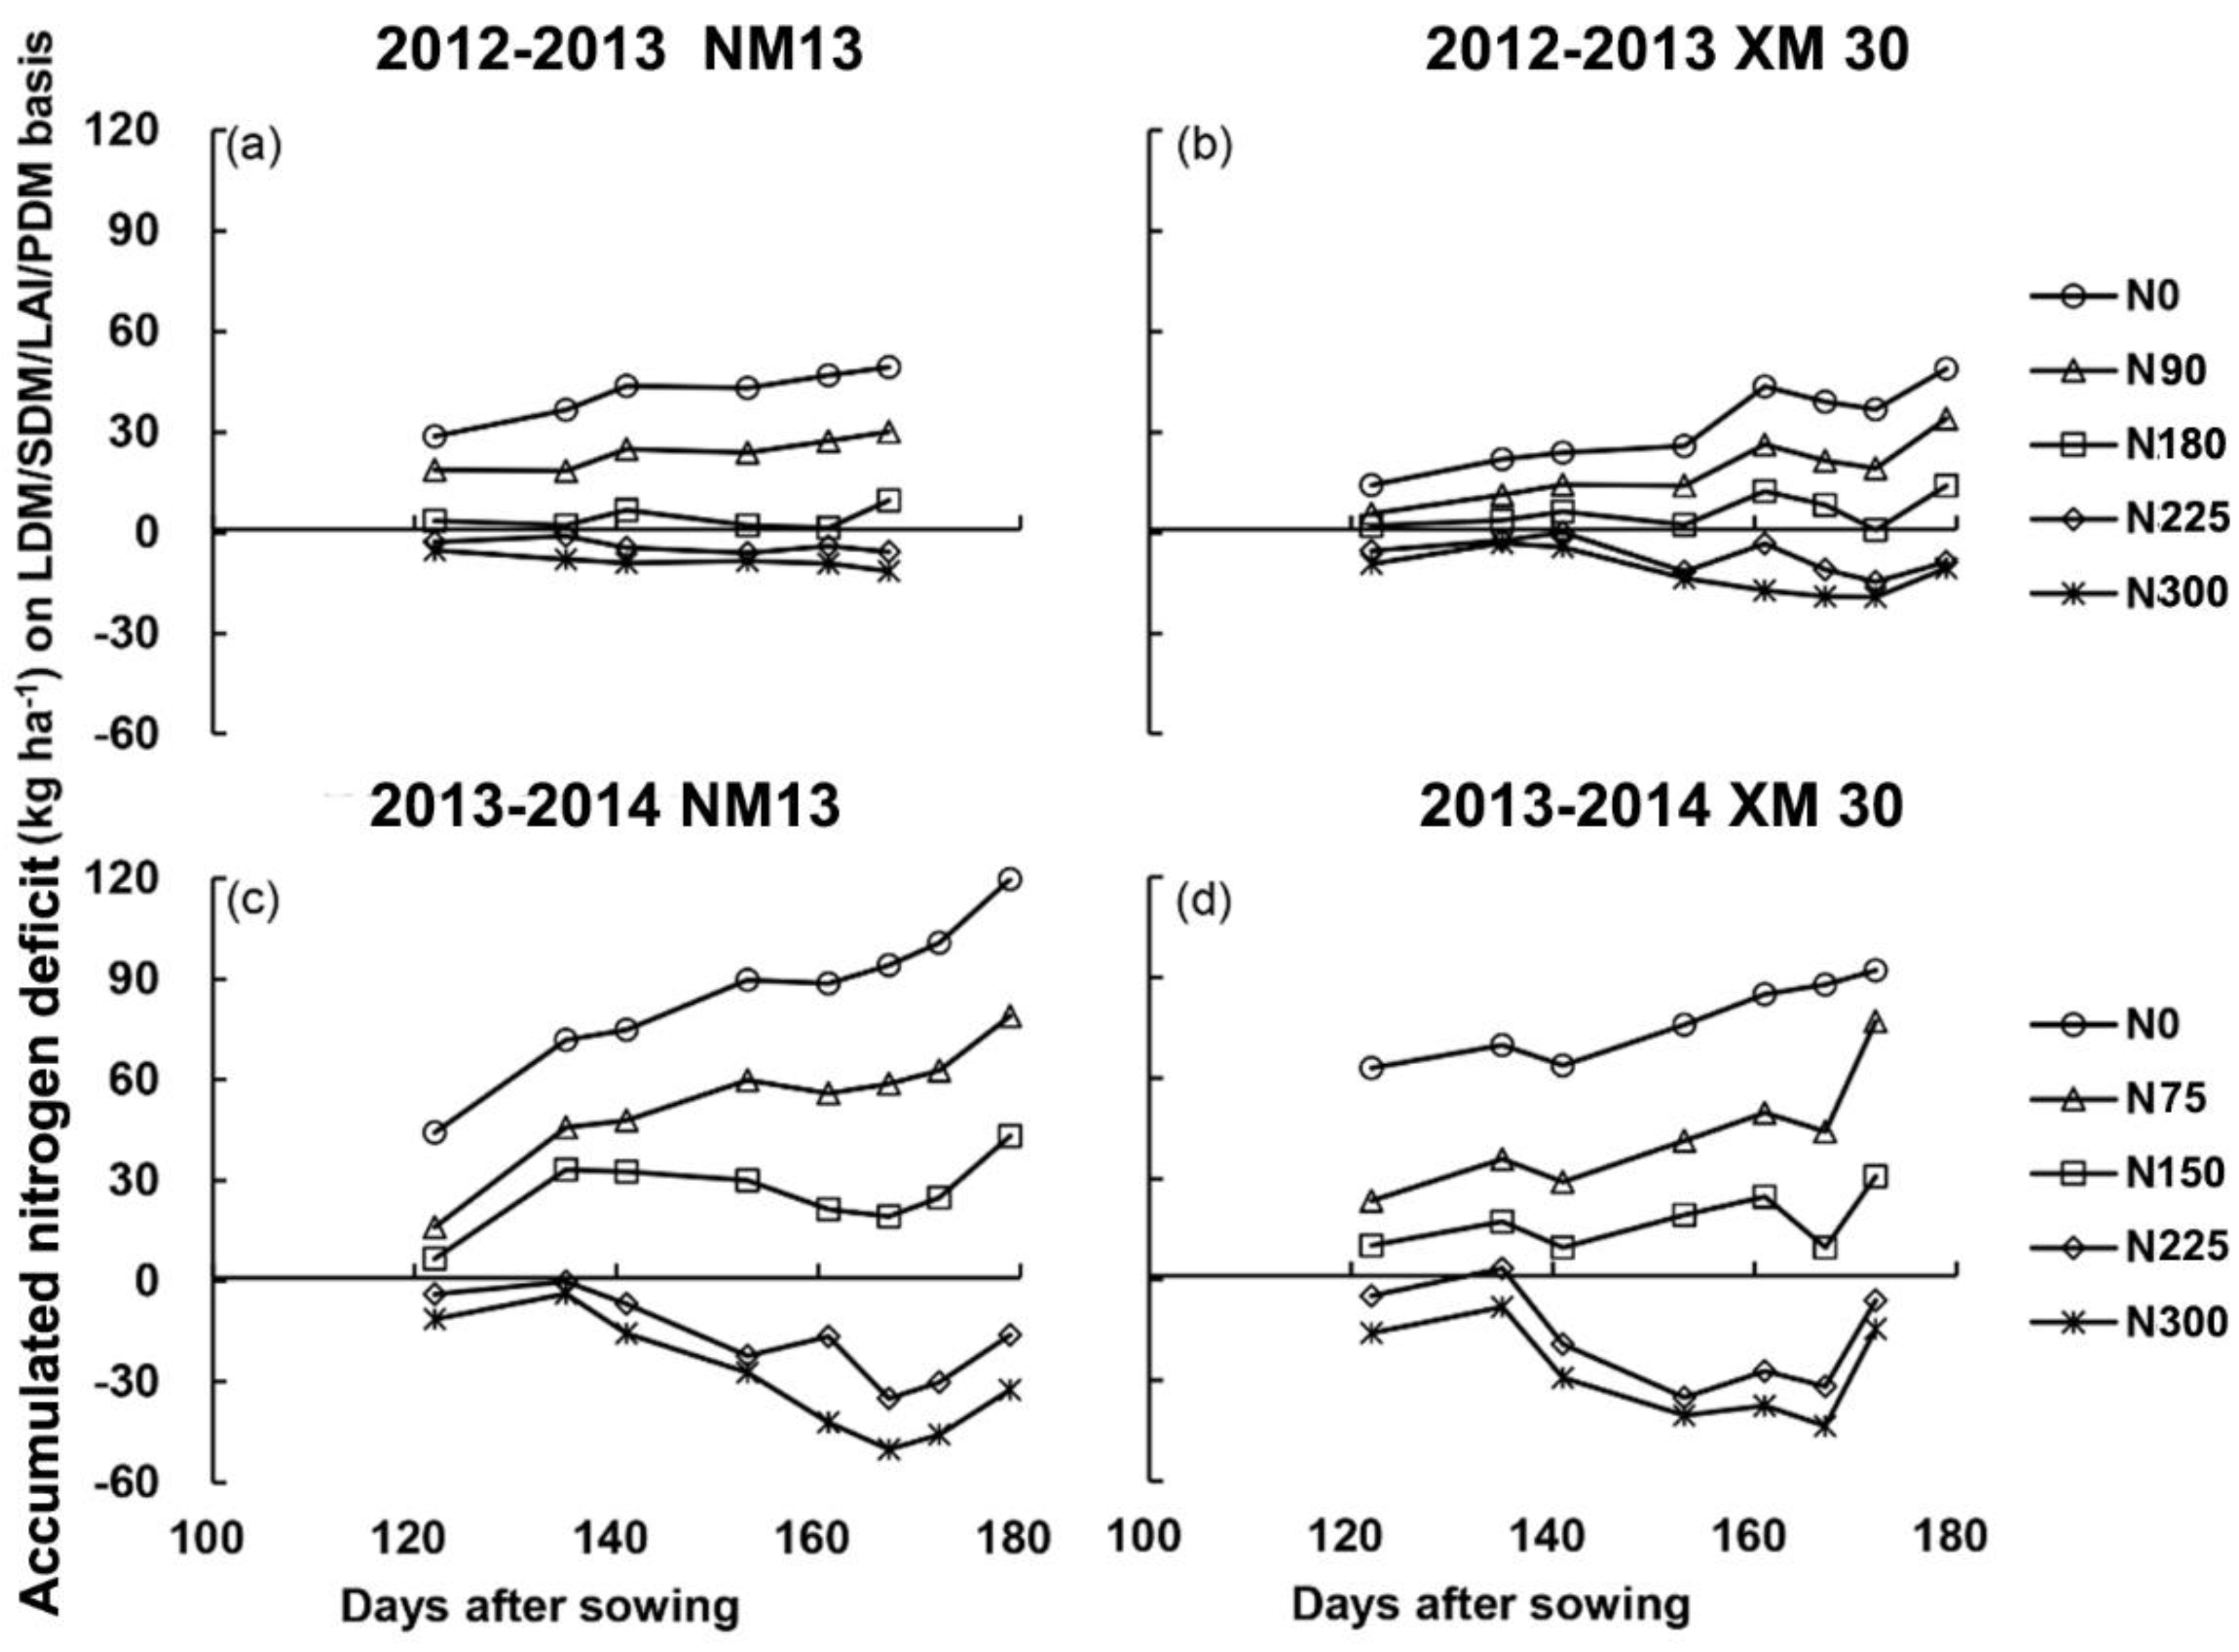
2.4.4. Determining Accumulated N Deficit

AND (kg ha−1) at each growth stage was determined by Equation (3) [37]:
AND = N cna N na ,
where Ncna indicates the critical N growth condition (N accumulation), while Nna is N accumulation under actual N applications. AND = 0 represents that the plant N nutrition is optimal; while in AND < 0, crop has excessive N nutrition; and if AND > 0, crop is grown in N-deficient conditions.

2.4.5. Relative Yield Calculation

Equation (4) [16] was used to calculate the relative yield (RY):
RY = Y i Y max   ,
where Yi represents the yield under different N levels, and Ymax represents the maximum yield in each site in different years.

2.4.6. Relative Root Mean Squared Error (rRMSE)

rRMSE = 1 n × i = 1 n ( P i Q i ) 2 × 100 Q ¯ i ,
where ‘n’ represents the number of samples, P i is the simulated value, Q i is the measured value, and Q ¯ i is the average measured value. This method was used to test the model in this study was independent data verification.

3. Results

3.1. Constructing the Maximum, Critical, and Minimum N Dilution Curves Based on Different DM Components

The data from experiments 1, 2, and 3 were used to construct four critical N concentration dilution curves based on various DM components (i.e., LDM, SDM, and PDM) and LAI (Figure 1). Critical N concentrations for LDM, SDM, PDM, and LAI were in the ranges of 0.65–3.25, 0.57–8.79, 1.06–12.34, and 1.03–8.37 t ha–1, respectively. The SDM curve had the lowest value of coefficient ‘a’ in Equation (1), while the PDM-based curve had the largest value. Meanwhile, the LDM-based curve had the lowest value of coefficient ‘b’ in Equation (1), while the SDM-based curve had the largest value. In the LDM-, SDM-, PDM-, and LAI-based N dilution curves, coefficients ‘a’ and ‘b’ were within the ranges of 2.50–4.16 and 0.19–0.44, respectively. The determination coefficients (R2) for the LDM-, SDM-, PDM-, and LAI-based N dilution curves were in the range of 0.79–0.89.
We also constructed LDM, SDM, PDM, and LAI based on Nmin and Nmax dilution curves using data obtained from the highest and lowest N application treatments, respectively. Regression coefficients ‘a’ and ‘b’ of the LDM, SDM, and PDM were based on Nmax and Nmin dilution curves, respectively, and LAI values were within the ranges of 3.18–4.67, 0.15–0.45, 1.46–2.66, and 0.25–0.52, respectively.

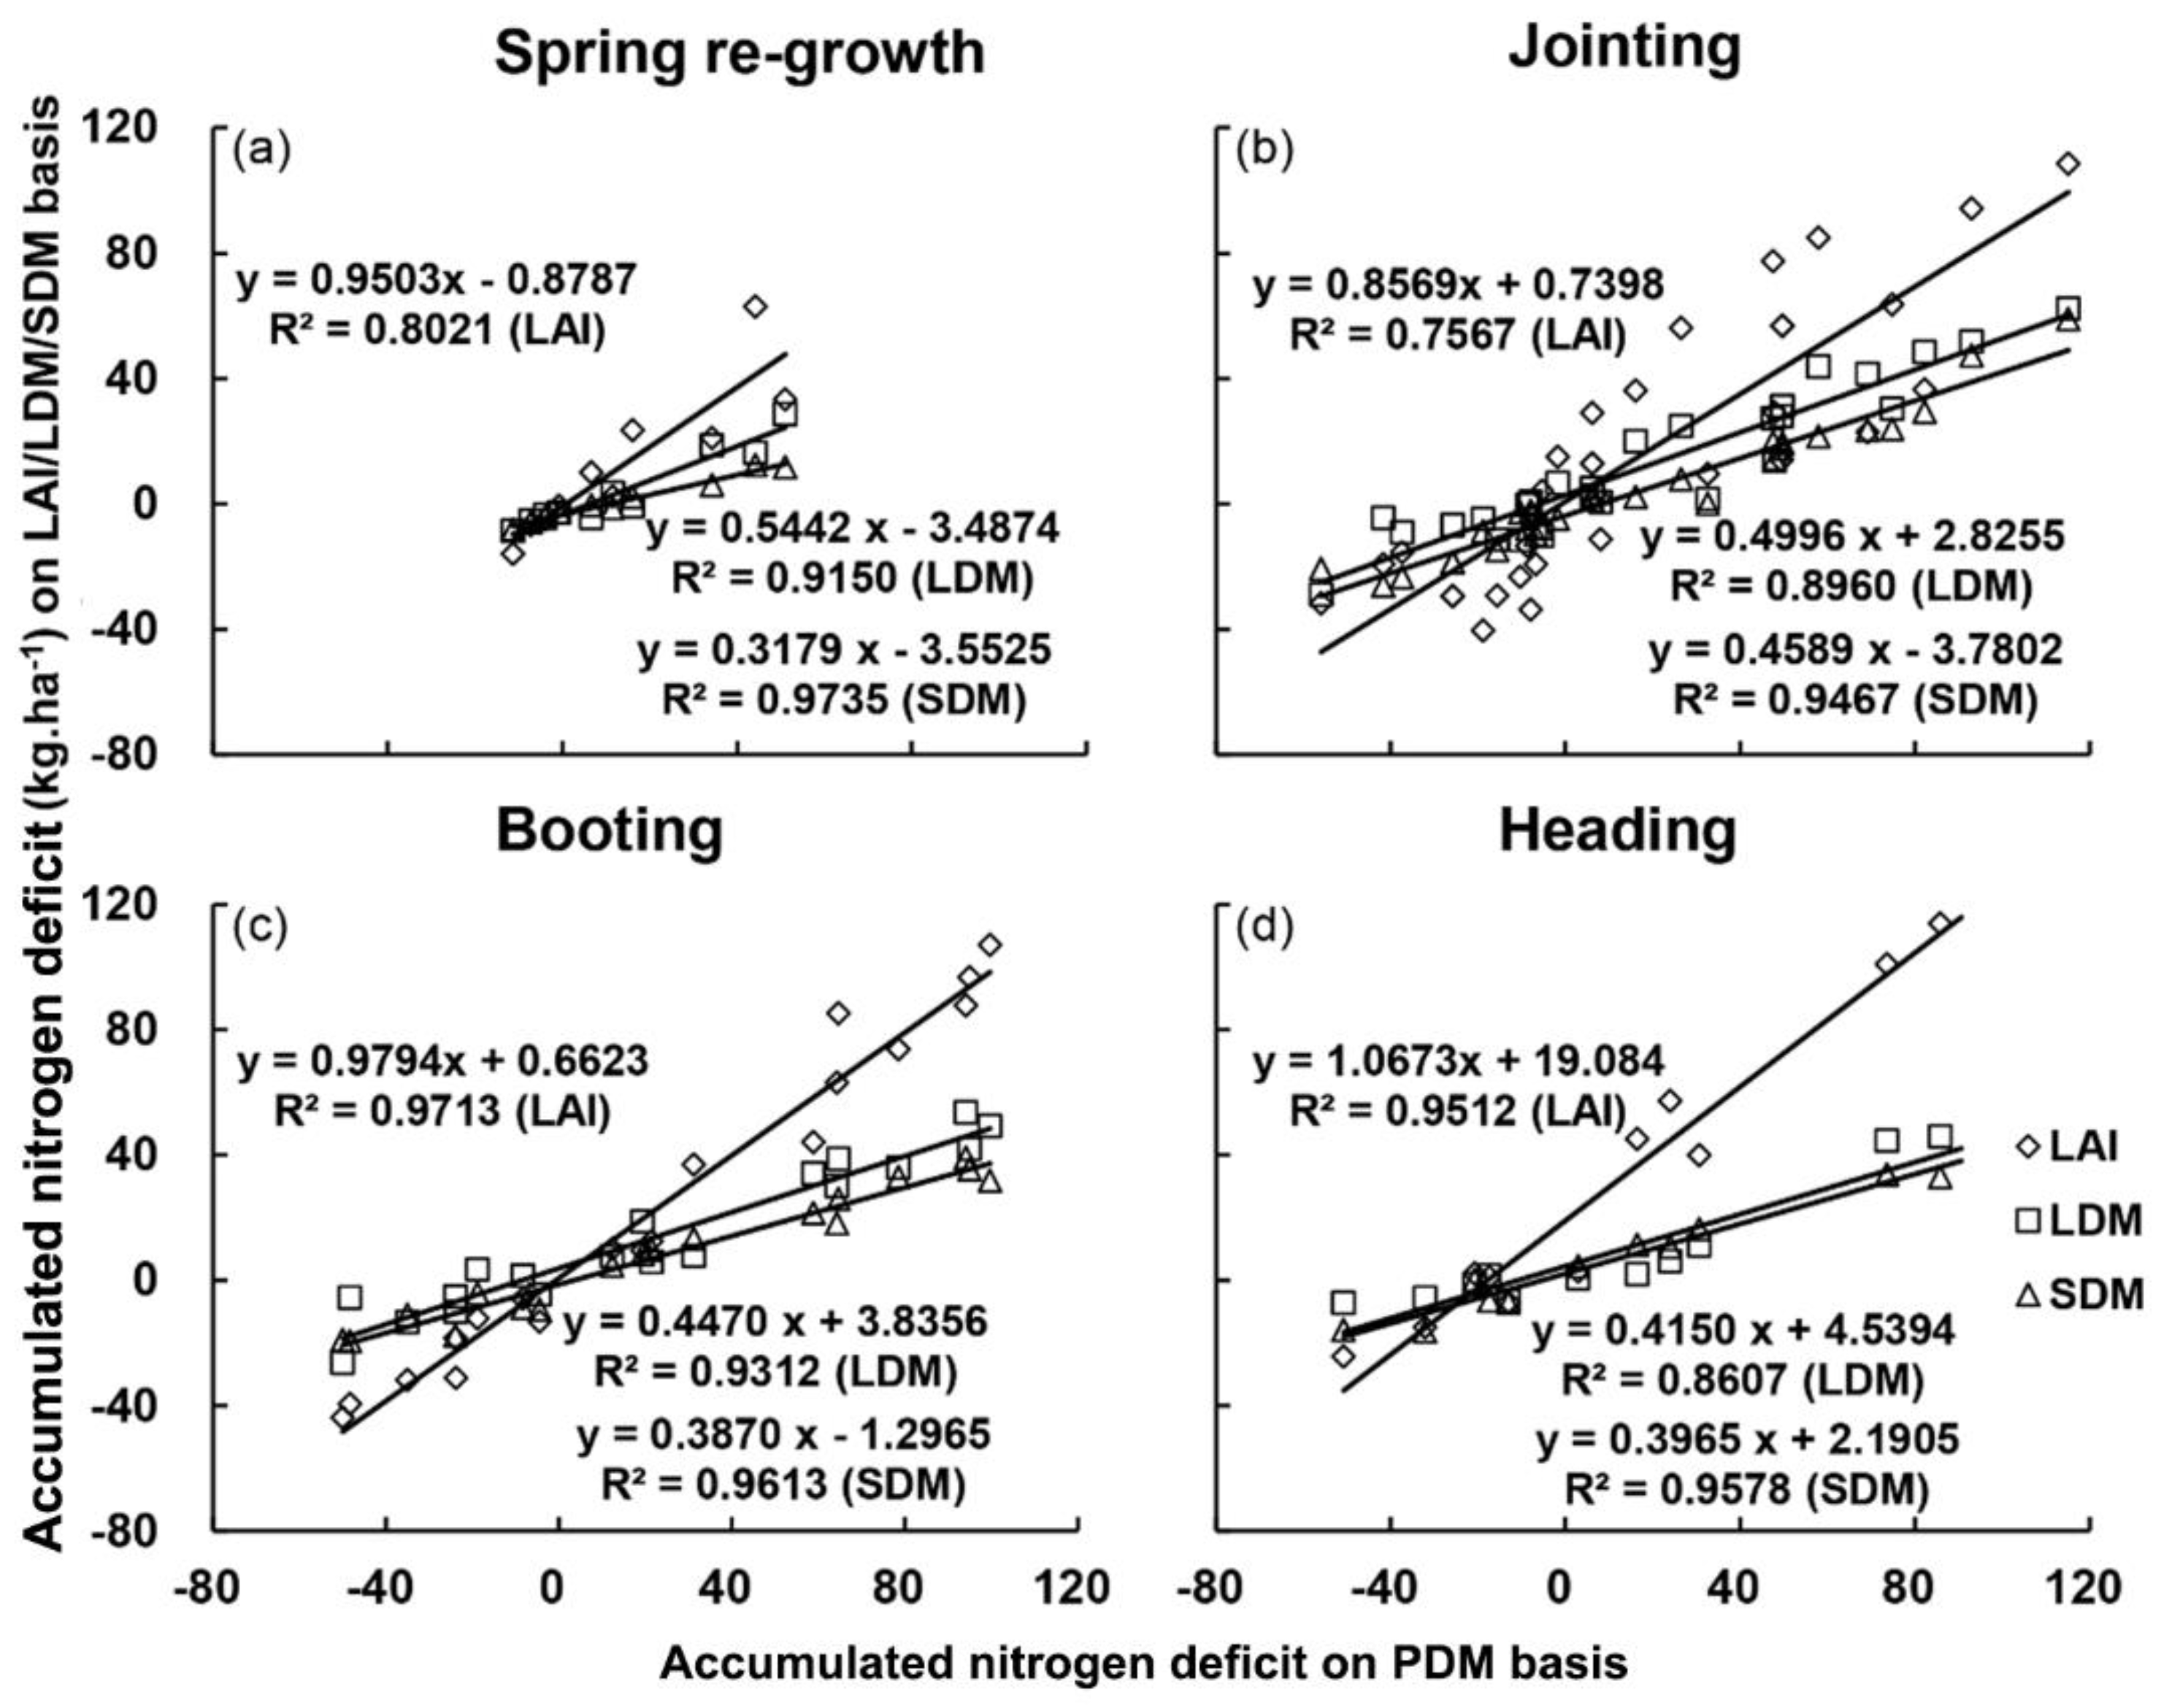
3.2. Relationships between PDM-Based and LDM/SDM/LAI-Based NNI and AND Values

We determined the correlations between LAI / organ-based N and the entire plant-based N parameters for wheat at different growth stages to identify an alternative and potentially most suitable method for seasonal assessment of crop N status (to replace the PDM procedure) (Figure 2 and Figure 3).
The abscissae of the critical N concentration curve plots refer to the NNI, and AND is calculated based on PDM; ordinates refer to NNI, and AND is calculated on LDM, SDM, and LAI bases. R2 values for the NNI curves in the spring re-growth, jointing, and booting stages were within the range of 0.87–0.99 (Figure 2). The highest calculated R2 value was for the relationship between the critical Nc dilution curve, based on SDM, and the critical N concentration dilution curve based on PDM. The lowest R2 value was obtained for the relationship between curves based on LDM and PDM. During the heading stage, the most substantial calculated R2 value was for the correlation between the LAI dilution curve and the PDM curve.
R2 values for the AND (kg ha–1) curves in the spring re-growth period were in the range of 0.86–0.97. The highest R2 value was for the relationship between the LDM dilution curve and the PDM curve. The R2 value was lowest for the relationship between curves based on LAI and PDM. The largest R2 value during the jointing, booting, and heading stages was for the relationship between SDM and PDM curves. The lowest R2 value during the jointing stage was for the correlation between LAI and PDM curves. The lowest value during the booting and heading stages was for the relationship between the LDM and PDM curves. Thus, the stronger relationship was between SDM and PDM curves during the jointing to heading stages. Leaf-based indicators (LAI, LDM) performed well in some of the stages compared with the PDM-based method.

3.3. NNI and AND Values from Four Critical N Dilution Curves

This study distinguished suboptimal, optimal, and super-optimal N supply by estimating NNI and AND, thus confirming that they are applicable for diagnosing N status. Figure 4 shows the changes in NNI values (after seeding) using the LDM, SDM, LAI, and PDM dilution curves. In Figure 4, the trends of the different organ-based NNI value showed slightly different changes. From these figures, we found that changes in the NNI value were very different. In Figure 4a,c,d, most NNI values were less than one in total growth stages under N0–2, while Figure Figure 4b indicated that N0-N1were lower than one all the time. We observed dynamic changes in the NNI values of different growth stages, and the NNI trends of different organs were different. On the same sampling dates, NNI values were the highest when N supplementation was the highest. When NNI was less than 1.0, the values were shown to decrease over time after seeding. When NNI exceeded 1.0, the values first decreased, then increased, and finally decreased again.
Figure 5a–d present the values of AND overtime after seeding, as calculated from curves based on LDM, SDM, LAI, and PDM, respectively. On the same sampling day, the higher the N concentration, the smaller the calculated AND value. When N was insufficient, AND increased over time. Under excessive N supply, AND values first increased, and then decreased.

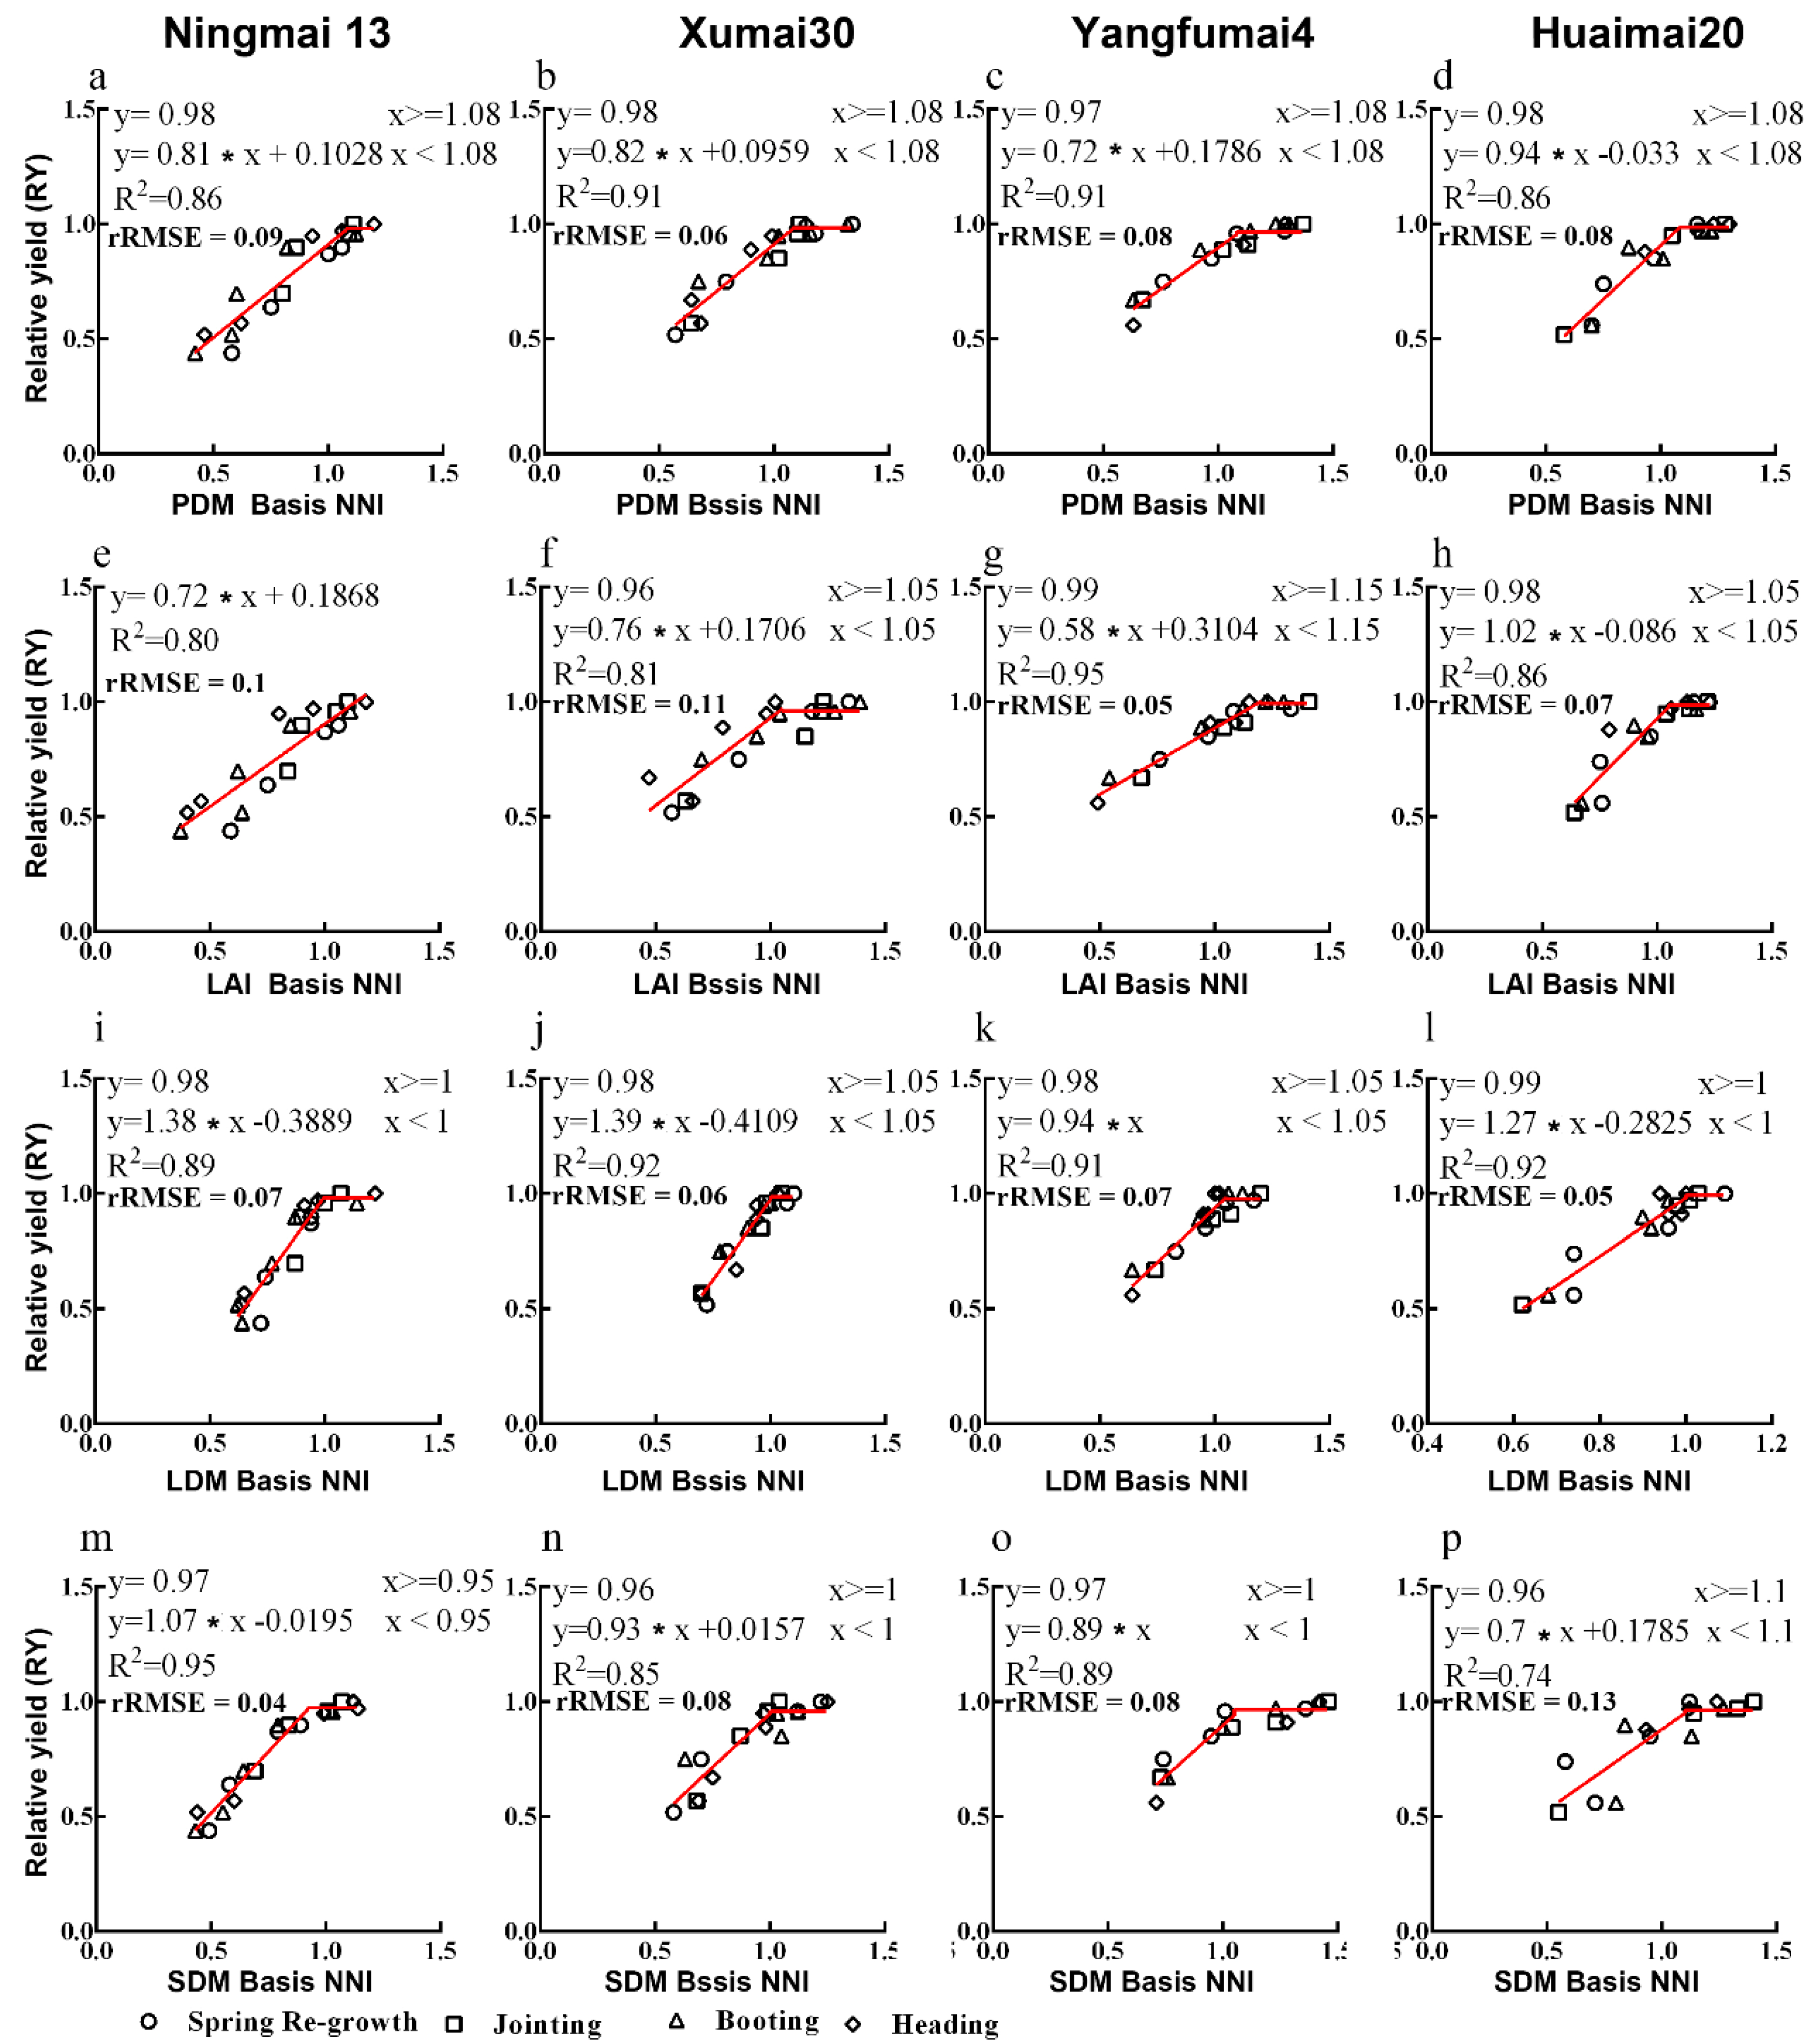
3.4. Relationships between RY and NNI Based on the Four N Dilution Curves

The correlation between RY and NNI during the wheat vegetative growth period was used to estimate grain yield. Using four critical N dilution curves, we expressed RY as the two-stage linear of NNI at different stages of vegetative growth (Figure 6 and Figure 7).
R2 coefficients and values of inflection points were used to compare the different curves. During the spring re-growth stage, the SDM curve was the best predictor of RY (Figure 6). During the jointing stage, the R2 values of the four curves exceeded 0.9, and relative root mean square error (rRMSE) ranged from 0.07–0.09. A comparison of the performance of these indicators based on NNI values showed that the SDM-based curve had the highest variance of RY. In the booting stage, the LDM curve showed optimum performance with the biggest R2 (R2 = 0.937, rRMSE = 0.05). During the heading stage, the PDM curve explained the best variance in predicting RY (R2 = 0.944, rRMSE = 0.05). In the SDM-based NNI prediction model, the highest R2 was obtained with relatively lower rRMSE in different growth stages, except during booting. As shown in Figure 7, we observed a strong correlation between agronomic indicators based on NNI and RY, which also gave the highest variances in the various cultivars. Among all these correlations, thresholds were variable for different varieties, while PDM-based NNI values showed more reliability than the other three indicators based on NNI (0.86 < R2 < 0.91, 0.06 < rRMSE < 0.09). In some of the growth stages, like booting, leaf-based indicators showed better RY prediction than other indicators.

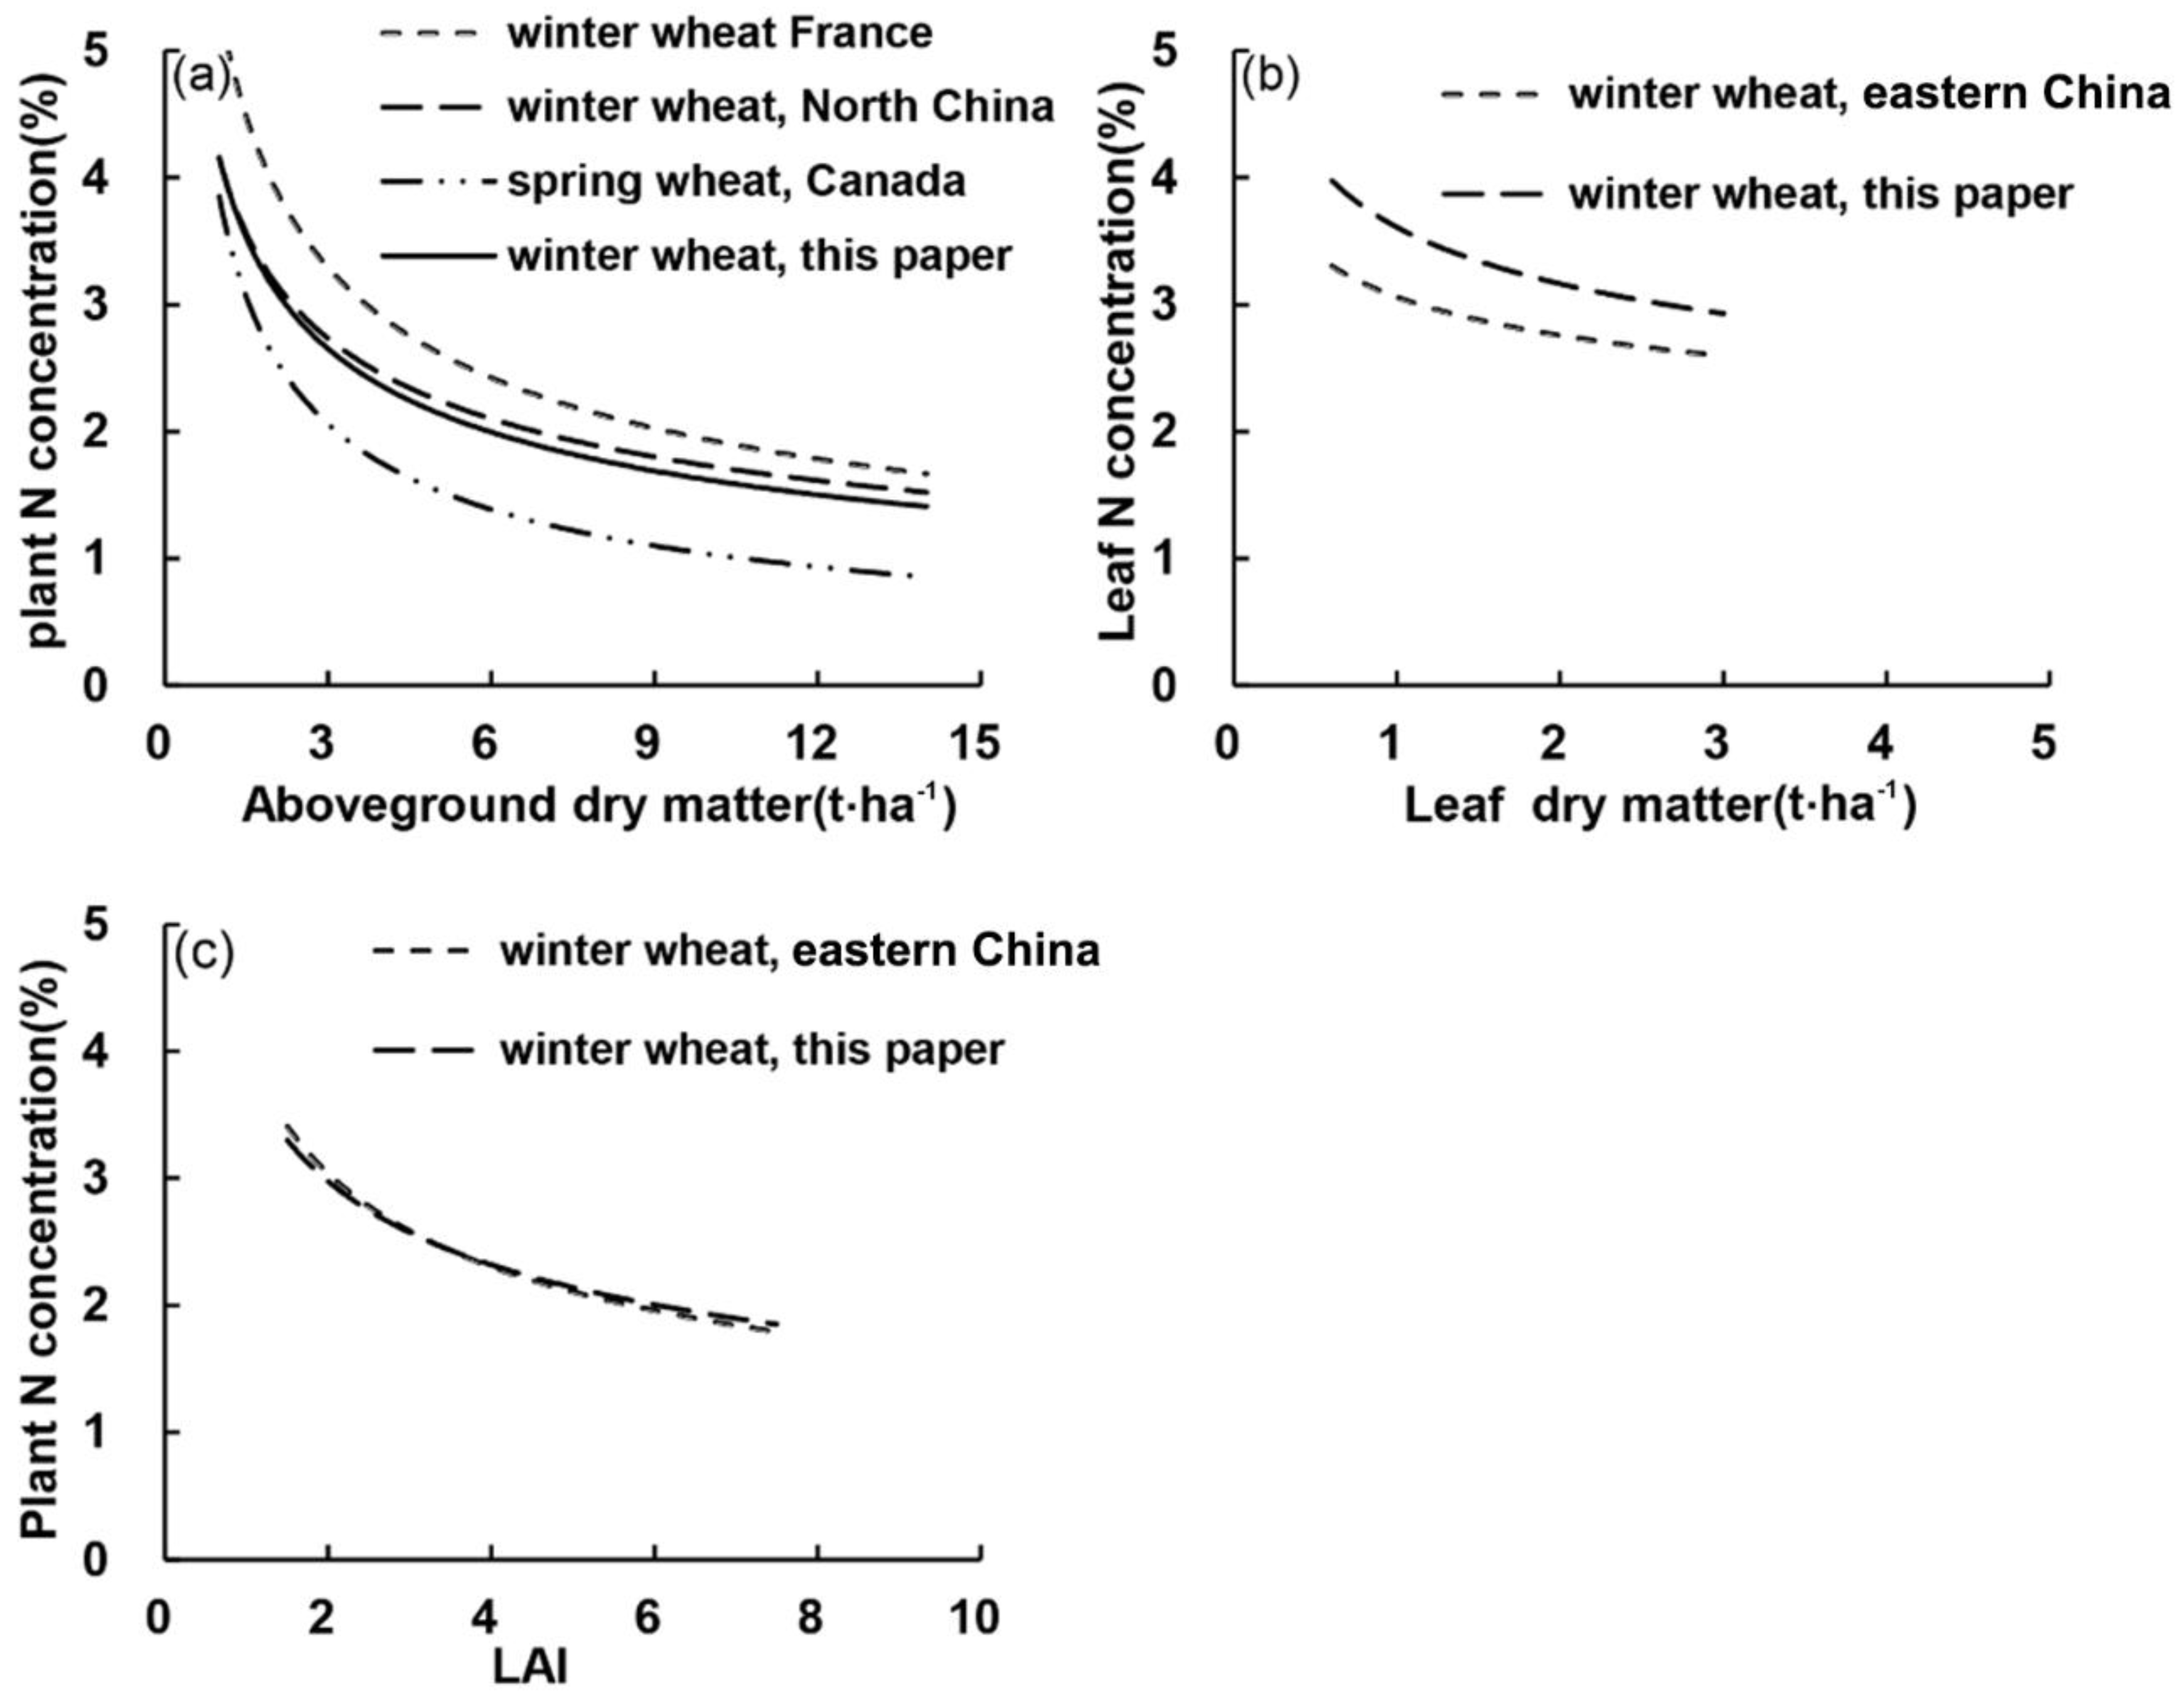
3.5. Comparing the Newly Calculated Curves with Other Critical N Dilution Curves

We constructed a series of specific critical N concentration dilution curves based on plant organ DM (leaf and stem) and LAI to diagnose crop N status and guide precise fertilizer management. Here, we compared these curves with those that have been reported previously [11,35,38] (Figure 8).
As shown in Figure 8a, the minimum critical N concentration dilution curve was the lowest for Canada spring wheat and the highest for French winter wheat. Critical N concentrations calculated by our model were comparable to those for winter wheat in northern China. The values closely coincided in the early growth stage, but our model gave slightly lower values for the late growth stage. The range of the French winter wheat model based on PDM was 1.5–12 t ha–1. The yield range for the Canada spring wheat model was 1.18 to 6.79 t ha–1 and 1.0–9.65 t ha–1 for the northern China winter wheat model. All the calculated critical N concentrations were within the range of 1.06–12.34 t ha–1 (Figure 8a). Figure 8b compares critical N concentration dilution curves based on LDM. The obtained values (0.65–3.25 t ha–1) exceeded those reported by Yao et al. [18] (0.52–2.64 t ha–1), especially in the early growth stage. Figure 8c compares critical N concentration models based on LAI. The critical N concentrations obtained in this study (1.03–8.37 t ha–1) exceeded those of Zhao et al. [21] (0.57–7.5 t ha–1). Our values were slightly higher during the early growth stages but slightly lower in the late growth phase.

4. Discussion

In this study, the wheat N dilution curves based on leaf-related indicators (LAI and LDM) and plant DM contents (PDM and SDM) were developed to compare these curves with existing ones for assessing the N status of winter wheat in east China, thus providing different choices to meet the requirement of in-season crop N status estimation.

4.1. Comparison of Different Organ Indicator-Based Nitrogen Dilution Curves

The values of the regression coefficients ‘a’ and ‘b’ in the four critical N concentration dilution curves differed significantly. The values for parameter ‘a’ of spring wheat in Canada [38], winter wheat in France [11], and that of the present study were significantly different (Figure 8a), indicating that different wheat cultivars have different N accumulation abilities. On the other hand, this difference might also be associated with the initial N uptake capacity and soil N supply during the early growth stages of wheat [39]. The differences in parameter ‘b’ among the three critical N dilution curves suggest that the descent rate of N was different. However, the Nc curves developed in China were different from the other two Nc dilution curves developed in France and Canada. In China, the PDM-based curve developed in this study was similar to the curve established in the North China Plain [35], although the PDM parameter was different. The curve established by Yao et al. [18] was comparable to the LDM-based curve constructed in this study (Figure 8b). However, the parameter ‘a’ in this paper was larger than the curve established by Yao et al., whereas the parameter ‘b’ was markedly higher than Yao’s. These differences indicate that N absorption is affected by climatic conditions, water, and other factors [40].
The curve constructed in this study (Figure 8c) and the previous curve established by Zhao et al. [21] are very similar, indicating that leaf area expansion in similar growth circumstances would have small changes. LAI-based Nc curves also performed well in wheat N diagnosis compared with the PDM-based approach, which provides a valuable research topic ranging from the scale of leaves to fields and regions due to LAI remaining consistent when the spatial resolution changes, thus being easy to estimate from remote sensing [21]. For the leaf indicator-based methods, LAI-based curves showed slight differences in three sites, while the LDM-based curve performed differently in different sites. The LDM and SDM curves were different from PDM curves, indicating that the N accumulation rate between different wheat organs differs during the vegetative growth period.
The stem/leaf ratio explains the differences between the curves based on SDM and LDM. The differences in the value of the regression coefficient ‘a’ between curves based on PDM and LAI may be explained by the bi-compartmental accretion of N in plant organs (about the biomass/N content ratio of the entire plant). Stress responses also change the bi-compartmental distribution of PDM between plant organs, which in turn affects the shape of the dilution curves [41]. The AND and RY exhibited significant differences in different wheat genotypes on PDM, LDM, and SDM bases but non-significant differences in the case of the LAI basis, indicating that leaf area expansion was uniform in both wheat types in this study under sub-optimal, optimal, and supra-optimal N supplies.
The present work also analyzed the performance of the leaf-based approaches (LAI and LDM), especially LDM-based N parameters, which might be an appropriate substitute for PDM-based N parameters in remote sensing wheat N management. Ata-Ul-Karim et al. also reported a similar point in paddy rice [15]. Moreover, the quick, real-time, and non-destructive field methods used in modern agriculture, such as a chlorophyll meter, hyper-spectral meter, remote sensing, and digital photography, generally monitor N concentration at a single leaf or on a canopy basis, instead of an entire plant basis [22]. Meanwhile, the strong relationship between N concentration and the leaf chlorophyll or area could differ as well, where points were either well grouped in one year or more wheat genotypes [42]. Therefore, Nc curves based on different tissues can provide more choices for the diagnosis of crop N nutrition status. Notably, the SDM-based dilution curve is a reliable and potential alternative for estimation of plant N status, while leaf-based Nc curves provide a quick approach in real-time wheat N management.

4.2. Application of N Dilution Curves in Winter Wheat Production

The estimation of NNI and AND using specific organ dry matters and LAI at different growth stages of wheat, instead of only using the PDM method, helps it better understand the concept of N dilution in crops [15]. Moreover, plant growth is the sum of metabolic and structural components, which require N for metabolic and structural processes [21]. For evaluation of the status of sub-optimal N, Figure 4 shows that the crop was in N-deficient conditions, and N topdressing was necessary. In Figure 5, the AND of N0-N2 treatments was needed. While, for supra-optimal treatments N3 and N4, high N status was obtained in most growth periods. However, PDM- and LAI-based NNI values were higher than LDM-based NNI values between sowing and booting, under N3 and N4 rates. As for N0-N2 treatments, PDM- and LAI-based NNI values were lower than LDM-based NNI values. In this study, the LDM-based Nc model was used for diagnosis of leaf N status, while the leaf N uptake was different from plant N uptake, and a similar phenomenon was reported by Yao et al. [18]. The N fertilizer dose increased the SDM, which was affected by variations in stem N concentration. Similar results in paddy rice were also reported by Ata-Ul-Karim et al. [28].
Seasonal estimation of wheat yield is essential for precision agricultural practices and can be a handy tool in food provision management [43]. However, these correlations are inconsistent across different regions and are rarely applied to varied N conditions [8,44]. The relationship between RY and the determined NNI based on the critical N dilution curve can display the accuracy of grain yield prediction [45]. This work also proved the NNI-based model is suitable for application in grain yield prediction. The stable relationships identified in this study in the jointing, booting, and heading stages are not consistent with previous reports for wheat [21]. As shown in Figure 6, the slopes and thresholds among the four cultivars were different in most growing seasons. However, the PDM and LAI threshold approaches were similar, while more than that of the other two organs methods before heading stages. According to Figure 7, we obtained similar thresholds in the four different cultivars. The thresholds were always higher than one in LAI- and LDM-based NNI. For the performance of SDM-based NNI, the threshold was diverse, ranging from 0.95 to 1.1. Table 2 indicates that all the P-values were higher than 0.05, suggesting that the slopes and thresholds were not cultivar sensitive. Ata-Ul-Karim et al. [15] and He et al. [45] reported similar findings.
This work also indicated that the different organ-based NNI values gave similar accuracies in the diagnosis of wheat N status. Low rRMSE values proved that RY prediction models based on these four organs performed well and stably in RY prediction (Figure 9, 0.05 < rRMSE < 0.07, threshold = 0.98 or 0.97, 0.83< R2 < 0.90). Further studies are still needed in diverse wheat production regions. Meanwhile, less robust relationships exist between RY and NNI in different growth stages [46]. This study identified that a different NNI value is necessary to enrich the indicator group for simulating the growing status, to develop ideal crop models. Most of the Nc curves in existing crop models were established more than 20 years ago and are PDM based, which limits their application in crop models [47]. Thus, although the PDM-based curve was the most reliable predictor of RY, the other three critical N concentration dilution curves we constructed also performed sufficiently well. However, many papers have proposed variation in the partitioning of DM among different plant organs under stress conditions (water deficit and extreme temperature etc.), which influences the PDM/N and LAI/N relations and causes changes in the shape of the dilution curve [48], which limits their acceptance of PDM- and LAI-based methods as reliable methods [49]. Therefore, these four indicators are all (PDM, LAI, LDM, and SDM) good indicators for wheat N status management in different conditions.

5. Conclusions

The present study is the first comprehensive attempt to evaluate critical N dilution curves based on different crop organ values in winter wheat. Positive relationships between Nc and organ values are shown in Figure 1, which were similar to the results of other scholars (PDM, LAI, leaf DM, stem DM, and panicle DM). These relationships among PDM-based and LAI/LDM/SDM-based NNI and AND indices showed that the SDM-based curve has the potential for use as an alternative to the PDM-based approach (SDM-based NNI estimation: 0.97 > R2 > 0.90; SDM-based AND calculation: 0.97 > R2 > 0.95). Although the LDM-based critical N concentration dilution curve performed best when NNI was used to diagnose N status, NNI calculated from the SDM-based curve can predict grain yield well enough (0.95 > R2 > 0.80; 0.10 > rRMSE > 0.05). N parameters on LAI or LDM (leaf basis) in-season estimation using non-destructive tools will lead to judicious N diagnosis and yield prediction in some of the growth stages. This work suggests that the current approach for using whole plant biomass/N relationships to explore the N dependence of various crop growth stages should be expanded to include LAI/organ dry matter relationships for the development of N dilution curves for different crops. This study also indicated the low rRMSE values in RY prediction based on these four organ-related Nc curves (0.05 < rRMSE < 0.07, threshold = 0.98 or 0.97, 0.83< R2 < 0.90). Results stated that the performance of Nc curves is different in each growth stage; thus, farmers can choose an appropriate indicator (LAI based, SDM based, or DM based) for diagnosing wheat N nutrient, RY prediction, and applying N fertilizer management.

Author Contributions

The following statements should be used “Conceptualization, K.Z. and X.W. (Xue Wang); methodology, X.W. (Xiaoling Wang); software, K.Z.; validation, S.T.A.-U.-K., Y.T. and Y.Z.; data curation, X.W. (Xiaoling Wang); writing—original draft preparation, K.Z.; writing—review and editing, W.C.; visualization, X.L.; supervision, X.L.; project administration, X.L.; funding acquisition, X.L. All authors have read and agreed to the published version of the manuscript.

Funding

This work was support by the National Natural Science Foundation of China (32071903), Jiangsu Province Key Technologies R&D Program (BE2019386; BE2016375), the earmarked fund for Jiangsu Agricultural Industry Technology System (JATS (2020)415; JATS (2020)135), and the 111 project (B16026).

Acknowledgments

Thanks for the help from reviewers with his suggestions.

Conflicts of Interest

The authors declare no conflict of interest.

References

  1. Mengel, K.; Kirkby, E.A.; Kosegarten, H.; Appel, T. Nitrogen. In Principles of Plant Nutrition; Springer: Dordrecht, The Netherlands, 2001; pp. 397–434. [Google Scholar]
  2. Guo, J.; Hu, X.; Gao, L.; Xie, K.; Ning, L.; Shen, Q.; Hu, S.; Guo, S. The rice production practices of high yield and high nitrogen use efficiency in Jiangsu, China. Sci. Rep. 2017, 7, 2101. [Google Scholar] [CrossRef] [PubMed]
  3. An, N.; Wei, W.; Qiao, L.; Zhang, F.; Christie, P.; Jiang, R.; Dobermann, A.; Goulding, K.W.T.; Fan, J.; Fan, M. Agronomic and environmental causes of yield and nitrogen use efficiency gaps in Chinese rice farming systems. Eur. J. Agron. 2018, 93, 40–49. [Google Scholar] [CrossRef]
  4. Liu, X.-J.; Qiang, C.; Yuan, Z.-F.; Xia, L.; Wang, X.-L.; Tian, Y.-C.; Cao, W.-X.; Yan, Z. Leaf area index based nitrogen diagnosis in irrigated lowland rice. J. Integr. Agric. 2018, 17, 111–121. [Google Scholar] [CrossRef] [Green Version]
  5. Aziz, O.; Hussain, S.; Rizwan, M.; Riaz, M.; Bashir, S.; Lin, L.; Mehmood, S.; Imran, M.; Yaseen, R.; Lu, G. Increasing water productivity, nitrogen economy, and grain yield of rice by water saving irrigation and fertilizer-N management. Environ. Sci. Pollut. Res. 2018, 25, 16601–16615. [Google Scholar] [CrossRef]
  6. Smith, C.J.; Hunt, J.R.; Wang, E.; Ben, C.T.M.; Xing, H.; Denmead, O.T.; Zeglin, S.; Zhao, Z. Using fertilizer to maintain soil inorganic nitrogen can increase dryland wheat yield with little environmental cost. Agric. Ecosyst. Environ. 2019, 286, 106644. [Google Scholar] [CrossRef]
  7. Ntamatungiro, S.; Norman, R.J.; McNew, R.W.; Wells, B.R. Comparison of plant measurements for estimating nitrogen accumulation and grain yield by flooded rice. Agron. J. 1999, 91, 676–685. [Google Scholar] [CrossRef]
  8. Wang, H.; Zhu, Y.; Li, W.; Cao, W.; Tian, Y. Integrating remotely sensed leaf area index and leaf nitrogen accumulation with RiceGrow model based on particle swarm optimization algorithm for rice grain yield assessment. J. Appl. Remote Sens. 2014, 8, 083674. [Google Scholar] [CrossRef] [Green Version]
  9. Sims, D.A.; Gamon, J.A. Relationships between leaf pigment content and spectral reflectance across a wide range of species, leaf structures and developmental stages. Remote Sens. Environ. 2002, 81, 337–354. [Google Scholar] [CrossRef]
  10. Cassman, K.G.; Peng, S.; Olk, D.; Ladha, J.; Reichardt, W.; Dobermann, A.; Singh, U. Opportunities for increased nitrogen-use efficiency from improved resource management in irrigated rice systems. Field Crop. Res. 1998, 56, 7–39. [Google Scholar] [CrossRef]
  11. Justes, E.; Mary, B.; Meynard, J.M.; Machet, J.M.; Thelierhuche, L. Determination of a Critical Nitrogen Dilution Curve for Winter Wheat Crops. Ann. Bot. 1994, 74, 397–407. [Google Scholar] [CrossRef]
  12. Kage, H.; Alt, C.; Stützel, H. Nitrogen concentration of cauliflower organs as determined by organ size, N supply, and radiation environment. Plant Soil 2002, 246, 201–209. [Google Scholar] [CrossRef]
  13. Zhou, Q.-f.; Liu, Z.-y.; Huang, J.-f. Detection of nitrogen-overfertilized rice plants with leaf positional difference in hyperspectral vegetation index. J. Zhejiang Univ. Sci. B 2010, 11, 465–470. [Google Scholar] [CrossRef] [Green Version]
  14. Gastal, F.; Lemaire, G. N uptake and distribution in crops: An agronomical and ecophysiological perspective. J. Exp. Bot. 2002, 53, 789–799. [Google Scholar] [CrossRef] [Green Version]
  15. Ata-Ul-Karim, S.T.; Zhu, Y.; Liu, X.; Cao, Q.; Tian, Y.; Cao, W. Comparison of different critical nitrogen dilution curves for nitrogen diagnosis in rice. Sci. Rep. 2017, 7, 1–14. [Google Scholar] [CrossRef] [PubMed] [Green Version]
  16. Ata-Ul-Karim, S.T.; Cao, Q.; Zhu, Y.; Tang, L.; Rehmani, M.I.; Cao, W. Non-destructive Assessment of Plant Nitrogen Parameters Using Leaf Chlorophyll Measurements in Rice. Front. Plant Sci. 2016, 7, 1829. [Google Scholar] [CrossRef] [PubMed] [Green Version]
  17. Ata-Ul-Karim, S.T.; Liu, X.; Lu, Z.; Zheng, H.; Cao, W.; Zhu, Y. Estimation of nitrogen fertilizer requirement for rice crop using critical nitrogen dilution curve. Field Crop. Res. 2017, 201, 32–40. [Google Scholar] [CrossRef]
  18. Yao, X.; Ata-Ul-Karim, S.T.; Zhu, Y.; Tian, Y.; Liu, X.; Cao, W. Development of critical nitrogen dilution curve in rice based on leaf dry matter. Eur. J. Agron. 2014, 55, 20–28. [Google Scholar] [CrossRef]
  19. Zhang, W.; Cao, G.; Li, X.; Zhang, H.; Wang, C.; Liu, Q.; Chen, X.; Cui, Z.; Shen, J.; Jiang, R. Closing yield gaps in China by empowering smallholder farmers. Nature 2016, 537, 671–674. [Google Scholar] [CrossRef]
  20. Lundstrom, C.; Lindblom, J. Considering farmers’ situated knowledge of using agricultural decision support systems (AgriDSS) to Foster farming practices: The case of CropSAT. Agric. Syst. 2018, 159, 9–20. [Google Scholar] [CrossRef]
  21. Zhao, B.; Yao, X.; Tian, Y.; Liu, X.; Ata-Ul-Karim, S.T.; Ni, J.; Cao, W.; Zhu, Y. New critical nitrogen curve based on leaf area index for winter wheat. Agron. J. 2014, 106, 379–389. [Google Scholar] [CrossRef]
  22. Fitzgerald, G.; Rodriguez, D.; O’Leary, G. Measuring and predicting canopy nitrogen nutrition in wheat using a spectral index—The canopy chlorophyll content index (CCCI). Field Crop. Res. 2010, 116, 318–324. [Google Scholar] [CrossRef]
  23. Lemaire, G.; Gastal, F. Improved estimation of nitrogen uptake in grasslands using the nitrogen dilution curve. Agron. Sustain. Dev. 2016, 36, 47. [Google Scholar] [CrossRef] [Green Version]
  24. Zhang, K.; Liu, X.; Ata-Ul-Karim, S.T.; Lu, J.; Krienke, B.; Li, S.; Cao, Q.; Zhu, Y.; Cao, W.; Tian, Y. Development of Chlorophyll-Meter-Index-Based Dynamic Models for Evaluation of High-Yield Japonica Rice Production in Yangtze River Reaches. Agronomy 2019, 9, 106. [Google Scholar] [CrossRef] [Green Version]
  25. Godwin, D.; Jones, C.A. Nitrogen Dynamics in Soi-Plant Systems. Modeling Plant Soil Syst. 1991, 31, 287–321. [Google Scholar]
  26. Bouman, B.; Van Laar, H. Description and evaluation of the rice growth model ORYZA2000 under nitrogen-limited conditions. Agric. Syst. 2006, 87, 249–273. [Google Scholar] [CrossRef]
  27. Ziadi, N.; Bélanger, G.; Gastal, F.; Claessens, A.; Lemaire, G.; Tremblay, N. Leaf nitrogen concentration as an indicator of corn nitrogen status. Agron. J. 2009, 101, 947–957. [Google Scholar] [CrossRef]
  28. Ata-Ul-Karim, S.T.; Yao, X.; Liu, X.; Cao, W.; Zhu, Y. Determination of critical nitrogen dilution curve based on stem dry matter in rice. PLoS ONE 2014, 9, e104540. [Google Scholar] [CrossRef]
  29. de Oliveira, E.C.A.; de Castro, G.G.J.; Trivelin, P.C.O.; Otto, R.; Franco, H.C.J. Determining a critical nitrogen dilution curve for sugarcane. J. Plant Nutr. Soil Sci. 2013, 176, 712–723. [Google Scholar] [CrossRef]
  30. Evans, J.R. Photosynthesis and nitrogen relationships in leaves of C3 plants. Oecologia 1989, 78, 9–19. [Google Scholar] [CrossRef]
  31. Cui, X.-H.; Murthy, H.N.; Wu, C.-H.; Paek, K.-Y. Adventitious root suspension cultures of Hypericum perforatum: Effect of nitrogen source on production of biomass and secondary metabolites. Vitr. Cell. Dev. Biol. Plant 2010, 46, 437–444. [Google Scholar] [CrossRef]
  32. Yin, X.; Van Laar, H. Crop Systems Dynamics: An Ecophysiological Simulation Model of Genotype-by-Environment Interactions; Wageningen Academic Publishers: Wageningen, The Netherlands, 2005. [Google Scholar]
  33. Fumoto, T.; Kobayashi, K.; Li, C.; Yagi, K.; Hasegawa, T. Revising a process-based biogeochemistry model (DNDC) to simulate methane emission from rice paddy fields under various residue management and fertilizer regimes. Glob. Chang. Biol. 2008, 14, 382–402. [Google Scholar] [CrossRef]
  34. Dong, X.; Chen, W.; Wang, W.; Zhang, H.; Liu, X.; Luo, J. Comprehensive profiling and natural variation of flavonoids in rice. J. Integr. Plant Biol. 2014, 56, 876–886. [Google Scholar] [CrossRef] [PubMed]
  35. Yue, S.; Meng, Q.; Zhao, R.; Li, F.; Chen, X.; Zhang, F.; Cui, Z. Critical nitrogen dilution curve for optimizing nitrogen management of winter wheat production in the North China Plain. Agron. J. 2012, 104, 523–529. [Google Scholar] [CrossRef]
  36. Ata-Ul-Karim, S.T.; Zhu, Y.; Yao, X.; Cao, W. Determination of critical nitrogen dilution curve based on leaf area index in rice. Field Crop. Res. 2014, 167, 76–85. [Google Scholar] [CrossRef]
  37. Ata-Ul-Karim, S.T.; Yao, X.; Liu, X.; Cao, W.; Zhu, Y. Development of critical nitrogen dilution curve of Japonica rice in Yangtze River Reaches. Field Crop. Res. 2013, 149, 149–158. [Google Scholar] [CrossRef]
  38. Ziadi, N.; Bélanger, G.; Claessens, A.; Lefebvre, L.; Cambouris, A.N.; Tremblay, N.; Nolin, M.C.; Parent, L.É. Determination of a critical nitrogen dilution curve for spring wheat. Agron. J. 2010, 102, 241–250. [Google Scholar] [CrossRef]
  39. Lemaire, G.; Oosterom, E.V.; Sheehy, J.; Massignam, A.; Rossato, L. Is crop N demand more closely related to dry matter accumulation or leaf area expansion during vegetative growth? Field Crop. Res. 2007, 100, 91–106. [Google Scholar] [CrossRef]
  40. Errecart, P.M.; Agnusdei, M.G.; Lattanzi, F.A.; Marino, M.A.; Berone, G.D. Critical nitrogen concentration declines with soil water availability in tall fescue. Crop. Sci. 2014, 54, 318–330. [Google Scholar] [CrossRef] [Green Version]
  41. Chen, Q.C.; Tian, Y.C.; Xia, Y.; Cao, W.X.; Yan, Z. Comparison of five nitrogen dressing methods to optimize rice growth. Plant Prod. Sci. 2014, 17, 66–80. [Google Scholar] [CrossRef] [Green Version]
  42. Mistele, B.; Schmidhalter, U. Estimating the nitrogen nutrition index using spectral canopy reflectance measurements. Eur. J. Agron. 2008, 29, 184–190. [Google Scholar] [CrossRef]
  43. Kanke, Y.; Tubaña, B.; Dalen, M.; Harrell, D. Evaluation of red and red-edge reflectance-based vegetation indices for rice biomass and grain yield prediction models in paddy fields. Precis. Agric. 2016, 17, 507–530. [Google Scholar] [CrossRef]
  44. Zhang, K.; Ge, X.; Shen, P.; Li, W.; Tian, Y. Predicting Rice Grain Yield Based on Dynamic Changes in Vegetation Indexes during Early to Mid-Growth Stages. Remote Sens. 2019, 11, 387. [Google Scholar] [CrossRef] [Green Version]
  45. He, Z.; Qiu, X.; Ata-Ul-Karim, S.T.; Li, Y.; Liu, X.; Cao, Q.; Zhu, Y.; Cao, W.; Tang, L. Development of a critical nitrogen dilution curve of double cropping rice in South China. Front. Plant Sci. 2017, 8, 638. [Google Scholar] [CrossRef] [Green Version]
  46. Yuan, Z.; Ata-Ul-Karim, S.T.; Cao, Q.; Lu, Z.; Cao, W.; Zhu, Y.; Liu, X. Indicators for diagnosing nitrogen status of rice based on chlorophyll meter readings. Field Crop. Res. 2016, 185, 12–20. [Google Scholar] [CrossRef]
  47. Tang, L.; Chang, R.; Basso, B.; Li, T.; Zhen, F.; Liu, L.; Cao, W.; Zhu, Y. Improving the estimation and partitioning of plant nitrogen in the RiceGrow model. J. Agric. Sci. 2018, 156, 959–970. [Google Scholar] [CrossRef]
  48. Zhao, B.; Ata-Ul-Karim, S.T.; Liu, Z.; Ning, D.; Xiao, J. Development of a critical nitrogen dilution curve based on leaf dry matter for summer maize. Field Crop. Res. 2017, 208, 60–68. [Google Scholar] [CrossRef]
  49. Ata-Ul-Karim, S.T.; Cang, L.; Wang, Y.; Zhou, D. Effects of soil properties, nitrogen application, plant phenology, and their interactions on plant uptake of cadmium in wheat. J. Hazard. Mater. 2020, 384, 121452. [Google Scholar] [CrossRef]
Figure 1. Comparison of critical, maximum, and minimum N dilution curves in wheat on a different basis (a): leaf dry matter basis; (b): stem dry matter basis; (c): plant dry matter basis; (d): leaf area index basis).
Agriculture 10 00500 g001
Figure 2. The relationships about nitrogen nutrition index (NNI) between plant dry matter based and leaf area index, leaf dry matter, and stem dry matter based at different growth stages (ad means relationship between PDM basis NNI and other indicators based NNI in different growth stages).
Agriculture 10 00500 g002
Figure 3. The relationships about accumulated nitrogen deficit (AND, kg ha−1) between plant dry matter (PDM) and leaf area index, leaf dry matter, and stem dry matter based at different growth stages (ad means relationship between PDM basis AND and other indicators based NNI in different growth stages).
Agriculture 10 00500 g003
Figure 4. Nitrogen nutrition index (NNI) of wheat at different growth stages on the basis of different critical N dilution curves (a): leaf dry matter basis; (b): stem dry matter basis; (c): plant dry matter basis; (d): leaf area index basis).
Agriculture 10 00500 g004
Figure 5. Accumulated N deficit (AND) (kg ha−1) of wheat at different growth stages on the basis of different critical N dilution curves (a): leaf dry matter basis; (b): stem dry matter basis; (c): plant dry matter basis; (d): leaf area index basis.
Agriculture 10 00500 g005
Figure 6. Relationships between relative yield (RY) and nitrogen nutrition index (NNI) on the bases of different critical N dilution curves at different growth stages (Dataset from experiments 4 and 5; (a,e,i,m): plant dry matter basis; (b,f,j,n): LAI basis; (c,g,k,o): leaf dry matter basis; (d,h,l,p): stem dry matter basis).
Agriculture 10 00500 g006
Figure 7. Relationships between relative yield (RY) and nitrogen nutrition index (NNI) on the basis of different cultivars’ critical N dilution curves (dataset from experiments 4 and 5; (a,e,i,m): Ningmai13; (b,f,j,n): Xumai30; (c,g,k,o): Yangfumai4; (d,h,l,p): Huaimai20).
Agriculture 10 00500 g007
Figure 8. Comparison of the critical nitrogen dilution curves with other curves in wheat on different bases (a): plant dry matter basis; (b): leaf dry matter basis; (c): leaf area index basis.
Agriculture 10 00500 g008
Figure 9. Relationships between different basis nitrogen nutrition index (NNI) values and relative yield (RY) (ad means different indicators based NNI values, a is PDM basis, b means LAI basis, c represents SDM basis, d is LDM basis).
Agriculture 10 00500 g009
Table 1. Basic information about five field experiments conducted in Jiangsu province.
Experiment No.LocationSoil CharacteristicCultivarNitrogen Rates (kg ha−1)Sampling Period
Experiment 1 (2012–2013)Rugao
(32.27° E, 120.76° N)
organic matter = 30.5 g kg−1NM130(N0)Feekes 3, 7, 10, 10.5, 10.7
total N = 2.49 mg kg−1XM3090(N2)
available P = 52.63 mg kg−1 180(N5)
available K = 93.48 mg kg−1 225(N6)
300(N8)
Experiment 2 (2013–2014)Rugao
(32.27° E, 120.76° N)
organic matter = 24.6 g kg−1NM130(N0)Feekes 3, 7, 10, 10.5, 10.7
total N = 1.87 mg kg−1XM3075(N1)
available P = 57.84 mg kg−1 150(N4)
available K = 96.32 mg kg−1 225(N6)
300(N8)
Experiment 3 (2014–2015)Rugao
(32.27° E, 120.76° N)
organic matter = 27.3 g kg−1NM130(N0)Feekes 3, 7, 10, 10.5, 10.7
total N = 2.09 mg kg−1YFM4120(N3)
available P = 55.43 mg kg−1HM20225(N6)
available K = 95.28 mg kg−1 330(N9)
Experiment 4 (2014–2015)Huai’an
(33.59° E, 118.88° N)
organic matter = 26.4 g kg−1NM130(N0)Feekes 3, 7, 10, 10.5, 10.7
total N = 1.99 mg kg−1YFM4120(N3)
available P = 58.54 mg kg−1HM20225(N6)
available K = 93.36 mg kg−1 330(N9)
Experiment 5 (2015–2016)Sihong
(33.36° E, 118.26° N)
organic matter = 35.5 g kg−1HM200(N0)Feekes 3, 7, 10, 10.5, 10.7
total N = 1.55 mg kg−1XM3090(N2)
available P = 45.83 mg kg−1 180(N5)
available K = 80.72 mg kg−1 270(N7)
360(N10)
Note: ‘NM13’ represents Ningmai13, ‘XM30’ is ‘Xumai30’, ‘YFM4’ means Yangfumai4, ‘HM20’ is Huaimai20. Feeks 3-10.7 represents different growth stages.
Table 2. The effects of growth stages and cultivars were tested by the analysis of variance tests.
SourceGrowth Stage × SlopeGrowth Stage × ThresholdCultivar × SlopeCultivar × Threshold
F value0.7760.6461.1560.591
p value0.5190.5930.3470.627
R20.090.0750.1390.069
Note: F value, p value, and R2 are the statistic values in the analysis of variance tests.
Publisher’s Note: MDPI stays neutral with regard to jurisdictional claims in published maps and institutional affiliations.

