Article

Variability of Phytochemicals by Breeding Year, Usage and Seed Size of Korean Soybean (Glycine max (L.) Merrill) Varieties

1
International Technology Cooperation Center, Rural Development Administration, Jeonju 54875, Jeollabuk-do, Korea
2
Department of Crop Science, College of Agriculture, Life Science and Environmental Chemistry, Chungbuk National University, Cheongju 28644, Chungcheongbuk-do, Korea
*
Authors to whom correspondence should be addressed.
These authors contributed equally to this article.
Agriculture 2020, 10(4), 100; https://doi.org/10.3390/agriculture10040100
Submission received: 3 March 2020 / Revised: 24 March 2020 / Accepted: 30 March 2020 / Published: 1 April 2020
(This article belongs to the Special Issue Genetics and Breeding of Soybean)

Abstract

:
The interest in phytochemicals from crops has grown in recent years, with soybean, as a functional crop, having great potential for providing a high level of nutrition. Therefore, the aim of this study was to evaluate phytochemicals from Korean soybean varieties, and to provide the basic information necessary for targeted breeding of soybean. The seeds of 172 soybean varieties were collected from various domestic institutes, and their phytochemicals were analyzed and compared based on agronomic characteristics (color, size, usage, etc.) using cluster analysis. We found that the soybean varieties contained relatively higher levels of the following phytochemicals: lutein (3 var., >7.0 μg g−1 seed), tocopherols (26 var., >300 μg g−1 seed), and phytosterols (33 var., >1000 μg g−1 seed). Overall, phytochemical levels were higher in varieties released since 2000 and with small-sized seeds (<12 g, 100-seed weight). The distribution of phytochemicals varied according to the usage (cooking, sauce, sprouts, etc.), even though the highest levels of each phytochemical were mainly observed in sprouts. The cluster analysis using three main components classified the varieties into five groups. Of them, group III showed relatively higher tocopherols, group IV had relatively higher lutein, and group I had relatively higher phytosterols. Jonam and Manpoong (group I) were observed in varieties high in phytochemicals. Overall, some Korean soybean varieties were found to have relatively higher levels of phytochemicals compared to those reported in previous studies of other origins. In conclusion, our findings suggest that some varieties might provide suitable breeding material for target-centered improvement of soybean varieties, and a comparison between different origins is necessary for providing better knowledge for soybean breeding.

1. Introduction

Soybean, as one of the staple crops that provides nutrition for humans, is also a main crop in South Korea. Thus, new varieties are constantly released, having been developed toward various goals such as high yield and quality, pest and disease resistance, suitability for machine customization, and to meet social needs. In Korea, a total of 178 soybean varieties have been developed since 1913, when the first variety, Jangdanbaekmok, was developed using pure line selection, demonstrating a wide variety of function and usage [1].
Soybean contains large amounts of phytochemicals that are beneficial to human health, including proteins and lipids. Phytochemicals such as lutein, tocopherol, and phytosterol play important roles as antioxidants [2,3], anticancer agents [4,5,6], eyesight protectants [7], and in lowering blood cholesterol [8,9,10,11]. Lutein is an abundant compound in soybean seed; however, its contents are dependent upon genetic and environmental traits such as chlorophyll in cotyledons [12], seed maturity [12,13], and planting time [14]. Tocopherols are also compounds that are largely contained in soybean seeds, especially in α, γ, and δ forms [15]. The contents of tocopherol vary from plant organs, ranging from the highest in photosynthetic tissues such as leaves, to the lowest in seeds [16]. Tocopherol contents are largely affected by environmental factors such as planting time, fertilization, and soil texture in addition to genetic traits [17,18], and can be increased two to three times by high temperature and drought conditions [19]. Phytosterols from soybean seeds generally represent 0.2%–0.3% of total phytochemicals, even though the contents may differ across cultivars and according to environmental factors [20,21].
In Korea, like in other countries, soybean is a staple food that is consumed in various forms, such as in sauces, sprouts, and cooked with rice and vegetables. The use of soybean seed is determined by seed color: e.g., yellow seeds are used in sauce, green as sprouts, and black for cooking with rice. In addition, soybean seeds in Korea are divided into three sizes; small, medium, and large, based on their 100-seed weight. The present investigation was performed to survey the genotypic variability of several functional phytochemicals—lutein, tocopherols, and phytosterol—among the soybean genotypes released in Korea over the past 100 years, and to determine the relationship between those metabolites and the usage and size of soybean seeds using multivariate analysis. We suggest that the results from this study may assist in directing future soybean breeding according to market needs.

2. Materials and Methods

2.1. Plant Materials and Cultivation

We examined 172 varieties of soybean (Glycine max (L.) Merrill), which were released in the past 100 years, from 1913 to 2013, from various research centers in Korea (Table S1). Soybean, which has various usages including in sauces, as sprouts, and for cooking with rice and vegetables, was cultivated at an experimental field of Chungbuk National University after sowing on 28 May 2014. The density was 0.7 m (row) × 0.15 m (plant) with three seeds, and two seedlings were thinned as the first leaf emerged. Per the recommendation of the Rural Development Administration (RDA), South Korea, the supplied fertilization was 500 kg/ha (N/P2O5/K2O = 30:30:34 kg/ha) as a dressing, and other management was performed following the RDA recommendations.

2.2. Metabolite Analysis

All chemicals used for targeted metabolites were purchased from Sigma-Aldrich (St. Louis, Missouri, USA). The soybean seeds were harvested and dried for 3 days in a 40 °C dry oven, and then used for analysis after confirming that the moisture content was 16% or less. For lutein analysis, the powder (0.25 g) of well-dried soybean seeds after harvest was extracted with an extraction solution of ethanol/acetone/hexane (1:1:2). The extracts reacted with methanol containing 15% KOH at 80 °C for 15 min, separated by a mixture of dH2O/petroleum ether/diethyl ether (1:2:1), and the supernatants were finally incorporated into a mixture of methanol/acetonitrile/chloroform (5:4:1) including 0.2% butylated hydroxy-toluene (BHT) as an analytical sample. Tocopherol from soybean seeds (1 g of powder) was first extracted using 6% pyrogallol and, finally, by addition of 30 mL of 0.1% NaCl after reaction with 8 mL of 60% KOH at 75 °C for 50 min. The extracts were separated by 20 mL of hexane/ethyl acetate (85:15 (v/v)) including 0.1% BHT. The supernatants re-separated by MgSO4 solution were dissolved in 1 mL of hexane. Phytosterols from soybean seeds (1 g of powder) were first extracted using 10% of ethanol, reacted with 4 mL of 60% KOH at 80 °C for 50 min, and finally separated by 20 mL of hexane/ethyl acetate (85:15 (v/v)) including 0.01% BHT. The supernatants re-separated by MgSO4 solution were dissolved in 3 mL of hexane. Lutein and tocopherol were analyzed by high-performance liquid chromatography (HPLC), and phytosterols were analyzed by gas chromatography (GC). The HPLC and GC operating conditions, standard calibration curve determination, acquisitions of chromatograms, and quantification for all metabolites mentioned above are described in detail in the Supplementary Materials (Tables S2–S7, Figures S1–S3).

2.3. Statistics

Analysis was conducted in triplicate, with data reported as mean ± standard deviation. All data were subjected to statistical analysis (ANOVA) with SAS software package (ver. 9.4, SAS Institute, Cary, NC, USE). Data were analyzed using PROC general linear model (GLM) procedure, and means were separated on the basis of Duncan’s multiple range test (DMRT). Significances were set at the 5% level. Soybean varieties based on the contents of metabolites were classified according to release year, usage, and seed size, using multivariate analysis. Principal component analysis (PCA) was performed for the results of lutein, tocopherol, and phytosterols of the soybean varieties. After performing the PCA, the cluster analysis was performed using the average-linkage cluster (ALC) method by means of the main component score.

3. Results

3.1. Lutein, Tocopherol, and Phytosterol Contents in Soybean Seeds

Phytochemicals, lutein, tocopherols, and phytosterols were measured in the seeds of 172 soybean varieties released in Korea since 1913. The contents of lutein, total tocopherols, and phytosterols were 0.2–8.3 μg g−1 seed (average = 2.52 μg g−1 seed), 76.9–360.3 μg g−1 seed (average = 221.4 μg g−1 seed), and 425–1313 μg g−1 seed (average = 810 μg g−1 seed), respectively. Of the 172 varieties, the majority of varieties (133, 77%) ranged between 1.0 and 4.0 μg g−1 seed of lutein content, and varieties containing higher lutein (>7.0 μg g−1 seed) were Heukcheong (8.31 μg g−1 seed), Soheuk (8.09 μg g−1 seed), and Youngyang (7.02 μg g−1 seed). Tocopherols are classified into α, β, γ, and δ isomers. The highest levels of α- (>50.0 μg g−1 seed), β- (>5.0 μg g−1 seed), γ- (>200.0 μg g−1 seed), and δ-tocopherols (>90.0 μg g−1 seed) were observed in one variety, (Sohwang, 93.3 μg g−1 seed), five varieties including Gyeongsang#1 (7.5 μg g−1 seed), 24 varieties including Galchae (251.1 μg g−1 seed), and seven varieties including Saeal (104.9 μg g−1 seed), respectively. A higher proportion of α-tocopherol, compared to total tocopherols, was found in 16 varieties (ranging from 15% to 31%), and Sohwang had the highest ratio (31%). Phytosterols are also classified into β-sitosterol, campesterol, and stigmasterol. The highest β-sitosterol (>700 μg g−1 seed), campesterol (>300 μg g−1 seed), and stigmasterol (>300 μg g−1 seed) were observed in four varieties including Iksannamul (766 μg g−1 seed), one variety (Jonam, 303 μg g−1 seed), and seven varieties including Wonkwang (347 μg g−1 seed), respectively (Figure S4 and Table S8). Overall, the proportion of β-sitosterol, campesterol, and stigmasterol ranged from 37%–69%, 13%–31%, and 14%–38%, respectively.
We specifically re-evaluated the contents of phytochemicals in three categories: breeding year (Table 1), usage (Table 2), and seed size (Table 3). Lutein contents were higher in recently released varieties (since 1990), even though the difference between breeding years was not statistically significant. Soybean varieties released since 2000 showed markedly higher tocopherol contents, and a similar tendency was observed for phytosterols. Tocopherol contents were largely dependent on the usage of soybean (Table 2). α- and β-tocopherols were relatively higher in vegetable varieties, and the maximum was observed in sprouts for α-tocopherol and in cooking with rice for β-tocopherol. By contrast, the highest levels of γ- and δ-tocopherols were found in sauce varieties. Phytosterols, β-sitosterol, campesterol, and stigmasterol were highest in sprout varieties followed by cooking with rice, in sauce, and as vegetable. In Korea, soybean seeds are generally classified into three sizes, small, medium, and large, based on their 100-seed weight. A majority of phytochemicals were found to be in higher levels in the small-seed varieties. The average content of lutein was 3.63 μg g−1 seed in the small-seed group, 2.71 μg g−1 seed in the medium-seed group, and 2.17 μg g−1 seed in the large-seed group. The average contents of α-, β-, γ-, and δ-tocopherol were respectively 22.7, 1.77, 151.2, and 49.4 μg g−1 seed in the small-seed group; 17.2, 1.61, 146.1, and 51.9 μg g−1 seed in the medium seed group; and 18.4, 1.92, 149.0, and 54.2 μg g−1 seed in the large seed group. The average contents of β-sitosterol, campesterol, and stigmasterol were 522.8, 213.7, and 216.3 μg g−1 seed in the small-seed group; 464.0, 181.0, and 180.4 μg g−1 seed in the medium-seed group; and 401.0, 162.9, and 196.6 μg g−1 seed in the large-seed group, respectively.

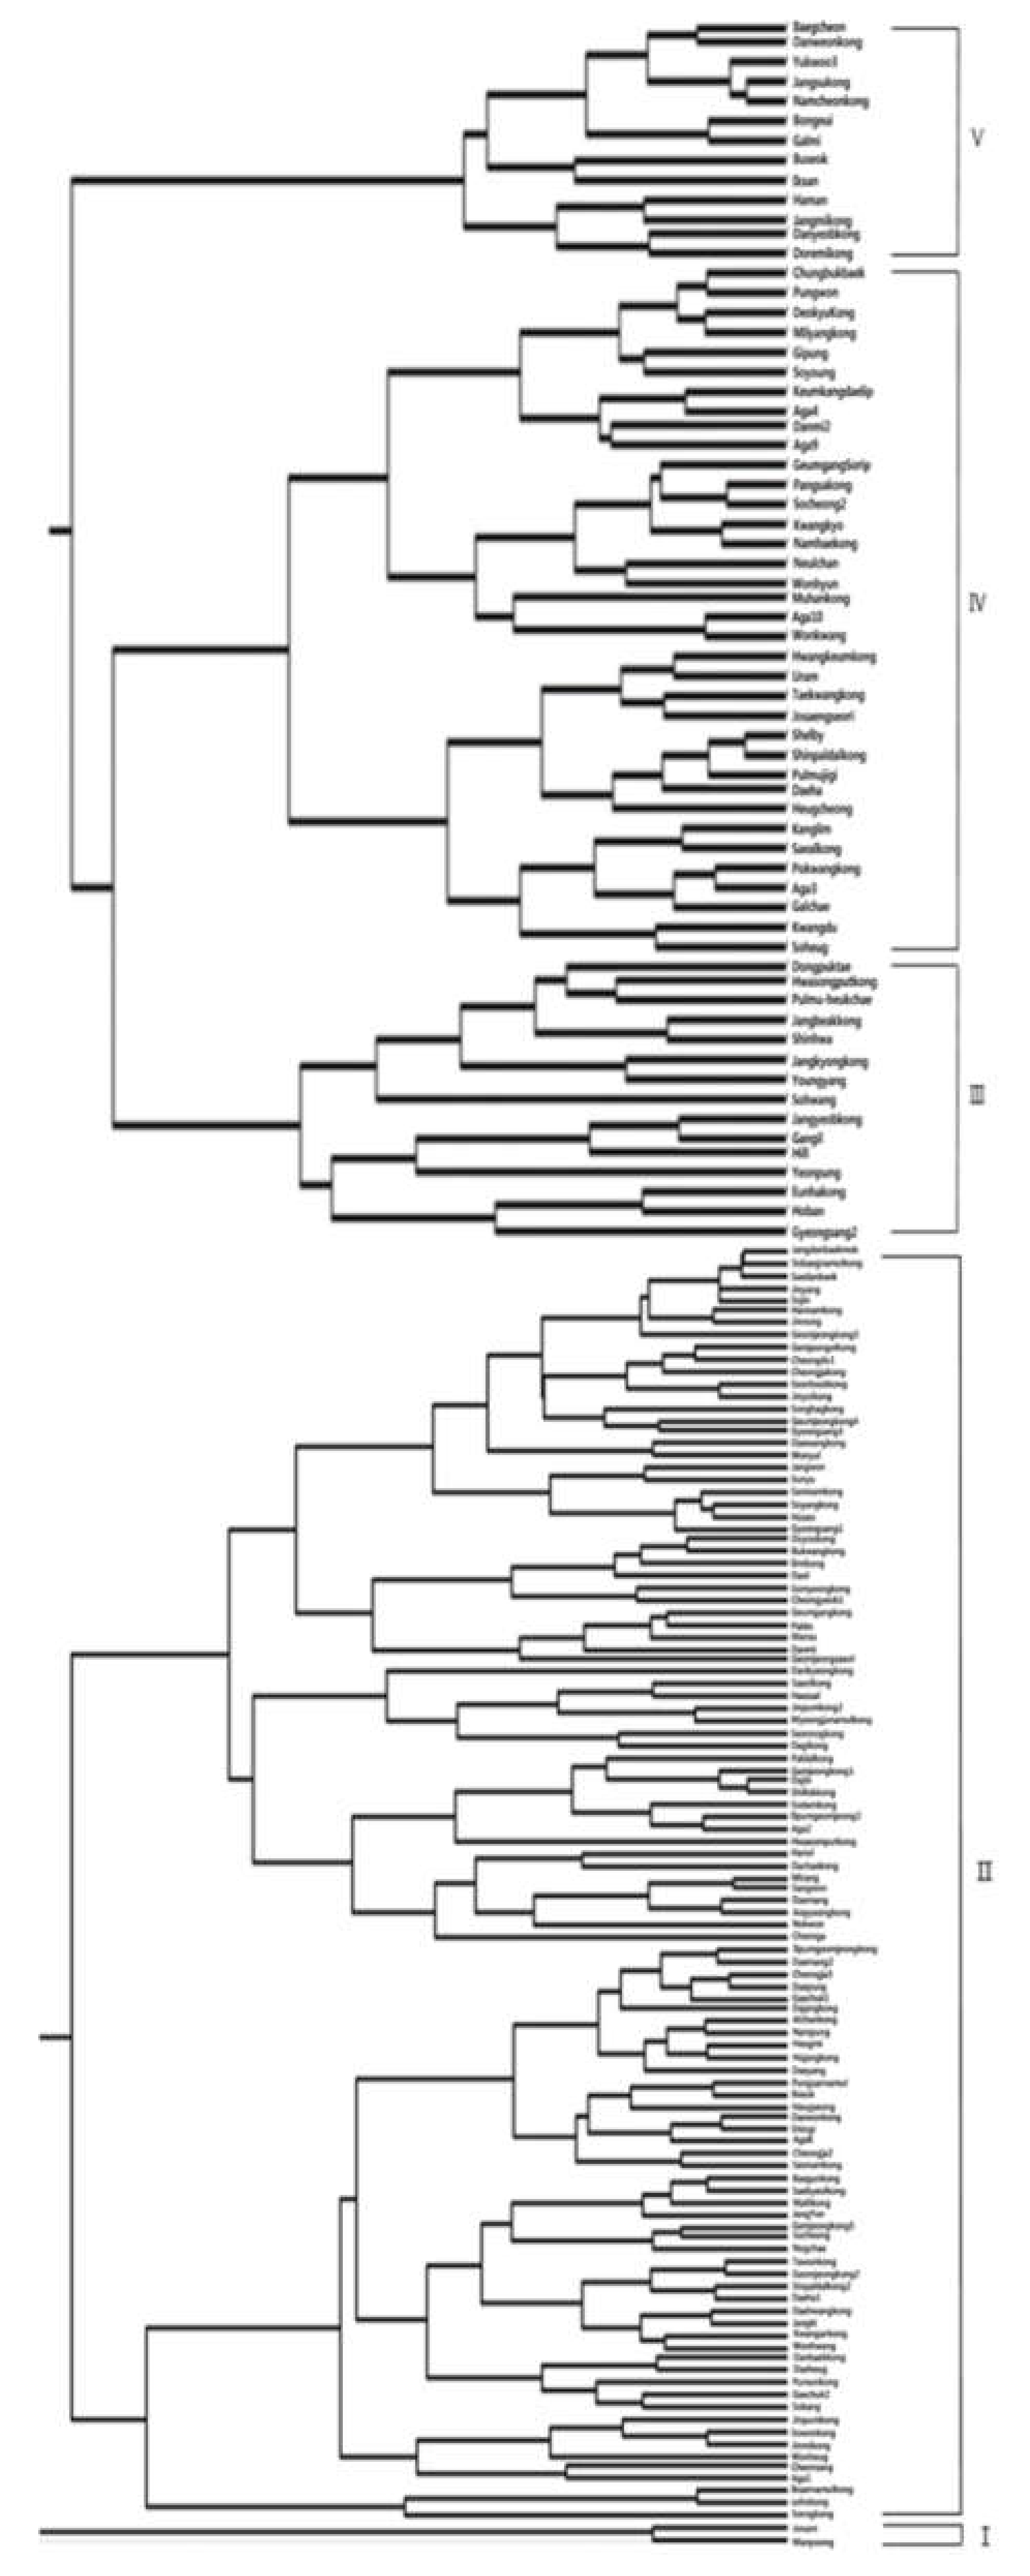
3.2. Diversity of Soybean Varieties

PCA was performed with 10 phytochemicals, including the total contents for 172 Korean soybean varieties (Table S9 and S10). The first principal component (PC1) had the highest eigenvalue of 3.27, and accounted for 32.7% of the variability in the dataset. The second and third PCs (PC2 and PC3, respectively) had eigenvalues of 2.88 and 1.34, accounting for 28.8% and 13.4% of the variance in the data, respectively. Cluster classification is performed by selecting only the principal components that explain the variation of the data among the 10 principal components, and generally determines the number of PCs with an eigenvalue of 1 or more [22]. Therefore, the PCA of 10 components revealed that the cumulative contribution from the first to the third main component was 74.9%, and it was possible to classify Korean soybean varieties using the three main components.
As a result of cluster analysis using the first to third main components, the 172 Korean soybean varieties were divided into five clusters based on an average distance of 1.0 (Figure 1). Each variety was classified into two varieties (1.2%) in cluster I, 106 varieties (61.6%) in cluster II, 15 varieties (8.7%) in cluster III, 36 varieties (20.9%) in cluster IV, and 13 varieties (7.6%) in cluster V. About 82.5% of the total number of varieties belonged to cluster II and III. The total tocopherol and phytosterol contents of cluster I were highest at 311.5 and 1284.9 μg g−1, respectively. Cluster II had the lowest contents of lutein (2.2 μg g−1), α-tocopherol (15.0 μg g−1), γ-tocopherol (121.3 μg g−1), and δ-tocopherol (42.2 μg g−1). In cluster III, the α-tocopherol (38.2 μg g−1) and β-tocopherol (4.6 μg g−1) contents were the highest. Cluster IV had the highest lutein content of 3.2 μg g−1. Cluster V contained the lowest levels of β-tocopherol (1.2 μg g−1), β-sitosterol (286.1 μg g−1), campesterol (90.4 μg g−1), stigmasterol (128.2 μg g−1), and total phytosterol (504.6 μg g−1) (Table 4).
The distributions of each cluster by breeding year, usage, and 100-seed weight are shown in Table 5. Cluster I belonged to the breeding years of 2000 to 2013. In cluster II, 64 varieties (37.2%) were most widely distributed in the period 2000 to 2013, 32 varieties (18.6%) in the 1990s, nine varieties (5.2%) in the 1980s, and only one variety (0.6%) before 1980. In cluster III, seven varieties (4.1%) were distributed in breeding year of 2000 to 2013, and the lowest included two varieties (1.2%) in the 1990s. In cluster IV, 18 varieties (10.5%) were distributed in breeding years 2000 to 2013, 10 varieties (5.8%) before 1980s, six varieties (3.5%) in the 1980s, and two varieties (1.2%) in the 1990s. In cluster V, eight varieties (4.7%) were mostly distributed before the 1980s, and none represented breeding years 2000 to 2013 (Table 5). For distribution by use type, in cluster I, two varieties (1.2%) were for sauce. Cluster II was the most common, with 40 varieties (23.3%) for sauce, 33 varieties (19.2%) for bean sprouts, 20 varieties (11.6%) for cooking with rice, and 13 varieties (7.6%) for vegetables. In cluster III, seven varieties (4.1%) were for sauce, six varieties (3.5%) for bean sprouts, and one (0.6%) for cooking with rice and vegetables. In cluster IV, 21 varieties (12.2%) were for sauce, 11 (6.4%) for bean sprouts, three varieties (1.7%) for cooking with rice, and one (0.6%) for vegetables. In cluster V, 10 varieties (5.8%) were for sauce, and two varieties (1.2%) for bean sprouts (Table 5). For distribution by 100-seed weight, cluster I included both small and large varieties. Cluster II consisted 61 large varieties (35.5%), 35 medium varieties (20.3%), and 10 small varieties (5.8%). Cluster III had seven large varieties (4.1%), six medium varieties (3.5%), and two small varieties (1.2%). In cluster IV, 18 varieties (10.5%) were large, 11 varieties (6.4%) were medium, and seven varieties (4.1%) were small. Cluster V had six large varieties (3.5%) and seven medium varieties (4.1%) (Table 5).

4. Discussion

The quality of soybean seeds was reported to be relatively largely dependent on environmental conditions such as temperature, CO2 level, and soil water status [23]. In this study, we evaluated several phytochemicals that exist in relative abundance in common soybean varieties by breeding year, usage, and seed size. Among 172 varieties, three varieties have lutein contents above 7.0 μg g−1 seed, and 23 varieties more than 4.0 μg g−1 seed. Even though lutein contents in soybean are widely distributed by genotype [24], our results showed that Korean soybean varieties have relatively higher levels than those reported from other origins, such as the United States, China, Japan, Taiwan, and Vietnam [25]. Lutein, a member of the xanthophyll family of carotenoids, is effective for human eye protection [26] and anti-aging [7]. Therefore, some of the Korean varieties that have higher lutein contents could be used as breeding material to enhance lutein content. In particular, three varieties (more than 7.0 μg g−1 seed; Heukcheong, Soheuk, and Youngyang) have higher pest resistance and primary metabolites (sugar, protein, and oil), and are generally used in sauces or for cooking with rice in Korea. Among the four isomers of tocopherols, α-tocopherol is relatively important for human health. However, a majority of soybean varieties throughout the world contain only less than 10% of total tocopherols in soybean seed [27]. Our findings revealed that 14 Korean varieties, including Sohwang (31%), had more than 15% of tocopherols in the form of α-tocopherol, and these varieties commonly contained relatively less γ-tocopherol. Due to the relatively important value of α-tocopherol, many of the previous studies examined the variability of α-tocopherol under various genetic and environmental factors [18,27,28]. In general, α-tocopherol ranges from 4% to 10% of the total tocopherols in Korean soybean seeds [29] and is strongly affected by environmental conditions, particularly high temperature [27,28,30]. Nevertheless, the variability of α-tocopherol was found to be affected more by genotype than by environmental factors and agricultural practices [28], and the broad- and narrow-sense heritability of α-tocopherol are higher (0.59 to 0.645) compared to other crop species [31,32]. As shown in Table 1, soybean varieties containing higher α-tocopherol content were created in recent years. Our possible explanation for this observation is that some of the high α-tocopherol-containing varieties could be material lines used to enhance α-tocopherol and, particularly, the combination with agricultural practices (planting date and density) may involve environmental variance that contributes to elevating α-tocopherol against climate change.
We also found some interesting results regarding phytosterols in the soybean seeds. The major phytosterol present in soybean seed was reported to be β-sitosterol (43%–67%), followed by campesterol (17%–34%) and stigmasterol (10%–30%) [33]. Overall, we found that Korean soybean varieties contain relatively higher phytosterol contents compared with those of other origins, and among these, 18 varieties contained in excess of 600 μg g−1 seed, which is at least 1.5-fold higher compared to the highest level reported in previous studies [33]. As shown in Table 3, the highest levels of phytosterols being observed in sprout varieties suggests possibilities for a new breeding strategy for phytosterol-rich varieties. In addition, small-sized varieties (less than 12 g 100-seed−1) showed a tendency to have higher phytosterol contents (Table 4). These observations differ somewhat from previous reports, in which phytosterol levels were almost constant across genotypes, seed sizes, and harvest years [33,34,35]. The differences in the current study suggest the need to compare phytosterols from different origins to provide more information for breeding strategies corresponding to an increasing demand. Clustering of the data was used to group the 172 evaluated varieties into five distinct clusters (Figure 1). Jonam and Manpoong, belonging to group I, are the most valuable varieties in terms of the average contents of phytochemicals (Table 5). These varieties have the same primary usage (sauce), although their seed sizes differ. Group III consists of 15 varieties that have relatively higher levels of α- and β-tocopherols, and group IV has higher lutein. The current findings provide useful information for developing new varieties suitable for various breeding goals. We recommend comprehensive studies be conducted comparing contents between different origins according to the same parameters to further build upon our findings.

5. Conclusions

Soybean is an important nutritional source for human and animal health, containing not only protein, oil, and carbohydrate, but also being a major source of functional metabolites (phytochemicals). Higher levels of phytochemicals were found in recently bred lines (since 2000) that are primarily used as sprouts, and with a 100-seed weight less than 20 g. The cluster analysis showed that the highest lutein-containing varieties belong to group III, higher tocopherols to group I, and higher phytosterols to groups I and IV. The characterization of phytochemicals reported here, from the 172 Korean varieties, provides a useful foundation upon which to base such decisions as variety selection and breeding strategy to meet the needs of farmers and consumers, and even regarding environmental variance, although more studies are necessary for better evaluation.

Supplementary Materials

The following are available online at https://www.mdpi.com/2077-0472/10/4/100/s1: Table S1: Breeding year and organization used in this study; Table S2–S7 and Figure S1–S3: HPLC and GC operating conditions, standard calibration curve determination, acquisitions of chromatograms, and quantification of for all metabolites; Figure S4: Distribution of phytochemicals; Table S8: Contents of phytochemicals; Table S9 and S10: Principal component analysis.

Author Contributions

Conceptualization: J.S. and H.-S.K.; methodology: T.-Y.H. and B.-D.P.; formal analysis: T.-Y.H. and B.-D.P.; investigation: T.-Y.H., B.-D.P., and J.S.; resources: H.-S.K.; data curation: T.-Y.H.; writing–original draft preparation: T.-Y.H.; writing–review and editing: J.S. and H.-S.K.; visualization: T.-Y.H.; supervision: J.S.; project administration: H.-S.K.; funding acquisition: H.-S.K. All authors have read and agreed to the published version of the manuscript.

Funding

This research received no external funding.

Conflicts of Interest

The authors declare no conflicts of interest.

References

  1. Lee, G.Y.; So, Y.S.; Kim, J.H.; Jang, E.K.; Lee, K.H.; Yun, G.S.; Hwang, S.G. Variation of Growth and Yield Component Characters and Varietal Classification by Multivariate Analysis in Korean Soybean Varieties. Korean J. Int. Agric. 2015, 27, 348–357. [Google Scholar] [CrossRef]
  2. Traber, M.G.; Sies, H. Vitamin E in humans: Demand and delivery. Ann. Rev. Nutr. 1996, 16, 321–347. [Google Scholar] [CrossRef] [PubMed]
  3. Mortensen, A.; Skibsted, L.H. Importance of carotenoid structure in radical-scavenging reactions. J. Agric. Food Chem. 1997, 45, 2970–2977. [Google Scholar] [CrossRef]
  4. Awad, A.B.; Fink, C.S. Phytosterols as anticancer dietary components: Evidence and mechanism of action. J. Nutr. 2000, 130, 2127–2130. [Google Scholar] [CrossRef] [PubMed]
  5. Tucker, J.M.; Townsend, D.M. Alpha-tocopherol: Roles in prevention and therapy of human disease. Biomed. Pharmacother. 2005, 59, 380–387. [Google Scholar] [CrossRef]
  6. Choi, J.M.; Lee, E.O.; Lee, H.J.; Kim, K.H.; Ahn, K.S.; Shim, B.S.; Kim, S.H. Identification of campesterol from Chrysanthemum coronarium L. and its antiangiogenic activities. Phytother. Res. 2007, 21, 954–959. [Google Scholar] [CrossRef]
  7. Mares-Perlman, J.A.; Millen, A.E.; Ficek, T.L.; Hankinson, S.E. The body of evidence to support a protective role for lutein and zeaxanthin in delaying chronic disease. Overview. J. Nutr. 2002, 132, 518S–524S. [Google Scholar] [CrossRef]
  8. Jones, P.J.; MacDougall, D.E.; Ntanios, F.; Vanstone, C.A. Dietary phytosterols as cholesterol-lowering agents in humans. Can. J. Physiol. Pharm. 1997, 75, 217–227. [Google Scholar] [CrossRef]
  9. Wong, N.C. The beneficial effects of plant sterols on serum cholesterol. Can. J. Cardiol. 2001, 17, 715–721. [Google Scholar]
  10. Satou, H. Physiological effects and safety of plant sterols. Oleoscience 2003, 3, 395–401. [Google Scholar] [CrossRef]
  11. Ostlund, R.E., Jr. Phytosterols and cholesterol metabolism. Curr. Opin. Lipidol. 2004, 15, 37–41. [Google Scholar] [CrossRef] [PubMed]
  12. Monma, M.; Terao, J.; Ito, M.; Saito, M.; Chikuni, K. Carotenoid components in soybean seeds varying with seed color and maturation stage. Biosci. Biotechnol. Biochem. 1994, 58, 926–930. [Google Scholar] [CrossRef]
  13. Simonne, A.H.; Smith, M.; Weaver, D.B.; Vail, T.; Barnes, S.; Wei, C.I. Retention and changes of soy isoflavones and carotenoids in immature soybean seeds (Edamame) during processing. J. Agric. Food Chem. 2000, 48, 6061–6069. [Google Scholar] [CrossRef] [PubMed]
  14. Dhakal, K.H.; Choung, M.G.; Hwang, Y.S.; Fritschi, F.B.; Shannon, J.G.; Lee, J.D. Selection for soyabeans with high and environmentally stable lutein concentrations. Plant. Genet. Res. 2014, 12, S12–S16. [Google Scholar] [CrossRef]
  15. Almonor, G.O.; Fenner, G.P.; Wilson, R.F. Temperature effects on tocopherol composition in soybeans with genetically improved oil quality. J. Am. Oil Chem. Soc. 1998, 75, 591–596. [Google Scholar] [CrossRef]
  16. Munne-Bosch, S.; Alegre, L. The function of tocopherols and tocotrienols in plants. Crit. Rev. Plant. Sci. 2002, 21, 31–57. [Google Scholar] [CrossRef]
  17. Britz, S.J.; Kremer, D.F. Warm temperatures or drought during seed maturation increase free α-tocopherol in seeds of soybean (Glycine max [L.] Merr.). J. Agric. Food Chem. 2002, 50, 6058–6063. [Google Scholar] [CrossRef]
  18. Seguin, P.; Tremblay, G.; Pageau, D.; Liu, W. Soybean tocopherol concentrations are affected by crop management. J. Agric. Food Chem. 2010, 58, 5495–5501. [Google Scholar] [CrossRef]
  19. Seguin, P.; Turcotte, P.; Tremblay, G.; Pageau, D.; Liu, W. Tocopherols concentration and stability in early maturing soybean genotypes. Agron. J. 2009, 101, 1153–1159. [Google Scholar] [CrossRef]
  20. Kajimoto, G.; Shibahara, A.; Yamashoji, S. Changes in the contents and compositions of lipids, fatty acids, tocopherols and sterols in soybean seed curing maturation. J. Jpn. Oil Chem. Soc. 1983, 32, 170–174. [Google Scholar] [CrossRef] [Green Version]
  21. Nagao, A.; Yamazaki, M. Changes in lipid composition of soybean seeds during maturation. J. Jpn. Oil Chem. Soc. 1988, 37, 991–999. [Google Scholar] [CrossRef]
  22. Janmohammadi, M.; Sabaghnia, N.; Nouraein, M. Path Analysis of Grain Yield and Yield Components and Some Agronomic Traits in Bread Wheat. Acta Univ. Agric. Silvic. Mendel. Brun. 2014, 62, 945–952. [Google Scholar] [CrossRef] [Green Version]
  23. Caldwell, C.R.; Britz, S.J.; Mirecki, R.M. Effect of temperature, elevated carbon dioxide, and drought during seed development on the isoflavone content of dwarf soybean [Glycine max (L.) Merrill] grown in controlled environments. J. Agric. Food Chem 2005, 53, 1125–1129. [Google Scholar] [CrossRef] [PubMed]
  24. Kanamaru, K.; Wang, S.; Abe, J.; Yamada, T.; Kitamura, K. Identification and characterization of wild soybean (Glycine soja Sieb. et Zecc.) strains with high lutein content. Breed. Sci 2006, 56, 231–234. [Google Scholar] [CrossRef] [Green Version]
  25. Lee, J.D.; Shannon, J.G.; So, Y.S.; Sleper, D.A.; Nelson, R.L.; Lee, J.H.; Choung, M.G. Environmental effects on lutein content and relationship of lutein and other seed components in soybean. Plant. Breed. 2009, 128, 97–100. [Google Scholar] [CrossRef]
  26. Landrum, J.T.; Bone, R.A. Lutein, zeaxanthin, and the macular pigment. Arch. Biochem. Biophys. 2001, 385, 28–40. [Google Scholar] [CrossRef]
  27. Britz, S.J.; Kremer, D.F.; Kenworthy, W.J. Tocopherols in soybean seeds: Genetic variation and environmental effects in field-grown crops. J. Am. Oil. Chem. Soc. 2008, 85, 931–936. [Google Scholar] [CrossRef]
  28. Shaw, E.J.; Kakuda, Y.; Rajcan, I. Effect of genotype, environment, and genotype x environment interaction on tocopherol accumulation in soybean seed. Crop. Sci. 2016, 56, 40–50. [Google Scholar] [CrossRef]
  29. Kim, H.J.; Lee, H.O.; Min, D.B. Effects and Prooxidant Mechanisms of Oxidized α-Tocopherol on the Oxidative Stability of Soybean Oil. J. Food Sci. 2007, 72, C223–C230. [Google Scholar] [CrossRef]
  30. Cem, O.; Egesel, E.M.; Kemal, I.E. The effect of nitrogen fertilization on tocopherols in rapeseed genotypes. Eur. Food Res. Technol. 2008, 227, 871–880. [Google Scholar]
  31. Dwiyanti, M.S.; Ujiie, A.; Thuy, L.T.B.; Yamada, T.; Kitamura, K. Genetic analysis of high α-tocopherol content in soybean seeds. Breed. Sci. 2007, 57, 23–28. [Google Scholar] [CrossRef] [Green Version]
  32. Wang, S.; Kanamaru, K.; Li, W.; Abe, J.; Yamanda, T.; Kitamura, K. Simultaneous accumulation of high concentration of α-tocopherol and luteins is possible in seeds of soybean [Glycine max (L.) Merr.]. Breed. Sci. 2007, 57, 297–304. [Google Scholar] [CrossRef] [Green Version]
  33. Yamaya, A.; Endo, Y.; Fujimoto, K.; Kitamura, K. Effects of genetic variability and planting location on the phytosterol content and composition in soybean seeds. Food Chem. 2007, 102, 1071–1075. [Google Scholar] [CrossRef]
  34. Mohamed, A.I.; Rangappa, M. Nutrient composition and anti-nutritional factors in vegetable soybean: II. Oil, fatty acids, sterols, and lipoxygenase activity. Food Chem. 1992, 44, 277–282. [Google Scholar] [CrossRef]
  35. Maestri, D.; Meriles, J.M.; Guzman, C.A. Correlation of maturity groups with seed composition in soybeans, as influenced by genotypic variation. Grssas Y Aceites 1998, 49, 395–399. [Google Scholar] [CrossRef] [Green Version]
Figure 1. Cluster analysis of 172 Korean soybean varieties based on the phytochemical, lutein, tocopherol, and phytosterol data.
Agriculture 10 00100 g001
Table 1. Distribution of lutein, tocopherols, and phytosterols of 172 soybean varieties by breeding year.
BreedingLutein
(μg g−1)
Tocopherol (μg g−1)Phytosterol (μg g−1)
αΒγδβ-SitosterolCampesterolStigmasterol
Before 1980Max.4.7138.96.47237.0104.9561.5249.1324.2
Min.1.1911.10.12127.048.9183.765.395.8
Mean ± SD2.15 ± 0.9 ns21.8 ± 7.4 a2.02 ± 1.43 ns192.1 ± 27.2 a76.7 ± 16.6 a393.8 ± 108.2 b146.0 ± 51.5 b178.4 ± 55.8 ns
1980sMax.4.0944.34.86218.685.8673.4266.6274.2
Min.0.235.20.2130.022.4275.486.8112.5
Mean ± SD2.26 ± 1.0919.0 ± 9.4 ab1.78 ± 1.30156.1 ± 47.5 b56.9 ± 19.5 b490.1 ± 115.5 a192.3 ± 51.2 a192.7 ± 49.8
1990sMax.8.3142.46.44230.381.0765.9282.2275.0
Min.0.496.50.0378.727.5225.066.297.1
Mean ± SD2.17 ± 1.2815.8 ± 7.1 b1.37 ± 1.32137.3 ± 39.3 b48.4 ± 13.1 c405.6 ± 139.8 b166.9 ± 53.0 ab181.2 ± 48.2
After 1999 (2000–2013)Max.8.0993.37.48251.190.3724.9302.7347.2
Min.0.24.00.0354.223.5206.288.2100.4
Mean ± SD2.82 ± 1.7018.7 ± 11.8 ab1.93 ± 1.40140.6 ± 41.4 b48.1 ± 16.0 c448.7 ± 121.2 ab181.7 ± 55.4 a202.3 ± 61.0
* a, b, c, and ns: Means with different letters within a column are significantly different at the 5% level.
Table 2. Distribution of lutein, tocopherols, and phytosterols of 172 soybean varieties by usage.
UsageLutein
(μg g−1)
Tocopherol (μg g−1)Phytosterol (μg g−1)
αΒγδβ-SitosterolCampesterolStigmasterol
SauceMax.8.0942.46.47237.0104.9724.9302.7324.2
Min.0.236.00.0330.024.0183.765.395.8
Mean ± SD2.09 ± 1.12 b18.9 ± 7.8 ab1.81 ± 1.34 ab160.5 ± 46.4 a60.3 ± 19.4 a424.7 ± 120.1 a172.0 ± 53.7 ab191.2 ± 53.3 ns
SproutsMax.7.0293.35.24251.190.3765.9292.4347.2
Min.0.775.20.0370.322.4234.268.197.1
Mean ± SD3.02 ± 1.44 a19.3 ± 13.9 ab1.73 ± 1.33 ab141.2 ± 42.9 ab46.8 ± 15.7 b486.7 ± 130.0 a192.1 ± 54.7 a197.4 ± 57.9
Cooking with riceMax.8.3141.77.48226.579.6706.3285.5320.7
Min.1.294.00.4098.025.9225.766.2114.0
Mean ± SD3.59 ± 1.96 a13.8 ± 7.7 a1.53 ± 1.43 b140.3 ± 31.9 ab48.0 ± 13.6 b430.1 ± 112.6 a166.6 ± 57.7 ab194.2 ± 64.0
VegetableMax.2.3632.56.44162.081.0538.4264.5298.8
Min.0.206.00.0969.024.2206.2100.5100.4
Mean ± SD1.29 ± 0.55 c21.4 ± 8.3 a2.41 ± 1.65 a120.4 ± 24.6 b42.5 ± 14.9 b339.2 ± 92.8 b145.8 ± 45.3 b189.4 ± 64.8
* a, b, c, and ns: Means with different letters within a column are significantly different at the 5% level.
Table 3. Distribution of lutein, tocopherols, and phytosterols of 172 soybean varieties by seed weight.
100-Seed WeightLutein
(μg g−1)
Tocopherol (μg g−1)Phytosterol (μg g−1)
αβγδβ-SitosterolCampesterolStigmasterol
Small
(<12 g)
Max.7.0293.33.87251.190.3724.9302.7321.3
Min.1.505.20.0382.023.5318.6131.297.1
Mean ± SD3.63 ± 1.7 a22.7 ± 18.7 a1.77 ± 1.16 ns151.2 ± 49.4 ns49.4 ± 17.2 ns522.8 ± 109.4 a213.7 ± 45.9 a216.3 ± 54.4 a
Medium
(12–24 g)
Max.8.0944.35.24217.692.7765.9292.4347.2
Min.0.236.50.0330.022.4183.765.395.8
Mean ± SD2.71 ± 1.42 b17.2 ± 9.1 b1.61 ± 1.29146.1 ± 44.451.9 ± 18.5464.0 ± 137.4 b181.0 ± 60.0 b180.4 ± 54.0 b
Large
(>24 g)
Max.8.3142.47.48237.0104.9656.3288.8324.4
Min.0.204.00.0554.224.2206.266.299.2
Mean ± SD2.17 ± 1.34 b18.4 ± 8.0 ab1.92 ± 1.47149.0 ± 42.054.2 ± 18.6401.0 ± 107.7 c162.9 ± 49.4 b196.6 ± 57.4 ab
* a, b, c, and ns: Means with different letters within a column are significantly different at the 5% level.
Table 4. The average content of lutein, tocopherols, and phytosterols by each group of 172 Korean soybean varieties.
ClusterLutein
(μg g−1)
Tocopherol (μg g−1)Phytosterol (μg g−1)
αβγδβ-SitosterolCampesterolStigmasterol
I
(n = 2)
2.4233.93.64202.371.6690.6295.8298.6
II
(n= 106)
2.2215.01.47121.342.2436.4174.2190.6
III
(n= 15)
2.8338.24.62183.168.1391.4170.4178.2
IV
(n= 36)
3.2219.51.75192.070.5493.2203.2223.3
V
(n = 13)
2.8020.11.19198.669.5286.190.4128.2
Table 5. Distribution by breeding year, usage, and 100-seed weight of 172 Korean soybean varieties included in each group.
ClusterBreeding YearUsage100-Seed Weight
Before 19801980s1990sAfter 1999 (2000–2013)SaucesSproutsCooking with RiceVegetables<12 g12–24 g>24 g
I
(n= 2)
---2
(1.2)
2
(1.2)
---1(0.6)-1(0.6)
II
(n= 106)
1
(0.6)
9
(5.2)
32
(18.6)
64
(37.2)
40
(23.2)
33
(19.2)
20
(11.6)
13
(7.5)
10
(5.8)
35
(20.3)
61
(35.5)
III
(n= 15)
3
(1.7)
3
(1.7)
2
(1.2)
7
(4.1)
7
(4.1)
6
(3.5)
1
(0.6)
1
(0.6)
2
(1.2)
6
(3.5)
7
(4.1)
IV
(n = 36)
10
(5.8)
6
(3.5)
2
(1.2)
18
(10.5)
21
(12.2)
11
(6.4)
3
(1.7)
1
(0.6)
7
(4.1)
11
(6.4)
18
(10.5)
V
(n = 13)
8
(4.7)
2
(1.2)
3
(1.7)
-10
(5.8)
2
(1.2)
1
(0.6)
--7
(4.1)
6
(3.5)
Note: The value in parenthesis indicates the percentage of each cluster of the total of all varieties.

