
Nutritional Values and In Vitro Fermentation Characteristics of 29 Different Chinese Herbs
by
 , and
, and
Lichun Xiao
1,2,†, 
Siyu Yi
1,3,†,
Md. Abul Kalam Azad
1 ,
,
Mingqian Huang
1,2,
Xiaoquan Guo
2 and
Xiangfeng Kong
1,3,* 1
Hunan Provincial Key Laboratory of Animal Nutritional Physiology and Metabolic Process, Key Laboratory of Agro-Ecological Processes in Subtropical Region, National Engineering Laboratory for Pollution Control and Waste Utilization in Livestock and Poultry Production, Institute of Subtropical Agriculture, Chinese Academy of Sciences, Changsha 410125, China
2
College of Animal Science and Technology, Jiangxi Agricultural University, Nanchang 330045, China
3
College of Animal Science and Technology, Guangxi University, Nanning 530005, China
*
Author to whom correspondence should be addressed.
†
These authors have contributed equally to this work.
Agriculture 2022, 12(9), 1285; https://doi.org/10.3390/agriculture12091285
Submission received: 5 July 2022
/
Revised: 13 August 2022
/
Accepted: 16 August 2022
/
Published: 23 August 2022
(This article belongs to the Special Issue Effects of Dietary Interventions on Pig Production)
Abstract
:The present study evaluated the nutritional values and in vitro fermentation characteristics of 29 different Chinese herbs in order to develop effective feed additives for livestock nutrition. The Chinese herbs were analyzed for their chemical composition. The in vitro fermentation characteristics were evaluated using the gas production technique with swine cecal chyme inoculum. The results showed that the Allium tuberosum Rottl (Semen allii tuberosi, SAT) had the highest gross energy (GE), crude protein (CP), ether extract (EE), and total amino acid (TAA) contents, whereas Anemones raddeanae Rhizoma (Agstache rugosus, AR) had the highest crude fiber, neutral detergent fiber, and acid detergent fiber contents compared with the other Chinese herbs. The Rhus chinensis Mill (Chinese gall, CG), Scrophularia ningpoensis Hemsl (Radix scrophulariae, RS), Punica granatum L (Punica granatum L, PGL), Atractylodes macrocephala Koidz (White atractylodes rhizome, WAR), Sanguisorbae radix (Garden burnet, GB), Anemarrhena asphodeloides Bunge (Rhizoma anemarrhenaw, RA), and Rhei radix Et Rhizoma (Rheum officinale, RO) had a higher non-fiber carbohydrate content than the other Chinese herbs. The in vitro fermentation kinetic analysis showed that the RS, WAR, and RA had a higher gas production, a theoretical gas production, and a fractional rate of gas production than the other groups. Furthermore, the RA, WAR, RS, and Crataegi fructus (Crataegus pinnatifida Bun, CPB) had a higher total short-chain fatty acids (SCFAs) concentration, and CPB had the highest acetate concentration, whereas the WAR and RS had higher propionate and butyrate concentrations than the other groups. Moreover, the Isatis indigotica Fort (Folium isatidis, FI) and SAT had higher ammonia-N concentration than the other groups. In summary, among the 29 different Chinese herbs, the SAT had the highest nutritional value, which is reflected in the highest contents of GE, CP, EE, and TAA, whereas the RA, WAR, and RS showed better intestinal fermentation profiles, which is reflected in the higher fermentation degree and suitable SCFAs fermentation pattern. These findings provide a theoretical basis for using Chinese herbs as feed additives or microbial carbon sources in the intestines of animals.
1. Introduction
Chinese herbs and their extracts are natural plant products and present the unique advantages of low cost, reduced toxicity, and fewer side effects. Chinese herbs and their extracts also have the characteristics of lower harmful residues, less drug resistance, and are non-polluting for the environment [1,2]. At present, Chinese herbs or their extracts have been found to increase feed intake and digestibility, enhance the utilization of feed proteins, relieve stress, resist harmful microbiota, and improve the growth and reproductive performance in animal production [2,3,4]. For example, microecologics made from Chinese herbs and probiotics can improve broilers’ growth performance, immune function, and intestinal health [5]. A recent study also showed that the supplementation of Chinese herbs improved growth performance, meat quality, immune function, and the nutrient digestibility of pigs [6]. Thus, Chinese herbs as natural feed additives have attracted extensive attention [3].
The in vitro fermentation technology is commonly used to evaluate the nutritional values of ruminant feed. In recent years, it has also been used as an important approach to investigate the effects of diet and additives on gut microbial fermentation characteristics of pigs [7,8]. Generally, animal experiments are time-consuming, laborious, and expensive. Using intestinal chyme as inoculation material for in vitro fermentation is a simple and economical method to predict the nutritional values of fermentation substrates [9]. Therefore, we hypothesized that Chinese herbs would be effective feed additives and they might have better fermentation characteristics in the intestines of livestock. Thus, the present study evaluated the nutritional values and in vitro fermentation characteristics of 29 different Chinese herbs to provide the theoretical basis for further development and application of Chinese herbs as feed additives in animal production. Furthermore, this study explored the mechanism of action of different Chinese herbs from the perspective of nutritional values and fermentation characteristics.
2. Materials and Methods
2.1. Preparation of Chinese Herbs
A total of 29 different Chinese herbs were used in the present study because of their low price, large output, and common use. They were purchased from Changsha Medicinal Materials Co., Ltd. (Changsha, Hunan, China; Table 1). The Chinese herb samples were air-dried, pulverized through 40 mesh sieves, packed in hermetical plastic bags, and stored at 4 °C for further analysis. The in vitro experiment was a completely randomized block design with 3 runs, and each Chinese herb had 3 fermentation bottles for each run (replicates).
2.2. Analysis of Chemical Composition
The contents of dry matter (DM; method 945.15), organic matter (OM; method 942.05), ether extract (EE; method 920.39), and crude protein (CP; method 945.01, total N × 6.25) were analyzed according to the AOAC methods [10]. Gross energy (GE) was measured using an isothermal automatic calorimeter (5 EAC8018; Changsha Kaiyuan Instruments Co., Ltd., Changsha, China). The contents of crude fiber (CF), neutral detergent fiber (NDF), and acid detergent fiber (ADF) were determined according to the methods described by Van Soest et al. [11]. A heat stable α-amylase and sodium sulphite were added and expressed as residual ash. The routine nutritional composition of each Chinese herb sample was analyzed only once.
Approximately 1 g of each Chinese herb was weighed in an ampoule, added to 10 mL of 6 mol/L hydrochloric acid, and then mixed. After being sealed with an alcohol burner, the mixture was digested at 110 °C for 24 h, diluted to 100 mL with distilled water, and then 2 mL of the mixture solution was pipetted through a 0.45-µm microporous membrane. The contents of amino acids (AAs) were determined by a L-8800 automatic amino acid analyzer (Hitachi, Tokyo, Japan), and the total AA (TAA) content was calculated. The AAs composition of each Chinese herb sample was analyzed only once.
2.3. In Vitro Batch Incubation
About 0.5 g of each of the Chinese herb samples were accurately weighed into 135 mL fermentation bottles. The buffer solution was prepared using the method as previously described by Barry et al. [12]. The microculture buffer medium contained as follows (g/L): NaHCO3 (9.240), Na2HPO3·12H2O (7.125), NaC1 (0.470), KC1 (0.450), Na2SO4 (0.100), CaC12 (0.055), MgC12 (0.047) and urea (0.400). It was then diluted to 1 L with distilled water and mixed vigorously. The trace buffer medium contained as follows (mg/L): FeSO4·7 H2O (3680), MnSO4·7 H2O (1900), ZnSO4·7 H2O (440), CoC12·6 H2O (120), CuSO4·5 H2O (98) and Mo7(NH4)6 O2·4 H2 O (17.4), diluted to 1 L with distilled water and mixed vigorously, and then 10 mL of trace buffer medium was added to a 1 L microculture buffer medium.
Cecal chyme samples were obtained from three Ning Xiang pigs with an average body weight of 60 ± 2.5 kg. The pigs were euthanized using an electric shock (120 V, 200 Hz), then the cecal chyme samples were collected aseptically and immediately placed in sterile thermos bottles pre-filled with CO2 and mixed properly. The cecal chyme and buffer medium (1:10, w/v) were mixed and filtered through four layers of cheesecloth into insulated thermos bottles. The CO2 was continuously flushed into the culture solution for 30 min at 37 °C (pH 6.9–7.0), and then added 60 mL of culture solution into the bottle under a stream of CO2 at 37 °C. Bottles were immediately placed into the constant temperature shaker (ZWY-200 D; Zhicheng Instruments Co., Ltd., Shanghai, China) for 48 h at 37 °C and 55 r/min. The gas production was recorded at 0.5, 1, 2, 4, 6, 8, 10, 12, 14, 16, 18, 20, 22, 24, 30, 36, and 48 h.
2.4. Analysis of Short-Chain Fatty Acids (SCFAs), pH and Ammonia-N (NH3-N)
The SCFAs concentrations, including acetate, propionate, butyrate, isobutyrate, valerate, and isovalerate were measured by gas chromatography (Agilent 7890 A, Agilent Inc., Palo Alto, CA, USA), according to the procedure described by Wang et al. [13]. The pH value of fermentation supernatant was measured using a pH meter (Delta 320, Mettler Company, Changsha, China). The NH3-N concentration was measured using the ultraviolet spectrophotometer (UV-160 A, Shimadzu, Japan), as previously described by Mauricio et al. [14]. The SCFAs, pH, and NH3-N concentrations of each sample was measured in triplicate for each run.
2.5. Calculation and Statistical Analysis
The logistic-exponential model [15] was performed to analyze the kinetics of total gas production by using the nonlinear regression analysis program (NLREG), and expressed as follows:
where V is the accumulated gas production at time t (mL/g); VF is the final asymptotic gas production (mL/g); k is the fractional rate of gas production (mL/h); and lag is the fermentation gas production delay time (h);
V = VF exp [ − exp {1 − k (t − lag)}]
The non-fiber carbohydrates (NFC) content was calculated as previously described by Zhang et al. [16]:
NFC = 100 − (NDF + CP + EE)
The data were analyzed by one-way ANOVA. The comparative analysis among the groups were performed using the Duncan multiple range test with SPSS 26.0 software (SPSS, Inc., Chicago, IL, USA), and the data with statistical significance were presented as means with their SEM. The statistical significance value and a trend toward difference were set at levels of p < 0.05 and 0.05 ≤ p < 0.10, respectively. The correlations between nutritional components and fermentation parameters were analyzed using the Pearson correlation program using SPSS 26.0 software (SPSS, Inc., Chicago, IL, USA). The statistical significance values were set at p < 0.05 to the present significant correlation.
3. Results
3.1. Routine Nutritional Compositions of 29 Different Chinese Herbs
The routine nutritional compositions of 29 different Chinese herbs are presented in Table 2. The SAT had the highest GE and EE contents compared with the other Chinese herbs, whereas the GE content of 29 Chinese herbs was >11.38 MJ/kg, and the EE content of other Chinese herbs was ≤3.37%. The CP content of 29 Chinese herbs varied greatly, ranging from 1.45% to 21.35%, among which SAT had the highest CP content. Moreover, the POL, CV, CC, SB, TM, and DR had higher CP contents than the other Chinese herbs. The ARU had the highest CF, NDF, and ADF contents, whereas GC, CL, APN, and CR had higher CF, NDF, and ADF contents than the other Chinese herbs, respectively. Moreover, the WAR, RO, RS, CG, and RA had lower CF, NDF, and ADF contents than the other Chinese herbs, respectively. Furthermore, the CG had the highest NFC content and the RS, PGL, WAR, GB, RA, and RO had higher NFC content than the other Chinese herbs.
3.2. Amino Acids (AAs) Contents of 29 Different Chinese Herbs
The results of AA contents of 29 different Chinese herbs are shown in Table 3 and Table 4. Among the 29 Chinese herbs, the SAT had the highest TAA content, whereas the TAA content in TM, CV, and GB was higher than the other Chinese herbs. Considering all other AAs, the SAT had higher proportion of leucine, arginine, and glutamic acids, whereas TM, GB, and CV had higher proportions of leucine, aspartic acid, and glutamic acid than the other Chinese herbs (Table 3).
3.3. Fermentation Kinetic Parameters and NH3-N Concentrations of 29 Different Chinese Herbs
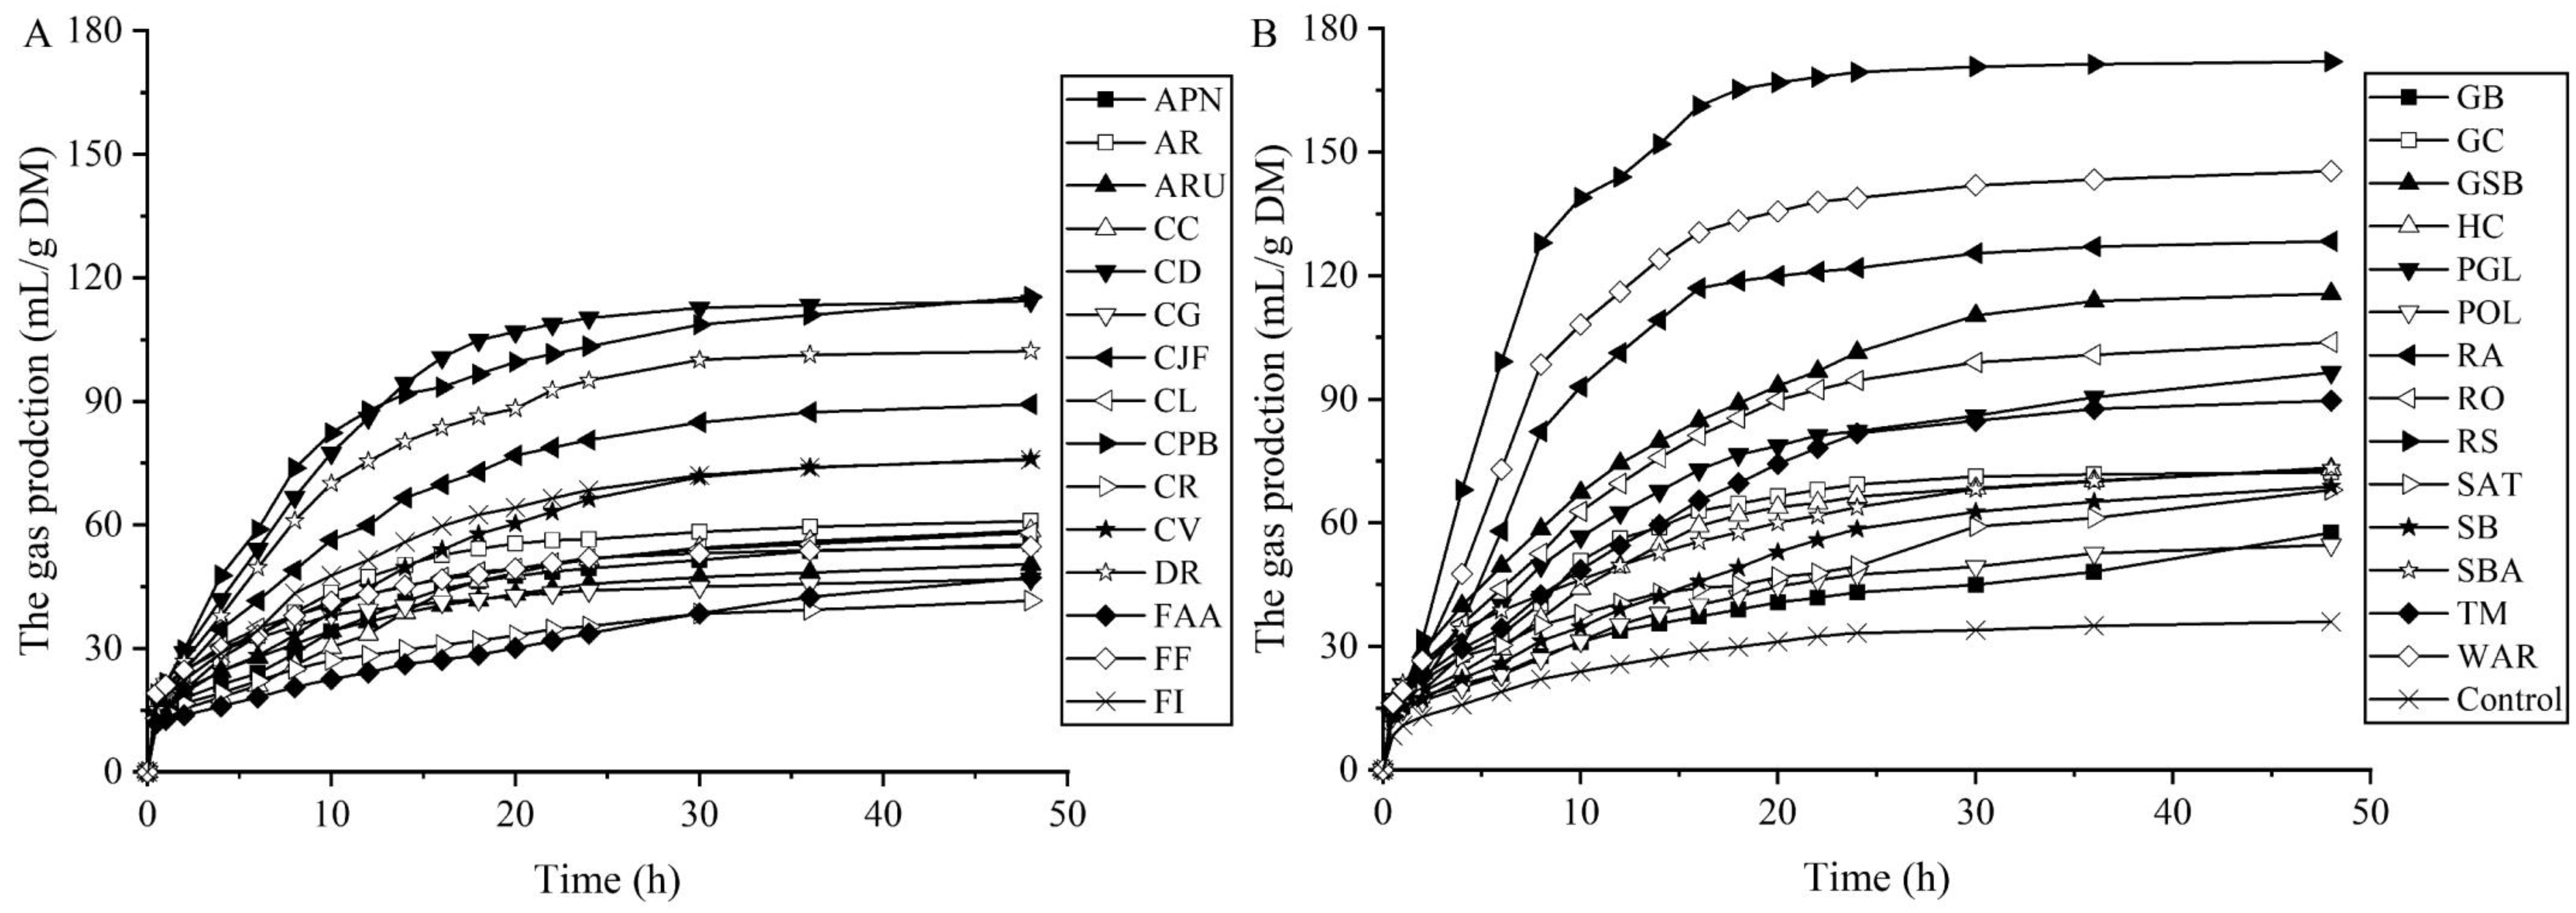
The fermentation kinetic parameters of 29 different Chinese herbs are presented in Table 5, Table 6 and Figure 1. The 29 Chinese herbs displayed a fast fermentation rate during the first 30 h of incubation and then reached the fermentation platform at 48 h of incubation (Figure 1). Among the 29 Chinese herbs, the RS had the highest (p < 0.001) gas production, whereas the WAR and RA had higher gas production at 12, 24, and 48 h of incubation than the other groups. The CG, CR, and FAA had a lower (p < 0.001) gas production than the other Chinese herbs (Table 5). The maximum theoretical gas production (VF) of 29 different Chinese herbs was higher (p < 0.001) compared with the control group. Among the 29 Chinese herbs, the RS had the highest (p < 0.001) VF value and a fractional rate of gas production (k), whereas RS, WAR, and RA had the lowest (p < 0.001) fermentation gas production delay time (lag), and WAR, RA, GSB, CD, CPB, RO, and DR had higher (p < 0.001) VF and k values compared with the other groups. The ARU, CG, and CR had lower (p < 0.001) VF value than the other Chinese herbs. The SAT, FAA, and CR had lower (p < 0.001) k value compared with the other groups. Compared with the control group (11.77 mg/mL), the FI, SAT, DR, SB, CV, TM, GB, FF, CL, WAR, POL, CD, and ARU had higher (p < 0.001) NH3-N concentration, whereas other Chinese herbs had lower (p < 0.001) NH3-N concentration (Table 6).
3.4. Short-Chain Fatty Acids (SCFAs) Concentration and pH Value of Different Chinese Herbs
The SCFAs results are presented in Table 7. The RA and WAR had the highest (p < 0.001) total SCFA concentration, whereas RS and CPB had higher (p < 0.001) total SCFA concentration than the other groups. The CPB had the highest (p < 0.001) acetate concentration, whereas RA and GSB had a higher (p < 0.001) acetate concentration than the other groups. The RA had the highest (p < 0.001) propionate concentration, whereas WAR and RS had higher (p < 0.001) propionate concentration than the other groups. The RS had the highest (p < 0.001) butyrate concentration, whereas WAR had higher (p < 0.001) butyrate concentration than the other groups.
As shown in Table 7, among the 29 Chinese herbs, the AR, CPB, GSB, PGL, and WAR had lower (p < 0.001) pH value compared with the control group. In addition, the FF and POL had higher (p < 0.001) pH value compared with the other Chinese herbs excluding the APN, ARU, CR, DR, HC, and SB herbs.
3.5. Correlation between Nutritional Components and Fermentation Parameters
The correlation analysis results are shown in Figure 2, Figure 3, Figure 4 and Figure 5. As shown in Figure 2, the contents of CF, NDF, and ADF were negatively correlated (p < 0.05) with gas production, whereas the NFC content was positively correlated (p < 0.01) with gas production at 12, 24, and 48 h of incubation (Figure 2). However, there were no significant correlations between OM, GE, CP, and TAA with gas production (p > 0.05).
As shown in Figure 3, the contents of CF, NDF, and ADF were negatively correlated (p < 0.01) with total SCFA concentration, whereas the NFC content was positively correlated (p < 0.05) with total SCFA concentration. However, there were no correlations between OM, GE, EE, CP, and TAA with total SCFA concentration (p > 0.05).
As shown in Figure 4, the contents of CF, NDF, and ADF were negatively correlated (p < 0.01) with butyrate concentration compared with the acetate (p < 0.05) and propionate (p < 0.01) concentrations. The NFC content was positively correlated (p < 0.001) with butyrate concentration compared with the acetate (p < 0.01) and propionate (p < 0.01) concentrations.
As shown in Figure 5, the CP content was positively correlated (p < 0.001) with NH3-N concentration, whereas NFC content had a negative correlation (p < 0.05) with NH3-N concentration. However, there was no significant correlation between OM, GE, EE, CF, NDF, and ADF contents and NH3-N concentration (p > 0.05).
4. Discussion
In recent years, Chinese herbs as a feed additive have received more and more attention due to their advantages of safety, natural properties, less drug resistance, and many active factors [2]. However, besides a variety of active factors for treating and resisting diseases [2], Chinese herbs also contain various nutritional components, such as protein, fiber, NFC, and EE, which play important roles in improving the intestinal fermentation of the host. Thus, the present study explored the nutritional values and in vitro fermentation characteristics of 29 different Chinese herbs. The present study indicated that RA, WAR, and RS showed better intestinal fermentation profiles.
The EE includes true fat and organic substances that can be dissolved in ether, such as chlorophyll, carotene, organic acids, resins, and fat-soluble vitamins. The higher EE content can effectively inhibit the de novo synthesis of fatty acids, make fatty acids more saturated and facilitate the deposition of fatty acids [17]. However, it has been reported that the higher EE content negatively affected the digestibility of fat-free organic matter, non-starch polysaccharides, and NDF [18]. In the present study, only the SAT had higher EE content among the 29 Chinese herbs, which indicates that the SAT may have a positive effect on fat deposition, but it may also have the risk of nutrient digestibility of other nutrients. Furthermore, we found a generally lower EE content (<3.4%) in Chinese herbs (except for the SAT) in the present study; thus, we speculated that the EE content might play a minor role in the fermentation performance of the Chinese herbs.
Dietary fiber includes plant cell polysaccharides, lignin, and associated substances [19]. Fiber is a functional nutrient for monogastric animals, which cannot be hydrolyzed by endogenous enzymes of the host but can be converted into SCFAs by beneficial intestinal bacteria in the colon [20]. Dietary fiber has positive effects on maintaining gastrointestinal function, protecting cardiovascular system, and improving immunity [19,20]. In the present study, ARU, CL, APN, and CR had higher CF, NDF, and ADF contents than the other Chinese herbs, suggesting that these herbs can be used as dietary fiber supplements to maintain the intestinal health of animals. However, previous studies were mostly focused on the anti-inflammatory or hypoglycemic effects of CL, APN, and CR [21,22,23], lacking the research progress on dietary fiber as feed supplements in livestock production. Thus, it is necessary to conduct in-depth research on Chinese herbs as a fiber source for animals’ growth and development in the future.
Crude protein is an important nutrient component and includes protein and nitrogenous substances. Protein is necessary for the growth, development, reproduction, and repair of various organs. It is one of the essential basic nutrients for life activities and participates in metabolism, immunity, blood pressure, gastrointestinal, and other physiological functions [24]. In the present study, SAT had the highest CP content among the 29 Chinese herbs, whereas POL, CV, CC, SB, TM, and DR had higher CP content than the other Chinese herbs, indicating that these Chinese herbs could play important roles as protein sources for livestock production.
Amino acids are the main components of protein and have important physiological functions, such as regulating the growth and development of the body and participating in tissue repair or renewal [25]. In the present study, the SAT had higher proportions of leucine, arginine, and glutamic acid. In addition, TM, GB and CV had higher proportions of leucine, aspartic acid, and glutamic acid, while most of the Chinese herbs (except for CL and SB) had more acidity AAs than the other AAs. Leucine and arginine can regulate protein renewal function [26], enhance the immune system, protect the digestive system from different metabolic diseases, and participate in cardiovascular disease treatments [27,28,29]. Similarly, glutamic and aspartic acids can protect intestinal integrity, exert neurotransmitters [30,31], and regulate immunity and anti-fatigue [32,33]. Research evidence showed that SAT has the functioning ability to treat anti-aging, kidney disease, and infertility [34]. The TM has antioxidant, anti-inflammatory, anticancer, antihyperglycemic, anticoagulant, and analgesic properties [35]. Moreover, the GB and CV have shown anti-inflammatory and antibacterial properties [36,37,38]. Therefore, the above-mentioned functional properties of Chinese herbs may be related to their higher proportions of arginine, leucine, aspartic acid, or glutamic acids. Thus, the contents and composition of AAs in Chinese herbs may partially determine their efficacy, of which leucine, arginine, glutamic acid, and aspartic acid may play an important role. Furthermore, the higher TAA content of SAT, TM, GB, and CV indicates that these Chinese herbs may have a role in supplementing AAs to animals, especially for acidity AAs.
The total gas production mainly depends on the nutrient components of the substrate and its fermentation degree, and the NFC in the feed is positively correlated with potential gas production rather than fiber [39]. In the present study, the RS, WAR, and RA had higher gas production, VF, and k values and the CG, CR, and FAA had lower gas production. In addition, the contents of CF, NDF, and ADF were negatively correlated, and the NFC content was positively correlated with gas production at 12, 24, and 48 h of incubation. Therefore, the gas production of RS, WAR, and RA may be related to their higher NFC and lower fiber contents. Compared with the fibers, NFC could easily be degraded by microbiota [40], and the rapid degradation of NFC may be one of the factors that can produce more gas, but antibacterial substances may inhibit this process. The CG has strong antibacterial functions and can inhibit β-galactosidase activity [41], which may be one of the reasons that the CG had a lower gas production; although it had the highest NFC content. Furthermore, nutritional components also influence gas production. Getachew et al. [39] found that the CP content was negatively correlated with gas production; however, there was no correlation between the CP content and gas production in the present study. Thus, the RA, WAR, and RS have a better fermentation process, which may be beneficial to the growth of beneficial microbiota in the host intestine, while the antibacterial characteristics of other NFC-rich Chinese herbs and the antagonism of nutritional components need to be further explored.
The fermentation of carbohydrates mainly produces the SCFAs in the mammalian gut, and the major SCFAs in the intestine are acetate, propionate, and butyrate [42]. In the present study, the RA, WAR, RS, and CPB had higher total SCFA concentrations, which is consistent with the gas production. It has been reported that the NFC content in the feed is positively correlated with the total SCFA concentration [39]. Our study also found that the contents of CF, NDF, and ADF were negatively correlated, whereas the content of NFC was positively correlated with the total SCFA concentration. In the present study, the RA and CPB showed the highest propionate and acetate concentrations, respectively, whereas WAR and RS showed higher propionate and butyrate concentrations than the other groups. Generally, carbohydrate components can influence the fermentation profiles, and the fermented feed rich in NFC can produce more propionate or butyrate than acetate [43,44]. Our study also found that the propionate and butyrate showed negative correlations with CF, NDF, and ADF contents, whereas the propionate and butyrate showed positive correlations with NDF content compared with acetate. Thus, Chinese herbs with higher NDF content may be more favorable for propionate or butyrate production rather than acetate production, while fiber-rich Chinese herbs may be more favorable for acetate production.
Microorganisms produce NH3-N through the deamination of amino acids; thus, the NH3-N concentration is mainly affected by the CP concentration and nitrogen metabolism pathway [42]. In the present study, the FI, SAT, DR, and SB had higher NH3-N concentration, whereas the SBA, CJF, and CPB had lower NH3-N concentration than the other Chinese herbs. Our study found that the CP content was positively correlated, whereas the NFC content was negatively correlated with the NH3-N concentration. The results are consistent with a previous study, which found that increased NH3-N concentration indicates higher protein content and lower NFC content [45]. However, the higher NH3-N concentration in Chinese herbs is mainly caused by the higher CP content rather than the NFC content because of its lower correlation with NH3-N concentration compared with the CP content. Furthermore, the NH3-N concentration depends on the balance between its production and utilization by microbiota [46], so the fermentation rate also affects the NH3-N concentration. Thus, the NH3-N concentration of Chinese herbs is mainly affected by the CP content, while the influence of antibacterial characteristics of Chinese herbs on microbial fermentation and the NH3-N concentration needs to be further explored.
5. Conclusions
Among the 29 different Chinese herbs, Semen allii tuberosi had the highest nutritional value, which is reflected in the highest contents of gross energy, crude protein, ether extract, and total amino acid. Furthermore, Rhizoma anemarrhenaw, White atractylodes rhizome, and Radix scrophulariae presented better intestinal fermentation profiles, including a higher fermentation degree and a suitable SCFA fermentation pattern. These findings provide a theoretical basis for the application of Chinese herbs as a microbial carbon source in the intestine. However, further molecular studies are needed to confirm the effects of these herbs (including Semen allii tuberosi, Rhizoma anemarrhenaw, White atractylodes rhizome, and Radix scrophulariae) as feed additives on livestock growth, meat quality, and disease resistance in the future.
Author Contributions
Conceptualization, X.K.; methodology, L.X.; data curation and formal analysis, S.Y. and L.X.; investigation, L.X. and M.H.; visualization, S.Y.; validation, X.G.; writing—original draft preparation, S.Y. and L.X.; writing—review and editing, X.K. and M.A.K.A.; project administration and funding acquisition, X.K. All authors have read and agreed to the published version of the manuscript.
Funding
This study was jointly supported by the China Agriculture Research System of MOF and MARA (CARS-35) and the Special Funds for Construction of Innovative Provinces in Hunan Province (2019 RS3022), and Industry and Research Talent Support Project from Wang Kuancheng of the Chinese Academy of Sciences.
Institutional Review Board Statement
The animal study was reviewed and approved by the Animal Care and Use Committee of the Institute of Subtropical Agriculture, Chinese Academy of Sciences, Changsha, China.
Informed Consent Statement
Not applicable.
Data Availability Statement
The data presented in this study are available on request from the corresponding author.
Acknowledgments
We thank the staff and postgraduate students from the Hunan Provincial Key Laboratory of Animal Physiology and Metabolic Process for collecting samples, and technicians from the CAS Key Laboratory of Agro-ecological Processes in Subtropical Region for providing technical assistance.
Conflicts of Interest
The authors declare no conflict of interest.
References
- Liu, J.; Willför, S.; Xu, C. A review of bioactive plant polysaccharides: Biological activities, functionalization, and biomedical applications. Bioact. Carbohydr. Diet. Fibre 2015, 5, 31–61. [Google Scholar] [CrossRef]
- Yin, B.S.; Li, W.; Qin, H.Y.; Yun, J.Y.; Sun, X.Y. The use of Chinese skullcap (Scutellaria baicalensis) and its extracts for sustainable animal production. Animals 2021, 11, 1039. [Google Scholar] [CrossRef] [PubMed]
- Ekanayake, L.J.; Corner-Thomas, R.A.; Cranston, L.M.; Kenyon, P.R.; Morris, S.T.; Pain, S.J. Pre-exposure of early-weaned lambs to an herb-clover mix does not improve their subsequent growth. Animals 2020, 10, 1354. [Google Scholar] [CrossRef] [PubMed]
- Shan, C.H.; Guo, J.; Sun, X.; Li, N.; Yang, X.; Gao, Y.; Qiu, D.R.; Li, X.M.; Wang, Y.A.; Feng, M.; et al. Effects of fermented Chinese herbal medicines on milk performance and immune function in late-lactation cows under heat stress conditions. J. Anim. Sci. 2018, 96, 4444–4457. [Google Scholar] [CrossRef]
- Gao, J.; Wang, R.; Liu, J.; Wang, W.; Cai, W. Effects of novel microecologics combined with traditional Chinese medicine and probiotics on growth performance and health of broilers. Poult. Sci. 2021, 101, 101412. [Google Scholar] [CrossRef]
- Lin, Z.N.; Ye, L.; Li, Z.W.; Huang, X.S.; Lu, Z.; Yang, Y.Q.; Xing, H.W.; Bai, J.Y.; Ying, Z.Y. Chinese herb feed additives improved the growth performance, meat quality, and nutrient digestibility parameters of pigs. Anim. Models Exp. Med. 2020, 3, 47–54. [Google Scholar] [CrossRef] [Green Version]
- Loo, Y.T.; Howell, K.; Suleria, H.; Zhang, P.; Gu, C.; Ng, K. Sugarcane polyphenol and fiber to affect production of short-chain fatty acids and microbiota composition using in vitro digestion and pig faecal fermentation model. Food Chem. 2022, 385, 132665. [Google Scholar] [CrossRef]
- Montoya, C.A.; Blatchford, P.; Moughan, P.J. In vitro ileal and caecal fermentation of fibre substrates in the growing pig given a human-type diet. Br. J. Nutr. 2021, 125, 998–1006. [Google Scholar] [CrossRef]
- Xu, J.; Xie, G.; Li, X.; Wen, X.; Cao, Z.; Ma, B.; Zou, Y.; Zhang, N.; Mi, J.; Wang, Y.; et al. Sodium butyrate reduce ammonia and hydrogen sulfide emissions by regulating bacterial community balance in swine cecal content in vitro. Ecotoxicol. Environ. Saf. 2021, 226, 112827. [Google Scholar] [CrossRef]
- AOAC International. Official Methods of Analysis, 18th ed.; AOAC International: Gaithersburg, MD, USA, 2005. [Google Scholar]
- Van Soest, P.J.; Robertson, J.B.; Lewis, B.A. Methods for dietary fiber, neutral detergent fiber, and non-starch polysaccharides in relation to animal nutrition. J. Dairy Sci. 1991, 74, 3583–3597. [Google Scholar] [CrossRef]
- Barry, J.L.; Hoebler, C.; Macfarlane, G.T.; Macfarlane, S.; Mathers, J.C.; Reed, K.A.; Mortensen, P.B.; Nordgaard, I.; Rowland, I.R.; Rumney, C.J. Estimation of the fermentability of dietary fiber in vitro: A European interlaboratory study. Br. J. Nutr. 1995, 74, 303–322. [Google Scholar] [CrossRef] [PubMed] [Green Version]
- Wang, M.; Sun, X.Z.; Janssen, P.H.; Tang, S.X.; Tan, Z.L. Responses of methane production and fermentation pathways to the increased dissolved hydrogen concentration generated by eight substrates in in vitro ruminal cultures. Anim. Feed Sci. Technol. 2014, 194, 1–11. [Google Scholar] [CrossRef]
- Mauricio, R.M.; Mould, F.L.; Dhanoa, M.S.; Owen, E.; Channa, K.S.; Theodorou, M.K. A semi-automated in vitro gas production technique for ruminant feedstuff evaluation. Anim. Feed Sci. Technol. 1999, 79, 321–330. [Google Scholar] [CrossRef]
- Schofield, P.; Pitt, R.E.; Pell, A.N. Kinetics of fiber digestion from in vitro gas production. J. Anim. Sci. 1994, 72, 2980–2991. [Google Scholar] [CrossRef] [PubMed]
- Zhang, X.M.; Wang, M.; Yu, Q.; Ma, Z.Y.; Beauchemin, K.A.; Wang, R.; Wen, J.N.; Lukuyu, B.A.; Tan, Z.L. Liquid hot water treatment of rice straw enhances anaerobic degradation and inhibits methane production during in vitro ruminal fermentation. J. Dairy Sci. 2020, 103, 4252–4261. [Google Scholar] [CrossRef]
- Wu, F.; Johnston, L.J.; Urriola, P.E.; Hilbrands, A.M.; Shurson, G.C. Evaluation of ME predictions and the impact of feeding maize distillers dried grains with solubles with variable oil content on growth performance, carcass composition, and pork fat quality of growing-finishing pigs. Anim. Feed Sci. Technol. 2016, 213, 128–141. [Google Scholar] [CrossRef]
- Paternostre, L.; De Boever, J.; Millet, S. Interaction between fat and fiber level on nutrient digestibility of pig feed. Anim. Feed Sci. Technol. 2021, 282, 115126. [Google Scholar] [CrossRef]
- Kristensen, M.; Jensen, M.G. Dietary fibres in the regulation of appetite and food intake. Importance of viscosity. Appetite 2011, 56, 65–70. [Google Scholar] [CrossRef]
- Ain, H.B.U.; Saeed, F.; Ahmed, A.; Khan, A.M.; Niaz, B.; Tufail, T. Improving the physicochemical properties of partially enhanced soluble dietary fiber through innovative techniques: A coherent review. J. Food Process. Pres. 2019, 43, 1–12. [Google Scholar] [CrossRef]
- Nugroho, A.E.; Andrie, M.; Warditiani, N.K.; Siswanto, E.; Pramono, S.; Lukitaningsih, E. Antidiabetic and antihiperlipidemic effect of Andrographis paniculata (Burm. f.) Nees and andrographolide in high-fructose-fat-fed rats. Indian J. Pharmacol. 2012, 44, 377–381. [Google Scholar] [CrossRef]
- Wu, S.; Tong, L.; Liu, B.; Ai, Z.; Hong, Z.; You, P.; Wu, H.Z.; Yang, Y.F. Bioactive ingredients obtained from Cortex Fraxini impair interactions between FAS and GPI. Free Radic. Biol. Med. 2020, 152, 504–515. [Google Scholar] [CrossRef] [PubMed]
- Su, X.; Zhu, Z.H.; Zhang, L.; Wang, Q.; Xu, M.M.; Lu, C.; Zhu, Y.; Zeng, J.G.; Duan, J.A.; Zhao, M. Anti-inflammatory property and functional substances of Lonicerae Japonicae Caulis. J. Ethnopharmacol. 2021, 267, 113502. [Google Scholar] [CrossRef] [PubMed]
- Anderson, G.H.; Aziz, A. Multifunctional roles of dietary proteins in the regulation of metabolism and food intake: Application to feeding infants. J. Pediatrics 2006, 149, S74–S79. [Google Scholar] [CrossRef]
- Kong, X.F.; Wu, G.Y.; Yin, Y.L. Roles of phytochemicals in amino acid nutrition. Front. Biosci. 2011, 3, 372–384. [Google Scholar] [CrossRef] [Green Version]
- May, M.E.; Buse, M.G. Effects of branched-chain amino-acids on protein-turnover. Diabetes-Metab. Rev. 1989, 5, 227–245. [Google Scholar] [CrossRef]
- Roth, E.; Steininger, R.; Winkler, S.; Ngle, F.I.; Grünberger, T.; Fugger, R.; Muhlbacher, F. L-arginine deficiency after liver transplantation as an effect of arginase efflux from the graft. Influence on nitric oxide metabolism. Transplantation 1994, 57, 665–669. [Google Scholar] [CrossRef]
- Brzozowski, T.; Konturek, S.J.; Dorzowicz, D.; Dembinski, A.; Stachura, J. Healing of chronic gastric ulceration by L-arginine: Role of nitric oxide, prostaglands, gastrin and polyamines. Digestion 1995, 56, 463–471. [Google Scholar] [CrossRef]
- Lerman, A.; Burnett, J.C.; Higano, S.T.; Mckinley, L.J.; Holmes, D.R. Long-term L-arginins supplementation improves small-vessel coronary endothelia function in humans. Circulation 1998, 97, 2123–2128. [Google Scholar] [CrossRef] [Green Version]
- Kirchgessner, A.L. Glutamate in the enteric nervous system. Curr. Opin. Pharmacol. 2001, 1, 591–596. [Google Scholar] [CrossRef]
- Vermeulen, M.A.; Jong, J.D.; Vaessen, M.J.; Leeuwen, P.A.V.; Houdijk, A.P. Glutamate reduces experimental intestinal hyperpermeability and facilitates glutamine support of gut integrity. World J. Gastroenterol. 2011, 17, 1569–1573. [Google Scholar] [CrossRef] [Green Version]
- Li, P.; Yin, Y.L.; Li, D.; Kim, S.W.; Wu, G. Amino acids and immune function. Br. J. Nutr. 2007, 98, 237. [Google Scholar] [CrossRef] [PubMed] [Green Version]
- Marquezi, M.L.; Roschel, H.A.; Costa, A.D.S.; Sawada, L.A.; Lancha, A.H. Effect of aspartate and asparagine supplementation on fatigue determinants in intense exercise. Int. J. Sport Nutr. Exerc. Metab. 2003, 13, 65–75. [Google Scholar] [CrossRef] [PubMed]
- Li, L.; Chen, B.; An, T.; Zhang, H.; Xia, B.; Li, R.; Zhu, R.Y.; Tian, Y.M.; Wang, L.L.; Zhao, D.D.; et al. BaZiBuShen alleviates altered testicular morphology and spermatogenesis and modulates Sirt6/P53 and Sirt6/NF-κB pathways in aging mice induced by D-galactose and NaNO2. J. Ethnopharmacol. 2021, 271, 113810. [Google Scholar] [CrossRef]
- Duan, L.; Zhang, C.; Zhao, Y.; Chang, Y.; Guo, L. Comparison of bioactive phenolic compounds and antioxidant activities of different parts of Taraxacum mongolicum. Molecules 2020, 25, 3260. [Google Scholar] [CrossRef] [PubMed]
- Su, X.D.; Guo, R.H.; Yang, S.Y.; Kim, Y.H.; Kim, Y.R. Anti-bacterial effects of components from Sanguisorba officinalis L. on Vibrio vulnificus and their soluble epoxide hydrolase inhibitory activity. Nat. Prod. Res. 2019, 33, 3445–3449. [Google Scholar] [CrossRef] [PubMed]
- Ban, J.Y.; Nguyen, H.T.T.; Lee, H.J.; Cho, S.; Ju, H.S.; Kim, J.Y. Neuroprotective properties of gallic acid from Sanguisorbae radix on amyloid β protein (25–35)-induced toxicity in cultured rat cortical neurons. Biol. Pharm. Bull. 2008, 31, 149–153. [Google Scholar] [CrossRef] [Green Version]
- Suzuki, M.; Chozin, M.A.; Iwasaki, A.; Suenaga, K.; Noguchi, H.K. Phytotoxic activity of Chinese violet (Asystasia gangetica (L.) T. Anderson) and two phytotoxic substances. Weed Biol. Manag. 2019, 19, 3–8. [Google Scholar] [CrossRef] [Green Version]
- Getachew, G.; Robinson, P.H.; DePeters, E.J.; Taylor, S.J. Relationships between chemical composition, dry matter degradation and in vitro gas production of several ruminant feeds. Anim. Feed Sci. Technol. 2004, 111, 57–71. [Google Scholar] [CrossRef]
- Yu, Q.; Zhuang, X.; Wang, W.; Qi, W.; Wang, Q.; Tan, X.; Kong, X.Y.; Yuan, Z.H. Hemicellulose and lignin removal to improve the enzymatic digestibility and ethanol production. Biomass Bioenerg. 2016, 94, 105–109. [Google Scholar] [CrossRef]
- Zhang, Y.; Djakpo, O.; Xie, Y.F.; Guo, Y.H.; Yu, H.; Cheng, Y.L.; Qian, H.; Shi, R.; Yao, W.R. Anti-quorum sensing of Galla chinensis and Coptis chinensis on bacteria. LWT Food Sci. Technol. 2019, 101, 806–811. [Google Scholar] [CrossRef]
- Blachier, F.; Mariotti, F.; Huneau, J.F.; Tome, D. Effects of amino acid-derived luminal metabolites on the colonic epithelium and physiopathological consequences. Amino Acids 2007, 33, 547–562. [Google Scholar] [CrossRef] [PubMed]
- Janssen, P.H. Influence of hydrogen on rumen methane formation and fermentation balances through microbial growth kinetics and fermentation hermodynamics. Anim. Feed Sci. Technol. 2010, 160, 1–22. [Google Scholar] [CrossRef]
- Song, S.D.; Chen, G.J.; Guo, C.H.; Rao, K.Q.; Gao, Y.H.; Peng, Z.L.; Zhang, Z.F.; Bai, X.; Wang, Y.; Wang, B.X.; et al. Effects of exogenous fibrolytic enzyme supplementation to diets with different NFC/NDF ratios on the growth performance, nutrient digestibility and ruminal fermentation in Chinese domesticated black goats. Anim. Feed Sci. Technol. 2018, 236, 170–177. [Google Scholar] [CrossRef]
- Peixoto, E.L.; Mizubuti, I.Y.; Ribeiro, E.L.; Moura, E.S.; Pereira, E.S.; Prado, O.P.P.; de Carvalho, L.N.; Pires, K.A. Residual frying oil in the diets of sheep: Intake, digestibility, nitrogen balance and ruminal parameters. Asian-Australs. J. Anim. Sci. 2016, 30, 51–56. [Google Scholar] [CrossRef] [PubMed] [Green Version]
- Vanhoof, K.; Schrijver, R.D. Nitrogen metabolism in rats and pigs fed inulin. Nutr. Res. 1996, 16, 1035–1039. [Google Scholar] [CrossRef]
Figure 1.
The kinetics of gas production of 29 different Chinese herbs at 48 h of in vitro incubation (A,B).
Figure 1.
The kinetics of gas production of 29 different Chinese herbs at 48 h of in vitro incubation (A,B).

Figure 2.
Correlation analysis of gas production at 12 h, 24 h, and 48 h of incubation with crude fiber (CF; (A)), neutral detergent fiber (NDF; (B)), acid detergent fiber (ADF; (C)), and non-fiber carbohydrates (NFC; (D)). p < 0.05 indicates significant correlation.
Figure 2.
Correlation analysis of gas production at 12 h, 24 h, and 48 h of incubation with crude fiber (CF; (A)), neutral detergent fiber (NDF; (B)), acid detergent fiber (ADF; (C)), and non-fiber carbohydrates (NFC; (D)). p < 0.05 indicates significant correlation.

Figure 3.
Correlation analysis of total short-chain fatty acids (SCFAs) concentrations with crude fiber (CF; (A)), neutral detergent fiber (NDF; (B)), acid detergent fiber (ADF; (C)), and non-fiber carbohydrates (NFC; (D)). p < 0.05 indicates significant correlation.
Figure 3.
Correlation analysis of total short-chain fatty acids (SCFAs) concentrations with crude fiber (CF; (A)), neutral detergent fiber (NDF; (B)), acid detergent fiber (ADF; (C)), and non-fiber carbohydrates (NFC; (D)). p < 0.05 indicates significant correlation.

Figure 4.
Correlation analysis of acetate, propionate, and butyrate concentrations with crude fiber (CF; (A)), neutral detergent fiber (NDF; (B)), acid detergent fiber (ADF; (C)), and non-fiber carbohydrates (NFC; (D)). p < 0.05 indicates significant correlation.
Figure 4.
Correlation analysis of acetate, propionate, and butyrate concentrations with crude fiber (CF; (A)), neutral detergent fiber (NDF; (B)), acid detergent fiber (ADF; (C)), and non-fiber carbohydrates (NFC; (D)). p < 0.05 indicates significant correlation.

Figure 5.
Correlation analysis of ammonia-N concentration with crude protein (CP; (A)) and non-fiber carbohydrates (NFC; (B)). p < 0.05 indicates significant correlation.
Figure 5.
Correlation analysis of ammonia-N concentration with crude protein (CP; (A)) and non-fiber carbohydrates (NFC; (B)). p < 0.05 indicates significant correlation.


Table 1.
Resources of 29 different Chinese herbs.
| Chinese Herbs | Scientific Names | Abbreviation | Origin |
|---|---|---|---|
| Andrographis paniculata Nees | Andrographis herba | APN | Henan |
| Anemone root | Anemones raddeanae Rhizoma | AR | North East |
| Agstache rugosus | Herba agastaches | ARU | Yunnan |
| Coptis chinensis | Coptidis rhizoma | CC | Sichuan |
| Cortex dictamni | Dictamni cortex | CD | Hubei |
| Chinese gall | Rhus chinensis Mill | CG | Jiangxi |
| Cape Jasmine Fruit | Gardenia jasminoides Ellis | CJF | Hunan |
| Caulis lonicerae | Lonicerae japonicae Caulis | CL | Henan |
| Crataegus pinnatifida Bunge | Crataegi fructus | CPB | Hunan |
| Cortex fraxini | Fraxinus rhynchophylla Hance | CR | Liaoning |
| Chinese violet | Matthiola incana R. Br | CV | Henan |
| Danshen root | Salvia miltiorrhiza Bunge | DR | Hebei |
| Folium artemisiae argyi | Argy wormwood | FAA | Hunan |
| Fructus forsythiae | Forsythia suspensa Vahl | FF | Shanxi |
| Folium isatidis | Isatis indigotica fort | FI | Hunan |
| Garden burnet | Sanguisorbae radix | GB | Jilin |
| Golden cypress | Juniperus chinensis Aurea | GC | Hebei |
| Gentiana scabra Bunge | Adenophora capillaris | GSB | Hebei |
| Houttuynia cordata | Heartleaf houttuynia Herb | HC | Zhejiang |
| Punica granatum L | Punica granatum L | PGL | Hebei |
| Portulaca oleracea L | Portulaca oleracea L | POL | North East |
| Rhizoma anemarrhenae | Anemarrhena asphodeloides Bunge | RA | Shanxi |
| Rheum officinale | Rhei radix Et Rhizoma | RO | Gansu |
| Radix scrophulariae | Scrophularia ningpoensis Hemsl | RS | Hunan |
| Semen allii tuberosi | Allium tuberosum Rottl | SAT | Hunan |
| Sculellaria barbata | Scutellariae barbatae Herba | SB | Hunan |
| Scutellaria baicalensis | Scutellariae radix | SBA | Shanxi |
| Taraxacum mongolicum | Taraxaci herba | TM | Hebei |
| White atractylodes rhizome | Atractylodes macrocephala Koidz | WAR | Hunan |
Table 2.
Routine nutritional composition of 29 different Chinese herbs (% of DM).
| Herbs | DM | OM | GE(MJ/kg) | EE | CP | CF | NDF | ADF | NFC |
|---|---|---|---|---|---|---|---|---|---|
| APN | 90.49 | 94.62 | 16.55 | 0.79 | 7.07 | 47.48 | 62.80 | 50.58 | 29.34 |
| AR | 87.86 | 93.12 | 16.76 | 0.71 | 5.23 | 28.85 | 41.38 | 31.20 | 52.68 |
| ARU | 90.59 | 93.14 | 15.26 | 0.68 | 5.81 | 57.51 | 70.79 | 62.08 | 22.72 |
| CC | 90.71 | 94.34 | 17.94 | 0.83 | 16.16 | 25.57 | 50.34 | 22.12 | 32.67 |
| CD | 90.40 | 90.69 | 15.53 | 0.83 | 7.16 | 30.96 | 40.97 | 32.19 | 51.04 |
| CG | 90.75 | 96.97 | 17.02 | 0.94 | 2.47 | 3.06 | 7.81 | 3.66 | 88.78 |
| CJF | 91.08 | 93.42 | 19.70 | 3.37 | 7.98 | 27.82 | 40.45 | 30.97 | 48.20 |
| CL | 92.42 | 93.10 | 17.38 | 0.52 | 5.07 | 47.91 | 64.90 | 54.48 | 29.51 |
| CPB | 86.96 | 97.57 | 16.54 | 0.89 | 1.45 | 30.40 | 36.54 | 30.21 | 61.12 |
| CR | 90.71 | 91.50 | 16.30 | 0.65 | 1.93 | 44.76 | 58.50 | 52.87 | 38.92 |
| CV | 89.20 | 83.29 | 14.25 | 1.39 | 16.90 | 19.27 | 31.35 | 23.87 | 50.36 |
| DR | 86.18 | 92.27 | 15.30 | 0.95 | 15.01 | 13.04 | 20.95 | 19.17 | 63.09 |
| FAA | 91.07 | 91.43 | 19.32 | 2.53 | 13.30 | 26.31 | 43.75 | 42.56 | 40.42 |
| FF | 92.00 | 97.52 | 19.30 | 0.74 | 5.07 | 34.27 | 53.90 | 57.65 | 40.29 |
| FI | 91.57 | 90.89 | 17.92 | 0.82 | 13.70 | 19.48 | 38.24 | 29.28 | 47.24 |
| GB | 90.60 | 90.75 | 16.07 | 0.64 | 4.73 | 13.24 | 19.95 | 18.46 | 74.68 |
| GC | 92.61 | 89.97 | 16.44 | 0.44 | 3.79 | 48.86 | 61.56 | 51.63 | 34.21 |
| GSB | 85.91 | 93.17 | 15.44 | 1.05 | 10.66 | 15.71 | 24.92 | 17.65 | 63.37 |
| HC | 89.03 | 85.86 | 16.11 | 0.51 | 11.87 | 33.84 | 47.53 | 44.02 | 40.09 |
| PGL | 88.46 | 96.59 | 16.08 | 1.01 | 3.42 | 16.16 | 19.50 | 17.57 | 76.07 |
| POL | 90.87 | 73.77 | 11.38 | 0.76 | 19.36 | 21.31 | 37.36 | 26.41 | 42.52 |
| RA | 88.68 | 93.97 | 16.86 | 0.99 | 10.58 | 11.21 | 15.75 | 14.56 | 72.68 |
| RO | 90.68 | 89.06 | 15.12 | 0.33 | 9.19 | 7.66 | 18.20 | 14.72 | 72.28 |
| RS | 87.91 | 95.00 | 15.59 | 0.78 | 5.87 | 8.32 | 9.39 | 12.60 | 83.96 |
| SAT | 90.91 | 95.07 | 21.33 | 17.25 | 21.35 | 35.07 | 37.90 | 36.20 | 23.50 |
| SB | 89.09 | 86.62 | 21.15 | 0.59 | 15.44 | 30.30 | 43.45 | 40.16 | 40.52 |
| SBA | 84.94 | 85.84 | 12.14 | 0.58 | 6.49 | 19.28 | 31.41 | 23.57 | 61.52 |
| TM | 89.18 | 84.63 | 14.80 | 0.96 | 15.37 | 22.53 | 32.46 | 29.44 | 51.21 |
| WAR | 89.87 | 95.62 | 16.12 | 3.21 | 10.62 | 6.55 | 10.26 | 7.79 | 75.91 |
Data are presented as a value of one determination. ADF, acid detergent fiber; CF, crude fiber; CP, crude protein; DM, dry matter; EE, ether extract; GE, gross energy; NDF, neutral detergent fiber; NFC, non-fiber carbohydrates; OM, organic matter.
Table 3.
Amino acids (AAs) contents of 29 different Chinese herbs (mg/g).
| Herbs | Hydroxy AA | SCAA | BCAA | Aromatic AA | Basic AA | Acidity AA | SHAA | TAA | ||||||||||
|---|---|---|---|---|---|---|---|---|---|---|---|---|---|---|---|---|---|---|
| Thr | Ser | Gly | Ala | Val | Ile | Leu | Tyr | Phe | Lys | His | Arg | Pro | Asp | Glu | Cys | Met | ||
| APN | 0.22 | 0.21 | 0.26 | 0.23 | 0.23 | 0.17 | 0.31 | 0.00 | 0.57 | 0.13 | 0.09 | 0.12 | 0.00 | 0.48 | 0.48 | 0.41 | 0.00 | 3.91 |
| AR | 0.16 | 0.10 | 0.16 | 0.13 | 0.13 | 0.11 | 0.18 | 0.00 | 0.50 | 0.07 | 0.10 | 0.14 | 0.00 | 0.13 | 0.27 | 0.44 | 0.00 | 2.62 |
| ARU | 0.15 | 0.00 | 0.00 | 0.00 | 0.00 | 0.03 | 0.00 | 0.00 | 0.27 | 0.00 | 0.03 | 0.00 | 0.00 | 0.00 | 0.00 | 0.68 | 0.00 | 1.16 |
| CC | 0.26 | 0.38 | 0.57 | 0.40 | 0.14 | 0.23 | 0.55 | 0.07 | 0.69 | 0.32 | 0.17 | 0.78 | 0.18 | 0.77 | 0.72 | 0.39 | 0.03 | 6.65 |
| CD | 0.12 | 0.10 | 0.14 | 0.09 | 0.12 | 0.08 | 0.14 | 0.48 | 0.08 | 0.00 | 0.07 | 0.06 | 0.00 | 0.10 | 0.25 | 0.43 | 0.00 | 2.26 |
| CG | 0.15 | 0.11 | 0.12 | 0.14 | 0.13 | 0.10 | 0.18 | 0.00 | 0.46 | 0.18 | 0.08 | 0.27 | 0.00 | 0.15 | 0.23 | 0.39 | 0.00 | 2.69 |
| CL | 0.20 | 0.17 | 0.23 | 0.25 | 0.23 | 0.18 | 0.32 | 0.00 | 0.53 | 0.11 | 0.08 | 0.17 | 0.00 | 0.33 | 0.42 | 0.37 | 0.00 | 3.59 |
| CPB | 0.11 | 0.70 | 0.25 | 0.29 | 0.02 | 0.30 | 0.00 | 0.75 | 0.28 | 0.10 | 0.03 | 0.00 | 0.00 | 0.00 | 0.15 | 0.18 | 0.00 | 3.16 |
| CR | 0.11 | 0.09 | 0.12 | 0.09 | 0.09 | 0.05 | 0.09 | 0.00 | 0.41 | 0.09 | 0.07 | 0.09 | 0.00 | 0.11 | 0.17 | 0.42 | 0.00 | 2.00 |
| CV | 0.55 | 0.51 | 0.69 | 0.73 | 0.67 | 0.53 | 1.01 | 0.07 | 0.58 | 0.59 | 0.21 | 0.48 | 0.40 | 1.10 | 1.35 | 0.39 | 0.04 | 9.90 |
| DR | 0.35 | 0.16 | 0.24 | 0.42 | 0.27 | 0.41 | 0.66 | 0.11 | 0.24 | 0.40 | 0.20 | 0.97 | 0.15 | 0.73 | 1.51 | 0.63 | 0.02 | 7.47 |
| FAA | 0.14 | 0.00 | 0.00 | 0.00 | 0.00 | 0.00 | 0.00 | 0.00 | 0.26 | 0.00 | 0.06 | 0.00 | 0.00 | 0.06 | 0.06 | 0.44 | 0.00 | 1.02 |
| FF | 0.08 | 0.00 | 0.00 | 0.03 | 0.00 | 0.00 | 0.00 | 0.00 | 0.27 | 0.00 | 0.04 | 0.00 | 0.00 | 0.08 | 0.00 | 0.67 | 0.00 | 1.17 |
| FI | 0.12 | 0.08 | 0.12 | 0.06 | 0.03 | 0.03 | 0.06 | 0.00 | 0.42 | 0.11 | 0.07 | 0.17 | 0.00 | 0.19 | 0.21 | 0.41 | 0.00 | 2.08 |
| GB | 0.55 | 0.50 | 0.68 | 0.73 | 0.67 | 0.50 | 0.93 | 0.06 | 0.50 | 0.58 | 0.22 | 0.49 | 0.71 | 1.03 | 1.33 | 0.40 | 0.02 | 9.90 |
| GC | 0.25 | 0.00 | 0.04 | 0.06 | 0.06 | 0.04 | 0.04 | 0.00 | 0.00 | 0.15 | 0.06 | 0.10 | 0.00 | 0.04 | 0.00 | 0.41 | 0.00 | 1.25 |
| GJF | 0.14 | 0.04 | 0.17 | 0.11 | 0.11 | 0.07 | 0.20 | 0.00 | 0.00 | 0.03 | 0.10 | 0.06 | 0.00 | 0.05 | 0.06 | 0.62 | 0.00 | 1.76 |
| GSB | 0.18 | 0.16 | 0.23 | 0.18 | 0.18 | 0.12 | 0.21 | 0.00 | 0.54 | 0.18 | 0.12 | 0.25 | 0.00 | 0.27 | 0.38 | 0.43 | 0.00 | 3.43 |
| HC | 0.18 | 0.00 | 0.11 | 0.03 | 0.03 | 0.00 | 0.06 | 0.00 | 0.24 | 0.00 | 0.06 | 0.05 | 0.00 | 0.06 | 0.08 | 0.64 | 0.00 | 1.54 |
| PGL | 0.18 | 0.00 | 0.00 | 0.00 | 0.00 | 0.05 | 0.00 | 0.00 | 0.27 | 0.00 | 0.04 | 0.00 | 0.00 | 0.00 | 0.04 | 1.00 | 0.00 | 1.58 |
| POL | 0.29 | 0.30 | 0.39 | 0.23 | 0.61 | 0.53 | 0.61 | 0.06 | 0.79 | 0.59 | 0.60 | 0.22 | 0.02 | 0.50 | 1.50 | 0.41 | 0.01 | 7.66 |
| RA | 0.16 | 0.03 | 0.09 | 0.08 | 0.13 | 0.07 | 0.17 | 0.00 | 0.00 | 0.16 | 0.11 | 0.30 | 0.00 | 0.07 | 0.06 | 0.61 | 0.00 | 2.04 |
| RO | 0.08 | 0.03 | 0.07 | 0.05 | 0.04 | 0.00 | 0.07 | 0.00 | 0.00 | 0.04 | 0.10 | 0.05 | 0.00 | 0.04 | 0.06 | 0.43 | 0.00 | 1.06 |
| RS | 0.13 | 0.12 | 0.09 | 0.13 | 0.11 | 0.07 | 0.10 | 0.00 | 0.45 | 0.05 | 0.05 | 0.06 | 0.00 | 0.18 | 0.18 | 0.43 | 0.00 | 2.15 |
| SAT | 0.78 | 1.13 | 1.06 | 0.80 | 1.14 | 0.71 | 1.42 | 0.09 | 0.96 | 1.32 | 0.55 | 2.34 | 0.12 | 1.30 | 3.88 | 0.77 | 0.06 | 18.43 |
| SB | 0.42 | 0.32 | 0.59 | 0.35 | 0.50 | 0.37 | 0.88 | 0.10 | 0.71 | 0.35 | 0.20 | 0.22 | 0.00 | 0.28 | 0.53 | 0.41 | 0.00 | 6.23 |
| SBA | 0.23 | 0.20 | 0.25 | 0.25 | 0.24 | 0.18 | 0.30 | 0.00 | 0.55 | 0.21 | 0.13 | 0.54 | 0.12 | 0.41 | 0.55 | 0.41 | 0.00 | 4.57 |
| TM | 0.61 | 0.57 | 0.87 | 0.78 | 0.73 | 0.59 | 1.14 | 0.11 | 0.67 | 0.53 | 0.25 | 0.52 | 0.51 | 1.36 | 1.31 | 0.44 | 0.03 | 11.02 |
| WAR | 0.10 | 0.07 | 0.08 | 0.05 | 0.00 | 0.00 | 0.03 | 0.00 | 0.46 | 0.12 | 0.09 | 0.91 | 0.00 | 0.36 | 0.21 | 0.41 | 0.00 | 2.89 |
Data are presented as a value of one determination. AA, amino acid; SCAA, straight-chain amino acid; BCAA, branched-chain amino acid; SHAA, sulphydryl-containing amino acid; TAA, total amino acid. Ala, alanine; Arg, arginine; Asp, aspartic acid; Cys, L-cysteine; Glu, glutamic acid; Gly, glycine; His, histidine; Ile, isoleucine; Leu, leucine; Lys, lysine; Met, methionine; Phe, phenylalanine; Pro, proline; Ser, serine; Thr, L-threonine; Tyr, tyrosine; Val, valine. As shown in Table 4, the acidity AA contents of different Chinese herbs were higher than those of other AAs, except for the CL and SB. The SAT had the highest contents of hydroxy AA, straight-chain AA, branched-chain AA, aromatic AA, basic AA and acidity AA compared with the other Chinese herbs.
Table 4.
Classified amino acids (AAs) contents of 29 different Chinese herbs (mg/g).
| Herbs | Hydroxy AA | SCAA | BCAA | Aromatic AA | Basic AA | Acidity AA |
|---|---|---|---|---|---|---|
| APN | 0.43 | 0.49 | 0.71 | 0.57 | 0.34 | 1.37 |
| AR | 0.26 | 0.29 | 0.42 | 0.50 | 0.31 | 0.84 |
| ARU | 0.15 | 0.00 | 0.03 | 0.27 | 0.03 | 0.68 |
| CC | 0.63 | 0.97 | 0.92 | 0.76 | 1.27 | 2.05 |
| CD | 0.22 | 0.23 | 0.34 | 0.56 | 0.13 | 0.78 |
| CG | 0.26 | 0.25 | 0.40 | 0.46 | 0.54 | 0.77 |
| CJF | 0.37 | 0.49 | 0.72 | 0.53 | 0.36 | 1.12 |
| CL | 0.81 | 0.54 | 0.32 | 1.03 | 0.13 | 0.32 |
| CPB | 0.20 | 0.21 | 0.23 | 0.41 | 0.25 | 0.70 |
| CR | 1.06 | 1.42 | 2.22 | 0.65 | 1.28 | 3.24 |
| CV | 0.50 | 0.66 | 1.34 | 0.34 | 1.58 | 3.02 |
| DR | 0.14 | 0.00 | 0.00 | 0.26 | 0.06 | 0.56 |
| FAA | 0.08 | 0.03 | 0.00 | 0.27 | 0.04 | 0.75 |
| FF | 0.20 | 0.18 | 0.12 | 0.42 | 0.35 | 0.81 |
| FI | 1.05 | 1.41 | 2.10 | 0.56 | 1.29 | 3.47 |
| GB | 0.25 | 0.10 | 0.14 | 0.00 | 0.31 | 0.45 |
| GC | 0.18 | 0.28 | 0.38 | 0.00 | 0.20 | 0.73 |
| GSB | 0.34 | 0.41 | 0.51 | 0.54 | 0.55 | 1.08 |
| HC | 0.18 | 0.14 | 0.09 | 0.24 | 0.11 | 0.78 |
| PGL | 0.18 | 0.00 | 0.05 | 0.27 | 0.04 | 1.04 |
| POL | 0.58 | 0.61 | 1.75 | 0.84 | 1.41 | 2.43 |
| RA | 0.19 | 0.17 | 0.37 | 0.00 | 0.57 | 0.74 |
| RO | 0.12 | 0.11 | 0.11 | 0.00 | 0.19 | 0.53 |
| RS | 0.25 | 0.22 | 0.28 | 0.45 | 0.16 | 0.79 |
| SAT | 1.91 | 1.86 | 3.27 | 1.05 | 4.21 | 6.07 |
| SB | 0.74 | 0.94 | 1.74 | 0.82 | 0.77 | 1.22 |
| SBA | 0.43 | 0.50 | 0.73 | 0.55 | 0.88 | 1.49 |
| TM | 1.18 | 1.65 | 2.46 | 0.78 | 1.30 | 3.62 |
| WAR | 0.17 | 0.13 | 0.03 | 0.46 | 1.12 | 0.98 |
Data are presented as a value of one determination. AA, amino acid; SCAA, straight-chain amino acid; BCAA, branched-chain amino acid.
Table 5.
Gas production of 29 different Chinese herbs at 12, 24, and 48 h of in vitro incubation.
| Herbs | GP12 | GP24 | GP48 |
|---|---|---|---|
| APN | 37.76 klmnop | 49.47 klm | 55.22 kl |
| AR | 47.29 ghijklm | 56.48 ijkl | 60.90 ijk |
| ARU | 36.50 klmnop | 45.70 lmn | 50.48 klm |
| CC | 33.40 mnop | 51.70 jkl | 58.58 jkl |
| CD | 86.03 d | 110.29 cd | 114.34 de |
| CG | 39.38 jklmnop | 44.08 lmn | 46.87 lmn |
| CJF | 59.85 fgh | 80.57 fgh | 89.28 g |
| CL | 43.25 ijklmn | 51.68 jkl | 58.07 jkl |
| CPB | 87.69 d | 103.34 de | 115.38 d |
| CR | 28.30 nop | 35.35 mn | 41.64 mn |
| CV | 44.66 hijklm | 66.22 hij | 76.05 h |
| DR | 75.44 de | 95.03 ef | 102.23 f |
| FAA | 24.19 p | 33.64 n | 47.22 lmn |
| FF | 43.15 ijklmn | 51.96 jkl | 54.71 kl |
| FI | 51.51 ghijk | 68.50 ghi | 75.86 h |
| GB | 33.77 lmnop | 43.10 lmn | 57.61 jkl |
| GC | 56.15 fghi | 69.29 ghi | 72.24 hi |
| GSB | 74.34 de | 101.39 de | 115.66 d |
| HC | 49.38 ghijkl | 66.35 hij | 73.08 h |
| PGL | 62.48 efg | 82.22 fg | 96.50 fg |
| POL | 35.22 lmnop | 47.39 lmn | 54.57 kl |
| RA | 101.23 c | 121.86 c | 128.33 c |
| RO | 69.51 ef | 94.51 ef | 103.85 ef |
| RS | 143.90 a | 169.38 a | 171.92 a |
| SAT | 40.44 jklmno | 49.46 klm | 67.91 hij |
| SB | 38.95 jklmnop | 58.44 ijkl | 68.77 hij |
| SBA | 49.64 jhijkl | 63.73 ijk | 73.31 h |
| TM | 54.50 ghij | 81.67 fg | 89.63 g |
| WAR | 116.06 b | 138.79 b | 145.36 b |
| Control group | 25.60 op | 33.25 n | 35.95 n |
| SEM | 4.625 | 4.526 | 3.670 |
| p | <0.001 | <0.001 | <0.001 |
Data are presented as mean values with their pooled SEM and p values. Means within a column without a common superscript letter are different (p < 0.05). GP12, GP24, and GP48, the gas production at 12, 24, and 48 h of in vitro incubation (mL/g DM).
Table 6.
Fermentation kinetic parameters and ammonia-N (NH3-N) concentration of 29 different Chinese herbs at 48 h of in vitro incubation.
Table 6.
Fermentation kinetic parameters and ammonia-N (NH3-N) concentration of 29 different Chinese herbs at 48 h of in vitro incubation.
| Herbs | VF | K | Lag | NH3-N (mg/dL) |
|---|---|---|---|---|
| APN | 46.60 jk | 5.97 ghijk | 5.56 cdefg | 6.86 kl |
| AR | 50.37 j | 9.47 efg | 3.65 bcde | 9.57 hij |
| ARU | 41.71 jkl | 5.27 ghijk | 7.51 g | 12.05 efg |
| CC | 50.56 j | 6.04 ghijk | 4.52 bcdefg | 11.49 efg |
| CD | 96.49 d | 18.77 c | 1.91 ab | 12.07 efg |
| CG | 38.08 klm | 6.73 fghijk | 6.96 fg | 6.09 l |
| CJF | 74.00 gh | 11.09 ef | 3.68 bcde | 5.44 ml |
| CL | 46.17 jk | 7.13 fghij | 5.68 cdefg | 12.35 def |
| CPB | 91.29 de | 19.12 c | 2.30 ab | 5.50 lm |
| CR | 35.26 lmn | 3.23 jk | 11.09 h | 8.62 jk |
| CV | 65.87 hi | 7.56 fghij | 4.31 bcdef | 14.03 cd |
| DR | 84.61 ef | 16.00 cd | 2.46 ab | 14.71 c |
| FAA | 47.36 jk | 2.67 k | 12.26 h | 9.33 ij |
| FF | 45.57 jk | 6.59 fghijk | 7.51 g | 12.39 def |
| FI | 63.30 i | 8.79 fghi | 4.65 bcdefg | 18.80 a |
| GB | 47.14 jk | 8.00 fghi | 10.38 h | 13.27 cde |
| GC | 60.94 i | 11.20 ef | 2.49 ab | 11.01 fghi |
| GSB | 99.42 cd | 17.30 cd | 2.82 abc | 7.16 kl |
| HC | 61.07 i | 9.18 efg | 3.37 bcd | 11.01 fghi |
| PGL | 79.15 fg | 11.08 ef | 4.03 bcdef | 4.25 mn |
| POL | 46.51 jk | 5.25 ghijk | 6.34 defg | 12.25 def |
| RA | 105.73 c | 28.43 b | 0.12 a | 10.20 ghij |
| RO | 86.51 ef | 13.42 de | 2.75 abc | 8.57 jk |
| RS | 142.03 a | 45.73 a | 0.08 a | 6.58 l |
| SAT | 59.23 i | 4.36 ijk | 11.78 h | 17.62 ab |
| SB | 59.651 i | 5.98 ghijk | 5.75 cdefg | 14.34 c |
| SBA | 60.63 i | 7.13 fghijk | 7.44 g | 3.19 n |
| TM | 77.47 fg | 9.64 efg | 4.06 bcdef | 13.97 cd |
| WAR | 119.09 b | 31.35 b | 0.38 a | 12.26 def |
| Control group | 30.06 mn | 4.50 hijk | 6.35 defg | 11.77 efg |
| SEM | 2.920 | 1.060 | 0.878 | 0.570 |
| p | <0.001 | <0.001 | <0.001 | <0.001 |
Data are presented as mean values with their pooled SEM and p values. Means within a column without a common superscript letter are different (p < 0.05). VF, the maximum theoretical gas production (mL/g DM); k, the fractional rate of gas production (mL/h); lag, the fermentation gas production delay time (h).
Table 7.
Short-chain fatty acids (SCFAs) concentrations of 29 different Chinese herbs at 48 h of in vitro incubation (µmol/100 mL).
Table 7.
Short-chain fatty acids (SCFAs) concentrations of 29 different Chinese herbs at 48 h of in vitro incubation (µmol/100 mL).
| Herbs | pH | Total SCFA | Acetate | Propionate | Butyrate | Isobutyrate | Valerate | Isovalerate |
|---|---|---|---|---|---|---|---|---|
| APN | 6.85 abcde | 349.83 ghijk | 126.93 i | 142.34 ghijk | 48.66 klm | 7.29 klmno | 13.87 efghij | 10.74 efgh |
| AR | 6.64 efgh | 376.99 ghij | 130.01 i | 141.00 ghijk | 88.90 fg | 8.18 klmn | 6.53 klmnopq | 2.37 lm |
| ARU | 6.86 abcde | 214.38 jk | 88.09 j | 76.99 klmn | 27.22 mno | 2.44 o | 10.53 hijklmn | 9.10 efghi |
| CC | 6.69 defgh | 328.30 hijk | 162.08 ghi | 106.35 ijklm | 41.68 klm | 10.44 hijklm | 3.34 pq | 4.42 jklm |
| CD | 6.68 defgh | 738.62 cd | 398.56 cd | 240.23 cde | 76.26 ghij | 9.52 ijklmn | 5.91 lmnopq | 8.15 ghijk |
| CG | 6.75 cdefg | 166.53 k | 108.66 j | 29.41 n | 4.46 o | 14.87 defgh | 8.68 jklmnop | 0.46 m |
| CJF | 6.73 defgh | 318.34 hijk | 111.36 j | 101.39 ijklm | 83.49 fghi | 6.11 lmno | 11.88 ghijk | 4.11 jklm |
| CL | 6.67 defgh | 370.45 ghij | 223.62 fgh | 75.60 klm | 47.70 klm | 6.03 lmno | 14.73 defghi | 2.77 lm |
| CPB | 6.59 fgh | 976.37 ab | 594.43 a | 188.39 defg | 136.58 cd | 14.72 defghi | 17.87 cdef | 24.38 c |
| CR | 6.81 abcdef | 189.31 jk | 86.02 j | 57.79 lmn | 33.69 lmn | 4.46 no | 4.86 nopq | 2.50 lm |
| CV | 6.75 cdefg | 538.95 efg | 212.58 fghi | 181.69 defgh | 87.11 fgh | 19.95 cd | 16.11 defgh | 21.51 cd |
| DR | 6.76 bcdefg | 904.16 bc | 385.74 cd | 253.30 cd | 150.43 c | 26.49 a | 44.95 a | 43.24 a |
| FAA | 6.74 cdefg | 295.97 ijk | 116.35 j | 92.24 jklm | 62.61 hijk | 12.33 efghij | 7.23 klmnopq | 5.21 ijklm |
| FF | 6.99 a | 205.20 jk | 107.15 j | 78.03 klm | 6.52 o | 6.03 lmno | 4.63 opq | 4.38 jklm |
| FI | 6.76 cdefg | 372.86 ghij | 109.62 j | 156.50 fghij | 56.58 jkl | 17.16 cdefg | 18.11 cdef | 14.89 e |
| GB | 6.80 abcdef | 414.93 fghi | 140.49 hi | 172.57 efghi | 76.77 ghij | 9.23 klmn | 11.10 hijklm | 4.77 ijklm |
| GC | 6.74 cdefg | 371.24 ghij | 151.01 ghi | 119.71 ghijkl | 58.91 ijkl | 19.52 cde | 11.19 hijklm | 10.91 efgh |
| GSB | 6.59 fgh | 901.89 bc | 487.10 b | 247.16 cd | 131.09 cd | 7.44 klmno | 17.19 cdefg | 11.92 efg |
| HC | 6.80 abcdef | 325.93 hijk | 150.91 ghi | 109.36 hijklm | 38.23 klm | 8.25 klmn | 5.60 mnopq | 13.59 ef |
| PGL | 6.55 gh | 610.48 de | 238.13 fg | 224.14 def | 119.73 de | 18.36 cde | 5.86 mnopq | 4.26 jklm |
| POL | 6.98 ab | 280.02 ijk | 136.88 hi | 79.84 klm | 41.47 klm | 5.63 mno | 10.17 ijklmno | 6.03 hijkl |
| RA | 6.81 abcdef | 1142.07 a | 500.37 b | 465.58 a | 115.98 de | 18.83 cde | 21.82 c | 19.50 d |
| RO | 6.66 defgh | 575.34 def | 253.06 ef | 148.66 ghijk | 154.16 c | 11.96 ghijk | 6.46 klmnopq | 1.04 lm |
| RS | 6.58 fgh | 992.32 ab | 324.95 de | 301.73 bc | 290.70 a | 25.53 ab | 19.02 cde | 30.39 b |
| SAT | 6.75 cdefg | 427.89 fghi | 126.02 i | 174.09 efghi | 79.24 ghij | 15.06 defgh | 13.62 efghij | 19.87 cd |
| SB | 6.85 abcde | 358.87 ghijk | 127.26 i | 148.68 ghijk | 47.52 klm | 12.01 ghijk | 11.46 hijkl | 11.94 efg |
| SBA | 6.70 defgh | 324.40 hijk | 144.69 hi | 77.42 klmn | 87.06 fgh | 8.21 klmn | 5.50 mnopq | 1.51 lm |
| TM | 6.71 defgh | 499.68 efgh | 179.89 fghi | 190.61 defg | 73.65 ghij | 21.55 bc | 19.94 cd | 14.03 ef |
| WAR | 6.50 h | 1083.66 a | 436.91 bc | 360.36 b | 207.82 b | 17.49 cdef | 31.52 b | 29.56 b |
| Control group | 6.88 abcd | 194.46 jk | 105.22 j | 37.59 mn | 28.58 mno | 9.35 jklmn | 9.98 ijklmno | 3.75 klm |
| SEM | 0.070 | 57.153 | 47.840 | 22.120 | 7.720 | 1.580 | 1.660 | 1.550 |
| p | <0.001 | <0.001 | <0.001 | <0.001 | <0.001 | <0.001 | <0.001 | <0.001 |
Data are presented as mean values with their pooled SEM and p values. Means within a column without a common superscript letter are different (p < 0.05).
Publisher’s Note: MDPI stays neutral with regard to jurisdictional claims in published maps and institutional affiliations. |
© 2022 by the authors. Licensee MDPI, Basel, Switzerland. This article is an open access article distributed under the terms and conditions of the Creative Commons Attribution (CC BY) license (https://creativecommons.org/licenses/by/4.0/).
Share and Cite
MDPI and ACS Style
Xiao, L.; Yi, S.; Azad, M.A.K.; Huang, M.; Guo, X.; Kong, X. Nutritional Values and In Vitro Fermentation Characteristics of 29 Different Chinese Herbs. Agriculture 2022, 12, 1285. https://doi.org/10.3390/agriculture12091285
AMA Style
Xiao L, Yi S, Azad MAK, Huang M, Guo X, Kong X. Nutritional Values and In Vitro Fermentation Characteristics of 29 Different Chinese Herbs. Agriculture. 2022; 12(9):1285. https://doi.org/10.3390/agriculture12091285
Chicago/Turabian StyleXiao, Lichun, Siyu Yi, Md. Abul Kalam Azad, Mingqian Huang, Xiaoquan Guo, and Xiangfeng Kong. 2022. "Nutritional Values and In Vitro Fermentation Characteristics of 29 Different Chinese Herbs" Agriculture 12, no. 9: 1285. https://doi.org/10.3390/agriculture12091285
Note that from the first issue of 2016, this journal uses article numbers instead of page numbers. See further details here.