Article

Evaluation of Markers Associated with Physiological and Biochemical Traits during Storage of ‘Nam Dok Mai Si Thong’ Mango Fruits

by
Tibet Tangpao
1,2,
Nutthatida Phuangsaujai
3,
Sila Kittiwachana
3,4,
David R. George
5,
Patcharin Krutmuang
6,7,
Bajaree Chuttong
6,7,* and
Sarana Rose Sommano
1,2,*
1
Plant Bioactive Compound Laboratory, Faculty of Agriculture, Chiang Mai University, Chiang Mai 50200, Thailand
2
Department of Plant and Soil Sciences, Faculty of Agriculture, Chiang Mai University, Chiang Mai 50200, Thailand
3
Department of Chemistry, Faculty of Science, Chiang Mai University, Chiang Mai 50200, Thailand
4
Environmental Science Research Center (ESRC), Faculty of Science, Chiang Mai University, Chiang Mai 50200, Thailand
5
School of Natural and Environmental Sciences, Newcastle University, Agriculture Building, Newcastle upon Tyne NE1 7RU, UK
6
Department of Entomology and Plant Pathology, Faculty of Agriculture, Chiang Mai University, Chiang Mai 50200, Thailand
7
Innovative Agriculture Research Center, Faculty of Agriculture, Chiang Mai University, Chiang Mai 50200, Thailand
*
Authors to whom correspondence should be addressed.
Agriculture 2022, 12(9), 1407; https://doi.org/10.3390/agriculture12091407
Submission received: 20 August 2022 / Revised: 1 September 2022 / Accepted: 2 September 2022 / Published: 6 September 2022

Abstract

:
Mango ‘Nam dok mai si thong’ is in high demand worldwide, displaying desirable attributes which include a particularly sweet flavour and visually appealing appearance. Physiological and biochemical changes that occur in the fruit post-harvest are key factors in determining fruit quality and, consequently, predicted shelf life. In order to understand which post-harvest markers play crucial roles during the ripening process, as well as those which are a consequence of disease infection and physical damage caused by essential oil vapour, partial least squares (PLS) correlation models were used. During storage, physiochemical (percent weight loss, peel colour, firmness, pH, and peel electrolyte leakage) and biochemical (titratable acidity, total soluble solids, total phenolic compounds, total flavonoid compounds, antioxidants, total sugar, and reducing sugar content) parameters, as well as near-infrared (NIR) spectra, were monitored and correlated with visual post-harvest physiological responses. The majority of analysed markers displayed distinct relationships with the ripening process of mangoes, where for non-destructive parameters (R2 = 0.86), lightness (L*) and b* value were notably significant, and for destructive parameters (R2 = 0.79), pH and total soluble solids were notably significant. Similarly, the same markers were also correlated with physical damage and post-harvest mango disease infection severity, possibly through polysaccharide deformation and activation of browning-related enzymes. NIR imaging results also revealed the absorbent regions involved in biochemical alterations (water and enzymes; absorbance at 1170 nm, 1400–1500 nm, and 2150–2250 nm) that pertain to the fruit’s quality. The findings from this work provide an initial step towards the development and assessment of quality measures for ‘Nam dok mai si thong’ mango.

1. Introduction

Thailand is one of the leading mango producers in the world, with exports of this fruit valued at USD 734 million in 2020 [1]. ‘Nam dok mai si thong’ is a particularly high-demand cultivar on a global scale due to its exceptional qualities, which include an especially sweet flavour and notably alluring appearance [1,2]. At ambient temperatures, freshly harvested mangoes have a relatively short shelf-life of 4–8 days, being prone to physical and biological damage when the maximum ripening stage has been reached [3,4]. This limited shelf life is driven by the fruit’s high respiration rate, ethylene production, excessive ripening, and the effects of post-harvest pests and diseases, which consequently result in the loss of functional nutrients and a decrease in market value [5]. As a result of these pressures, up to 45% of post-harvest mango is lost [6,7]. The ripening stage of mango fruit is considered the primary criterion for determining the fruit’s quality and expected shelf life [8]. Therefore, mangoes are typically harvested at the mature-green or partially ripe stage, which allows sufficient time for handling and marketing of fruits so that they reach the consumer when fully ripened and ready to eat [9]. As a climacteric fruit, mango ripening involves an increase in ethylene production and respiration, resulting in physiochemical changes in fruit colour, texture, firmness, flavour, and aroma [10,11]. Other physiochemical changes include softening of the cell wall, degradation of starch, accumulation of sucrose, synthesis of colour pigments, and development of a distinctive aroma [10,12]. Anthracnose disease caused by Colletotrichum spp. is prevalent during pre- and post-harvest of mango; the infected fruits present slightly black, sunken irregular shape lesions, which gradually enlarge and eventually induce fruit rot and changes in aroma and taste of mango [1,13]. Chemical fungicides are the most common treatment [14]. However, environmental and human health concerns limit fungicide use. Previously, natural products such as essential oil were used to control ripe mango post-harvest disease. Notably, basil (Ocimum spp.) essential oil has antifungal properties, including against the fungi that cause mango post-harvest disease [1,15]. Nonetheless, it has been found that few adverse effects on mango skin have been observed, largely [1,15,16]. While visual observation is used primarily for determining damages and decay, the quality parameters used to determine the internal chemical quality of fruit are largely limited by destructive procedures [17]. The near-infrared spectroscopy (NIR) technique has recently been utilised for the non-destructive evaluation of fruits’ internal and external qualities. Its measurement processes are simple and rapid, requiring neither complex pre-treatments nor chemical reactions on fruit samples [17,18,19]. Though demand for ‘Nam dok mai si thong’ for the export markets is high, only limited research has been conducted to describe the quality markers that describe post-harvest damages to the fruits. Penchaiya et al. [20] observed that biological variation is usually ignored commercially, resulting in an uneven quality trait usually in the forms of physical and biological damages. Moreover, the distinctive golden skin colour characteristic at the mature stage also masks the physical appearance for optimum eating quality. The objectives of this study were therefore to comprehend the relationship of destructive physicochemical properties (firmness, titratable acidity, peel electrolyte leakage, total phenolic and flavonoid compounds, antioxidants, and total and reducing sugar contents), non-destructive parameters (weight loss and peel colour attributes), and post-harvest physiological observations (ripening, essential oil burning, and disease infection) of ‘Nam dok mai si thong’ mango using partial least squares (PLS) correlation and a chemometric analysis tool. The overall outcome from this study will be used toward the development of simple measures for the detection of ripening stage and post-harvest damages caused by physical disruption and pathogens of premium-grade mango.

2. Materials and Methods

2.1. Mangoes and Damage Induction Procedure

Premium-grade ‘Nam dok mai si thong’ mango fruits, of uniform size (ca. 429 g each) and at the commercial harvesting stage, were sourced from a vender in Mae Taeng District, Chiang Mai, Thailand (19°5′51.08″, 98°53′55.54″), and used for this experiment. Upon arrival in the laboratory, sap was drained off, and fruits were cleaned with mild soap and gently wiped until dry. Each fruit was then packed in a 1 L perforated plastic container (polypropylene plastic with 12 holes of 0.1 mm diameter distributed evenly on the lid).
In order to induce varying levels of post-harvest damage to mangoes, cotton balls treated with different amounts (i.e., 0, 13, 25, 63, 250, and 500 µL) of commercial Thai basil (O. basilicum var. thyrsiflora) essential oil (Thai China Flavours and Fragrances Industry Co. Ltd., Nonthaburi, Thailand) were added to containers along with the fruits. The containers were then placed randomly in a controlled climate chamber (25 °C, 80% relative humidity) and incubated for 16 days. Seven mango fruits were collected on damage-induced conduction day (day 0) to represent the mango fruit quality at the beginning. Then, five mangoes from each essential oil treatment were randomly withdrawn for quality assessments at 5, 8, 12, and 16 days and assessed at this time, based on their visual appearance, for (i) ripening, (ii) physical damage (i.e., burning due to exposure to essential oil), and (iii) biological damage (i.e., post-harvest disease infection) as detailed in the next section.

2.2. Sensory Qualities of Mango

Evaluation of post-harvest physiological characteristics of mangoes followed an established methodology developed in previous studies [1,21]. The ripening, burning, and disease infection status of each mango was visually scored by three assessors using the indices detailed in Table 1.

2.3. Near-Infrared Spectra Acquisition

A Fourier-transform near-infrared spectrometer (FT-NIR) (MPA FT-NIR Series Bruker Optics, Stuttgart, Germany) was used to measure the NIR spectra of mango fruits included in the study. Scanning was conducted in absorbance mode with 32 scans per spectrum from 12,500 to 4000 cm−1 (wavelengths from 800 to 2500 nm) using a fibre optic probe. Measurements were taken from both sides of each mango along the equatorial axis of the fruit. A total of 127 samples were scanned.

2.4. Physiological Parameters

2.4.1. Weight Loss

All mangoes were weighed at the start of the study, prior to essential oil treatment, with weights taken again when fruits were removed from containers for physiological and biochemical analysis. The following equation was used to determine percent weight loss [22]:
%   weight   loss   = ( ( initial   weight     final   weight ) initial   weight ) 100

2.4.2. Colour Attributes

A handheld colour spectrophotometer (NS800, 3nh, China) was used to determine the surface colour of the fruit. Six measurements were taken across the surface of the fruit at six different locations, selected at random. The CIE Lab system was used to perform the measurement, with L* representing brightness on a scale of 0 to 100 from black to white, a* representing (+) red or (−) green, and b* representing (+) yellow or (−) blue [23].

2.4.3. Firmness

Firmness of mangoes was determined using a fruit hardness tester (model: FHR-5, N.O.W., Tokyo, Japan) fitted with a pointed cone probe (base diameter: 12 mm, height: 10 mm). Three readings were taken at three equidistant points along the peeled and unpeeled fruit’s equatorial axis. The firmness measurements were expressed in newtons (N).
Following the firmness assessment, mangoes were peeled, and pulps were stored at −20 °C until destructive analysis could be undertaken. Data were collected on pH, total soluble solids, titratable acidity, and peel electrolyte leakage as detailed below.

2.4.4. Mango Juice Extraction, pH, and Total Soluble Solids

To extract mango juice, 20 g of pulp was blended with 10 mL of distilled water, and then the resulting puree was filtered using filter paper (Whatman No. 1). The filtered solution was then analysed for pH using a pH meter (Mettler-Toledo, Greifensee, Switzerland) and total soluble solids using a digital refractometer (PONPE 529BR, Pathum Thani, Thailand).

2.4.5. Titratable Acidity

The titratable acidity of mango juice was analysed based on methods presented by Islam et al. [7] and Ayele [24]. Five grams of blended mango pulp was diluted in 50 mL of DI water. Ten millilitres of solution was then taken for titration with 0.1 N NaOH. As an indicator, 0.1% phenolphthalein was used (end point at pH = 8.2). The amount of NaOH solution required for titration was recorded to calculate the percent titratable acidity, compared to malic acid, in the following equation [24]:
% Titratable   acidity   = normality   of   NaOH   ×   titre   ( mL )   ×   0.067045 sample   ( mL )   ×   10
where 0.067045 is the milliequivalent of malic acid.

2.4.6. Peel Electrolyte Leakage

Following methods presented by Ruter [25] and Sommano [26], mango peel was cut into 5 mm × 5 mm strips which were immediately submerged in 20 mL of DI water in a 50 mL test tube. Each sample (5 replications for each mango fruit) was then incubated for 24 h at 4 °C before initial conductivity (EC1) was measured at room temperature using an Eutech CON 700 conductivity meter (Eutech Instruments Pte Ltd., Singapore). Each tube was then autoclaved for 20 min at 121 °C and cooled overnight in an ice bath prior to measuring the final EC2 at room temperature. Electrolyte leakage (EL) was calculated as follows:
EL = EC 1 / ( EC 2 + EC 1 ) × 100

2.5. Biochemical Analyses

The extraction method used for biochemical analysis of mango fruits followed that presented by Islam et al. [7], with some modification. Four grams of mango pulp was immediately immersed in boiling 80% ethanol, which was then left to boil for ten minutes. The resulting extract was then filtered through muslin cloths, and the mango pulp was then reextracted for three minutes and filtered again. The resulting extract was then evaporated off to approximately 25% of its original volume and transferred to a 100 mL volumetric flask which was then filled to the brim with ethanol and used for the following biochemical tests.

2.5.1. Total Phenolic Compounds

The content of total phenolics in mango pulp extract was determined using the Folin–Ciocalteu procedure, as presented by Sunanta et al. [27]. Briefly, 30 µL of the extract was mixed with 60 µL of 10% Folin–Ciocalteu reagent and 120 µL of 6% sodium carbonate solution in a 96-well microplate. The solution was thoroughly mixed and allowed to react in the dark for 90 min before the absorbance of the reaction mixture at 650 nm was measured using a microplate reader (SPECTROstar Nano; BMG LABTECH, Offenburg, Germany). The linear gallic acid standard equation was used to calculate how many total phenolics were present at concentrations from 0 to 200 mg/L.

2.5.2. Total Flavonoid Compounds

The total flavonoid content of mango pulp extract was measured by a calorimetric assay [27]. Twenty-five microlitres of the extract were diluted with 125 µL of distilled water in a microplate before 7.5 µL of NaNO2 was added and the reaction was allowed to occur for 5 min. Then, 15 µL of AlCl3 was added and left for 6 min before adding 50 µL of NaOH and 27.5 µL of distilled water. The absorbance of the mixed solution was measured at 510 nm. Different concentration sequences of catechin were analysed in the same way to determine the content of flavonoids in the extract, which was expressed as mg of catechin equivalent per litre of mango pulp extract.

2.5.3. Antioxidants

The antioxidant capacity of the extracts was determined using the 2,2′-azino-bis-3-ethylbenzthiazoline-6-sulphonic acid (ABTS) and 1,1-diphenyl-2-picrylhydrazyl (DPPH) assays in this study.
The DPPH assay was based on the method of Adewusi et al. [28] and Sangta et al. [29] with slight modification. Two hundred and fifty microlitres of 0.1 mM DPPH in 95% ethanol (v/v) solution was mixed with 25 µL of sample in a microplate, and then the mixture was allowed 30 min to react in darkness before absorbance was measured at 517 nm. The ability to scavenge the DPPH radical was calculated using the following equation:
DPPH   radical   scavenging   activity   ( % ) = [ A   control     A   sample A   control ] 100
The ABTS assay was performed according to the method of Adewusi et al. [28] with some modifications. The ABTS solution was prepared by mixing 500 µL of 7 mM ABTS with 500 µL of 2.4 mM potassium persulfate, and then the mixed solution was left for 16 h. The blue-green mixed solution was then diluted with fresh phosphate-buffered saline solution buffer (pH 7.4) until an absorbance of 0.650 ± 0.02 at 734 nm was reached. To determine the antioxidant activity of the extract, 10 µL of sample was added to a 96-well microplate, followed by the addition of 200 µL of ABTS radical cation. This was then left in the dark for 30 min before the absorbance was read at 734 nm. The ABTS scavenging capacity of the extract was calculated as percent antiradical activity using the following equation:
ABTS   tadical   scavenging   activity   ( % ) = [ A   control     A   sample A   control ] 100

2.5.4. Total Sugar and Reducing Sugar

The mango pulp extract was tested for total sugar and reducing sugar content calorimetrically by using the anthrone and dinitrosalicylic acid methods, respectively, following the method of Islam et al. [7] with some modification.
To determine the total sugar of the extract, 0.2% (v/v) of anthrone in sulfuric acid was used as an anthrone reagent. One millilitre of 0.05% extract diluted in ethanol was added with 2 mL anthrone reagent, and then the resulting mixture was boiled for 10 min. The solution was then allowed to cool before the absorbance was measured at 680 nm. A standard curve was obtained by using the same procedure and measuring D-glucose solution across a range of concentrations from 0 to 100 µg/L.
The dinitrosalicylic acid technique (DNS) was employed to determine the extract’s reducing sugar content. A 96-well microplate was filled with 100 µL of the extract solution, and 100 µL of the DNS solution was then added and mixed. The microplate was then wrapped in plastic, heated in an 80 °C water bath for 30 min, and cooled before the adsorption reached maturity at 575 nm. To obtain a standard curve, a D-glucose solution ranging from 0 to 600 µg/mL was used.

2.6. Statistical Analysis

The mean differences of the physical and biological markers of ‘Nam dok mai si thong’ mango at each ripening stage, the degree of burning symptoms, and the degree of disease infection were statistically explored using analysis of variance (ANOVA) in SPSS (IBM, Armonk, NY, USA), with a significance level of 0.05. The recorded NIR spectra were subjected to principal component analysis (PCA). A partial least squares (PLS) model was applied to examine the relationships of destructive parameters, non-destructive parameters, and recorded NIR spectra with post-harvest characteristics (ripening, burning, and disease infection). Root mean square error of calibration (RMSEC) and prediction (RMSEP) were calculated to evaluate the accuracy of the calibration models. To evaluate the prediction performance of the model, the coefficients of determination for calibration (R2) and prediction (Q2) were also calculated. Calculations of PCA and PLS and related statistical analyses were implemented using in-house MATLAB scripts (MATLAB V7.0, The Math Works Inc., Natick, MA, USA).

3. Results and Discussion

3.1. Fruit Ripening Characteristics

From the results presented in Table 2, it is clear that over the mango ripening process, lightness (L*), firmness of both with peel and without peel (F w/Peel and F w/o Peel, respectively), titratable acidity (TA), total phenolics content, antioxidant activity (DPPH and ABTS), and pH were strongly reduced, while the a* (red–green) and b* (blue–yellow) values of the CIE Lab colour space, weight loss (%), peel electrolyte leakage (EL), total sugar content (ttSugar), the amounts of reducing sugar, total flavonoids content, and the ratio of total soluble solids (TSS) and titratable acidity (TSS/TA) were increased. Mango is a climacteric fruit, where after the mature fruit is detached from the tree, the ripening process, and biological metabolism in general, occurs rapidly [30]. During the ripening process, the respiration rate of the fruit increases, which activates ethylene production; biosynthesis of pigments; and changes in carbohydrates, organic acids, lipids, phenolics, and aromatic compounds [31]. More importantly, structural polysaccharides in the fruit are reformed during ripening, with this being responsible for textural softening and alterations in the appearance of mango fruit [5,31]. Considering only the appearance parameters, the present study found that L* values and firmness, both with and without peel, decreased during the process of ripening, while a*, b*, and percent weight loss increased. Interestingly, this colour change during ripening is exclusive to this cultivar. Penchaiya and Tijskens [32] discovered that during low-temperature storage of mango ‘Nam dok mai si thong’, the a* and b* values increased, while the L* and hue values decreased, which aligns with the results of the current study. Another primary factor influencing mango fruit quality during ripening is water loss in the fruit caused by respiration and dehydration [1], which reduces fruit weight and causes the skin of the fruit to shrink due to decreased cell wall pressure. As the mango fruit ripens, structural carbohydrates also undergo chemical transformation, with pectin, a gelling sugar, contributing to the firmness loss of the fruit [31].
Common physicochemical criteria used to measure fruit quality in mangoes include pH, TA, TSS, TA/TSS, and sugar content. These metrics are often used to define the sweetness and sourness of mango; acid concentrations are frequently reported as pH and TA, whereas sugar levels are recorded as TSS [33]. For ‘Nam dok mai si thong’ mango, we found that TA clearly decreased as mangoes became ripe, in contrast to pH values which increased. Citric and malic acids are common organic acids that contribute to the acidity of mango fruit, with these decreasing as the fruit ripens, possibly due to enzyme activities involved in the Krebs cycle of mango fruit changing during ripening with citrate synthase activity drastically decreasing [31]. The content of sugar also increased during mango ripening in the current study. In general, fructose, glucose (reducing sugars), and sucrose (non-reducing sugar) are the main sugar components in ripe mango [31,33], with an increment in sugar content during ripening generally observed as a result of starch hydrolysis by amylase [33], while the reduction in sugar is due to increased cellular respiration that converts sugar (especially fructose and glucose) and oxygen into carbon dioxide, water, and heat [34].
Bioactive compound markers in ripening mango fruits were also investigated in the current study, revealing contrasting changes in the contents of phenolics and flavonoids reversely altered over the ripening process. While the levels of antioxidants and phenolic compounds decreased with ripening, those of flavonoid compounds decreased in the early ripening stages but were clearly elevated in the ripest fruits. Phenolic compounds are essential phytochemicals that provide biological functions (having antioxidant and anti-pathogenic activity) with the ability to resist environmental stresses. During the ripening process of mango in work elsewhere, the contents of phenolic acid and flavonoids were altered differently depending on the maturity stages of fruits considered, their post-harvest management, and the mango cultivars studied [31]. The most common types of phenolic acids found in mangoes are hydroxybenzoic and hydroxycinnamic acid derivatives, which can be present in free or conjugated forms with glucose or quinic acid [31,35]. Phenolic acids have a relatively high molecular weight and are abundant in unsaturated structures (phenol moiety) and resonance-stabilised structures, resulting in H-atom donation and antioxidant action via a radical scavenging mechanism [35]. Gallic, vanillic, syringic, protocatechuic, and p-hydroxybenzoic acids have been identified as hydroxybenzoic acids in mango pulp, whereas p-coumaric, chlorogenic, ferulic, and caffeic acids are hydroxycinnamic acid derivatives [31]. Flavonoids are polyphenols and represent probably the most vital phytochemicals found in mango pulp. They exist in the form of glycone, glycosides, and methylated derivatives, with the most common type of flavonoids found in mango pulp being quercetin and glycoside derivatives [31,36,37]. The reduction in flavonoid content seen during the earlier stages of the ripening process in the current study might be due to the low expression of synthase, as recorded elsewhere in Ataulfo mango [38]. The apparent increase in flavonoids in maximally ripened fruits in the current study may be explained by increased disease/damage in these fruits occurring later in the ripening process [3,4], which could be expected to cause an accumulation of flavonoids, as well as anthocyanin, as a response to these stresses [39,40,41].

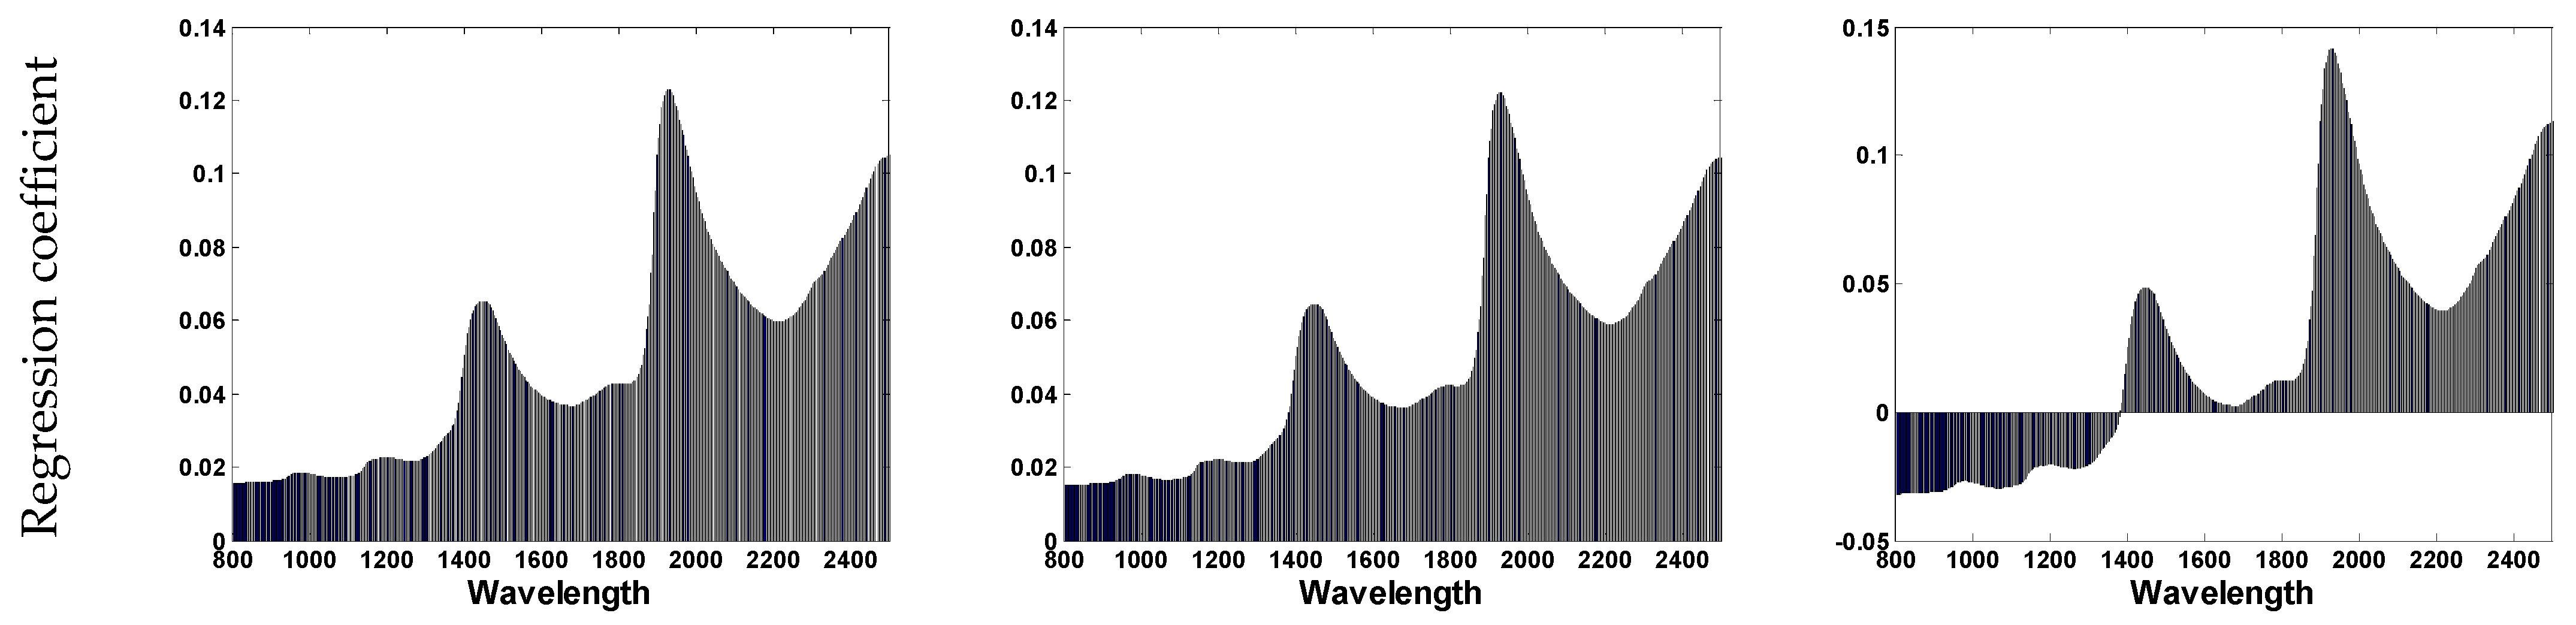
3.2. Burning Characteristics

Essential oils are volatile organic compounds that are synthesised by plants. They serve as self-defendable substances that can protect against environmental stress and as semiochemical compounds that facilitate interaction with other organisms [42]. The majority of essential oils can suppress pathogenic fungi by damaging the pathogen’s cell membrane integrity, thereby modifying the pH of the cell [43,44]. Consequently, there has been an interest in applying essential oil to treat potential disease defects in post-harvest fruit [15,45]. Applying essential oil at an inappropriate (high) concentration, however, could destroy the normal morphology of the fruit and impact the function of the cell wall and membrane, resulting in burning symptoms on the fruit skin [15,46,47]. Consumer acceptance is diminished when mango fruit shows the appearance of discolouration, but despite this, little information exists on measurable changes in ‘Nam dok mai si thong’ treated with essential oil as a natural mango preservative. The results of the current study show that some of the parameters assessed responded to the level of burning symptoms seen (Table 3). L*, firmness of peel, phenolics, and antioxidants, as described by DPPH radical assay, decreased with an increase in burning symptoms, while percent weight loss and pH slightly increased. However, there was no significant difference observed for the responses of a*, b*, firmness of flesh, EL, TSS, TA, TSS/TA, total sugar content, reducing sugar, flavonoids, and ABTS to the degree of burning, which is in accordance with the study of Karunanayake et al. [16], which indicated that the incorporation of beeswax with basil oil had no influence on the physiochemical (excluding TSS) properties of mango (cv. Willard), but had a modest impact on the organoleptic aspects and appearances of mango fruit.

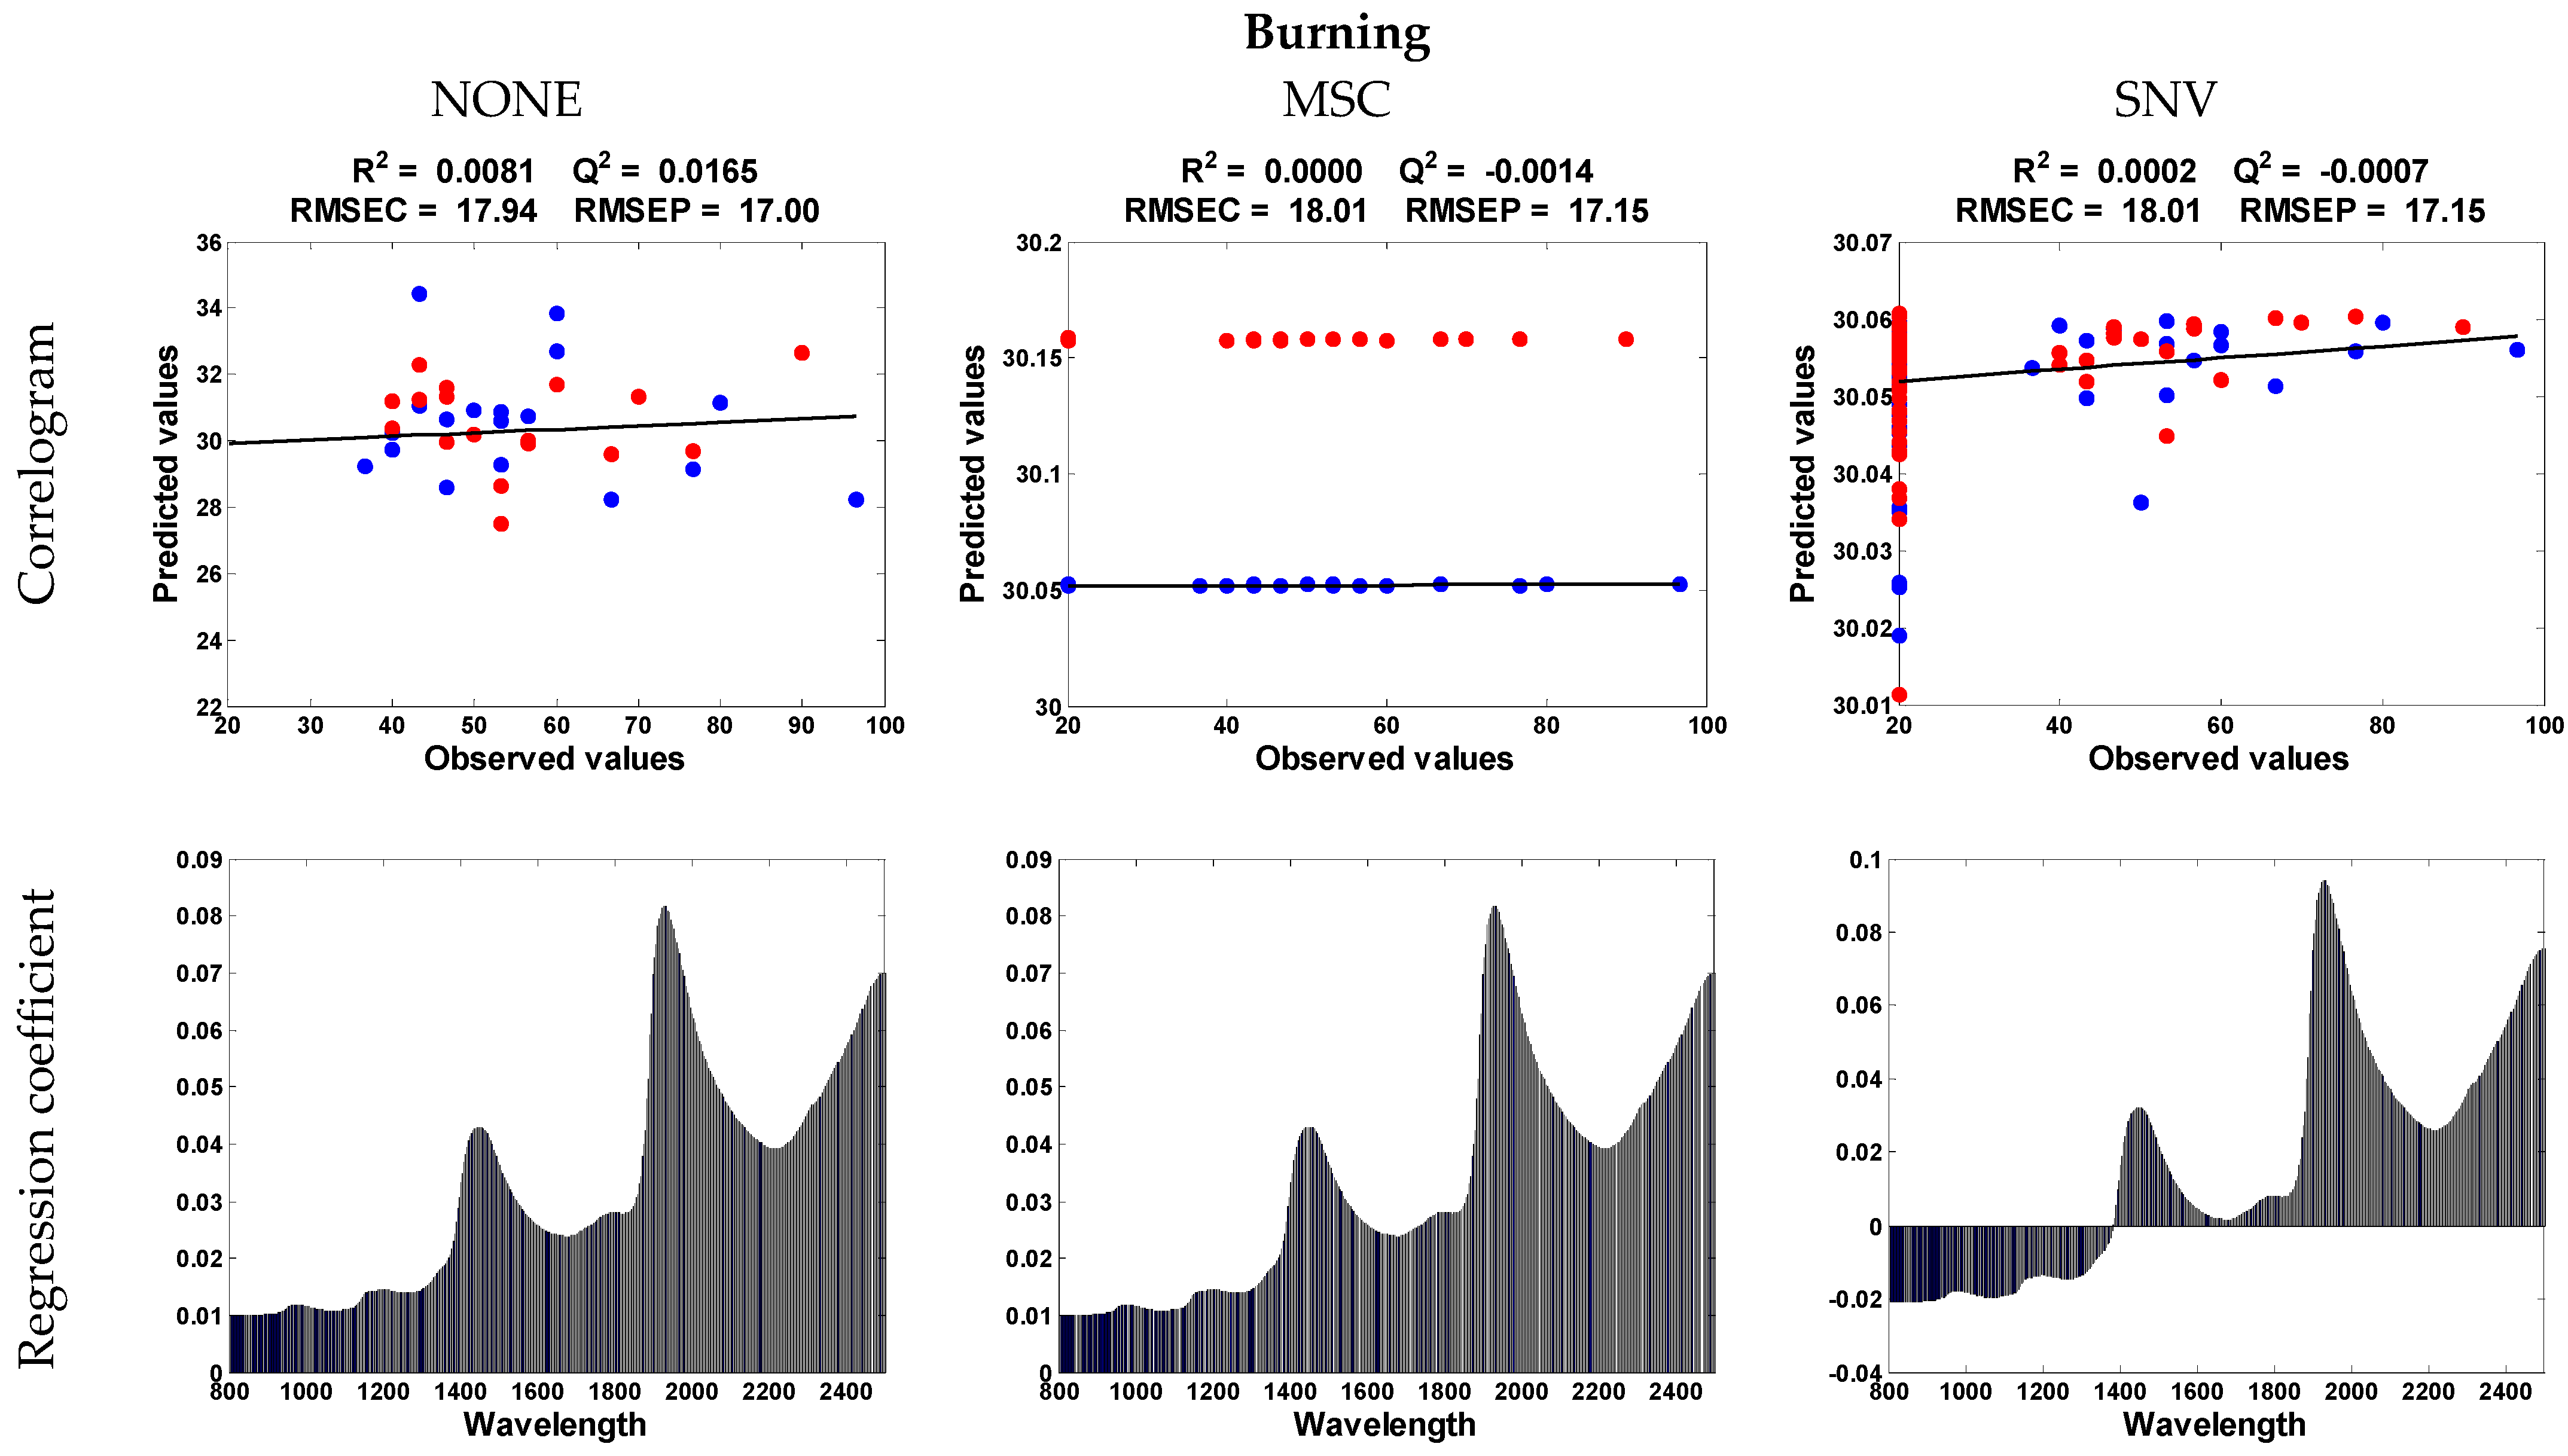
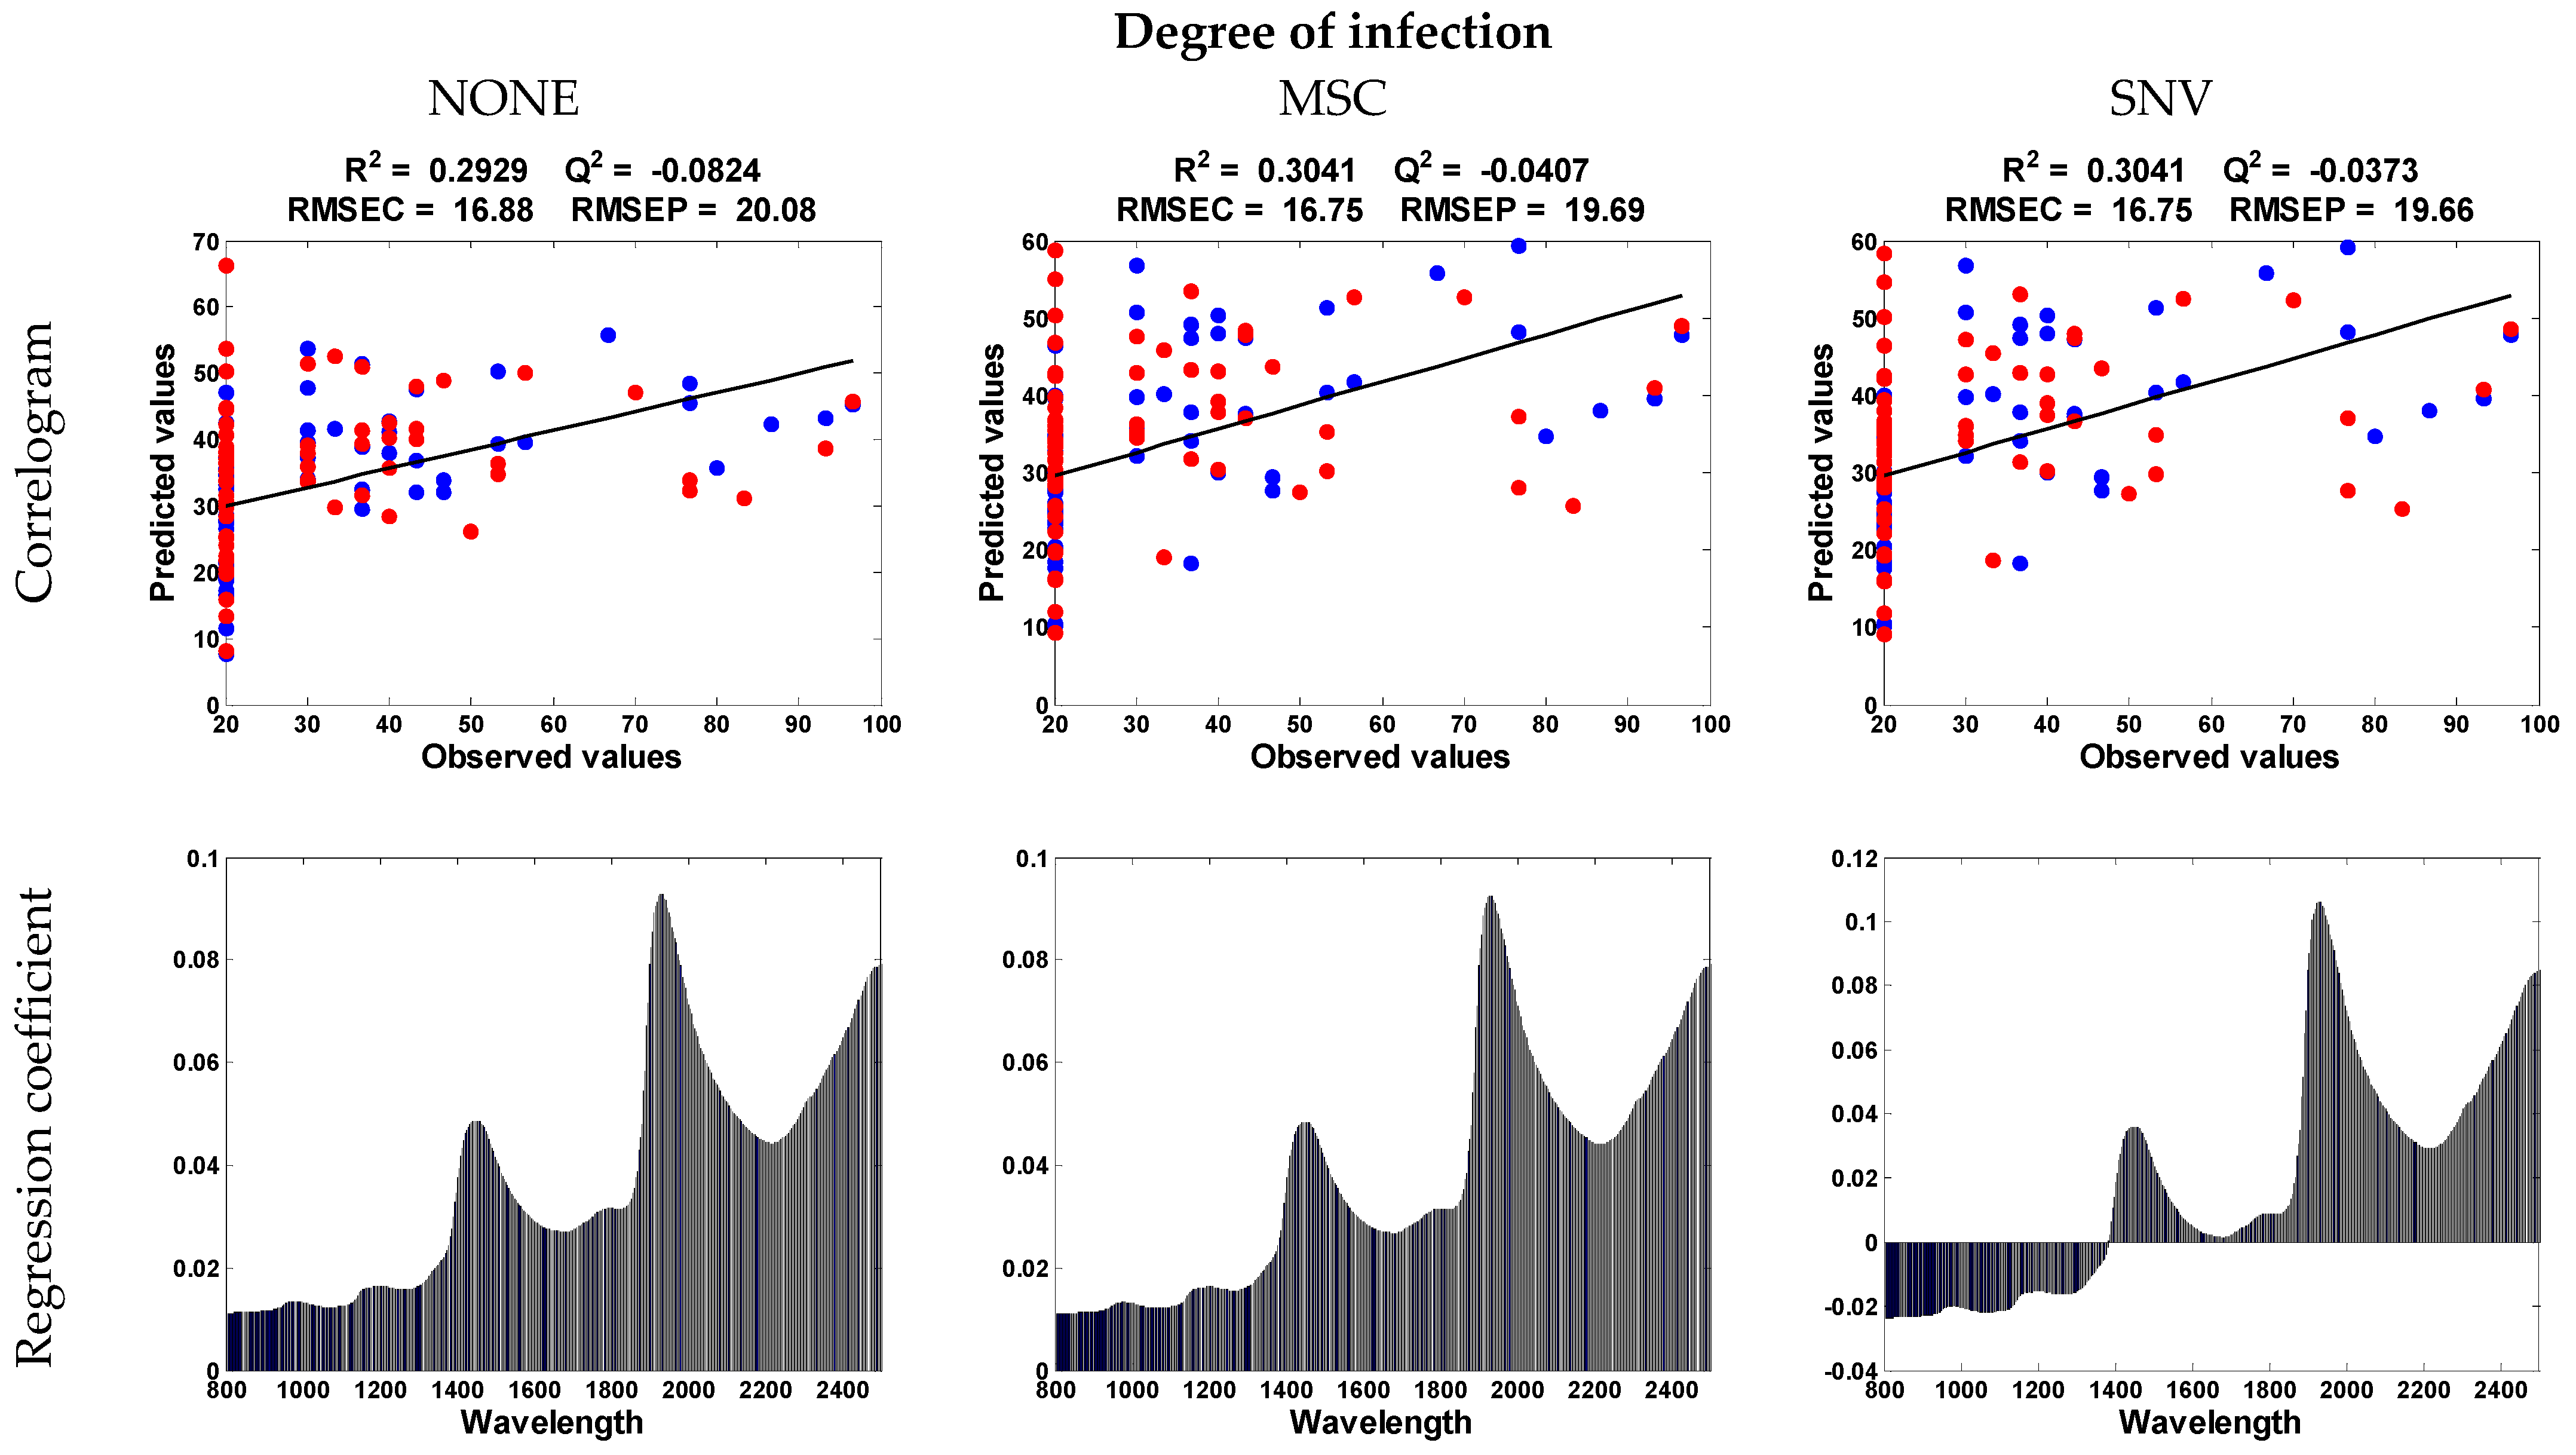
3.3. Infectious Disease Characteristics

The number of samples classified according to the degree of mango anthracnose disease symptoms is shown in Table 4, with the majority of mangoes showing no disease, but with fruits assessed under all five disease classes for markers that can be broadly classified into three categories, namely mango appearance (L*, a*, b*, F w Peel, F w/o Peel, percent weight loss, and EL), physiochemical properties (pH, TSS, TA, TSS/TA, total sugar content, and reducing sugar content), and phytochemical content and its antioxidant activities (phenolics, flavonoids, DPPH, and ABTS). From the results obtained, anthracnose symptom severity was related most strongly to fruit appearance and phytochemicals, and to physiochemical changes to a lesser extent. The lightness and firmness of mango fruits were reduced with increasing anthracnose symptoms, while a*, b*, and percent weight loss increased. Anthracnose and stem end rot infections produced by C. gloeosporioides and Lasiodiplodia theobromae are the most significant challenges faced in the production of ‘Nam dok mai’ mangoes [48,49,50], with C. gloeosporioides being especially problematic due to it producing polygalacturonase and pectolyase enzymes that can degrade the cell wall, resulting in structural loss of cell strength [31].
Enzymes produced by plant tissue in response to stresses may also contribute to the development of undesirable symptoms in mango. Such enzymes include peroxidases, the oxidoreductases that catalyse the reduction of peroxides, which are involved in many metabolic and physiological changes in plant tissue, and include phenolase, which catalyses the oxidation of phenol [51]. In addition, the oxidation reaction of leaked phenol compounds catalysed by polyphenol oxidase (phenolase) causes substance quinones to be generated, which produce brown pigments (melanins) [31,52], and also leads to the leakage of terpene compounds (essential oil) that could be associated with tissue discolouration and the appearance of brown spots [53]. In the current study, there was a marked increase in TSS/TA between ‘infectious 1’ and ‘infectious 2’ (or higher) mangoes, which may suggest that ripening fruits were more susceptible to infection. This may be a result of the increased respiration process, resulting from the formation of ethylene at the site of infection. Ethylene is a volatile plant hormone that, along with other hormones and signals, plays a significant role in triggering the ripening process in numerous fruits [54]. Cell wall degrading enzymes have been previously shown to increase activity linked to ethylene biosynthesis, with mangoes ripening faster as a result [55]. From the statistical analysis results, the surprising aspect of the data is that the increase in flavonoids occurs while DPPH decreases (Table 4). Due to its antioxidant property, it is possible that the mechanism of self-defense against injury is responsible for the increase in flavonoids as damage increases [39,40,41], where the build-up of anthocyanins and flavonoids in the peel of mango fruit is already known to protect against chilling injury and pathogen infection [31,39]. However, it is possible that the amount of flavonoids present does not significantly affect the antioxidant capacity, but that other substances may affect the antioxidant capacity; examples include vitamin C [31] and peroxidase (antioxidant enzymes) [56], which may be reduced.

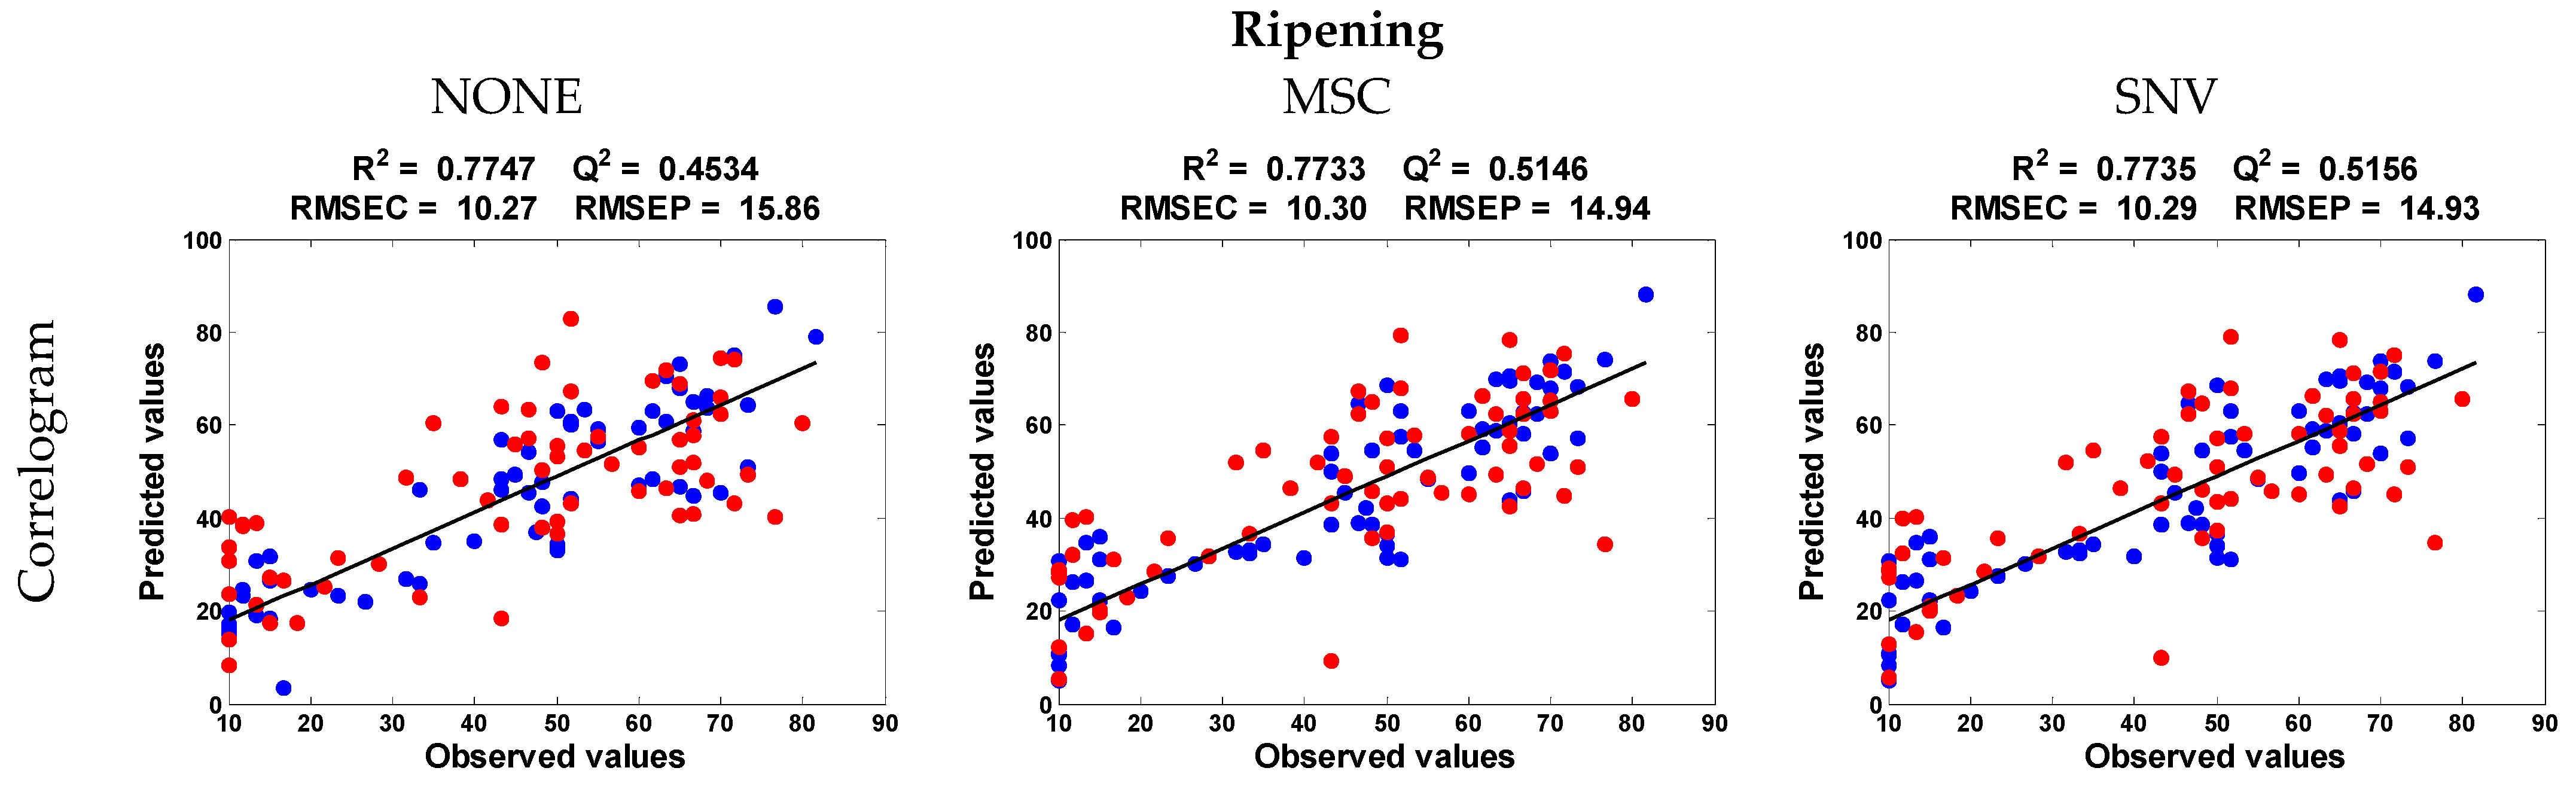
3.4. PLS Correlations

PLS is a precisely calibrated algorithm for investigating the association between prediction and response parameters. It provides a potent multivariate calibration method where the variations from both the predictive and response parameters are simultaneously extracted and used for correlating the regression model [1], using input data to compute the prediction models [19,57]. A few previous studies have employed the use of PLS to determine relationships between quality attributes in fresh produce. For example, Wongkaew et al. [23] examined the correlation of expected and predicted pectin quality values with the physiological properties of mangoes and the nutritional compositions of mango peel. Working with tangerines, Theanjumpol et al. [19] similarly investigated the correlation and associated PLS coefficients for the prediction of granulation characteristics of fruit using multiple physiochemical variables, including moisture content, soluble solids content, and titratable acidity. In the current study, PLS modelling was used to comprehend the relationship between quality parameters and physiological alterations during post-harvest of ‘Nam dok mai si thong’ mango, as well as to determine the corresponding PLS values of the impact of each parameter (Figure 1 and Figure 2). From the results, the ripening stages of mango and degree of infection were correlated with both non-destructive (Figure 1) and destructive (Figure 2) parameters. The R2 values for ripening stages and the degree of disease infection with non-destructive parameters were 0.8642 and 0.6937, respectively, with important parameters being lightness and percent weight loss. Similarly, the destructive parameters were also correlated with ripening stage and the level of infection, with respective R2 values of 0.7951 and 0.4043 and pH and TSS being the most important factors. Even though all four significant parameters (lightness, percent weight loss, pH, and TSS) were identical, non-destructive and destructive parameters were less associated with burning characteristics, with R2 values of 0.16 and 0.07, respectively.
Lightness, percent weight loss, pH, and total soluble solids are commonly used to evaluate mango quality [32,33]. These provide measurements of metabolic changes in fruits that lead to the mango’s physicochemical, and then physical, transformation. Changes in luminescence are driven by post-harvest degradation of mango pigments, especially chlorophyll and carotenoids, that contribute to green and yellow-orange colouration in mango fruit [31], alongside the generation of melanins arising from oxidation of phenol [31,51,52]. Most of the weight loss is caused by metabolic processes that convert precursors to water as a byproduct, such as cellular respiration and dehydration [1,30], where ethylene is the primary actuator [54]. In addition, biological reactions impact the quantity of reactants and yields, which can be evaluated with pH and TSS [33] and may be due to the transformation of organic acids [31] and polysaccharides [5,31]. These results suggest that it should be possible to develop tools to non-destructively assess ripening stage in ‘Nam dok mai si thong’ mangoes, based, for example, on the brightness of the fruits’ skin. Such tools could prove to be of significant benefit to the mango industry.

3.5. Near-Infrared Spectra

The typical NIR spectra of ‘Nam dok mai si thong’ mango are illustrated in Figure 3A. Visually apparent separation in absorbance patterns between unripe fruits sampled at D0-D5 and ripe fruits at D8-16 was evident, especially at wavelengths where absorbance peaked (i.e., 1400–1600 nm and 1800–2000 nm). As seen in Figure 3B, the PCA score plot likewise reveals a strong separation between the early stored fruits and those held for 8, 12, and 16 days. In work by Jha et al. [8], the authors concluded that such alterations in spectral patterns from mangoes may be attributable to changes in the surface texture and moisture content of fruits during storage. In fruit more generally, the NIR region between 800 and 1050 nm is often used to describe the ripening process, in unison with acidity, pH, sugar content, and texture [58], with numerous other examples in the literature confirming the potential of various wavelengths of light in assessing fruit characteristics. Differences in absorption in the water and protein/amino acid areas (1170 nm, 1400–1500 nm, and 2150–2250 nm), for example, may be associated with disease infestation as a result of microbial development and/or the biochemical mechanisms that heal damaged tissue [59]. Changes in individual sugars, ethanol, and glycerol can also be anticipated using NIR in the 850–1300 nm range [60]. Peaks at 1050–1120 and 1400–1455 nm are altered specifically as the result of O-H absorption in H2O molecules in fruit samples, as described by moisture loss [61,62]. The specific wavelength of 1359 nm might be associated with the C-H bond, suggesting a shift in polysaccharide profile, which is linked to texture modification of plants, whereas wavelengths between 1000 and 1200 nm are related to C-O groups [63]. Alhamdan et al. [64] identified that lower wavelength regions, at 385–935 nm, 382–920 nm, and 630–772 nm, were able to provide information on hardiness, cohesiveness, and chewiness of date fruits. Finally, the spectral region between 2000 and 2400 nm can be used to determine the presence of various pectins (i.e., soluble and proto-pectins) [65], while the absorption peaks between 1790 and 1706 nm are associated with C = O groups, illustrating the presence of different organic compounds [66].
PLS models were fitted for the NIR spectra to explore their ability to describe physical and biological traits (Figure 4, Figure 5 and Figure 6). The best results were those obtained from the ripening process (Figure 4) using multiplicative scatter corrections (MSC) and standard normal variate (SNV) data processing. Here, maximum values of R2 for calibration and validation were found to be 0.713 and 0.515, respectively, which corresponded to the absorbance regions at 1455 nm and 1930 nm. The differences in absorption in the water and protein/amino acid regions (1170 nm, 1400–1500 nm, and 2150–2250 nm) [59] may be related to important metabolic changes, cellular respiration [1,30], and alterations in numerous enzymes [31,67]. There was, however, no correlation found between NIR spectra and essential oil burning (Figure 5) or degree of infection (Figure 6), although the wavelengths associated with these mango characteristics were similar. In work elsewhere, NIR has been similarly used to determine internal or invisible damage of fruits [68,69], as well as stage of maturity [70,71], acidity [72], and ripening stage [73] in different mango varieties. The models employed in these studies were developed based on assessing physicochemical parameters and employing similar imaging-based non-destructive tools to those used in the current work, such as colour space and hyperspectral imagery.

4. Conclusions

The current research supports that the majority of alterations in the physiological and biochemical properties of ‘Nam dok mai si thong’ mangoes occur in response to the natural ripening process. Nevertheless, the mango’s physiological and biochemical properties varied, albeit more marginally, with different degrees of burn and disease infection. Peel lightness, percent weight loss, pH, and TSS values were the most important storage-related indicators for ‘Nam dok mai si thong’ mango, according to the results of the PLS model used. These are measurements of the metabolic transformation that occurs in mangos, leading to physicochemical and physical modification of the fruit, including degradation of colour, phenol oxidation, cellular respiration, dehydration, and transformation of organic acids and polysaccharides. The findings from this work provide valuable information on the measurements most related to the quality of ‘Nam dok mai si thong’ mangoes. This in turn can be utilised to develop new research-related and commercially relevant tools for assessing mango fruit quality.

Author Contributions

Conceptualisation, S.R.S. and S.K.; methodology, T.T. and N.P.; software, S.K.; validation, T.T., D.R.G., P.K. and B.C.; formal analysis, T.T. and N.P.; investigation, T.T.; resources, T.T.; data curation, T.T. and N.P.; writing—original draft preparation, T.T.; writing—review and editing, S.R.S. and D.R.G.; visualisation, T.T. and N.P.; supervision, S.R.S.; project administration, T.T.; funding acquisition, P.K., B.C. and S.R.S. All authors have read and agreed to the published version of the manuscript.

Funding

The research project was funded by the National Research Council of Thailand (NRCT): (contact No. N41A640354). This research project was partially supported by Chiang Mai University.

Institutional Review Board Statement

Not applicable.

Informed Consent Statement

Informed consent was obtained from all subjects involved in the study.

Data Availability Statement

Not applicable.

Acknowledgments

We would like to acknowledge the Teaching Assistant and Research Assistant (TA/RA) scholarship from the Graduate School, Chiang Mai University. This research project was supported by Fundamental Fund 2022, Chiang Mai University.

Conflicts of Interest

The authors declare no conflict of interest. The funders had no role in the design of the study; in the collection, analyses, or interpretation of data; in the writing of the manuscript; or in the decision to publish the results.

References

  1. Tangpao, T.; Kumpoun, W.; Withee, P.; Cheewangkoon, R.; Sommano, S.R. Usages of Thai basil oil vapour in controlling Colletotrichum sp. in postharvest storage of ‘Nam Dok Mai Si Thong’ mangoes. Acta Hortic. 2022, 1336, 221–228. [Google Scholar] [CrossRef]
  2. Sangudom, T.; Wattanawan, C.; Makkumrai, W.; Chatbanyong, R.; Tongtao, S. Improvement on the supply chain of Thai mango for exporting. Acta Hortic. 2019, 1244, 209–214. [Google Scholar] [CrossRef]
  3. Lin Aung, Y.; Lorjaroenphon, Y.; Rumpagaporn, P.; Sae-tan, S.; Na Jom, K. Comparative Investigation of Combined Metabolomics-Flavoromics during the Ripening of Mango (Mangifera indica L.) cv. ‘Nam Dok Mai Si Thong’ and ‘Nam Dok Mai No. 4’. Plants 2021, 10, 2198. [Google Scholar] [CrossRef] [PubMed]
  4. Noiwan, D.; Suppakul, P.; Joomwong, A.; Uthaibutra, J.; Rachtanapun, P. Kinetics of Mango Fruits (Mangifera indica cv. ‘Nam Dok Mai Si Thong’) Quality Changes during Storage at Various Temperatures. J. Agric. Sci. 2017, 9, 199. [Google Scholar] [CrossRef]
  5. Ntsoane, M.L.; Zude-Sasse, M.; Mahajan, P.; Sivakumar, D. Quality assesment and postharvest technology of mango: A review of its current status and future perspectives. Sci. Hortic. 2019, 249, 77–85. [Google Scholar] [CrossRef]
  6. Alam, S.K.; Rahman, M.; Reza, M.; Amin, M.N.; Hussen, M.A. Postharvest loss assessment of mango at different stages of supply chain through traditional and improved handling practices. Adv. Plants Agric. Res. 2019, 9, 384–388. [Google Scholar] [CrossRef]
  7. Islam, M.K.; Khan, M.Z.H.; Sarkar, M.A.R.; Absar, N.; Sarkar, S.K. Changes in Acidity, TSS, and Sugar Content at Different Storage Periods of the Postharvest Mango (Mangifera indica L.) Influenced by Bavistin DF. Int. J. Food Sci. 2013, 2013, 939385. [Google Scholar] [CrossRef]
  8. Jha, S.N.; Narsaiah, K.; Jaiswal, P.; Bhardwaj, R.; Gupta, M.; Kumar, R.; Sharma, R. Nondestructive prediction of maturity of mango using near infrared spectroscopy. J. Food Eng. 2014, 124, 152–157. [Google Scholar] [CrossRef]
  9. Mercadante, A.Z.; Rodriguez-Amaya, D.B. Effects of Ripening, Cultivar Differences, and Processing on the Carotenoid Composition of Mango. J. Agric. Food Chem. 1998, 46, 128–130. [Google Scholar] [CrossRef]
  10. Chin, C.F.; Teoh, E.Y.; Chee, M.J.Y.; Al-Obaidi, J.R.; Rahmad, N.; Lawson, T. Comparative Proteomic Analysis on Fruit Ripening Processes in Two Varieties of Tropical Mango (Mangifera indica). Protein J. 2019, 38, 704–715. [Google Scholar] [CrossRef]
  11. Wongkaew, M.; Sangta, J.; Chansakaow, S.; Jantanasakulwong, K.; Rachtanapun, P.; Sommano, S.R. Volatile profiles from over-ripe purée of Thai mango varieties and their physiochemical properties during heat processing. PLoS ONE 2021, 16, e0248657. [Google Scholar] [CrossRef]
  12. Muda, P.; Seymour, G.; Errington, N.; Tucker, G. Compositional changes in cell wall polymers during mango fruit ripening. Carbohydr. Polym. 1995, 26, 255–260. [Google Scholar] [CrossRef]
  13. Uddin, M.; Shefat, S.; Afroz, M.; Moon, N. Management of anthracnose disease of mango caused by Colletotrichum gloeosporioides: A review. Acta Sci. Agric. 2018, 2, 169–177. [Google Scholar]
  14. Dowling, M.; Peres, N.; Villani, S.; Schnabel, G. Managing Colletotrichum on Fruit Crops: A “Complex” Challenge. Plant Dis. 2020, 104, 2301–2316. [Google Scholar] [CrossRef] [PubMed]
  15. Danh, L.T.; Giao, B.T.; Duong, C.T.; Nga, N.T.T.; Tien, D.T.K.; Tuan, N.T.; Huong, B.T.C.; Nhan, T.C.; Trang, D.T.X. Use of Essential Oils for the Control of Anthracnose Disease Caused by Colletotrichum acutatum on Post-Harvest Mangoes of Cat Hoa Loc Variety. Membranes 2021, 11, 719. [Google Scholar] [CrossRef] [PubMed]
  16. Karunanayake, C.; Liyanage, K.; Jayakody, L.; Somaratne, S. Basil oil incorporated beeswax coating to increase shelf life and reduce anthracnose development in mango cv. Willard. Ceylon J. Sci. 2020, 49, 355–361. [Google Scholar] [CrossRef]
  17. Wang, H.; Peng, J.; Xie, C.; Bao, Y.; He, Y. Fruit quality evaluation using spectroscopy technology: A review. Sensors 2015, 15, 11889–11927. [Google Scholar] [CrossRef]
  18. Taira, E.; Nakamura, S.; Hiyane, R.; Honda, H.; Ueno, M. Development of a nondestructive measurement system for mango fruit using near infrared spectroscopy. Eng. Appl. Sci. Res. 2017, 44, 189–192. [Google Scholar]
  19. Theanjumpol, P.; Wongzeewasakun, K.; Muenmanee, N.; Wongsaipun, S.; Krongchai, C.; Changrue, V.; Boonyakiat, D.; Kittiwachana, S. Non-destructive identification and estimation of granulation in ‘Sai Num Pung’ tangerine fruit using near infrared spectroscopy and chemometrics. Postharvest Biol. Technol. 2019, 153, 13–20. [Google Scholar] [CrossRef]
  20. Penchaiya, P.; Tijskens, L.M.M.; Uthairatanakij, A.; Srilaong, V.; Tansakul, A.; Kanlayanarat, S. Modelling quality and maturity of ‘Namdokmai Sithong’ mango and their variation during storage. Postharvest Biol. Technol. 2020, 159, 111000. [Google Scholar] [CrossRef]
  21. Sommano, S.; Kanphet, N.; Siritana, D.; Ittipunya, P. Correlation Between Browning Index and Browning Parameters During the Senesence of Longan Peel. Int. J. Fruit Sci. 2011, 11, 197–205. [Google Scholar] [CrossRef]
  22. Rathore, H.A.; Masud, T.; Sammi, S.; Soomro, A.H. Effect of storage on physico-chemical composition and sensory properties of mango (Mangifera indica L.) variety Dosehari. Pak. J. Nutr. 2007, 6, 143–148. [Google Scholar] [CrossRef]
  23. Wongkaew, M.; Kittiwachana, S.; Phuangsaijai, N.; Tinpovong, B.; Tiyayon, C.; Pusadee, T.; Chuttong, B.; Sringarm, K.; Bhat, F.M.; Sommano, S.R.; et al. Fruit Characteristics, Peel Nutritional Compositions, and Their Relationships with Mango Peel Pectin Quality. Plants 2021, 10, 1148. [Google Scholar] [CrossRef] [PubMed]
  24. Ayele, L.; W/Tsadik, K.; Abegaz, K.; Yetneberk, S. Postharvest Ripening and Shelf Life of Mango (Mangifera indica L.) Fruit as Influenced by 1-Methylcyclopropene and Polyethylene Packaging. Ethiop. J. Agric. Sci. 2012, 22, 26–44. [Google Scholar]
  25. Ruter, J.M. High-temperature-induced electrolyte leakage from excised leaves and roots of three hollies. Hortscience 1993, 28, 927–928. [Google Scholar] [CrossRef]
  26. Sommano, S. Physiological and Biochemical Changes During Heat Stress Induced Browning of Detached Backhousia myrtifolia (Cinnamon Myrtle) Tissues. Trop. Plant Biol. 2015, 8, 31–39. [Google Scholar] [CrossRef]
  27. Sunanta, P.; Pankasemsuk, T.; Jantanasakulwong, K.; Chaiyaso, T.; Leksawasdi, N.; Phimolsiripol, Y.; Rachtanapun, P.; Seesuriyachan, P.; Sommano, S.R. Does Curing Moisture Content Affect Black Garlic Physiochemical Quality? Horticulturae 2021, 7, 535. [Google Scholar] [CrossRef]
  28. Adewusi, E.A.; Moodley, N.; Steenkamp, V. Antioxidant and acetylcholinesterase inhibitory activity of selected southern African medicinal plants. S. Afr. J. Bot. 2011, 77, 638–644. [Google Scholar] [CrossRef]
  29. Sangta, J.; Wongkaew, M.; Tangpao, T.; Withee, P.; Haituk, S.; Arjin, C.; Sringarm, K.; Hongsibsong, S.; Sutan, K.; Pusadee, T.; et al. Recovery of Polyphenolic Fraction from Arabica Coffee Pulp and Its Antifungal Applications. Plants 2021, 10, 1422. [Google Scholar] [CrossRef]
  30. Penchaiya, P.; Jansasithorn, R.; Kanlayanarat, S. Effect of 1-MCP on physiological changes in mango ‘Nam Dokmai’. Acta Hortic. 2006, 712, 717–721. [Google Scholar] [CrossRef]
  31. Maldonado-Celis, M.E.; Yahia, E.M.; Bedoya, R.; Landázuri, P.; Loango, N.; Aguillón, J.; Restrepo, B.; Guerrero Ospina, J.C. Chemical Composition of Mango (Mangifera indica L.) Fruit: Nutritional and Phytochemical Compounds. Front. Plant Sci. 2019, 10, 1073. [Google Scholar] [CrossRef] [PubMed]
  32. Penchaiya, P.; Tijskens, L.M.M. Assessing the peel colour behaviour of mango ‘Nam Dok Mai See Thong’ during cool storage. Acta Horticlturae 2017, 1154, 207–212. [Google Scholar] [CrossRef]
  33. Malundo, T.; Shewfelt, R.; Ware, G.O.; Baldwin, E.A. Sugars and Acids Influence Flavor Properties of Mango (Mangifera indica). J. Am. Soc. Hortic. Sci. 2001, 126, 115–121. [Google Scholar] [CrossRef] [Green Version]
  34. Yang, Z.; Cao, S.; Su, X.; Jiang, Y. Respiratory activity and mitochondrial membrane associated with fruit senescence in postharvest peaches in response to UV-C treatment. Food Chem. 2014, 161, 16–21. [Google Scholar] [CrossRef] [PubMed]
  35. Kumar, N.; Goel, N. Phenolic acids: Natural versatile molecules with promising therapeutic applications. Biotechnol. Rep. 2019, 24, e00370. [Google Scholar] [CrossRef] [PubMed]
  36. Panche, A.N.; Diwan, A.D.; Chandra, S.R. Flavonoids: An overview. J. Nutr. Sci. 2016, 5, e47. [Google Scholar] [CrossRef]
  37. Tacias-Pascacio, V.; Castañeda, D.; Fernandez-Lafuente, R.; Berenguer-Murcia, A.; Meza Gordillo, R.; Gutiérrez, L.-F.; Pacheco López, N.; Cuevas-Bernardino, J.C.; Ayora, T. Phenolic compounds in mango fruit: A review. J. Food Meas. Charact. 2022, 16, 619–636. [Google Scholar] [CrossRef]
  38. Palafox-Carlos, H.; Yahia, E.; Islas-Osuna, M.A.; Gutierrez-Martinez, P.; Robles-Sánchez, M.; González-Aguilar, G.A. Effect of ripeness stage of mango fruit (Mangifera indica L., cv. Ataulfo) on physiological parameters and antioxidant activity. Sci. Hortic. 2012, 135, 7–13. [Google Scholar] [CrossRef]
  39. Sivankalyani, V.; Feygenberg, O.; Diskin, S.; Wright, B.; Alkan, N. Increased anthocyanin and flavonoids in mango fruit peel are associated with cold and pathogen resistance. Postharvest Biol. Technol. 2016, 111, 132–139. [Google Scholar] [CrossRef]
  40. Bambalele, N.L.; Mditshwa, A.; Magwaza, L.S.; Tesfay, S.Z. Recent Advances on Postharvest Technologies of Mango Fruit: A Review. Int. J. Fruit Sci. 2021, 21, 565–586. [Google Scholar] [CrossRef]
  41. González-Aguilar, G.A.; Wang, C.Y.; Buta, J.G.; Krizek, D.T. Use of UV-C irradiation to prevent decay and maintain postharvest quality of ripe ‘Tommy Atkins’ mangoes. Int. J. Food Sci. Technol. 2001, 36, 767–773. [Google Scholar] [CrossRef]
  42. Marić, T.; Friščić, M.; Marijanović, Z.; Maleš, Ž.; Jerković, I. Comparison of Volatile Organic Compounds of Sideritis romana L. and Sideritis montana L. from Croatia. Molecules 2021, 26, 5968. [Google Scholar] [CrossRef]
  43. Tangpao, T.; Charoimek, N.; Teerakitchotikan, P.; Leksawasdi, N.; Jantanasakulwong, K.; Rachtanapun, P.; Seesuriyachan, P.; Phimolsiripol, Y.; Chaiyaso, T.; Ruksiriwanich, W.; et al. Volatile Organic Compounds from Basil Essential Oils: Plant Taxonomy, Biological Activities, and Their Applications in Tropical Fruit Productions. Horticulturae 2022, 8, 144. [Google Scholar] [CrossRef]
  44. Nazzaro, F.; Fratianni, F.; Coppola, R.; Feo, V.D. Essential Oils and Antifungal Activity. Pharmaceutics 2017, 10, 86. [Google Scholar] [CrossRef]
  45. D’Agostino, M.; Tesse, N.; Frippiat, J.P.; Machouart, M.; Debourgogne, A. Essential Oils and Their Natural Active Compounds Presenting Antifungal Properties. Molecules 2019, 24, 3713. [Google Scholar] [CrossRef]
  46. Chang, Y.; Harmon, P.F.; Treadwell, D.D.; Carrillo, D.; Sarkhosh, A.; Brecht, J.K. Biocontrol Potential of Essential Oils in Organic Horticulture Systems: From Farm to Fork. Front. Nutr. 2022, 8, 1275. [Google Scholar] [CrossRef]
  47. Cai, C.; Ma, R.; Duan, M.; Deng, Y.; Liu, T.; Lu, D. Effect of starch film containing thyme essential oil microcapsules on physicochemical activity of mango. LWT Food Sci. Technol. 2020, 131, 109700. [Google Scholar] [CrossRef]
  48. Konsue, W.; Dethoup, T.; Limtong, S. Biological Control of Fruit Rot and Anthracnose of Postharvest Mango by Antagonistic Yeasts from Economic Crops Leaves. Microorganisms 2020, 8, 317. [Google Scholar] [CrossRef]
  49. Raviadaran, R.; Chandran, D.; Shin, L.H.; Manickam, S. Optimization of palm oil in water nano-emulsion with curcumin using microfluidizer and response surface methodology. LWT-Food Sci. Technol. 2018, 96, 58–65. [Google Scholar] [CrossRef]
  50. Matulaprungsan, B.; Wongs-Aree, C.; Penchaiya, P.; Boonyaritthongchai, P.; Srisurapanon, V.; Kanlayanarat, S. Analysis of Critical Control Points of Post-Harvest Diseases in the Material Flow of Nam Dok Mai Mango Exported to Japan. Agriculture 2019, 9, 200. [Google Scholar] [CrossRef]
  51. Ortutu, S.; Aremu, M. Evaluation of Peroxidase (POD) Activity of Mango (Mangifera indica) Fruit Pulp at Different Level of Ripeness. Int. J. Sci. Res. Publ. IJSRP 2021, 11, 450–464. [Google Scholar] [CrossRef]
  52. Queiroz, C.; Mendes Lopes, M.L.; Fialho, E.; Valente-Mesquita, V.L. Polyphenol Oxidase: Characteristics and Mechanisms of Browning Control. Food Rev. Int. 2008, 24, 361–375. [Google Scholar] [CrossRef]
  53. Sommano, S.; Joyce, D.C.; Dinh, S.Q.; D’arcy, B. Infection by Alternaria alternata causes discolouration of Backhousia myrtifolia foliage and flowers. J. Hortic. Sci. Biotechnol. 2012, 87, 41–46. [Google Scholar] [CrossRef]
  54. Binder, B.M. Ethylene signaling in plants. J. Biol. Chem. 2020, 295, 7710–7725. [Google Scholar] [CrossRef]
  55. Schouten, R.E.; Fan, S.; Verdonk, J.C.; Wang, Y.; Kasim, N.F.M.; Woltering, E.J.; Tijskens, L.M.M. Mango Firmness Modeling as Affected by Transport and Ethylene Treatments. Front. Plant Sci. 2018, 9, 1647. [Google Scholar] [CrossRef]
  56. Lo’ay, A.; Harbinson, J.; Kooten, O.; Linssen, J. Antioxidant enzymes and oxidative stress in mangoes. Wagening. Agric. Univ. Pap. 2005, 119–162. [Google Scholar]
  57. Geladi, P.; Kowalski, B.R. Partial least-squares regression: A tutorial. Anal. Chim. Acta 1986, 185, 1–17. [Google Scholar] [CrossRef]
  58. Lammertyn, J.; Peirs, A.; De Baerdemaeker, J.; Nicolaï, B. Light penetration properties of NIR radiation in fruit with respect to non-destructive quality assessment. Postharvest Biol. Technol. 2000, 18, 121–132. [Google Scholar] [CrossRef]
  59. Moscetti, R.; Haff, R.P.; Stella, E.; Contini, M.; Monarca, D.; Cecchini, M.; Massantini, R. Feasibility of NIR spectroscopy to detect olive fruit infested by Bactrocera oleae. Postharvest Biol. Technol. 2015, 99, 58–62. [Google Scholar] [CrossRef]
  60. Peirs, A.; Lammertyn, J.; Ooms, K.; Nicolaï, B.M. Prediction of the optimal picking date of different apple cultivars by means of VIS/NIR-spectroscopy. Postharvest Biol. Technol. 2001, 21, 189–199. [Google Scholar] [CrossRef]
  61. Al-Maskri, A.Y.; Hanif, M.A.; Al-Maskari, M.Y.; Abraham, A.S.; Al-sabahi, J.N.; Al-Mantheri, O. Essential Oil from Ocimum basilicum (Omani Basil): A Desert Crop. Nat. Prod. Commun. 2011, 6, 1934578X1100601020. [Google Scholar] [CrossRef]
  62. Senthilkumar, T.; Jayas, D.; White, N. Detection of different stages of fungal infection in stored canola using near-infrared hyperspectral imaging. J. Stored Prod. Res. 2015, 63, 80–88. [Google Scholar] [CrossRef]
  63. Wang, D.; Dowell, F.; Ram, M.; Schapaugh, W. Classification of fungal-damaged soybean seeds using near-infrared spectroscopy. Int. J. Food Prop. 2004, 7, 75–82. [Google Scholar] [CrossRef]
  64. Alhamdan, A.M.; Fickak, A.; Atia, A.R. Evaluation of sensory and texture profile analysis properties of stored Khalal Barhi dates nondestructively using Vis/NIR spectroscopy. J. Food Process Eng. 2019, 42, e13215. [Google Scholar] [CrossRef]
  65. Polesello, A.; Giangiacomo, R.; Forni, E.; Braga, F. The use of NIR spectrophotometry to estimate the pectic substances in fruit and fruit products. Carbohydr. Polym. 1990, 12, 27–38. [Google Scholar] [CrossRef]
  66. Bizzani, M.; Flores, D.W.M.; Colnago, L.A.; Ferreira, M.D. Non-invasive spectroscopic methods to estimate orange firmness, peel thickness, and total pectin content. Microchem. J. 2017, 133, 168–174. [Google Scholar] [CrossRef]
  67. Mukhtar, A.; Latif, S.; Mueller, J. Effect of Heat Exposure on Activity Degradation of Enzymes in Mango Varieties Sindri, SB Chaunsa, and Tommy Atkins during Drying. Molecules 2020, 25, 5396. [Google Scholar] [CrossRef]
  68. Vélez Rivera, N.; Gómez-Sanchis, J.; Chanona-Pérez, J.; Carrasco, J.J.; Millán-Giraldo, M.; Lorente, D.; Cubero, S.; Blasco, J. Early detection of mechanical damage in mango using NIR hyperspectral images and machine learning. Biosyst. Eng. 2014, 122, 91–98. [Google Scholar] [CrossRef]
  69. Mogollón, R.; Contreras, C.; da Silva Neta, M.L.; Marques, E.J.N.; Zoffoli, J.P.; de Freitas, S.T. Non-destructive prediction and detection of internal physiological disorders in ‘Keitt’ mango using a hand-held Vis-NIR spectrometer. Postharvest Biol. Technol. 2020, 167, 111251. [Google Scholar] [CrossRef]
  70. Dos Santos Neto, J.P.; de Assis, M.W.D.; Casagrande, I.P.; Cunha Júnior, L.C.; de Almeida Teixeira, G.H. Determination of ‘Palmer’ mango maturity indices using portable near infrared (VIS-NIR) spectrometer. Postharvest Biol. Technol. 2017, 130, 75–80. [Google Scholar] [CrossRef]
  71. Sohaib Ali Shah, S.; Zeb, A.; Qureshi, W.S.; Malik, A.U.; Tiwana, M.; Walsh, K.; Amin, M.; Alasmary, W.; Alanazi, E. Mango maturity classification instead of maturity index estimation: A new approach towards handheld NIR spectroscopy. Infrared Phys. Technol. 2021, 115, 103639. [Google Scholar] [CrossRef]
  72. Woo, P.S.; Ibrahim, M.F. pH Prediction of Perlis Sunshine Mango Using NIR Spectrometer. IOP Conf. Ser. Mater. Sci. Eng. 2019, 705, 12021. [Google Scholar] [CrossRef]
  73. Rungpichayapichet, P.; Mahayothee, B.; Nagle, M.; Khuwijitjaru, P.; Müller, J. Robust NIRS models for non-destructive prediction of postharvest fruit ripeness and quality in mango. Postharvest Biol. Technol. 2016, 111, 31–40. [Google Scholar] [CrossRef]
Figure 1. The correlation graph of the expected and predicted values and the corresponding PLS values of non-destructive parameters with mango fruit characteristics (ripening, burning, and disease infection). Non-destructive parameters of regression coefficient graph are (1) L* (lightness), (2) a* (green–red), (3) b* (blue–yellow), and (4) weight change (%). Root mean square error of calibration (RMSEC) and prediction (RMSEP) indicate model accuracy, and the coefficients of determination for calibration (R2) and prediction (Q2) represent the model’s prediction ability.
Agriculture 12 01407 g001aAgriculture 12 01407 g001b
Figure 2. The correlation graph of the expected and predicted values and the corresponding PLS values of destructive parameters with mango fruit characteristics (ripening, burning, and disease infection). Root mean square error of calibration (RMSEC) and prediction (RMSEP) indicate model accuracy, and the coefficients of determination for calibration (R2) and prediction (Q2) represent the model’s prediction ability. Destructive parameters of regression coefficient graph are (1) firmness with peel, (2) firmness without peel, (3) pH, (4) TSS, (5) %TA, (6) TSS/TA, (7) electrolyte leakage, (8) total phenolics, (9) total flavonoids, (10) total sugar, (11) reducing sugar, (12) DPPH, and (13) ABTS.
Agriculture 12 01407 g002aAgriculture 12 01407 g002b
Figure 3. Typical NIR spectra of ‘Nam dok mai si thong’ mango encountering physical and biological damages during the storage in the wavelength range of 800–2400 nm (A) and multivariate analysis (PCA) score plot computed from the spectral data (B).
Agriculture 12 01407 g003
Figure 4. The correlation graph of the expected and predicted values and the corresponding partial least squares regression (PLS) values of NIR spectra with mango fruit ripening stages. Abbreviations indicate the data processing type: no data processing (None), multiplicative scatter corrections (MSC), and standard normal variate (SNV); root mean square error of calibration (RMSEC) and prediction (RMSEP) indicate model accuracy, and the coefficients of determination for calibration (R2) and prediction (Q2) represent the model’s prediction ability.
Agriculture 12 01407 g004aAgriculture 12 01407 g004b
Figure 5. The correlation graph of the expected and predicted values and the corresponding partial least squares regression (PLS) values of NIR spectra with mango fruit burning. Abbreviations indicate the data processing type: no data processing (None), multiplicative scatter corrections (MSC), and standard normal variate (SNV); root mean square error of calibration (RMSEC) and prediction (RMSEP) indicate model accuracy, and the coefficients of determination for calibration (R2) and prediction (Q2) represent the model’s prediction ability.
Agriculture 12 01407 g005
Figure 6. The correlation graph of the expected and predicted values and the corresponding partial least squares regression (PLS) values of NIR spectra with mango fruit disease infection. Abbreviations indicate the data processing type: no data processing (None), multiplicative scatter corrections (MSC), and standard normal variate (SNV); root mean square error of calibration (RMSEC) and prediction (RMSEP) indicate model accuracy, and the coefficients of determination for calibration (R2) and prediction (Q2) represent the model’s prediction ability.
Agriculture 12 01407 g006
Table 1. Indexed scores to determine physical and biological alteration during post-harvest storage of ‘Nam dok mai si thong’ mangoes.
Stage/Degree of Symptom12345
Ripening-decay indexAgriculture 12 01407 i001Agriculture 12 01407 i002Agriculture 12 01407 i003Agriculture 12 01407 i004
(Score 1–20)
raw, yellow, hard texture
(Score 21–40)
raw, yellow, semi-hard texture
(Score 41–60)
ripe, orange-yellow, firm texture
(Score 61–100) overripe, orange-yellow, soft texture, slightly alcoholic smell
Burning index(Score 1–20)
no burning
Agriculture 12 01407 i005Agriculture 12 01407 i006Agriculture 12 01407 i007
(Score 21–40)
0–5% of skin surface
(Score 41–60)
5–15% of skin surface
(Score 61–100) 15–30% of skin surface
Infectious index(Score 1–20)
no dark spot
Agriculture 12 01407 i008Agriculture 12 01407 i009Agriculture 12 01407 i010Agriculture 12 01407 i011
(Score 21–40)
0–5% of skin surface
(Score 41–60)
5–15% of skin surface
(Score 61–80) 15–30% of skin surface(Score 81–100) >30% of skin surface
Table 2. Physical and biological markers of ‘Nam dok mai si thong’ mangoes (n = 127) at each ripening stage.
IndexesRipening 1Ripening 2Ripening 3Ripening 4
Number29144341
L*81.52 ± 0.20 d79.57 ± 0.53 c75.59 ± 0.32 b73.27 ± 0.35 a
a*1.58 ± 0.14 a1.83 ± 0.20 a4.03 ± 0.25 b5.71 ± 0.30 c
b*31.37 ± 0.63 a33.88 ± 1.03 b40.8 ± 0.70 c43.3 ± 0.48 d
F w/Peel (N)31.37 ± 0.47 d24.16 ± 1.48 c13.49 ± 0.98 b9.23 ± 0.51 a
F w/o Peel (N)24.11 ± 0.76 d14.64 ± 1.92 c4.03 ± 0.30 b1.53 ± 0.27 a
Weight loss (%)1.71 ± 0.25 a2.71 ± 0.18 b4.17 ± 0.18 c6.29 ± 0.31 d
pH3.29 ± 0.04 a3.42 ± 0.09 a4.64 ± 0.10 c5.37 ± 0.07 d
TSS7.93 ± 0.28 a8.61 ± 0.33 ab8.96 ± 0.23 b8.33 ± 0.20 ab
TA0.94 ± 0.05 d0.69 ± 0.08 c0.17 ± 0.02 b0.06 ± 0.01 a
TSS/TA9.38 ± 0.73 a15.94 ± 2.91 a110.64 ± 12.68 b169.83 ± 9.51 c
Phenolics (mg/L)367.09 ± 27.46 d300.56 ± 35.70 c180.81 ± 16.74 b71.59 ± 13.46 a
Flavonoids (mg/L)37.22 ± 2.40 b27.01 ± 1.77 a31.09 ± 2.03 ab54.35 ± 3.11 c
ttSugar (µg/L)7685.77 ± 494.03 a8151.23 ± 738.22 a12,963.8 ± 1156.53 b10,840.8 ± 993.27 ab
Reducing sugar (µg/L)3858.8 ± 142.16 b3800.81 ± 214.64 b3892.46 ± 160.39 b3249.79 ± 179.45 a
DPPH (%)82.57 ± 1.84 c77.13 ± 4.05 c57.47 ± 3.09 b29.22 ± 3.14 a
ABTS (%)82.03 ± 3.77 b92.14 ± 0.95 c88.07 ± 1.69 bc61.83 ± 3.28 a
EL (%)52.17 ± 0.81 bc49.58 ± 1.17 a51.06 ± 0.66 ab54.34 ± 0.64 c
L* = lightness, a* = red–green value, b* = blue–yellow value, F w/Peel = firmness with peel, F w/o Peel = firmness without peel, TSS = total soluble solids, TA = titratable acidity; values indicate mean ± standard error, and values with various superscript letters are significantly different in each row according to Duncan’s multiple range test (p < 0.05).
Table 3. Physical and biological markers of ‘Nam dok mai si thong’ mangoes (n = 127) at each degree of burning symptoms.
Degree of Burning Burning 1Burning 2Burning 3Burning 4
Number925228
L*76.93 ± 0.40 b77.71 ± 1.65 b76.54 ± 0.74 b72.74 ± 0.75 a
a* ns3.69 ± 0.253.93 ± 0.933.55 ± 0.395.20 ± 0.51
b* ns38.94 ± 0.6837.83 ± 3.0837.43 ± 1.1239.88 ± 0.80
F w/Peel (N)18.45 ± 1.06 b18.30 ± 4.83 b15.75 ± 1.96 ab8.85 ± 0.71 a
F w/o Peel (N) ns9.92 ± 1.048.98 ± 4.887.86 ± 1.961.17 ± 0.35
Weight loss (%)3.88 ± 0.24 a4.09 ± 1.05 a4.36 ± 0.44 a6.44 ± 0.52 b
pH4.38 ± 0.11 ab4.26 ± 0.45 a4.42 ± 0.18 ab5.22 ± 0.16 b
TSS ns8.54 ± 0.178.54 ± 0.288.53 ± 0.217.71 ± 0.29
TA ns0.40 ± 0.040.41 ± 0.190.30 ± 0.080.06 ± 0.01
TSS/TA ns91.71 ± 9.33117.19 ± 62.6694.96 ± 17.45137.94 ± 15.99
Phenolics (mg/L)212.56 ± 17.00 b205.29 ± 94.26 ab203.66 ± 33.01 ab62.64 ± 20.98 a
Flavonoids (mg/L) ns38.13 ± 1.8934.27 ± 4.2444.32 ± 4.4446.10 ± 6.60
ttSugar (µg/L) ns10,557.60 ± 633.109375.00 ± 1814.0511,229.50 ± 1724.549211.78 ± 1170.12
Reducing sugar (µg/L) ns3744.85 ± 102.343361.25 ± 364.313572.72 ± 262.203225.13 ± 418.73
DPPH (%)58.53 ± 2.76 b53.96 ± 17.15 b57.26 ± 6.13 b28.75 ± 5.54 a
ABTS (%) ns79.64 ± 2.0671.45 ± 13.8080.33 ± 4.4467.43 ± 7.17
EL ns51.97 ± 0.4854.08 ± 1.2852.62 ± 1.0652.67 ± 1.10
L* = lightness, a* = red–green value, b* = blue–yellow value, F w/Peel = firmness with peel, F w/o Peel = firmness without peel, TSS = total soluble solids, TA = titratable acidity; values indicate mean ± standard error, and values with various superscript letters are significantly different in each row according to Duncan’s multiple range test (p < 0.05). ns = non-significant.
Table 4. Physical and biological markers of ‘Nam dok mai si thong’ mangoes (n = 127) at each degree of disease infection.
Degree of InfectionInfectious 1Infectious 2Infectious 3Infectious 4Infectious 5
Number67311676
L*79.35 ± 0.34 c74.35 ± 0.25 b73.26 ± 0.57 b73.49 ± 0.48 b70.65 1 ± 0.09 a
a*2.28 ± 0.17 a4.87 ± 0.24 b5.39 ± 0.39 bc6.34 ± 0.68 cd7.34 ± 1.13 d
b*34.96 ± 0.66 a42.54 ± 0.78 b42.59 ± 0.58 b44.05 ± 1.44 b43.83 ± 1.53 b
F w/Peel (N)23.53 ± 1.06 c12.08 ± 1.33 b9.87 ± 0.45 ab10.15 ± 1.20 ab4.39 ± 1.05 a
F w/o Peel (N)15.08 ± 1.20 b2.54 ± 0.40 a2.21 ± 0.39 a1.93 ± 0.66 a0.36 ± 0.20 a
Weight loss (%)2.93 ± 0.23 a5.08 ± 0.34 b5.08 ± 0.42 b6.93 ± 0.86 c6.90 ± 0.85 c
pH3.73 ± 0.09 a5.12 ± 0.11 b6.17 ± 0.12 b5.36 ± 0.09 bc5.72 ± 0.17 c
TSS ns8.36 ± 0.188.49 ± 0.298.82 ± 0.258.50 ± 0.348.92 ± 0.79
TA0.62 ± 0.05 b0.09 ± 0.02 a0.09 ± 0.03 a0.06 ± 0.00 a0.05 ± 0.01 a
TSS/TA38.39 ± 6.81 a160.35 ± 14.74 b151.97 ± 14.09 b158.50 ± 12.37 b188.58 ± 36.29 b
Phenolics (mg/L)284.35 ± 19.79 b129.55 ± 20.34 a103.87 ± 21.69 a86.92 ± 27.79 a37.56 ± 8.97 a
Flavonoids (mg/L)33.18 ± 1.56 a42.53 ± 3.94 ab45.49 ± 5.18 ab52.34 ± 4.83 bc64.57 ± 7.83 c
ttSugar (µg/L) ns9136.86 ± 521.8513,557.20 ± 1765.0510,716.10 ± 878.4510,175.6 ± 1401.4610,632.00 ± 1988.85
Reducing sugar (µg/L)3869.01 ± 103.03 b3611.42 ± 228.35 b3530.59 ± 273.45 b3217.65 ± 384.73 ab2590.47 ± 347.22 a
DPPH (%)71.34 ± 2.57 c44.81 ± 4.69 b39.27 ± 5.47 b32.63 ± 7.43 ab19.66 ± 2.47 a
ABTS (%)85.68 ± 1.92 b73.78 ± 4.25 b74.21 ± 5.15 b69.71 ± 6.32 b48.01 ± 6.02 a
EL51.18 ± 0.58 a53.52 ± 0.67 ab52.45 ± 1.04 a52.08 ± 1.58 a56.42 ± 1.43 b
L* = lightness, a* = red–green value, b* = blue–yellow value, F w/Peel = firmness with peel, F w/o Peel = firmness without peel, TSS = total soluble solids, TA = titratable acidity; values indicate mean ± standard error, and values with various superscript letters are significantly different in each row according to Duncan’s multiple range test (p < 0.05). ns = non-significant.
Publisher’s Note: MDPI stays neutral with regard to jurisdictional claims in published maps and institutional affiliations.

