1. Introduction
Rice (
Oryza sativa L.) is the primary food consumed by more than half of the world’s population, and particularly in Indonesia. Around 98% of the Indonesian population consumes rice as a staple food [
1,
2,
3]. Upland rice is one of the potential food crops that can be developed in drylands, offering significant opportunities for food production. However, upland rice production is still relatively small [
4]. The increase in production can be achieved through the application of biofertilizers.
Biofertilizers or microbial inoculants are the most attractive of these alternatives because of their positive impact on plant growth as well as the environment [
5]. In recent years, the use of biological fertilizers to reduce the use of chemical fertilizers has become a public concern and is increasingly being applied. In general, biofertilizers do not provide nutrients to plants, but the microbes present in biological fertilizers can break down organic compounds in the soil into simple ionic forms that plants can absorb. These microbes also assist in converting the nutrients from unusable forms into forms that plants can effectively utilize for growth [
6]. The association between the plants and symbiotic microorganisms is involved in key functions at the ecosystem and plant levels, and the application of microbial plant biostimulants (MPBs) is a sustainable strategy to augment plant growth and productivity, even under abiotic stress conditions [
7,
8].
Plant growth-promoting rhizobacteria (PGPR) are a group of beneficial microorganisms that are often inoculated as biological fertilizers. This group of bacteria presents relevant properties to fix the essential plant nutrients such as nitrogen (N), thus are known as N-fixing PGPR [
9]. In addition to their ability in nutrient provision, PGPR also possess several functional traits, such as the following: inhibiting soil pathogens by producing HCN (hydrogen cyanide), siderophores, and antibiotics; improving plant tolerance to drought, salinity, metal toxicity, and P dissolution; and producing phytohormones [
10,
11]. The ability of nitrogen-fixing bacteria to produce phytohormones is considered essential because they influence root growth resulting in increased water and nutrient uptake. PGPR also help in mitigating abiotic pressures (salinity and drought), reducing the impact of heavy metals in the soil, and the biocontrol of plant pathogens [
9,
10]. Previous research on PGPR biofertilizers demonstrated no significant difference between the 100% NPP (nitrogen, phosphorus, and potassium) fertilizer dose and the 50% NPP dose when applied to upland rice cultivation [
12,
13]. Moreover, numerous studies have consistently shown that the inoculation of selected PGPR isolates has a significant positive impact on various rice growth parameters, including the sprout percentage, shoot growth, and chlorophyll content, when compared to the uninoculated control [
14]. However, to apply the PGPR isolates as biofertilizers effectively, compatible carrier materials are essential to facilitate their successful transfer from the laboratory to the field [
15,
16,
17]. Glycerol and molasses are liquid carriers that are commonly used as the carbon sources for microbes during incubation. These carriers play a crucial role in enhancing the survivability and efficiency of rhizobacterial inoculants in biofertilizer formulations [
18].
The purpose of the research was to evaluate the impact of different combinations of liquid biofertilizers and nitrogen fertilizer doses on improving the growth characteristics and yield components of upland rice.
2. Materials and Methods
The isolation of PGPR was performed using Okon’s selective media, which led to the identification of a total of nine isolates. Nine selected isolates were obtained from five different ecosystems on Lombok’s Island, West Nusa Tenggara, Indonesia. These ecosystems included the rainfed areas in Pujut, Central Lombok; the maize fields in Pringgabaya, East Lombok; the mixed crop in Sambelia, East Lombok; the forest within the Mount Rinjani National Park, Tetebatu, East Lombok; and the savanna regions in Sembalun, East Lombok, and the characteristics of each were described in our published article [
19]. Three capable isolates were selected based on their growth-promoting properties, results of biochemical tests, and their ability to enhance rice growth characteristics. The three capable isolates were further identified using molecular methods, specifically 16S rRNA sequencing, to determine their bacterial species. The identification process was conducted by GeneticaScience using Bioedit software version 7.0.5.3 [
20] and Molecular Evolutionary Genetics Analysis (MEGA) version X [
21].
A consortium of three capable isolates was inoculated into a liquid carrier, preparing it for subsequent application in Situ Bagendit upland rice cultivation through a pot experiment. The primary goal of this process is to optimize the growth characteristics and yield of upland rice while simultaneously increasing the efficiency of nitrogen fertilizer utilization.
2.1. Bioassay and Biochemical Test
2.1.1. Bioassay Test
Bioassays were conducted on nine isolates obtained from drylands. The bioassay for N-Fixing PGPR was performed by culturing the isolates on N-free Fahraeus’ medium [
13]. Upland rice seeds were sterilized with a 0.2% HgCl
2 solution for approximately 30 s, followed by rinsing with 70% alcohol for about 1–2 min and washing with distilled water three times before germination. Subsequently, the seeds were planted in 100 mL test tubes filled with a liquid suspension of PGPR inoculum and Fahraeus’ medium in a ratio of 1:9 by volume. Each treatment was placed in the greenhouse of the Biotechnology Laboratory at Padjadjaran University, where plant height and root length were observed on a weekly basis. Shoot dry weight and root dry weight were analyzed by harvesting the entire rice plant 28 days after planting. At 28 days after sowing, the above ground parts of seedlings were still exhibiting some growth, and both the seedling dry weight and dry weight per unit of seedling height had increased slightly [
22]. Samples were carefully placed in small envelopes and subjected to oven drying at a temperature of between 70 °C and 80 °C for 48 h, or until a constant weight was achieved. The dry weight of the shoots and roots was then calculated. The bioassay was conducted over a period of 28 days to evaluate the ability of rhizobacteria to enhance plant growth. The experiment followed a randomized complete block design (RCBD) with 10 treatments and 3 replications, resulting in 30 experimental units. The treatments consisted of the following different isolates: control or without isolate, RE-2, FiE-3, FiE-2, MCE-1, FE-1, FE-2, SE-2, SE-3, and SE-S1.
2.1.2. Biochemical Test
The ability of rhizobacteria to produce indole-3-acetic acid (IAA) was tested by inoculating the rhizobacterial isolates into tryptic soy broth (TSB) medium. The isolates were prepared as a 10 mL suspension with a cell density of 10
8 colony forming unit (CFU/mL
−1) and incubated for 24 h. Then, a 3 mL aliquot of the bacterial suspension was transferred into 30 mL of liquid TSB medium supplemented with tryptophan (1 mg.mL
−1) and incubated at 28 °C on a shaker for six days [
14]. To determine the concentration of IAA, 5 mL of the supernatant with 2 mL of Salkowski reagent (1 mL 0.5 mM FeCl
3 and 50 mL 35% HClO
4) [
23,
24]. The absorbance was then measured at a wavelength of 535 nm using a spectrophotometer. IAA concentrations were determined with an IAA standard curve and sterile medium as a blank.
High-performance liquid chromatography (HPLC) (Alliance
® HPLC—e2695 Separations Module by Waters), the company is headquartered in Milford, MA, USA, was used for the testing of organic acid production. The PGPR isolates were cultured in Okon’s medium for 3 days. Standard organic acids with a concentration of 100 ppm were weighed at 0.1 g each. The mobile phase consisted of KH
2PO
4 with a concentration of 6.8 g and pH of 2.8. The PGPR isolates samples were filtered through a 0.45 µm syringe filter into 1.5 mL vial bottles. The samples were then injected into a reverse-phase HPLC column (Grace-smart RP 18.5 µm) and read at λ = 210 nm. The flow rate of the mobile phase was set at 0.7 mL/min with an injection time of 10 min [
25].
The testing of nitrogenase activity of isolates was carried out qualitatively using the most probable number (MPN) method [
26], which involved culturing the bacteria on semi-solid selective NFb medium. The procedure began with preparing an isolated suspension, which was then inoculated into test tubes containing 5 mL of nitrogen fixation bacteria (NFb) medium. To serve as an indicator, bromothymol blue was added to the medium. The test tubes were then incubated at room temperature for 24 h, and the observed changes included the formation of a white pellicle and blue color in the medium.
2.2. Selection of Capable Isolates
The three capable isolates were selected using a scoring method, where nine isolates were ranked based on their performance in enhancing rice growth characteristics, IAA phytohormone test, qualitative test of nitrogenase activity, and organic acid production test. The isolates were ranked from highest to lowest, and the three isolates with the highest scores were chosen as the capable isolates.
2.3. Biomolecular Test
Biomolecular tests were conducted on the three capable isolates to determine their species. The identification of PGPR isolates was performed through 16S rRNA gene sequencing using the oligonucleotide primers 27F (5’-AGAGTTTTGATCCTGGCTCAG-3’), 785F (5’-GGATTAGATACCCTGGTA-3’), and 1492R (5’-GGTTACCTTGTTACGACTT-3’) (1st base). The sequence data were aligned with a system software aligner and analyzed to identify the bacterium and its closest neighbors using the basic local alignment search tool (BLAST) and then adjusted to the National Center for Biological Information (NCBI) database. The partial 16 S rRNA gene sequences were deposited in the GenBank database. Phylogenetic and molecular evolutionary analysis of the 16 S rDNA sequences were conducted using MEGA4 software [
21], and aligned using CLUSTAL-X [
27]. The pairwise evolutionary distance matrix was generated and the evolutionary tree was inferred using the neighbor-joining method. The bootstrap test was performed to cluster together the associated taxa. The evolutionary distances were compared using the maximum composite likelihood method.
2.4. Application of Liquid Inoculant in Upland Rice Cultivation
2.4.1. Biofertilizer Formulation
The formulation of the PGPR (plant growth-promoting rhizobacteria) biofertilizer inoculant involves using a liquid carrier [
28] which comprises the following components: 3% glycerol, 3% molasses, 1% potassium sorbate, 1% Tween-20, and enriched with 1% nutrients. The PGPR inoculant with a population density of 10
8 CFU.mL
−1 is rejuvenated in Okon’s liquid medium for 48 h. All carriers and nutrients were mixed and then sterilized using an autoclave at a temperature of 121 ℃ and 15 Psi. The bacterial cell suspension is added to the carrier in 1:9 ratio by injection and stored at room temperature, followed by an incubation period of 4 months.
2.4.2. Field Pot Experiment
The research was conducted at the Faculty of Agriculture, Padjadjaran University from July to November 2022. The pot experiment was conducted to evaluate the application of liquid biofertilizer using Jatinangor Inceptisol soil (
Table 1) at a depth of 0–30 cm, which has been dried, pulverized, and composited. The experiment was arranged as a factorial randomized block design with three replications. The liquid biofertilizers (LB) consisted of 4 levels, namely, control, seed treatment (ST) = 400 mL of LB kg
−1, soil application (SA) = 10 L of LB ha
−1, and ST + SA = 400 mL of LB + 10 L of LB ha
−1), while the N fertilizers consisted of 4 levels (0, 50, 100 and 150 kg N ha
−1).
A total of 10 kg of planting media passed through a 5 mm sieve from the top layer (0–20 cm) of Inceptisols was placed into polybags measuring 45 × 45 cm. Around 5 cm from the bottom, holes with a diameter of 3 mm were made to prevent waterlogging during rainfall. One day before planting the Situ Bagendit rice seeds, water was added to the planting media until it reached 80% of field capacity by adding 250 mL of water per kg of soil media. Seed treatment was carried out by soaking 1 kg of seeds in 1 L of LB solution for 1 h. Afterward, 3–4 seeds were placed into each hole (3–5 cm) and covered with soil. The soil application treatment was performed by dissolving 10 L of LB solution with a concentration of 5 cc per liter of water. Then, 5 mL of this solution was irrigated into each planting hole containing 3–4 rice seeds per planting hole. Nitrogen (N) fertilizer was applied three times (one third of the dose each time) on days 14, 28, and 42 after planting. The basal fertilizer used phosphorus (P) with a dose of 46 kg P2O5 per hectare (applied once at the beginning of planting), and potassium (K) with a dose of 60 kg K2O per hectare was applied twice on days 14 and 42 days after planting by providing it in a band around the plants. Subsequently, the polybag plants were placed in an open field with a planting distance of 30 × 25 cm. Daily checks and water additions were done to maintain the soil moisture at field capacity (moist soil). In addition, routine maintenance was performed to manually remove weeds and control pests and diseases. Furthermore, nets were installed to prevent bird attacks. Harvesting was carried out after the rice ripened, indicated by 80% of the leaves turning yellow. Plant maintenance included daily watering, manual weed removal, and manual pest and disease control. Harvesting was conducted when more than 80% of the grains were matured, as indicated by yellowing rice leaves.
2.5. Parameters and Data Analysis
The growth characteristics analyzed in this study include the population of nitrogen-fixing bacteria, N uptake, total N in soil, plant height, root length, number of tillers, number of panicles per clump, 1000-grain weight, and grain yield. The relative agronomic effectiveness (RAE) is calculated according to the following formula:
The observation data were analyzed using a factorial simple randomized block design (RBD) at a significance level of 5% to determine the differences among the tested treatments [
29]. Subsequently, the relationship model between the yield of upland rice and the observed variables was examined. The growth data, soil chemical and biological properties, and yield were subjected to Pearson’s correlation analysis to determine the presence or absence of relationships among the variables. Variables that showed significant correlations were further analyzed using multiple linear regression analysis to identify the variables that had the most significant impact on the yield components of upland rice. IBM SPSS Statistics 26 was the software employed for performing statistical data analysis, and the results of the regression analysis served as a reference for conducting path analysis, which was performed using IBM SPSS AMOS version 26.
3. Results
3.1. Bioassay and Biochemical Test
3.1.1. Bioassay (Biological Assay)
The observations of the shoot height and root length showed different responses to the addition of N-fixing PGPR isolates. The plant height was significantly affected by the addition of these isolates, but there was no significant effect on the root length (
Table 2). The analysis of variance in
Table 2 indicates that the isolates RE-2, FE-3, and FE-2 had different shoot heights compared to the control. Isolate RE-2 exhibited a significantly higher shoot height, showing a 209% increase compared to the control. This considerable increase in the rice shoot growth is believed to be attributed to the influence of phytohormone produced by the N-fixing bacterial isolate. Plant growth can be enhanced through the synthesis of compounds that aid in nutrient uptake from the environment, one of which is indole-3- acetic acid (IAA).
The change in the root length did not exhibit significant differences among all treatments, but it did show variations in root morphology, which could have a greater impact on root dry weight. The addition of the PGPR isolates had a significant effect on the shoot dry weight and root dry weight of the rice. The analysis of variance revealed that the isolates RE-2 and FiE-3 did not significantly differ in the shoot dry weight, but they both significantly differed from the other treatments, displaying the most optimum shoot dry weight. This result can be attributed to the fact that these two isolates also promoted good shoot height. The root dry weight of all the treatments differed significantly from the control, except for the isolates FE-2 and FiE-2. The root dry weight showed better and significant results in the isolate inoculation treatments compared with the control. High levels of the IAA hormone can regulate numerous physiological processes, including cell enlargement, and can stimulate the development of lateral roots and root hairs, thus increasing plant dry weight [
30].
3.1.2. Biochemical
The experimental results revealed that all nine isolates demonstrated the ability to produce the phytohormone indole-3-acetic acid (IAA), as presented in
Table 3. The biosynthesis of IAA in bacteria involves tryptophan, which serves as the primary precursor compound in various metabolic pathways. Tryptophan is commonly recognized as a crucial component in IAA formation, as the addition of tryptophan to bacterial cultures stimulates enhanced IAA synthesis. The production of IAA by Gram-negative bacteria with tryptophan follows the following pathways: (1) the indole-3-acetamide (IAM) pathway, (2) the indole-3-pyruvic acid (IPyA) pathway, (3) the tryptophan chain oxidation pathway, (4) the tryptamine-TAM pathway, and (5) the indole-3-acetonitrile pathway [
31].
The results of the organic acid production assay on the nine PGPR isolates revealed that all the isolates demonstrated the capability to produce various types and quantities of organic acids. According to the analysis presented in
Table 3, it was observed that isolate FiE-3 exhibited the highest diversity of organic acid production among all the PGPR isolates tested. This isolate was capable of synthesizing multiple organic acids, including citrate, acetate, oxalate, lactate, and ascorbate. On the other hand, the isolates FE-2, SE-1, and SE-2 showed a more limited capacity for organic acid production, with each of them only capable of producing a single organic acid, which in this case was malic acid. The ability of the microbes to produce organic acids is also worth evaluating because organic acids function to dissolve minerals in the soil, making them available to plants. Plant growth-promoting rhizobacteria can directly or indirectly contribute to the plant growth. This bacterial strain produces cytokinins, auxin, and ACC-deaminase, while also releasing organic acids. The release of these organic acids plays a crucial role in facilitating the plant nutrient uptake. Organic acids such as malonate, oxalate, glycolate, acetate, and formic acid contribute to the acquisition of essential elements such as phosphorus, calcium, iron, zinc, and manganese in soils with limited nutrient availability [
32].
Another functional characteristic that was tested was the ability of the isolates to produce the nitrogenase enzyme in nitrogen-free semi-solid media, specifically NFb medium. The capacity of the bacteria to fix nitrogen can be observed by the formation of a white pellicle on the media and changes in the color of the NFb medium (
Figure 1).
The formation of the white rings is caused by the absence of oxygen in the media, while the color change in the NFb medium occurs due to the bromothymol blue indicator shifting to blue at higher pH levels, indicating the nitrogenase activity [
33]. Moreover, the most probable number (MPN) method was employed to estimate the population of nitrogen-fixing microorganisms. The results of the population estimation for nitrogen-fixing microorganisms are presented in
Table 4.
3.2. The Selection of Capable Isolates
The identification of the promising isolates was carried out through a scoring system based on the results of the bioassay, IAA production test, organic acid test, and qualitative nitrogenase activity test. The isolates were ranked according to their scores, with the highest-scoring isolate being ranked first, followed by the second and third ranks.
Table 5 presents the ranking results, revealing that isolate RE-2 achieved the highest score and obtained the first rank, followed by isolate MCE-1 in the second rank, and isolate FE-3 in the third rank. Notably, isolate RE-2 was originally isolated from a rainfed field ecosystem with upland rice vegetation, while isolate MCE-1 was obtained from a mixed crop ecosystem with cashew vegetation, and isolate FE-3 originated from a field ecosystem with maize vegetation. These three top-ranked isolates are considered capable isolates. Subsequently, the molecular testing was conducted to determine the species names of these isolates, and they were further utilized in the subsequent experiment on the upland rice.
3.3. Biomolecular Test Results
The species lineage of the three isolates is depicted in their respective phylogenetic trees shown in
Figure 2. A phylogenetic tree is a diagram that visualizes the evolutionary relationships and origins of microorganisms, leading to the formation of species with a similarity above 99% [
34]. According to the phylogenetic tree analysis, isolate RE-2 was found to be derived from
Bacillus pumilus strain PLK3, undergoing gradual evolution while retaining certain similarities until it eventually forms the final species,
Bacillus sp. On the other hand, the isolates MCE-1 and FiE-3 trace their origins back to different strains of Bacterium and subsequently evolve into their respective final species
Delftia tsuruhatensis (
Figure 2).
A phylogenetic tree is a diagram that describes the origin and evolution of microbes. Bacteria belonging to the genus Delftia have been extensively isolated from various environments including seawater, soil, and plants. These bacteria have been extensively studied for their capacity to degrade specific organic pollutants, including chloroanilines and heavy metals like chromium. Recent research has revealed that this bacterial genus is also classified as a plant growth-promoting bacteria. Their role as plant growth promoters contributes to enhanced plant growth by facilitating nutrient availability to the host plants, reducing nitrogen, producing organic acids, and providing protection against pathogenic infections [
35]. On the other hand,
Bacillus sp. bacteria belong to a group of rhizobacteria that function as plant growth promoters through nitrogen fixation, without forming symbiotic relationships with plants. These bacteria possess various functional characteristics that highlight their ability as biological agents for promoting plant growth.
Molecular identification of the three capable isolates was performed by data analysis using BioEdit software version 7.0.5.3, which generated the lengths of the 16S rRNA gene sequences for isolate FiE-3 as 614 bp, isolate MCE-1 as 822 bp, and isolate RE-2 as 1388 bp). The molecular results for the three isolates are presented in
Table 6 and
Figure 3.
3.4. Total Nitrogen and Nitrogen Uptake
According to Duncan’s multiple range test, treatment c
3n
2 (seed-soil application 10 L ha
−1 + 100 kg ha
−1 N dosage) exhibited the highest total nitrogen content at 0.31% (
Table 7). This represented an increased soil nitrogen total compared to the initial value of 0.14%. This treatment also increases the soil nitrogen content by up to a 21.05% rise in total nitrogen compared to the treatment without liquid biofertilizer at the same nitrogen dosage. These findings suggest that the application of a liquid biofertilizer contributes to the enhanced nitrogen availability in the soil.
This observation aligns with the study conducted by [
30] which demonstrated that the addition of biofertilizer to chemical fertilizers significantly increased the total nitrogen content compared to the treatments without biofertilizer. Additionally, the total nitrogen content in the treatment using 100% of the recommended chemical fertilizer dosage was comparable to that of the soil in the treatment employing 50% of the nitrogen dosage along with biofertilizer supplementation [
36].
The analysis of variance revealed a significant influence of the combined treatment of liquid biofertilizer and nitrogen dosage on the nitrogen uptake of plants. The uptake of nitrogen by plants is influenced by their nitrogen requirements and the availability of nitrogen in the soil. When nitrogen is abundantly available, its concentration in plant tissues is high (approximately 4.5%) and gradually decreases as the plants mature.
The combination of the liquid biofertilizer treatment and nitrogen dosage has been proven to effectively meet the nitrogen nutrient requirements of rice plants. According to [
35] the nitrogen content in rice plants is considered adequate within the range of 2.6–3.20%. Other studies suggest that the critical nitrogen level for many plants is below 3% [
37]. The research findings indicate that all treatments resulted in high nitrogen uptake by the rice plants, with the c
1n
2 (seed treatment 400 mL kg
−1 seed + 100 kg ha
−1 nitrogen dosage) treatment exhibiting the highest percentage of nitrogen uptake at 4.50% (
Table 7). This can be attributed to the fact that the microbial-based fertilizers offer optimal nitrogen availability during the vegetative growth stage [
35].
This result can be interpreted as the application of the biofertilizer stimulating an increase in the number of microbes, which consequently enhances the nitrogen content in the soil available for plant absorption. Another opinion supports this idea by suggesting that the nitrogen content in the soil is closely related to the number of microbial populations in the soil so that it helps plants absorb N [
25].
3.5. Nitrogen-Fixing Bacteria (NFB) Population
The combination of the liquid biofertilizer treatment and nitrogen dosage significantly affected and interacted with the response of the tested nitrogen-fixing bacteria (NFB) population. In general, the use of a liquid biofertilizer increased the population of the NFB in the research soil.
The initial soil had an NFB population of 10
5 CFU g
−1, which increased in all treatments to 1 × 10
8 CFU g
−1, except for the control. The population of the NFB increased with the application of the liquid biofertilizer, whether through seed treatment, soil application, or seed-soil application, with a 150 kg ha
−1 N dosage. Treatment c
3n
3 (seed-soil application 10 L ha
−1 + 150 kg ha
−1 N dosage) was the best treatment in maintaining the NFB population, with a population of 8.20 × 10
8 CFU g
−1 (
Table 8). The NFB population increased with the increase in liquid biofertilizer, both with the application of the seed treatment, soil application and seed-soil application of 10 L ha
−1 with 150 kg ha
−1 N dosage. The large population of the NFB in this treatment made it possible to provide the liquid biofertilizer with two applications at once, namely, in the seeds and leaking it into the soil with sufficient doses of nitrogen as a source of nutrition for the microbes and plants.
3.6. Liquid Biofertilizer Inoculant Application on Upland Rice
The combination of the liquid biofertilizer treatment with the nitrogen (N) dosage did not exhibit a significant interaction in terms of the plant height response (
Table 9). This could be attributed to the fact that the plant height of the rice is primarily influenced by the genetic factors inherent to each variety. In this study, the same variety, Situ Bagendit, was used in addition to the environmental factors.
The plant height in the control treatment was the lowest, suggesting a limited availability of nutrients for promoting the plant growth. The presence of the nitrogen-fixing PGPR (plant growth-promoting rhizobacteria) in the biofertilizer and their production of IAA can stimulate root development, ultimately leading to an increased plant height. Plant growth-promoting rhizobacteria play a main role in enhancing the rice growth by producing phytohormones, particularly IAA, which positively influence the biomass, root branching, and nitrogen content of plants. Additionally, the application of different nitrogen doses contributes to the availability of nitrogen for plant uptake and utilization [
38,
39].
The application of the liquid biofertilizer at different levels of nitrogen dosage significantly interacted and resulted in a significant difference in the number of tillers. Treatment c
2n
1 (soil application 10 L ha
−1 + 50 kg ha
−1 N) produced an average of 32.67 tillers. This treatment showed an increase in the number of tillers by 66% compared to the control treatment. These findings are consistent with the study conducted by [
40], which showed that the 100% N fertilizer treatment resulted in the same number of tillers as the biofertilizer treatment with 75% N dosage. The application of a liquid biofertilizer effectively provides nitrogen nutrients for rice. The availability of nitrogen in the rhizosphere determines plant growth. The plant height and the number of tillers are morphological characteristics of rice that impact the rice yield components. Plants require high levels of nitrogen during the vegetative phase. The presence of a biofertilizer in the soil is highly effective in improving the nutrient availability for plants.
The subsequent analysis demonstrated a significant effect of the liquid biofertilizer application and nitrogen dosage on increasing the length of the rice roots. Treatment c
3n
2 (seed-soil application of 10 L ha
−1 + 100 kg h
−1 nitrogen dosage) resulted in an average root length of 36.10 cm. This treatment exhibited a 32.86% increase in the root length compared with the control treatment. This enhancement is attributed to the presence of the PGPR microbes in the liquid biofertilizer. When applied through a combination of seed soaking and direct soil application, these microbes stimulate the production of the growth hormone IAA, leading to improved root length. Root colonization by bacteria plays an important role in plant growth and protects plants from pathogens in the soil. IAA-producing bacteria inoculation can optimize the lateral and adventitious roots, root hair formation, and main root elongation [
37].
3.7. Yield Components
The combination of the liquid biofertilizer treatment with the nitrogen dose resulted in a significant interaction that influenced the number of panicles. Further tests with Duncan’s multiple range test with a significance level of 5% showed that the c
2n
1 treatment (soil application 10 L ha
−1 + 50 kg ha
−1 N dosage) had a panicle number of 29 stems (
Table 10) and this number is equal to the c
2n
3 treatment (soil application 10 L ha
−1 + 150 kg ha
−1 N dosage).
These results concluded that the application of the liquid biofertilizer could reduce the dosage of inorganic fertilizer with the same results as higher nitrogen doses. Besides being able to reduce the dose of nitrogen, the liquid biofertilizer administration was also able to increase the number of panicles by 163.63% compared to the control treatment. The number of grains represents the quantity of grains produced within a single hill per plant pot. The application of a liquid biofertilizer with a nitrogen dosage resulted in a significant interaction on the number of grains per hill. Further analysis using Duncan’s multiple range test at a 5% significance level showed that treatment c2n1 (soil application 10 L ha−1 + 50 kg ha−1 N dosage) had a similar number of grains compared to treatment c2n3 (soil application 10 L ha−1 + 150 kg ha−1 N dosage), which was 1030 grains.
The application of the liquid biofertilizer significantly increased the number of grains per hill by enhancing the yield by 115.93% compared to the treatment without liquid biofertilizer at the same nitrogen fertilizer dosage. This is possible due to the role of microorganisms present in the biofertilizer, which can fix N
2 from the air and convert it into a form available for plants to fulfill their nutritional requirements. The optimal nutrient uptake can enhance flower formation and subsequently the grain production, thus increasing the percentage of grains per hill. The number of grains per hill is closely related to grain yield (
Table 10). Observations of the number of grains indicate that the application of the biofertilizer can increase the number of grains per hill in the rice plants. All treatments with the addition of the biofertilizer resulted in a higher number of grains per hill compared to the control. This finding is also supported by the study conducted by [
41] which showed that the use of biofertilizer increased the average number of grains by 46.39% compared to the chemical fertilizer treatment. The application of biofertilizer, which can fix nitrogen from the air, also needs to be supplemented with available inorganic N and biologically available P. Therefore, the use of biofertilizer can enhance the growth of rice and yield components [
42].
The application of a liquid biofertilizer combined with nitrogen dosage levels showed significant interactions and results on the weight of 1000 grains. The analysis using Duncan’s multiple range test at a 5% significance level showed that treatment c
2n
1 (soil application 10 L ha
−1 + 50 kg ha
−1 nitrogen dosage) had a weight of 1000 grains which did not differ from treatment c
2n
3 (soil application 10 kg ha
−1 + 150 kg ha
−1 N dosage), which was 27.87 g (
Table 10). The weight of 1000 grains obtained in this study corresponds to that of the Situ Bagendit variety, which has a weight of 27.5 g for 1000 grains. The increase in the yield components is also evident as an effect of the biofertilizer treatment. The increase in the yield components occurred in terms of the number of grains per hill and the weight of 1000 grains.
Further test results showed that the addition of the liquid biofertilizer tended to increase the grain yield when compared to the control treatment. The best effect of adding liquid biofertilizer resulted from the liquid biofertilizer c2n3 treatment (soil application 10 L ha−1 + 150 kg ha−1 N dosage) of 30.01 g pot−1, but this result was not different from the n2c1 treatment (soil application 10 L ha−1 + 50 kg ha−1 N dosage) which is capable of producing 29.81 g pot−1 grain yield which is equal to 3.98 ton ha−1. These results indicate that the addition of the liquid biofertilizer was able to reduce the nitrogen dose and increase the grain yield by 102% compared to the treatment without liquid biofertilizer with the same nitrogen dose. This is presumably because the activity of the nitrogen fixing bacteria (NFB) in the liquid biofertilizer has the effect of increasing the nutrient uptake and nutrient availability in the soil so that the yield component increases when the nitrogen fertilizers are applied together with biofertilizer.
3.8. Relative Agronomic Effectiveness (RAE)
The effectiveness of the biological fertilizers in increasing the agronomic value of plants can be seen from the relative agronomic effectiveness (RAE) value, specifically if the RAE value is above 95%. It is calculated by dividing the difference between the yield of the tested fertilizer and the control fertilizer by the difference between the yield of the standard fertilizer and the control fertilizer, then multiplying the result by 100%.
Based on the calculation, the RAE value for the treatment of biofertilizer soil application at a rate of 10 L ha
−1 + 50 kg ha
−1 N dosage was found at 238.08% (
Table 11). This RAE value demonstrates that the application of the biofertilizer has a significant positive impact on enhancing the agronomy of the upland rice in this study because the RAE value is above 95%. The effectiveness of a particular biological fertilizer is determined by the microbial density of the biofertilizer, which contributes to the increased grain yield of the crop and subsequently leads to a higher RAE value [
43].
3.9. Model of Relations between Variables on Grain Yield for Upland Rice
The correlation is technical analysis of measuring the associations or the strength of the relationship between more than one variable. The strength of the relationship is measured between values of −1 to +1. A correlation analysis is carried out if the classical conditions are met, namely if the results of the treatment are interacting significantly. The treatment of the liquid biological fertilizers and nitrogen doses interacted and significantly resulted in a correlation with the following variables: the number of tillers, population of N-fixing bacteria, N uptake, total N content of the soil, number of panicles, number of grains, weight of 1000 grains, and grain yield. The correlation coefficient is positive, meaning that an increase in one character will be followed by an increase in another character.
Conversely, a negative correlation coefficient means that an increase in one character will decrease the other character. The level of correlation is divided based on the beta value with the categories: β < 0.2 meaning a low correlation, β between 0.2 and 0.5 has a moderate correlation, and β > 0.5 has a high correlation [
44]. The correlation analysis revealed that the variables of the N uptake, population of N-fixing bacteria, number of panicles, weight of 1000 grains, and number of grains per clump exhibited a positive correlation with the grain yield (
Table 12). This suggests that an increase in these variables is associated with an increase in the grain yield. The subsequent analysis involved a multiple linear regression to assess the strength of the relationship between one or more independent variables and the dependent variable (the grain yield).
The results of the multiple linear regression analysis demonstrate the significant contributions of each independent variable, all of which exhibit a positive correlation. The effective contributions of these variables to grain yield (
Table 12) in descending order from largest to smallest are as follows: the number of grains (87.27%), weight of 1000 grains (5.89%), number of panicles (1.85%), N-fixing bacteria population (1.2%), and N uptake (1.16%).
The number of panicles represents the quantity of fruits or seeds produced in each clump. A higher number of panicles indicates a greater potential for increased grain weight due to a higher yield. The positive correlation between the density of the N-fixing bacteria (NFB) and the N uptake with the grain weight can be attributed to the role of the N-fixing bacteria population in enhancing the soil fertility and increasing the availability of nitrogen, which is subsequently absorbed by plants [
45]. The uptake of nitrogen has a direct impact on the rice grain development, as an increase in the N uptake leads to an increase in the grain yield [
46].
The results of the correlation coefficient and determination tests are presented in
Table 13. They reveal that the correlation coefficient (R) has a value of 98.70%. This value indicates a strong linear relationship between the number of grains, weight of 1000 grains, number of panicles, N uptake, and the population of N-fixing bacteria to the grain yield. Additionally, the coefficient of determination (R
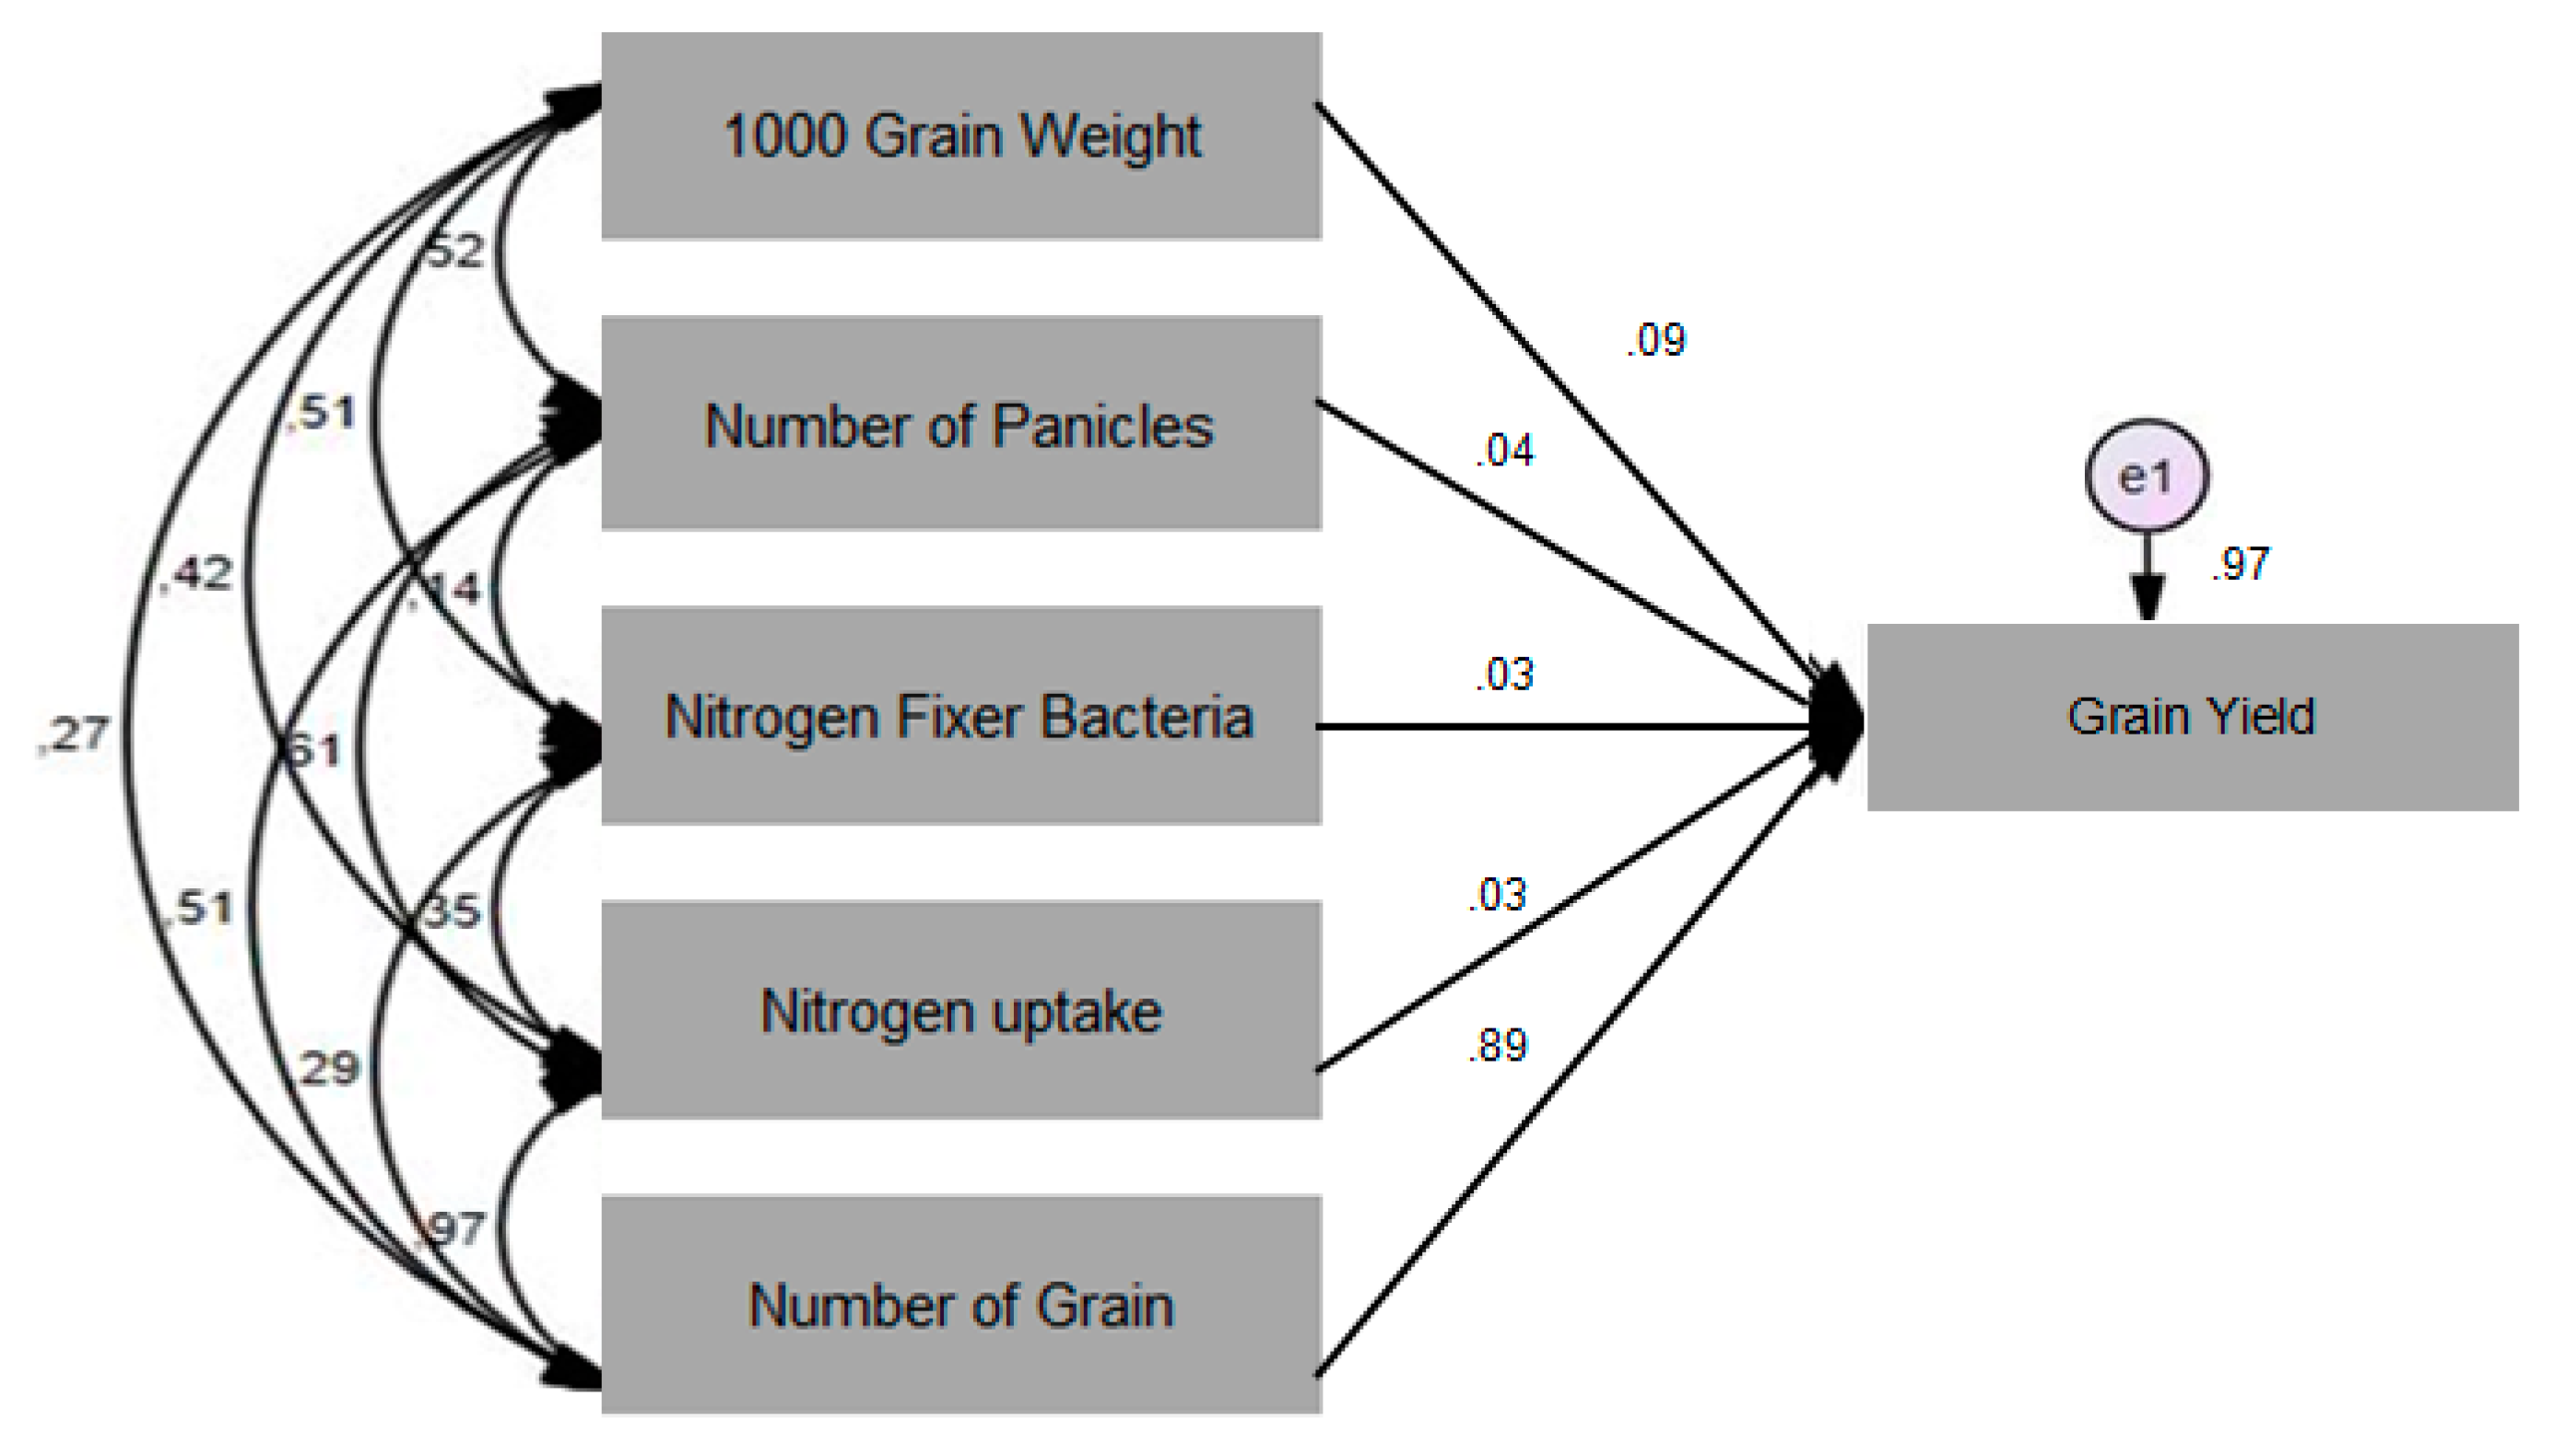
2) is 0.974, explaining that 97.40% of the variation in the upland grain yield can be attributed to the linear relationship with the number of grains, 1000 grain weight, number of panicles, N uptake, and population of N-fixing bacteria. The remaining 2.60% is influenced by other factors not analyzed in this study. Further analysis to better understand the results of the correlation and regression coefficients was carried out by path analysis. This analysis is helpful to assist in knowing which variables have a more direct effect on the dependent variable. Therefore, the path analysis was carried out to determine the direct effect of the N uptake, NFB population, grain per panicle, 1000 grain weight, and amount of grain on grain yields (
Figure 4).
The results of the path analysis showed the direct effect of the N uptake, NFB population, 1000-grain weight, number of panicles and number of grains on the grain yields (
Figure 4). The practical contribution of the independent variable to the dependent variable was obtained by multiplying the value of the beta coefficient by the zero-order value. The practical contribution of the N uptake and NFB population was 2%, the 1000-grain weight was 6%, the number of panicles was 2%, and the number of grains was 88%. The results above showed that there was an influence of the N uptake, NFB population, 1000-grain weight, number of panicles and number of grains on the grain yields.
4. Discussion
Biofertilizers play a crucial role in enhancing bacterial populations by providing essential nutrients for soil microorganisms. These microbes require nutrients such as carbon, nitrogen, organic ions, and water to thrive. Combining the biofertilizers with inorganic fertilizers creates an appropriate composition that fulfills the nutritional needs of microorganisms [
47,
48,
49]. The provision of a combination of a biofertilizer and inorganic fertilizers is the right composition to meet microbial nutrition. Increasing the number of nonsymbiotic nitrogen-fixing bacteria in the soil is expected to supply more nitrogen for plants. A higher population of N-fixing bacteria indicates elevated biochemical activity and an improved soil quality. Consistent with other findings, research has reported that biofertilizer treatments have a positive impact on the population of microorganisms in the rhizosphere, leading to an increase in the population of N-fixing bacteria [
50,
51].
Bacteria used as biofertilizers, such as inoculant
Bacillus, can significantly enhance the soil nitrogen levels without direct interaction with other organisms [
52]. The introduction of nitrogen-fixing bacteria into the growing media increases the likelihood of nitrogen availability due to their role in aiding nutrient provision through nitrogen fixation from the air. The rate of nitrogen fixation is influenced by various factors, including the soil temperature, the ability of the host plant to create a low-oxygen environment in the rhizosphere, the availability of photosynthate from the host plant to the bacteria, bacterial competitiveness, and nitrogenase efficiency [
53].
Additionally, bacterial inoculation leads to an increase in the agronomic characteristics, particularly influencing the root morphology, as bacteria have the ability to affect the production of endogenous indole-3-acetic acid (IAA) by regulating auxin responsiveness [
54]. Bacteria play a pivotal role in promoting the plant root growth by signaling the formation of hormones. When bacteria are present in biofertilizers and inoculated on plants, they attach to the epidermal cells on the root surface. This attachment leads to basal root colonization and subsequently extends to the root hairs, allowing the bacteria to synthesize IAA, which in turn colonizes the plant roots. The colonization of the basal roots plays a crucial role in the formation of lateral roots [
55].
Good agronomic characteristics of rice will undoubtedly increase the yield components. This is evidenced by a high number of tillers, which will also result in a large number of panicles. Not all tillers in rice are able to produce panicles, but it is hoped that with many tillers the number of panicles will also be large. In line with this opinion, the c
2n
1 (soil application 10 L ha
−1 + 50 kg ha
−1) treatment produced the highest number of tillers and could also produce the highest number of panicles. The results are the same as the research by [
56] with the addition of biological fertilizers using
Bacillus pumilus isolates which were also able to increase the number of panicles and milled dry grain compared to the treatment without biological fertilizers. Nitrogen plays an important role as a protein constituent which will then be used by plants to increase the number of panicles per clump [
57]. The results of another study state that when plants begin to flower, most of the photosynthetic results are distributed to the generative parts of the plant (panicles) in the form of flour [
58]. Furthermore, there is the mobilization of carbohydrates, proteins, and minerals in the leaves, stems, and roots that contribute to the formation of panicles and ultimately, this will affect the weight of 1000 grains and grain yield.
Observations on the weight of 1000 grains indicate that the application of the biofertilizer significantly influences the increase in the weight of 1000 grains in rice. Different doses of the biofertilizer showed significant improvements in the weight of 1000 grains compared to the control. The increase in the weight of 1000 grains in the rice can be attributed to the beneficial effects of the biofertilizer, which enhances the root’s ability to absorb nutrients and ultimately improves the harvest yield. This enhancement is due to the increased development of the root system, which plays a crucial role in nutrient absorption and transfer to the reproductive part of the plant canopy, thereby positively affecting the yield parameters [
35]. Consistent with similar studies, the findings demonstrate that the addition of the biofertilizer, along with a reduction of recommended inorganic fertilizer dosage by up to 50%, can lead to a significant increase in the weight of 1000 grains by up to 11.12% [
12]. Moreover, the application of nitrogen-fixing biofertilizer has shown the ability to increase the weight of 1000 grains by 7% compared to the control [
52]. These results highlight the potential of biofertilizers in enhancing the rice grain weight, contributing to improved crop productivity and sustainability in agriculture.
The yield of the rice plants is representative of the vegetative growth as indicated by the weight of the plant biomass, and both the roots and stems. The presence of
Bacillus sp. as a biological agent in the vegetative growth phase is thought to help optimize rice yields. In this study, the combination of soil application of 10 L ha
−1 of biofertilizer and 50 kg.ha
−1 of N dose resulted in a grain yield of 29.81 g.pot
−1. This yield was not significantly different from the treatment of soil application of 10 L ha
−1 with 100 kg.ha of N dose. This indicates that the use of biofertilizers can reduce the use of inorganic fertilizers. In line with other research [
55], the results showed that the PGPR biological fertilizer with 50% of the recommended dosage of inorganic fertilizer was able to produce a rice growth that was balanced with yields at 100% of the recommended fertilizer treatment. The nutritional content, harvested dry weight, and grain yield are parameters that have the same value as the yield of 100% of the recommended dose of inorganic fertilizer. This effect proves the consistency of the combined application of biofertilizer and reduced doses of inorganic fertilizers toward increasing the rice production.
5. Conclusions
Three capable isolates were identified from dryland in Lombok Island as being N-fixing PGPR (plant growth-promoting rhizobacteria), namely Delftia tsuruhatensis strain D9 from the field ecosystem, Delftia sp. strain MS2As2 from the rainfed areas, and Bacillus sp. from the mixed crops. The application of the liquid biofertilizer through soil application at a rate of 10 L ha−1 + 50 kg ha−1 N resulted in the same grain yield as the treatment with a nitrogen dosage of 150 kg ha−1, which amounted to 29.81 g pot−1 (3.98 ton ha−1). This indicates a significant increase in the grain yield of 95%, with a relative agronomic efficiency (RAE) value of up to 235.08%. The increase in the grain yield is positively correlated with the number of grains per plant, the number of panicles, the weight of 1000 grains, the population of N-fixing bacteria and the N uptake. The combined factors contribute to an R-squared (R2) value of 97.40%. The effective contributions to the increase in the grain yield are determined to be 87.72% from the number of grains, 5.89% from the weight of 1000 grains, 1.85% from number of panicles, 1.2% from the population of N-fixing bacteria, and 1.16% from N uptake.


 ,
, 


