1. Introduction
In recent years, hydroponic systems have emerged as a potential pioneering method of cultivating plants in a controlled environment, offering increased water efficiency [
1], reduced resource consumption [
2,
3], and improved crop yields [
4]. However, hydroponic systems are dependent on fertilizers, as the crops receive all required nutrients from a solution rather than nutrients bound in the soil. These typically mineral fertilizers have a risk of high volatile prices and, due to increased demand, reduced availability [
5].
Various attempts have been made to produce hydroponic nutrient solutions from organic residues—with varying success [
6]. While there is an ongoing debate about whether hydroponics can meet the criteria of organic agriculture in the absence of soil, increasing research efforts contribute to the use of organically sourced fertilizers. An emerging trend is the field of bioponics. The term bioponics refers to the production of hydroponic nutrient solutions involving microorganisms to mineralize nutrients bound in the organic residues into soluble, plant-available forms. Microorganisms in bioponic components, such as biofilms on plant roots and digested organic waste in bioreactors, perform biological conversion of the organic nutrients in waste into readily available forms of nutrients for plants.
Figure 1 illustrates the most commonly applied bioponic methods, namely, aerobic digestion, anaerobic digestion, a combination of both, and “tea”-type methods [
7,
8,
9].
A major challenge in producing a bioponic nutrient solution (BNSL) is ensuring sufficient nitrogen availability in the solution [
10]. As nitrate is required in larger quantities for vegetative growth and ammonium is toxic to plants in high concentrations, nitrification plays a crucial role. However, only low nitrification rates can be obtained by aerobic digestion itself due to the slow growth of the relevant microbial community [
11,
12]. Among the studied resources used to produce bioponic nutrient solutions are digestate from biodigesters [
13,
14], animal manures [
15,
16,
17], municipal wastewater [
9,
18], and food waste [
19]. Due to the challenge of producing an adequate and balanced nutrient solution, which is required in hydroponic cultivation, the vast majority of studies have focused on the cultivation of leafy greens, such as lettuce (
Lactuca sativa L.), Pak Choi (
Brassica campestris v. Chinensis cv. Joi Choi), and silverbeet (
Beta vulgaris L). Only a few studies have investigated the bioponic production of fruiting vegetables such as tomatoes
(Solanum lycopersicum cv. “Ponderosa”; Kobayashi Seed Co., Ltd., Kakogawa, Japan) [
8]. The main reason for this is that leafy greens have a more uniform nutrient demand over their life cycle, while fruiting vegetables require adapted nutrient solutions to cater for demands during flowering and fruiting plant stages. In the majority of studies, the plants grown in bioponic nutrient solutions showed lower biomass development than the mineral control groups. Only in a few cases did the bioponic production achieve similar biomass yields when compared to their mineral controls. Commonly, yields refer to biomass development only, which is the major agronomic factor for farmers, retailers, and consumers.
However, results from studies focusing on the product quality of biologically produced crops indicate improved product quality over conventionally produced hydroponic crops. Analyses of the qualitative properties and nutritional values have hardly been investigated. Mauerer [
20] showed that hydroponic lettuce grown with nitrified urine resulted in increased chlorophyll content in leaves when compared to the control. Similarly, Mowa et al. [
21] found that the lycopene content in tomatoes produced with manure-derived nutrient solutions was twice as high as in vegetables produced with mineral fertilizers. Lycopene is a carotenoid linked to health benefits such as blood pressure management and cancer prevention. Thus, despite the often lower biomass development in bioponic systems, this form of production could provide added value for the market, highlighting the relevance of further investigations.
Besides the nutrient composition, the microbial communities forming in bioponic systems affect the processing of organic residues, plant growth, and food safety. While microorganisms are required for biological nutrient conversion, the use of organic residues in food production bears a risk of viral, bacterial, and/or fungal pathogens, potentially harmful to plant and consumer health. In a comprehensive study on the bacterial community in bioponic nutrient solutions derived from chicken manure, the authors of [
17] showed that several microbial genera were associated with organic degradation (e.g.,
Nocardiopsis spp.,
Cellvibrio spp.), nitrification (
Nitrospira spp.), phosphorus solubilization, and plant growth promotion (for example,
WD2101_soil_group and
Bacillus spp.).
At the same time, hydroponic solutions and systems present a good milieu for beneficial as well as harmful microbial growth. Specifically due to high nutrient contents not only required by the plant but also by microorganisms, hydroponic nutrient solutions favor microbial growth [
22]. Hence, in order to prevent microbial overpopulation, which can negatively affect plant growth and cause the growth of harmful pathogens, disinfection is necessary. Several methods have previously been described, though mostly in a hydroponic and not in a bioponic approach [
23]. Non-chemical disinfection of nutrient solutions can be achieved through heat treatment, filtration, oxidation, or the most common method through UV disinfection. Examples of chemical treatments are the addition of sodium hypochlorite, ozone, or hydrogen peroxide (H
2O
2) [
24,
25]. Specifically, disinfection with H
2O
2 is a promising approach because oxygen radicals theoretically can be produced in situ and on demand through electrochemical processes within the nutrient solution.
H
2O
2 has long been recognized as a potent antimicrobial agent, capable of neutralizing a wide spectrum of pathogens [
26]. Conventionally, H
2O
2 is introduced into hydroponic systems after being produced off-site, often leading to complexities in dosage control, cost implications, and potential disruptions to the balance of nutrient concentrations due to unpredicted reactions of chemical components within the nutrient solution. For that reason, researchers explore the viability of water-based electrochemical H
2O
2 production using new reactor concepts, components, and catalysts as a sustainable and efficient approach to combat microbial proliferation within hydroponic nutrient solutions [
27].
For decades, commercial H
2O
2 has been predominantly produced via the Anthraquinone process and sold in concentrated solutions of typically 30–50% [
28]. For applications where significantly lower concentrations are required, as is the case in hydroponic systems, this leads to costs and effort for the safe handling and dilution of the H
2O
2 solutions. Therefore, on-demand production, directly in the required concentration, is attractive. One promising option is the electrochemical H
2O
2 production, either by the cathodic process of oxygen reduction,
or by an anodic process of water oxidation [
29],
E0 represents here the standard potential of the respective reaction measured against the normal hydrogen electrode. The standard potential for the anodic H
2O
2 production is significantly higher than that of the oxygen evolution reaction (
E0 = +1.23 V). Therefore, the anodic process typically uses boron-doped diamond electrodes that have a high overpotential for the competing oxygen evolution. This process has been shown to enable H
2O
2 concentrations up to 100 mM in alkaline carbonate electrolytes (corresponding to 3400 mg L
−1), where peroxodicarbonates are formed as intermediates [
30,
31,
32].
The oxygen reduction reaction is typically realized using gas diffusion electrodes, which overcomes mass transport limitations due to the low solubility limit of oxygen in water. A typical electrochemical reactor concept uses liquid electrolytes both on the cathode and on the anode side separated by an ion exchange membrane [
33,
34]. Alternatively, the gas diffusion electrode can be in direct contact with the ion exchange membrane, and even a complete polymer electrolyte membrane fuel cell configuration with a hydrogen oxidation electrode on the anode side has been described [
35]. Several side and decomposition reactions typically limit the H
2O
2 concentrations achieved by both electrochemical processes. Generally, the produced H
2O
2 can chemically decompose into oxygen and water. Hydrogen evolution is one main competing reaction for the cathodic process, and the H
2O
2 can undergo further reduction into water, according to the reverse reaction in Equation (1). For the anodic process, the main competing reaction is oxygen evolution, and the produced H
2O
2 can be further oxidized according to the reverse reaction in Equation (2). These reactions typically lead to an equilibrium of production and decomposition, where the H
2O
2 concentration remains constant.
Therefore, most of the studies reported in the literature focus not only on the development of suitable catalyst materials but also on defined electrolyte compositions and process conditions where the competing reactions are suppressed. At the same time, for the disinfection of nutrient solutions, the H2O2 solution needs to be compatible with the hydroponic system in terms of process integration and the impact on nutrient chemistry as well as plant toxicology.
One option for H2O2 production is in pure water using an electrolyzer where the catalyst layer and membrane are in direct contact. One example of such an electrolyzer has been developed by the Danish company HPNow. However, the pure water supply requires an additional pre-treatment by reverse osmosis or ion exchange. In addition, the maximum H2O2 concentration is limited, especially considering that the H2O2 concentration is low after dosing to the irrigation water.
For that reason, this publication delves into the promising approach of electrochemical on-site H2O2 production using drinking water and bioponically produced nutrient solution for controlling the microbial load in bioponic and hydroponic systems. By leveraging electrochemistry and harnessing the innate capabilities of H2O2, this novel approach aims to transform disinfection in hydroponics, offering a streamlined and eco-friendly method to tackle microbial challenges. Furthermore, the incorporation of in situ H2O2 production in nutrient solutions not only enhances the economic feasibility of the process but also aligns with the principles of on-demand disinfection and resource sustainability.
Through the consideration of electrochemistry, microbiology, agricultural science, and waste management, this work seeks to explain the mechanisms underpinning electrochemical H2O2 production and its efficacy in reducing microbial loads. The research presented herein draws from both theoretical insights and practical experimentation, shedding light on the potential benefits, challenges, and implications of on-demand produced H2O2 within the topic of not just bioponic agriculture but also hydroponic approaches in agriculture. The focus of this study was the H2O2 production directly in the bioponic nutrient solution and the H2O2 production in tap water without any pre-treatment. Since exposure of the nutrient solution to anodic oxidation processes is expected to lead to critical side reactions such as chlorine evolution or the decomposition of organic compounds, the cathodic H2O2 process using liquid electrolytes on both sides was used. Hence, this work intends to serve as a first proof of concept approach towards future research where microbial management in bioponics and hydroponics is not only efficient but also aligned with on-demand disinfection using H2O2 of nutrient solutions. To the best of our knowledge, this is the first time that H2O2 has been considered for its ability to disinfect a BNSL as well as its ability to disinfect a BNSL with H2O2 produced ex situ and in situ.
2. Materials and Methods
2.1. Production of a Bioponic Nutrient Solution from Organic Waste
To produce a nutrient solution using organic materials, three distinct stock solutions were prepared. For the recovery of PO
4-P, bone meal (Beckmann&Brehm GmbH, Beckeln, Germany) was selected. Kartoffelhof Sautter (Bondorf, Germany) provided potato peels from an industrial production for K recovery, and blood meal (Common Baits, Rosenfeld, Germany) was selected for NO
3-N recovery. Basak and Yigit [
36] have demonstrated that blood meal can have a positive effect on plant growth of Green Bean (
Phaseolus vulgaris L.) seedlings under salt stress. In addition, Nkoa [
37] demonstrated that blood and bone meals contain significant amounts of relevant plant nutrients (e.g., N and P) with a high biodegradability and fertilizer value.
For the recovery of K, potato peels were dried for 72 h at 70 °C and ground to a powder. For the recovery, a solution consisting of de-ionized water and potato peel powder with a concentration of 320 g L−1 was prepared. Specifically, 8000 g of powder was dissolved in 25 L of de-ionized water and kept at room temperature for a total of 19 days under anaerobic conditions. The solution was then centrifuged at 8000 rpm for 8 min, and the pellet was discarded. Important macronutrients of the recovered solution had the following final concentrations: K = 4168 mg L−1, NO3-N ≤ 5 mg L−1, PO4-P = 252 mg L−1, and NH4-N = 71.9 mg L−1.
For the recovery of PO4-P, bone meal was mixed with DI water for a final volume of 50 L at a concentration of 8.05 g L−1 at 30 °C under anaerobic conditions for 92 days. At the start, the pH was kept below 5.5 by manually adding 10% (v/v) formic acid to the solution, which stayed below a pH of 5.5 throughout the experiment. The reactor was also manually mixed twice per week. The recovered solution had the following characteristics: PO4-P = 109 mg L−1 and NH4-N = 414 mg L−1 (NO3-N concentration was not determined).
For the recovery of NO3-N, anaerobic and aerobic processes were used to first convert organic N to NH4-N anaerobically and then convert NH4-N to NO3-N aerobically. Specifically, dried blood meal was mixed with de-ionized water for a final volume of 50 L and 100 L at a concentration of 8.05 g L−1 at 30 °C and 20 °C, respectively. As a microbial inoculum cow manure, provided by Milchhof Blumhardt (Remseck, Germany), was turned into a stock solution (concentration: 600 g L−1) and was added to the solutions for a final concentration of 2 g L−1. Anaerobic digestion took place for 60 days with final NO3-N concentrations of 444 mg L−1 and 178 mg L−1, respectively. Subsequently, both solutions were pooled together for a total NO3-N concentration of 267 mg L−1 and processed aerobically for an additional 40 days at 30 °C. The solution was then decanted after an additional 48 h to remove particles, which led to a final volume of ~100 L with the following characteristics: NO3-N = 3.6 mgL−1 and NH4-N = 71.9 mg L−1 (PO4-P was not determined), suggesting inefficient ammonium conversion to NO3-N.
Consequently, the individual stock solutions were combined for a total nutrient solution volume of 116 L composed of 8 L of potato peel solution, 45 L of bone meal solution, and 63 L of blood meal solution. The final solution then showed a concentration of macromolecules of K = 267.8 mg L−1, NO3-N = 2.07 mg L−1, PO4-P = 1.32 mg L−1, and NH4-N = 180.2 mg L−1. Additionally, relevant cation and anion concentrations were determined and have the following characteristics: Ca = 96.54 mg L−1, Mg = 25.86 mg L−1, Na = 36.75 mg L−1, Al = 1.94 mg L−1, Fe = 2.01 mg L−1, Mn = 0.05 mg L−1, Cu = 0.02 mg L−1, Zn = 0.63 mg L−1, Cl = 59.48 mg L−1, and SO4 = 20.89 mg L−1.
The final solution reveals inadequate levels of NO3-N and PO4-P, alongside elevated levels of NH4-N. Meanwhile, K concentrations align with the target. Consequently, this situation contributes to a restricted availability of nutrients for the hydroponic cultivation of plants. Nonetheless, the procedure for generating a hydroponic solution utilizing organic materials remains unchanged. Thus, even if nutrient recovery is enhanced, it is reasonable to expect a comparable microbial presence. This aspect makes the process an illustrative example of a nutrient solution based on organic materials. Due to the centrifugation of the potato peel solution before mixing, it is expected that the microbial load from the potato solution is minimal. Conversely, the bone meal-derived solution primarily consists of anaerobic microorganisms, while the blood meal-based solutions encompass a mixture of aerobic and anaerobic microorganisms.
2.2. Electrochemical H2O2 Production and Disinfection Tests
2.2.1. Ex Situ vs. In Situ Production
Two basic operation principles of the electrochemical H
2O
2 production for disinfection of the nutrient solution production were evaluated: the electrochemical H
2O
2 production in a separate electrolyte (ex situ) and subsequent manual dosing to the nutrient solution, and in situ production directly in the nutrient solution. For the ex situ production, the initial H
2O
2 concentration and the reaction time between the H
2O
2 and the bacteria and fungi in the nutrient solution were adjusted independently. Therefore, two series of experiments were performed for ex situ production. Scenario 1 (Experiment C1–C3 in
Table 1) was designed to evaluate the effect of the H
2O
2 concentration directly after dosing to the nutrient solution on the disinfection performance, whereas the reaction time was kept constant for 30 min. The H
2O
2 concentration was set by adding the corresponding amount of H
2O
2 produced ex situ to the nutrient solution. In Scenario 2 (R1–R3 in
Table 1), the initial H
2O
2 concentration was set constant, but the reaction time varied. For the in situ production directly in the nutrient solution, the H
2O
2 production time and the reaction time in the nutrient solution are identical and were varied between Experiment IS1 and IS3 as shown in
Table 1, thus resulting in different H
2O
2 concentrations. As the control sample, a nutrient solution without the addition of H
2O
2 was considered with quantification before every tested scenario. Each scenario (9 scenarios in total, see
Table 1) was run and tested in triplicates.
2.2.2. Electrolysis Cells and Setup
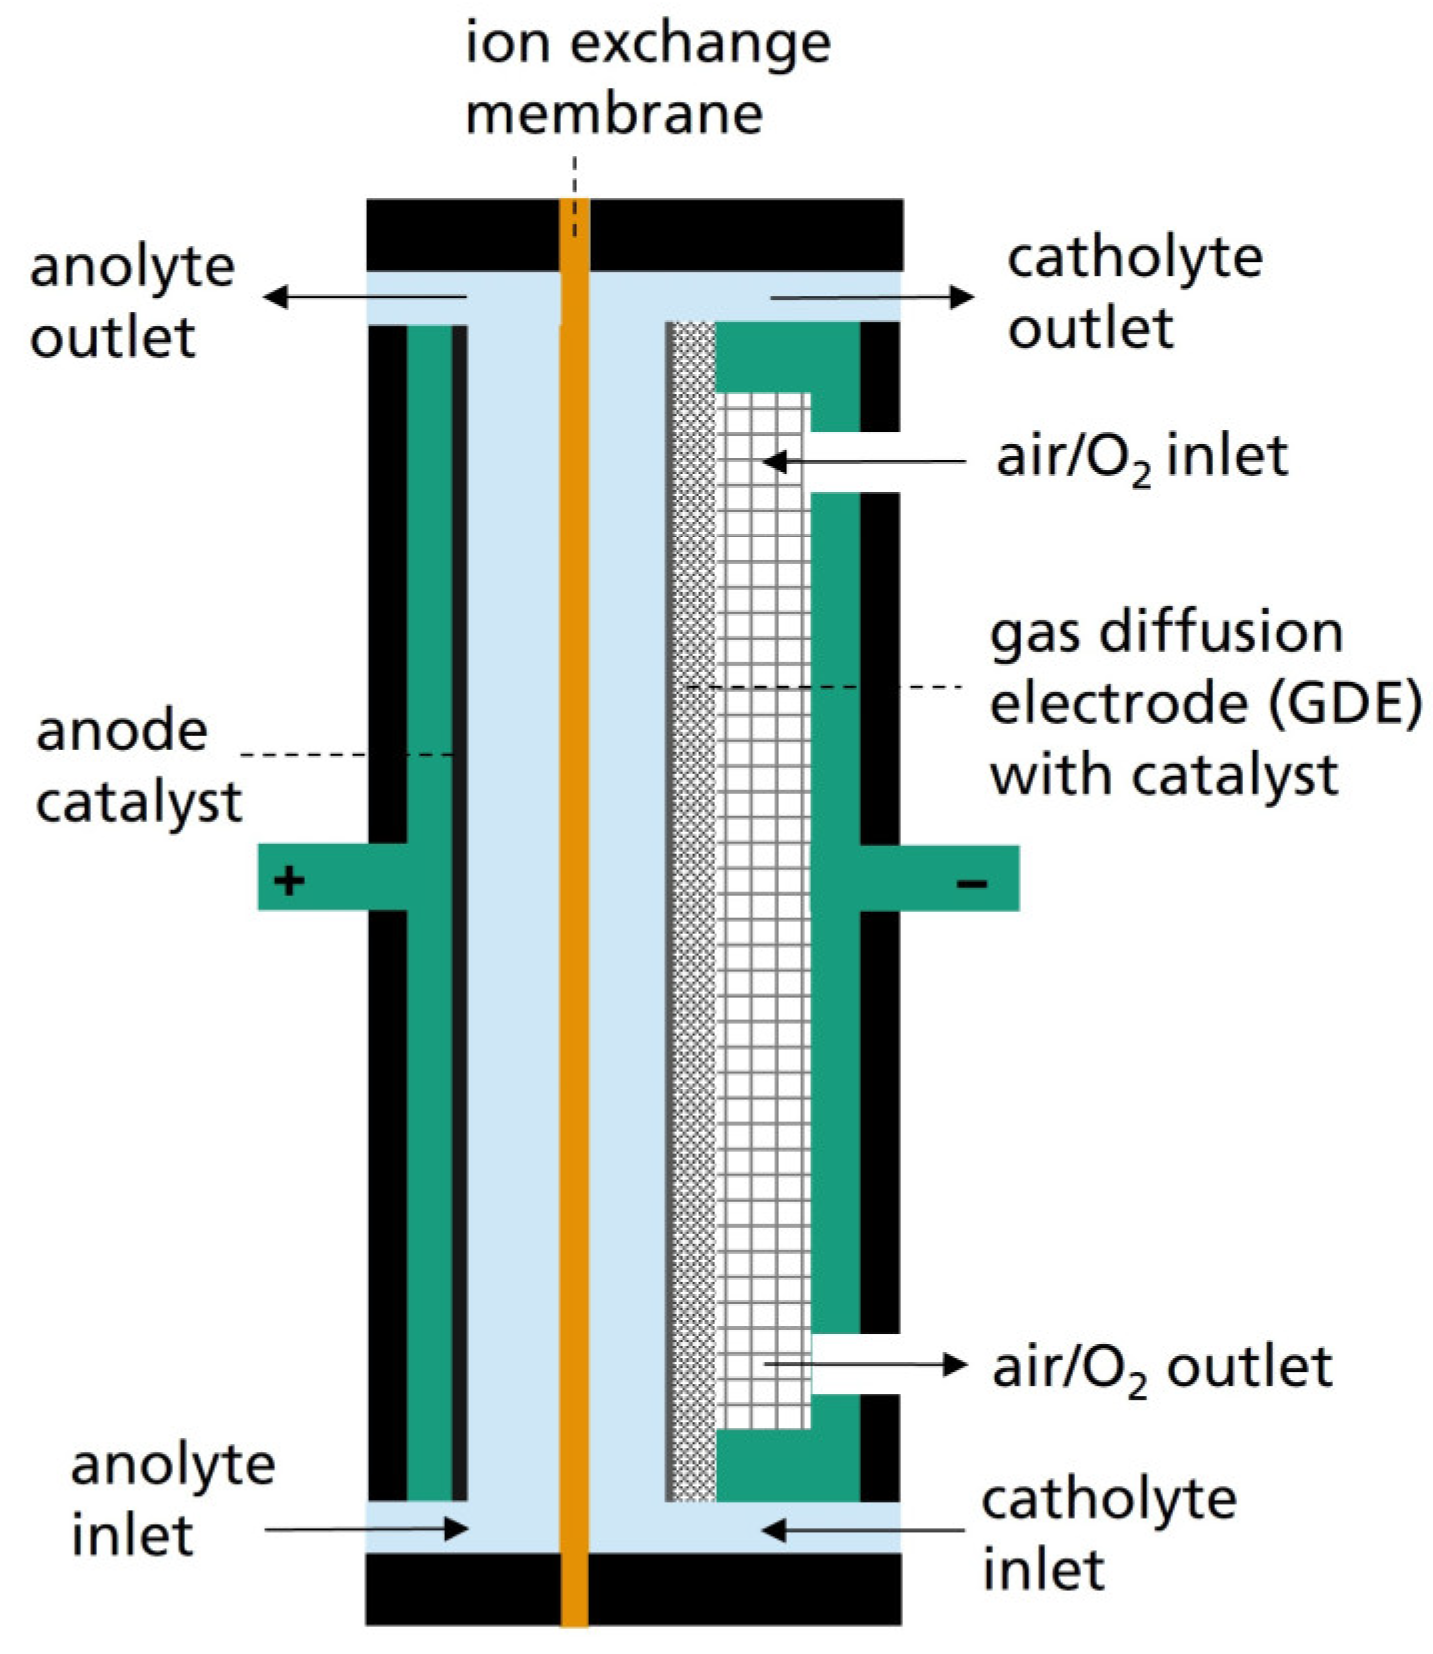
The H
2O
2 production was performed using a self-constructed electrochemical cell with one electrode pair of a geometric active area of 123 cm
2 and one gas, one liquid catholyte, and one liquid anolyte compartment, respectively (
Figure 2). A commercially available gas diffusion electrode with microporous coating and carbon-based catalysts (purchased from Quintech GmbH, Sonsbeck, Germany) was used for H
2O
2 production, whereas a titanium sheet electrode coated with iridium mixed metal oxide catalysts (Magneto B.V., Delft, The Netherlands) served as an anode. The catholyte and anolyte compartments were separated by a cation exchange membrane (Fumasep F-10150 PTFE, Fumatech GmbH, Bietigheim-Bissingen, Germany) to prevent the decomposition of the H
2O
2 at the anode.
Figure 3 shows the experimental setup for electrochemical H
2O
2 production. The electrochemical H
2O
2 production was performed in semi-batch mode; for example, the electrolytes were recirculated through the electrochemical flow cell to increase the H
2O
2 concentration compared to one single pass.
In the case of ex situ H2O2 production, tap water with an electric conductivity of approximately 350 µS cm−1 was used both as the catholyte and the anolyte, respectively. The idea behind using tap water instead of specific salt, acid, or base electrolytes was to minimize the required pre-treatments (for example, for pure water production) and auxiliary chemicals. The consequences of using such potentially varying, low-conductivity electrolytes will be discussed in the following sections. In the case of in situ production, the nutrient solution was recirculated through the catholyte compartment of the cell. In this case, an acidified sodium sulfate (Na2SO4/H2SO4) solution was used as the anolyte.
The operation parameters air flowrate (150 L h−1) and recirculation flowrates of the catholyte and anolyte (25 L h−1) were kept constant for all H2O2 production experiments, whereas the electric cell voltage and current were adjusted depending on the electrolyte conductivity. The overpressure in the gas compartment was indicated by a manometer of 0.1–0.2 bar.
The analysis of the H
2O
2 concentration was performed by permanganate titration, using the reduction of permanganate by H
2O
2 under acidic conditions [
29]. In our study, 10 mL of the sample were supplemented with up to 50 mL of fully deionized water and acidified with 10 mL of a 5 M H
2SO
4 solution. A solution of
cMnO4 = 0.05 M KMnO
4 was used for titration to the point where the solution turned purple. The H
2O
2 concentration
cH2O2 can be calculated from the sample volumes
VH2O2,S and the required volume of KMnO
4 solution
VMnO4 using
One parameter that quantifies the efficiency of the production process is the Faraday efficiency
FE. The Faraday efficiency describes the amount of transferred electric charge that yields the target reaction product. For the semi-batch process used in this study, the Faraday efficiency was calculated by the following equation:
where
z = 2 is the number of electrons required for one H
2O
2 molecule, the Faraday constant
F = 96,485 C mol
−1, the total volume of the produced solution
VH2O2 = 0.5 L,
I is the electric current, and
t is the time of H
2O
2 production.
2.3. Microbial Analyses
For the quantification of bacteria, trypticase soy agar was selected, and malt extract agar was used for the quantification of fungi, according to [
38]. Instantly following the specific reaction times, the nutrient solution containing microorganisms and H
2O
2 was serially diluted in a 1X phosphate buffer saline solution (pH = 7.2) to reduce the cell destructive effect of H
2O
2 and was then plated. Trypticase soy agar plates were then incubated at 37 °C for 72 h, while malt extract agar plates were incubated at 25 °C for 96 h. Viable bacteria and fungi were then enumerated as colony-forming units (CFU/mL) and visualized as a Log10 reduction in comparison to the control sample of the nutrient solution that was not in contact with H
2O
2 solutions.
4. Discussion
The results show that electrochemically produced H2O2 can be used for disinfection of organically derived bioponic nutrient solutions. While the analyzed approach did not achieve the same results as state-of-the-art disinfection methods in terms of Log10 reduction, the findings indicate successful microbial reduction in a hydroponic nutrient solution produced from organic waste.
In the scenarios of ex situ H
2O
2 production and subsequent dosing to the nutrient solution, the main parameter that determined the disinfection performance was the H
2O
2 concentration, but not the reaction time (see
Figure 7 and
Figure 8). The results indicate that an H
2O
2 concentration of 200 mg L
−1 or higher is necessary for the efficient disinfection of this type of nutrient solution, which leads to the question of whether this might also inhibit plant growth. In addition, when producing the H
2O
2 ex situ in tap water, the low electric conductivity leads to low electric current densities and therefore low production rates per cm² of electrode area. An even more critical effect is the dilution of the nutrient concentration by the H
2O
2 electrolyte. For an H
2O
2 concentration of 200 mg L
−1 in the nutrient solution, one would need to add approximately 470 mL of the H
2O
2 electrolyte produced ex situ if the concentration of this electrolyte is 630 mg L
−1 (as achieved in Scenario 1). This would lead to a dilution of the nutrient concentration by 32%. Conversely, the in situ production circumvents this problem, since no additional liquid volume is added to the BNSL.
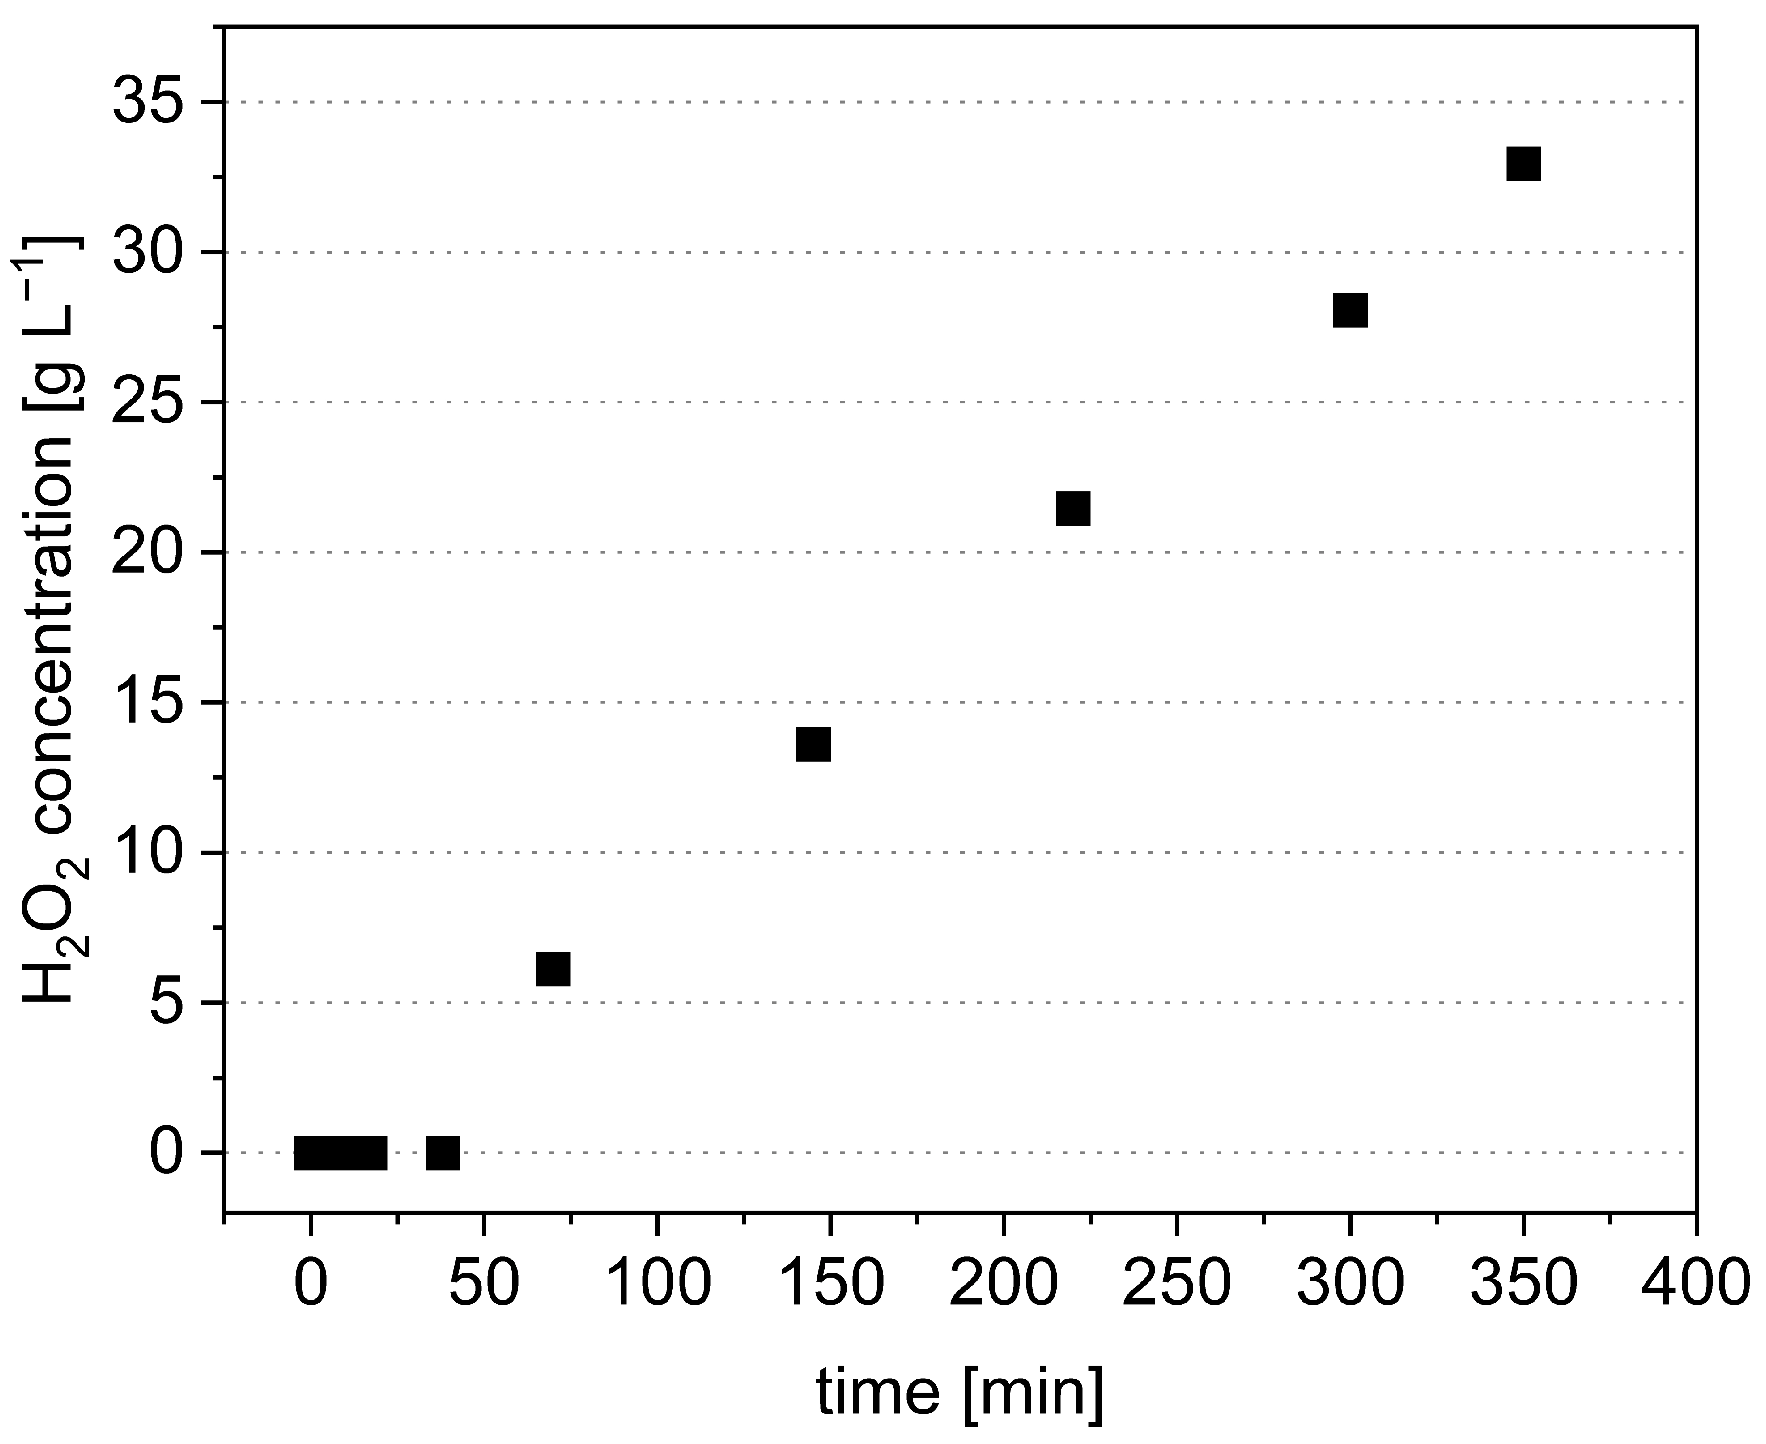
Nevertheless, the H2O2 concentration increases almost linearly with time and current input during production in tap water, and optimization of the electrolysis cell design for lower ohmic resistance is expected to improve the process performance.
The slight increase in H
2O
2 concentration for production times above 15 min in the in situ experiment led to a significant disinfection improvement. This means that the disinfection performance depends not only on the H
2O
2 concentration in the nutrient solution but also on the process time, which is not the case for external production (see
Figure 8). Both results indicate that there is an equilibrium of H
2O
2 decomposition that triggers the disinfection and parallel electrochemical re-production of H
2O
2. Following this assumption, a longer in situ production time corresponds to a larger amount of produced H
2O
2, although the measured H
2O
2 concentrations do not differ significantly.
Furthermore, taking into account the H
2O
2 concentration and process time, the disinfection performance for fungi seems to be more efficient for the H
2O
2 produced in situ when compared to the disinfectant produced ex situ. For example, the Log10 reduction in the in situ experiment for
t = 30 min is more than double (1.68 compared to 0.73, see
Figure 7 and
Figure 9) than for the scenario of external production with the same process time, although the concentrations differ only slightly (236 mg L
−1 compared to 200 mg L
−1). However, a direct comparison between ex situ and in situ production, taking only H
2O
2 concentration and process time into account, is difficult, since both parameters cannot be directly compared between both scenarios.
Longer reaction times of H
2O
2 produced ex situ did not result in improved bacterial reductions (
Figure 8). As expected, the in situ production of H
2O
2 led to improved disinfection results over time.
Several studies on the most common pathogens in hydroponic systems,
Fusarium, Phytophthora, and
Pythium [
22], have shown that, in order to completely remove unwanted microorganisms in hydroponic systems by H
2O
2, high doses, long contact times, or both are required (
Table 2).
At the same time, the disinfection treatments can also affect beneficial microbial populations. Especially root-attached microbial communities have a high impact on plant health but can be lost due to disinfection procedures, which then impact plant development. Bioponic nutrient solutions are characterized by a great microbial diversity that fulfills a series of functions [
17,
22]. For example, some bacteria and fungi might even be beneficial and involved in processes keeping pathogens at low concentrations, as has been observed in conventional hydroponic systems [
22]. Lau and Mattson [
47] showed that the addition of H
2O
2 to a commercial fish-based organic fertilizer led to an improved growth of lettuce plants at a concentration of 37.5 mg L
−1 when compared to no addition of H
2O
2. In contrast, plants grown in commercially available mineral fertilizers had reduced performance with increasing H
2O
2 concentrations in terms of fresh weight, root length, leaf width, and plant height. Here, the reaction of produced hydroxyl free radicals does not only attack membrane lipids, DNA, and other cell components of bacteria and fungi to cause their death, they can also remain in the solution, which increases the dissolved oxygen content similar to the application of O
3 for disinfection [
9]. The in situ experiments (
Figure 9) suggest concentrations of H
2O
2 in the BNSL that can dissociate into free radicals, thus increasing dissolved oxygen content to promote nutrient uptake by the plant. This should be considered in future applications to monitor dissolved oxygen concentrations for the optimization of nutrient uptake and microbial load reduction.
In addition, organic residues in bioponic systems might not only cause the risk of pathogens in the cultivation but also increase root exudates as a reaction to adjust the nutrient uptake around the root. Hosseinsadeh et al. (2019) showed that an H
2O
2 application of approximately 200 mg L
−1 led to the best results in removing root exudates, thus improving the growth environment for the plant [
23]. This indicates that the presence and application of H
2O
2 as a disinfectant for the BNSL not only reduces microbial concentrations but also reduces plant exudates and thus improves plant health and growth. This concept needs to be further evaluated.
The balance between using microorganisms to moderate nutrient management and recovery as well as nutrient availability in hydroponics systems remains a challenge when optimizing H
2O
2 dosing for bioponic nutrient solutions. However, from a commercial perspective, pathogenic removal continues to be a high priority. Nonetheless, previous studies have shown attempts to optimize the application of H
2O
2 in hydroponic systems. Phytotoxic effects have been observed in H
2O
2 concentrations ranging from 8 mg L
−1 for lettuce to 125 mg L
−1 for cucumber cultivation. As there is a wide range of phytotoxic effects based on cultivated plants, suggestions have been made to apply H
2O
2 to source water in combination with conventional mineral fertilizers [
23]. At the same time, our research has shown that microbial reduction takes place when H
2O
2 is applied to organic-based NSLs and, for this reason, should not only be considered for the disinfection of source water but also for prepared nutrient solutions. Greater value may lay in the disinfection of nutrient solutions, as the half-life in aqueous solutions (5–10 h), compared to other disinfection agents such as O
3 (8–30 min), is prolonged and thus can have longer reaction times with microorganisms. Further research is necessary on this, as the decomposition is strongly dependent on the amount of metal impurities, which can be high in a BNSL.
One challenge for the integration of electrochemical H
2O
2 production by oxygen reduction (cathodic process) in bioponic cultivation is the fact that H
2O
2 solutions tend to be alkaline, since the cathodic process consumes protons or generates hydroxide anions (see Equation (1)). This is independent of the question of whether the H
2O
2 solution is produced outside the nutrient solution or in situ. Hydroponic systems usually operate under slightly acidic conditions (pH 5.5–6) for optimal nutrient uptake in the root zone [
8]. One possible way to prevent this pH increase is to compensate for this effect by H
+ transport from the anode side of the electrolysis cell, for example, by using an acidic anolyte, as is done in in situ production experiments. It is important to note that the acid on the anode side is not consumed, since the anode reaction produces H
+ as a side product. This stabilization of the pH could also prevent a decrease in nutrient uptake.


