
The Quantity and Quality of Humic Substances following Different Land Uses in Karst Peak-Cluster Depression in Guangxi, China

1
Guangxi Key Laboratory of Earth Surface Processes and Intelligent Simulation, Nanning Normal University, Nanning 530001, China
2
Institute of Karst Geology, Chinese Academy of Geological Sciences, Guilin 541004, China
3
Pingguo National Field Observation and Research Station of Karst Ecosystem in Guangxi, Pingguo 531400, China
*
Author to whom correspondence should be addressed.
Agriculture 2023, 13(12), 2246; https://doi.org/10.3390/agriculture13122246
Submission received: 7 November 2023
/
Revised: 29 November 2023
/
Accepted: 4 December 2023
/
Published: 6 December 2023
(This article belongs to the Special Issue Soil Management for Sustainable Agriculture)
Abstract
:There were some ecological and environmental problems in limestone soil in the karst peak-cluster depression in Pingguo City of Guangxi, such as the destruction of soil structure, soil acidification and soil fertility decline, and these problems were closely related to soil organic matter. The soil in this site was classified as Cambisols. Therefore, this project took soil under five major land uses (grassland, afforestation, sugarcane field, corn field and pitaya field) in the karst area of Guangxi as the research object. The contents and molecular structure properties of humic acids, fulvic acids and humins in soils were studied by solid-state 13C nuclear magnetic resonance spectroscopy and elemental composition. From the perspective of the chemical structure of humic substances, the differences in the quantity and structural characteristics of humic acids, fulvic acids and humins in different land uses were revealed. The results showed that the organic carbon content of both afforestation (34.83 g kg−1) and natural restored grassland (31.67 g kg−1) were significantly higher than that of sugarcane field (17.60 g kg−1), corn field (16.35 g kg−1) and pitaya field (14.31 g kg−1) (p < 0.05). The contents of three humic fractions in grassland were relatively high, and the contents of three humic fractions in sugarcane field were relatively low (p < 0.05). The structural characteristics of humic substances showed that the protein components of the three humic fractions in the afforestation were high, indicating that the humic substances in the afforestation contained more unstable components. The Alkyl C/O-alkyl C and Hydrophobic C/hydrophilic C ratios of the three humic fractions of corn field were high, indicating high stability and maturity in humic substances in corn field.
1. Introduction
Soil organic matter (SOM) is essential for agricultural production systems because it regulates the chemical, biological and physical properties of soils and therefore plays an important role in nutrient cycling [1]. Soil organic carbon (SOC) is related to soil function and the sustainability of agroecosystems, and measuring the amount and structural characteristics of SOC is crucial for evaluating soil function and understanding soil carbon sequestration processes [2]. However, most SOC is present in the form of humic substances that are difficult to decompose, namely humic acid (HA), fulvic acid (FA) and humin (Hu), which accounts for about 60–80% of total SOM [3]. And humic substances are still the object of intense discussion and research, even contention about their formation, composition and structure [4,5]. The high molecular weight and complex chemical structure of humic substances indicate that light depletion can produce higher carbon emissions [6].
The 540,000 km2 karst area in southwest China, including the three provinces of Yunnan, Guizhou and Guangxi, is the core of karst areas in East Asia and one of the three major karst areas in the world [7]. The southwest karst region is also one of the regions of the largest continuously exposed carbonate rocks in China, which is very fragile and sensitive to agricultural activities [8]. Carbonate rocks are highly soluble and cannot produce a large amount of soil, especially on slopes, where the amount of soil is less and the soil layer is shallow, generally less than 30 cm [9]. Therefore, soil resources in karst areas are very valuable. Before the last century, grasslands and forests in many places were degraded into arable land due to the overexploitation of land resources [10]. In most of the world’s most fertile soils under long-term cultivation, SOM has been reported to be depleted in large quantities, leading to soil degradation and decreased fertility [11]. Since around 2000, most of the degraded farmland in this region have been restored through natural regeneration and afforestation under the implementation of ecological projects such as returning farmland to forest and closing mountains [12]. How the complexity of humic substances in organic matter in the region changes as vegetation recovers remains not understood. Therefore, it is very important and meaningful to study the influence mechanism of karst vegetation restoration on the decomposition and sequestration of soil humic substances. Studies have shown that land uses play a key role in soil carbon sequestration [13]. Organic carbon accumulation and carbon stock vary with land uses due to changes in the quality (such as species of litter) and quantity (such as the amount of litter and litter C input) of source substances, soil physicochemical properties and biological activity, which in turn change the degree of decomposition of organic matter [14]. Land uses also have a strong influence on the quantity and quality of SOM, for example, the accumulation of soil organic carbon after afforestation in grassland and farmland is a slow and continuous process, and about 30% of the accumulated carbon was stored in an unstable form on the forest surface after afforestation [15]. In addition to the quantity of organic matter input, land uses also affect the quality of organic matter input, which in turn affect the mineralization rate of soil carbon [16]. Therefore, land-use changes have a large impact on global CO2 emissions by affecting soil carbon storage [17]. Due to the irrational development and utilization of land resources, the change in the molecular structure of soil humic substances leads to an increase in its hydrophilicity, which leads to a decrease in the hydrophobicity capacity of the surface of clay particles of humic substances and a weakening of the structural stability of soil aggregates [18]. But in organic soils, because of mineralization caused by cultivation, the hydrophobicity increases relative to the hydrophilicity, probably due to hydrophilic carbon mineralization and excitation effect are faster than hydrophobic carbon under the action of microorganisms [19]. Certain components of humic substances should be relatively unstable, their quantities and chemistry more sensitive to land uses than the corresponding properties of total SOM. In the southwest China Karst area, high calcium contents in limestone soils may play a key role in SOM protection by forming complexes with HA or surrounding SOM with CaCO3 precipitation [20].
In order to control the rocky desertification of land, close hillsides to facilitate afforestation have been carried out since the 1990s. The phenomenon of reversal of rocky desertification was shown in local areas. Although there are many studies on the effects of different land uses on soil organic carbon, humic substances account for most of the organic matter. Therefore, in this study, soil samples of a 0–10 cm soil layer are collected in five different land uses in the karst peak-cluster depression. Quantitative and qualitative analysis of different humic fractions are carried out. The objectives of this study are: (1) differences in content of humic fractions between different land uses are analyzed; (2) evaluate the molecular composition of humic fractions extracted from subtropical limestone soils under different land uses. Therefore, we hypothesized that vegetation restoration in karst areas leads to improved humic substances within these agro-ecosystems.
2. Materials and Methods
2.1. Site Description and Soil Collection
The study area was located in Pingguo National Field Observation and Research Station of Karst Ecosystem, Guangxi (Figure 1). The landform of this area was a typical karst peak-cluster depression. The climatic conditions were South Asian tropical monsoon climate, rich in heat and abundant rainfall. The average annual temperature was 20.2~22.6 °C, the average annual rainfall was 1322.3 mm and the daily humidity was 72.06%. The rocks were mainly pure limestone and siliceous limestone. The soil in this site was classified as Cambisols (FAO Soil Taxonomy).
Five dominant land uses including grassland (GL), afforestation (AF), sugarcane field (SF), corn field (CF) and pitaya field (PF) were identified and sampled in 2021. Grassland (23°25′57″ N, 107°23′26″ E, altitude of 203 m) soil samples were collected from plots that had been returned to grassland for more than 10 years, and the vegetation of grassland was mainly Miscanthus, Nephrolepis cordifolia (L.) C. Presl, Vitex negundo, etc. The grass was neither cultivated nor fertilized. Forest soil samples were collected from the plots (23°23′37″ N, 107°23′23″ E, altitude of 279 m) of artificially converted farmland to forest, and the dominant species was Delavaya toxocarpa Franch., which was planted in 2006. There was no tillage in afforestation and there was a litter layer on the surface. After the sugarcane seed strips were planted once in the sugarcane plot (23°24′31″ N, 107°24′35″ E, altitude of 136 m), it could be harvested continuously three times and once a year. The sugarcane fields were ploughed once every 2–3 years. The management of sugarcane fields was to spread mineral fertilizer. When the sugarcanes were ripe, the leaves were returned to the field. Corn plots (23°19′55″ N, 107°23′28″ E, altitude of 346 m) were planted with corn for two seasons per year and sown by tilling. The corn field was ploughed twice a year. Corn fields should also be fertilized with mineral fertilizers. Pitaya (Hylocereus undatus ‘Foo-Lon’) was planted in the plot (23°23′11″ N, 107°23′18″ E, altitude of 347 m) for about 10 years. After planting, the land was no longer ploughed and pitaya was harvested four times a year. In addition to the application of mineral fertilizer, the leaf litter was fertilized on the ground around the roots of pitaya.
Soil samples were collected in March 2021. Soil samples were collected randomly from several points at each of the target plot and combined to make a composite sample. There were three replicates per plot. The samples were air dried, ground and passed through a 2 mm sieve for HS extraction and passed through 0.25 mm sieve for determination of the carbon contents.
2.2. Quantitative Analysis and Extraction of Humic Substances
Humic substances were analyzed according to the method described by Dou [21]. Briefly, the soil was extracted with a mixed alkali solution and then centrifuged. The supernatant contained humic acid (HA) and fulvic acid (FA), and the insoluble residue was humin (Hu). After acidifying the supernatant to pH 1, the precipitate was HA and the supernatant fraction was FA. The HA was filtered out and dissolved in 0.05 mol L−1 NaOH. All fractions were used for concentration analysis. Soil organic carbon (SOC) and the content of humic substances were determined using a K2Cr2O7 external heating method [22]. The isolation and purification of FA, HA and Hu were processed using the procedure described by International Humic Substances Society [23]. The three fractions were separated through the classic acid base fractionation. The received HA, FA and Hu residues were required to remove ash. Then three residues were dialyzed to eliminate excess salts. The three fractions were freeze-dried afterwards.
2.3. Elemental Compositions
The C, H and N content of all humic fractions were determined by an elemental analyzer (Elementar Vario EL cube, Langenselbold, Germany). The ash content was measured in a muffle furnace by heating the humic substance (HS) at 750 °C for 4 h. The O content was calculated by gravimetric difference and as follows: O% = 100 − C% − H% − N% − ash%. After that C, H, N and O contents were recalculated on an ash-free basis. The H/C, O/C and C/N atomic ratios were determined from elemental analysis [24,25].
2.4. The Solid State 13C NMR Analysis
In order to determine the detailed composition of carbon functional groups in the humus component sample, the samples were analyzed using 13C cross polarization/total side-band suppression (CP/TOSS) NMR (Bruker Avance III 400, Billerica, MA, USA) at a 13C frequency of 100.6 MHz. The samples were kept in closed 4 mm NMR MAS rotors. Each spectrum obtained was divided into seven chemical shift regions: 0–45 ppm, alkyl C; 45–60 ppm, OCH3/NCH; 60–90 ppm, O-alkyl C; 90–110 ppm, Di-O-alkyl C; 110–145 ppm, aromatic C; 145–160 ppm, aromatic C-O; 160–190 ppm, COO/NC=O [26]. The MestReNova software v12.0.1 (Mestrelab Research, A Coruña, Spain) was used to collect and evaluate the spectra. The relative distribution of each signal area was calculated as a percentage of the total spectral range (ppm). Three ratios were used to calculate the structural properties of organic carbon [26,27]. Alkyl C/O-alkyl C (A/O-A): (0–45)/(45–110); aliphatic C/aromatic C: [(0–45) + (45–60) + (60–90) + (90–110)]/[(110–145) + (145–160)]; hydrophobic C/hydrophilic C: [(0–45) + (110–145) + (145–160)]/[(45–60) + (60–90) + (90–110) + (160–190)].
2.5. Statistical Analysis
General calculations and data handling were performed with Excel for Mac (Microsoft Corporation, Redmond, WA, USA) and ORIGIN 2021 (OriginLab Corporation, Northampton, MA, USA). All statistical analyses were performed using SPSS 19.0 (IBM Corporation, Armonk, NY, USA). One-way Analysis of Variance (ANOVA) followed by the Least Significant Difference test (p < 0.05) was used to assess the significance of differences in soil properties among different land-use types. To further evaluate the chemical structural (relative contribution of different functional groups and indices) differences among the humic fractions and among land use and to identify the key factors of the identified differences, principal component analysis (PCA) was carried out. This analysis was conducted using Canoco for version 5 (Microcomputer Power, Ithaca, NY, USA).
3. Results and Discussion
3.1. Effects of Different Land Uses on Soil Organic Carbon
Data on the contents of soil organic carbon under different land use types are presented in Figure 2. The soil organic carbon contents of forest soil and grassland were 34.83 g kg−1 and 31.67 g kg−1, respectively, while the soil organic carbon content of sugarcane, maize and pitaya was 17.60 g kg−1, 16.35 g kg−1 and 14.31 g kg−1. It could be seen that the soil organic carbon contents of both AF and GL were significantly higher than that of cultivated agricultural soil (SF, CF and PF). This result indicated that long-term agricultural cultivation resulted in a relatively low level of soil organic carbon content. Forests had greater canopy cover and tree density, so it could help to accumulate more carbon in both aboveground and underground biomass [28]. Higher aboveground and underground biomass could input a large amount of carbon into the soil, thus increasing the content of soil organic carbon [29]. During the natural restoration of grassland, a large root system was formed underground. Grassland underground biomass carbon was the main source of soil organic carbon [30,31]. Therefore, grassland had a greater potential for soil carbon sequestration than farmland [32]. And most of the aboveground litter and underground biomass were removed from farmland, which limited the supply of fresh organic matter and, thus, reduced soil organic carbon content [28]. The soil was disturbed during the planting process [33,34], which also accelerated the decomposition of soil organic carbon. For soil in sugarcane and corn fields, agricultural measures such as tilling could increase the frequency of soil disturbance, accelerate the mineralization and decomposition rate of soil stable organic carbon and lead to the decline of soil organic carbon. Studies have shown that in degraded sub-humid pastures with a low SOM content, it was possible to reduce greenhouse gas emissions by abandoning tillage and ecological restoration [35]. But corn, sugarcane and pitaya were the main sources of income for local farmers, so low or loss of soil organic carbon was inevitable in the region.
3.2. Effects of Different Land Uses on Humic Fractions
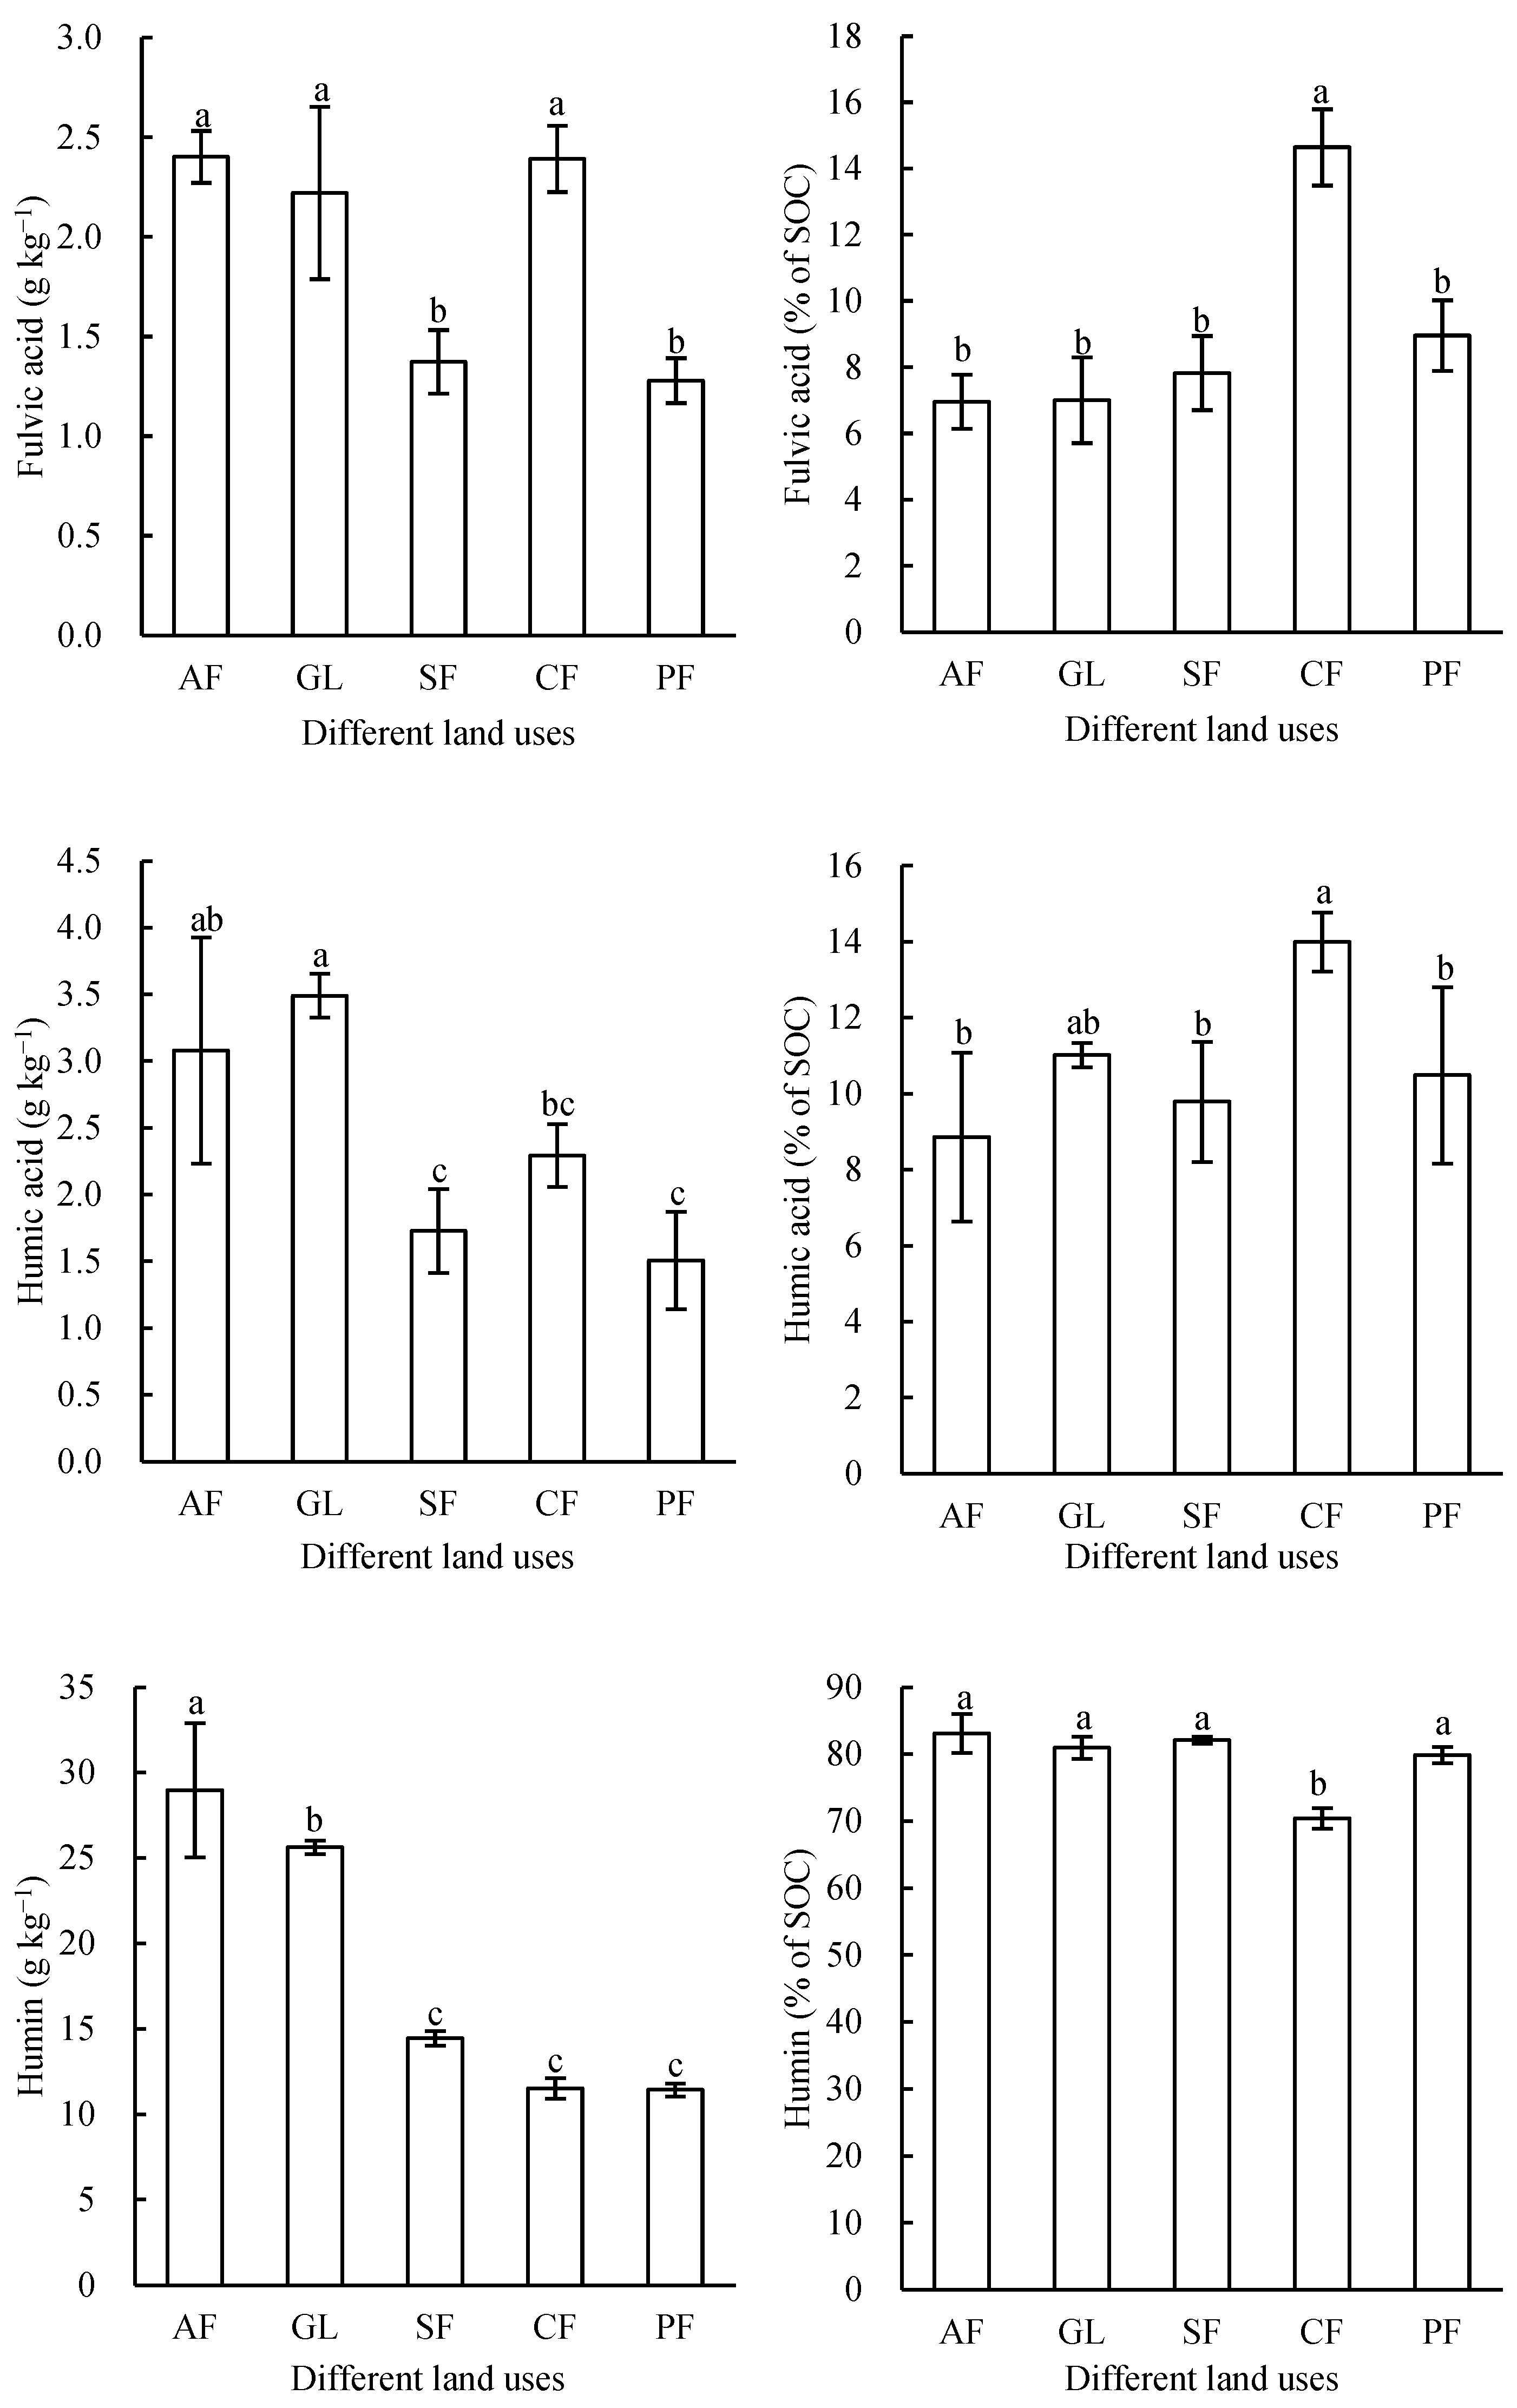
Figure 3 shows the content of humic fractions and the proportion of these fractions in soil organic carbon. Among all land uses, the content of Hu (11.43–28.97 g kg−1) was higher than that of HA (1.51–3.49 g kg−1) and FA (1.28–2.40 g kg−1). This was consistent with the results of Guimarães et al. [36]. Hayes and Swift had considered that 30–50% might be a more realistic estimate of the abundance of Hu in SOM [11].
The FA content in SF and PF was significantly lower than that in AF, GL and CF. It may be because FA in SF and dragon PF is more easily lost. This also indicated that long-term cultivation reduced the FA content in soil [37,38]. The occurrence of more intensive decomposition processes in cultivated soils negatively affected not only the total SOM, but also humic substances [38,39]. Conversely, grassland restoration could promote soil C sequestration by increasing the FA fraction, which was driven by root cellulose [30]. The HA content in SF, CF and PF was significantly lower than in GL. The Hu content in AF and GL was significantly higher than that in SF, CF and PF. These results indicated that different land uses have a certain influence on the amount of humic fraction in the same area. Hu was the most stable and decomposed fractions of organic matter, but it was also affected by tillage. Caravaca et al. had found that the concentration of Hu in cultivated soil was lower than in uncultivated soil [40].
Figure 3 also showed that the percentage of Hu (70.41–83.10%) was higher than FA (6.96–14.64%) and HA (8.86–13.99%). The high contribution of insoluble Hu components to SOC indicated the formation of a broad and strong organic–mineral complex under neutral to alkaline conditions [41]. It can also be seen from Figure 3 that, except for CF, the contribution percentages of FA, HA and Hu to the SOC of the other four land uses were not significantly different. It may be due to the fact that in these five land uses, regular tillage and fertilization practices in corn planting fields affected the contribution of percentage of humus components.
The ratios of HA/FA and HA/(HA + FA) were the most widely used indicators of soil humus quality and the degree of humification, which also reflected the degree of polymerization [42]. As can be seen from Figure 4, the comparison rules of the two ratios were consistent. The two ratios in GL were significantly higher than that in SF, but not significantly difference from other land uses. The results showed that the humic substances extracted from alkali in GL had high degree of polymerization and humification. Some studies have shown that the ratio of HA/FA decreases with grassland restoration [30,42]. However, Loke et al. reported that in one of three semi-arid sites in the grasslands of South Africa, the ratio of HA/FA declined as the primary grassland was converted to farmland and then increased with grassland restoration [38]. Both HA and FA were the fractions of HS in soil, however, HA had a more complex structure and higher degree of polymerization than FA [43,44]. Therefore, the higher the HA/FA ratio, the higher the degree of polymerization and the better the stability of the soil humic substance. Therefore, it could be seen from the figure that the average ratio of HA/FA in GL was higher than in SF, which indicated that the HS formed in GL had stronger aromaticity and condensation, so it had better stability. Except for SF, the ratios of HA/FA were greater than 1, which indicated that HA played a dominant role in the long-term evolution of the other four types of land use [30,45].
3.3. Effects of Different Land Uses on Elemental Compositions of Humic Fractions
The elemental compositions of all the humic substances isolated from different land uses is shown in Table 1. Different chemical compositions might represent evolutionary state or degrees of humification. In general, the contents of C (35.72–56.24%) and O (37.1–57.8%) were relatively high in all humic substances, while the contents of H (3.32–6.58%) and N (1.32–4.67%) were relatively low. The results showed that the element compositions of FA, HA and Hu in the study area were mainly C and O, which was consistent with previous studies [46]. It had been suggested that the atomic ratio of C/N of SOM reflected the degree of microbial decomposition of plant-derived organic matter [41]. The H/C ratio was an important indicator of the carbon degree enrichment with hydrogen and indicated the type of structure of hydrogen [47]. The O/C ratio represented the degree of oxidation [48]. The C content of FA in SF and CF was higher than that in GL and AF. But SF and CF had a lower SOC content than GL and AF. It might be that fertilization affects the distribution of the C content in FA. Other studies have reported that organic amendments increased the C contents of FA in a Calcic Kastanozem with a low SOC content [49]. The results of this study also showed that the H/C ratio of HA in the five land uses was similar. Previous studies reported that narrower H/C ratios are associated with a greater degree of humification [50]. Therefore, the degrees of humification of HA for the five land uses in this paper were high. And this was consistent with the results of their aromaticity (Table 2). Among them, the H/C ratio of HA in PF was the lowest, and its H content was also the lowest. It indicated that the HA condensation degree of PF was the highest. This might be caused by the deep oxidation of SOM, directly acting on the increase in humification [51]. The C/N ratio of HA in AF was the lowest, indicating that the nitrogen groups in AF were the most, while the C/N ratio of HA in CF was the highest, indicating that HA in CF contained fewer nitrogen groups [52,53].
Higher C/N ratios with HA in SF and Hu in PF indicated that these humic fractions contained fewer nitrogen groups, and the degree of humification was relatively low [54]. Compared with other four land uses, the O/C ratio of HA was the lowest in GL, which might indicate that HA in GL contained more newly formed organic matter [55]. As may be noted from the table, the O/C ratio of Hu in GL was the lowest. The lower oxidation degree corresponds to the lower proportion of O−alkyl C (Table 2), which means that Hu in GL contained few carbohydrates.
3.4. Structural Diversity Analysis of Humic Substances Observed by 13C NMR
The 13C NMR spectrum of all humic substances are shown in Figure 5. The relative distribution of each signal area of soil humic acids, fulvic acids and humins are listed in Table 2. It can be seen that the 13C NMR spectra of all FA were as follows: the contribution proportion of OCH3/NCH, O-alkyl C, Di-O-alkyl C and COO/N-C=O to FA was higher than that of HA and Hu. The O-alkyl C signal was a methoxy-carbon signal in lignin, an oxygen-containing carbon signal in carbohydrates [56]. The COO/N-C=O group corresponded to the carboxyl group or polypeptide and was characterized by acidity [50]. The carboxyl group was also related to the humification degree of HS [45]. The 13C NMR spectrum of alkyl C and aromatic C for all land uses generally had considerable resonance compared with FA. The 13C NMR is unable to distinguish between polyaromatic carbons and isolated rings due to the three-carbon maximum distance at which nuclear relaxation affects the nucleus in study [57]. There are some differences in the aromatic region, where the two classical well-differentiated regions can be recognized: (110–160 ppm = aromatic/unsaturated (110–145 = unsubstituted, 145–160 = heterosubstituted, vanillyl + syringil lignin units). The predominance of the first type of aromatic carbons is usually attributed to greater maturity, and the second type would indicate a greater amount of lignin, which would indicate less transformation or maturity of the organic matter [27].
3.5. The Principal Component Analysis (PCA) for Humic Substances Based on the Organic Carbon Functional Groups as Revealed by 13C NMR
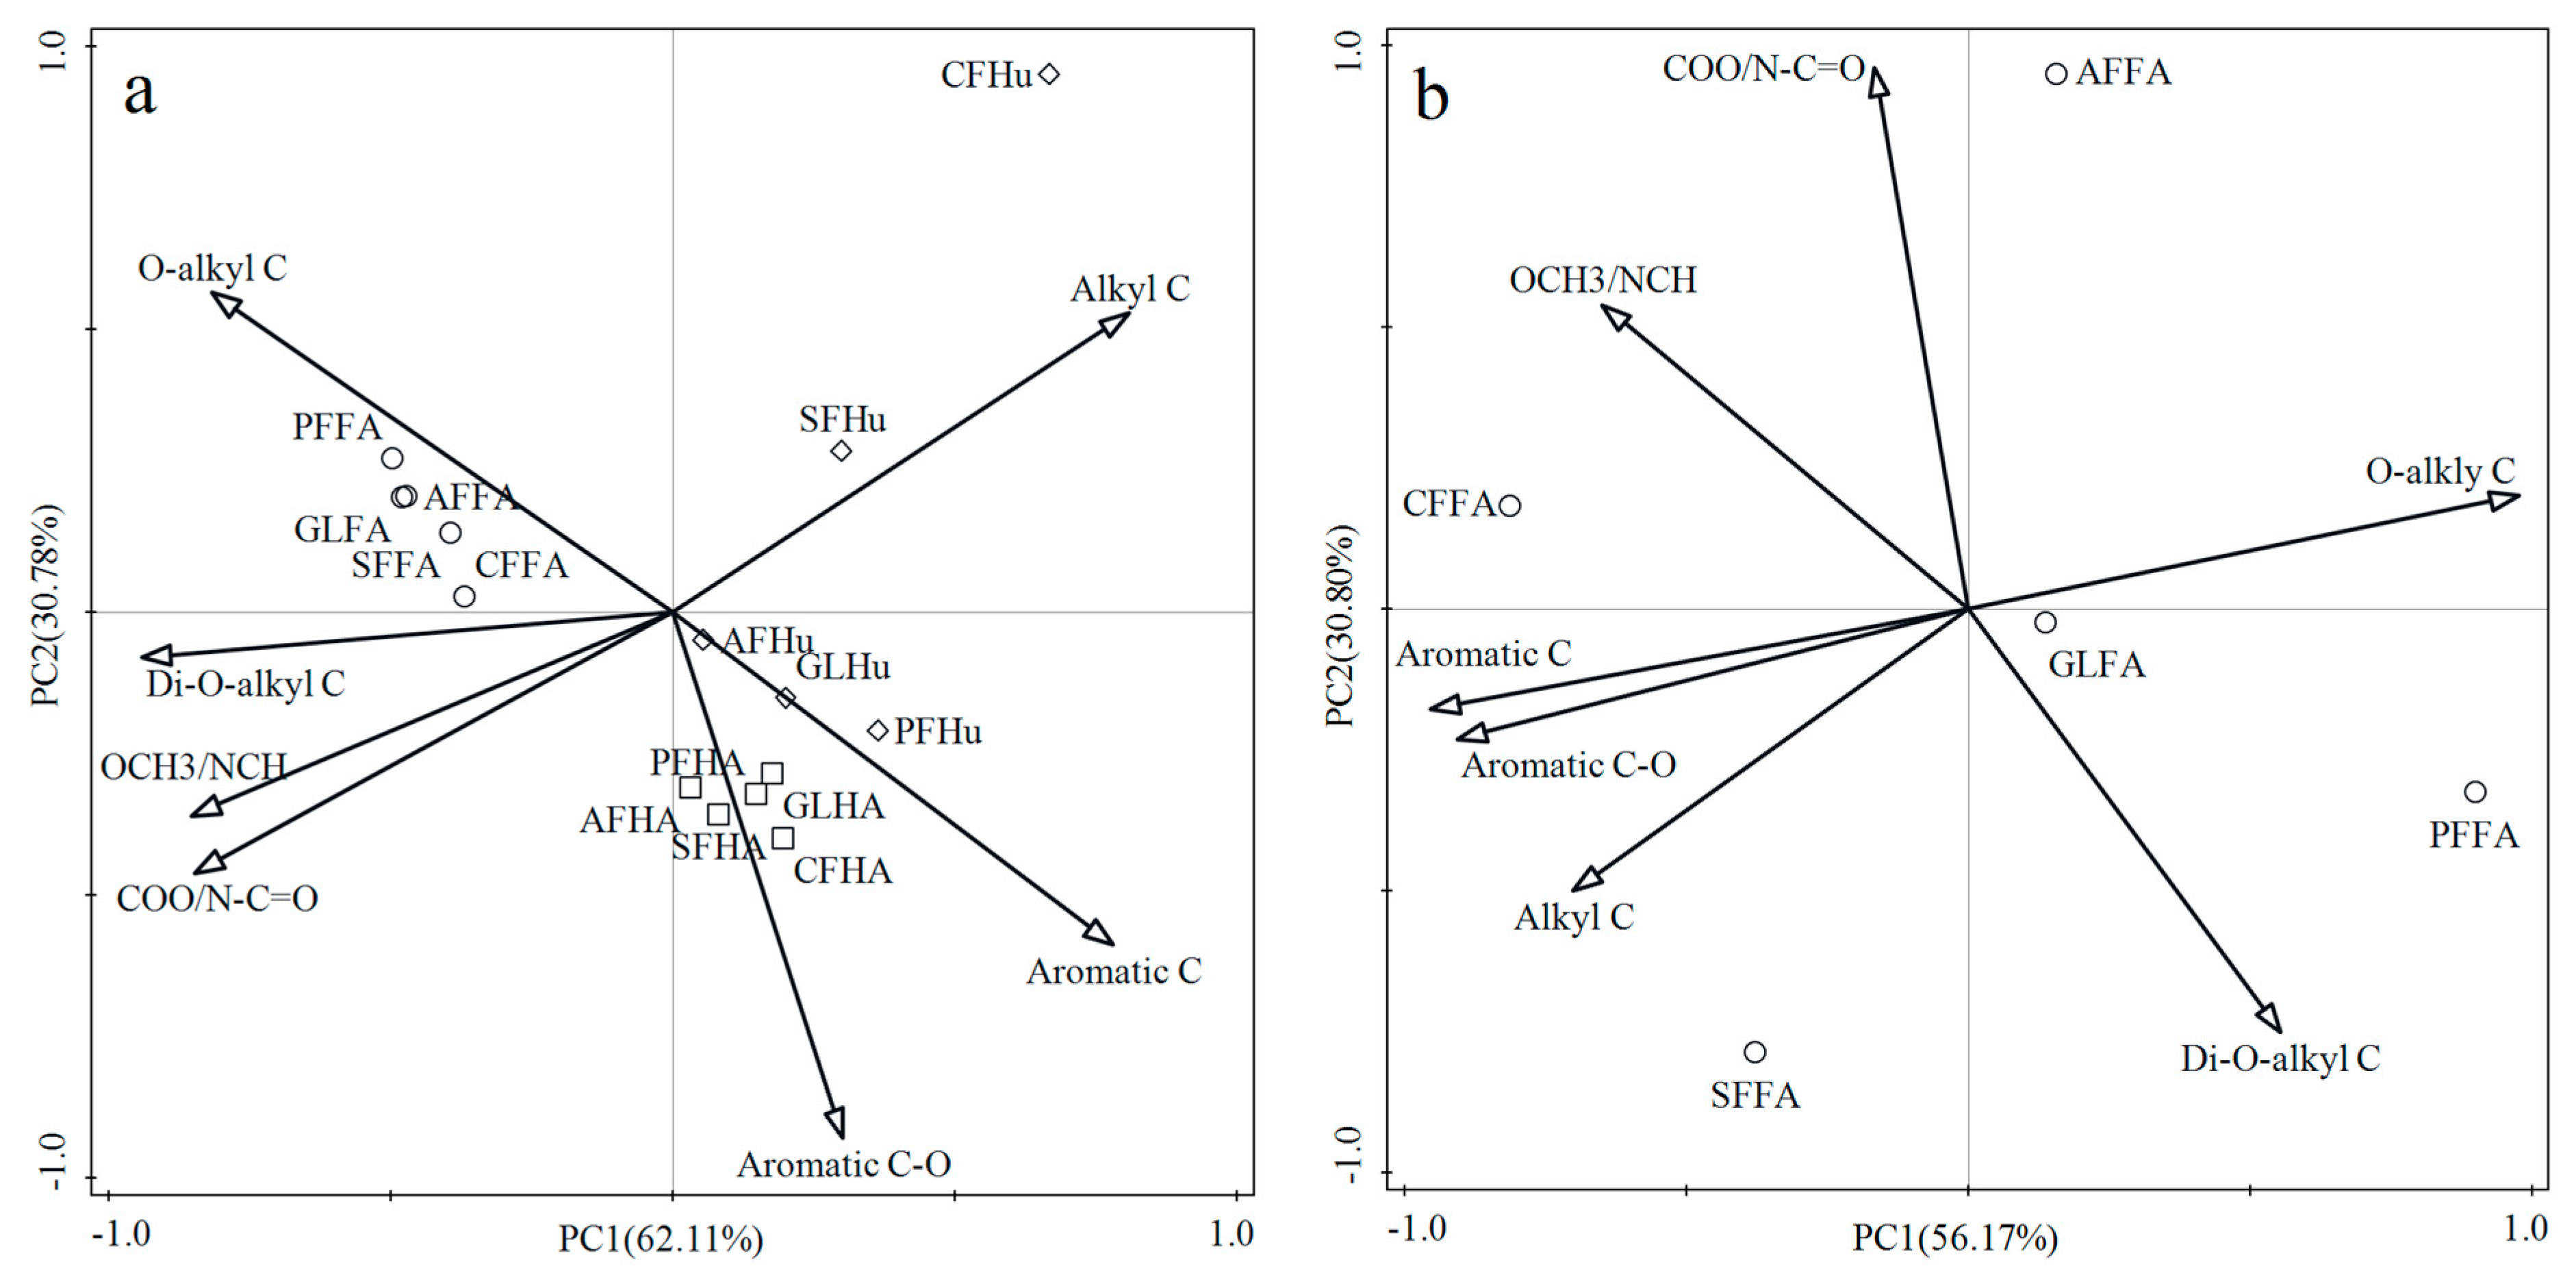
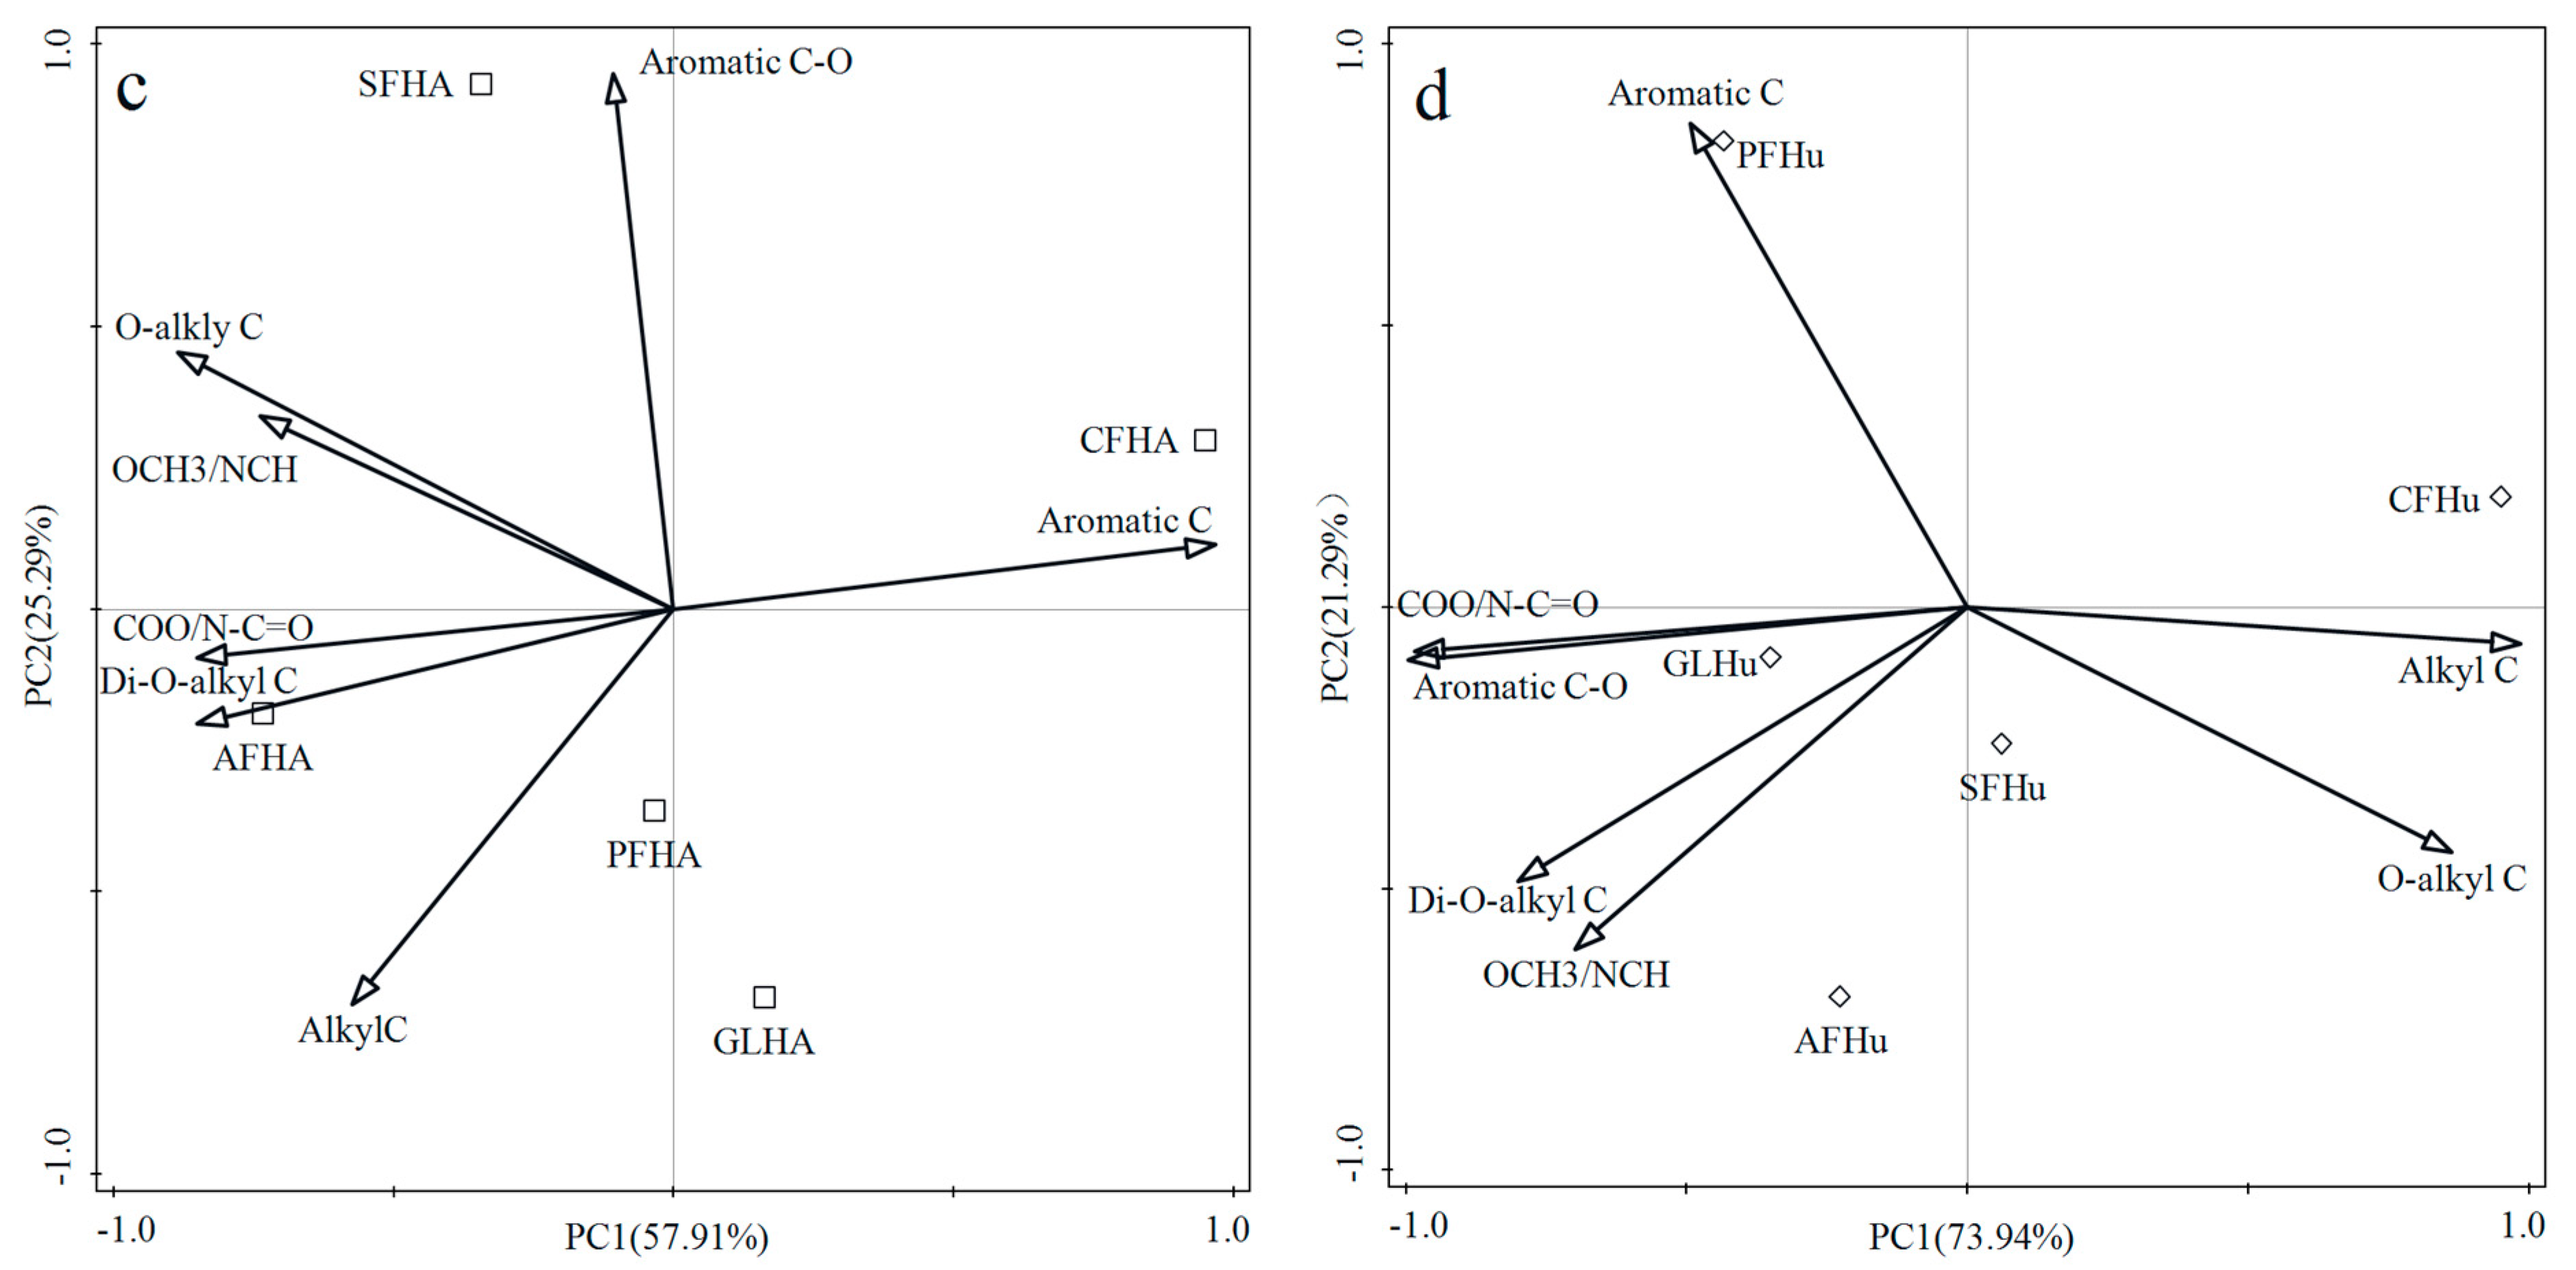
The PCA based on the functional groups of humic fractions extracted two principal components (PC1 and PC2), which described 92.89% of the total variance (Figure 6a). The resulting biplot, consisting of a score plot and a loading plot, is shown in Figure 6a. The PC1 loadings were large and positive for alkyl C and aromatic C groups and large and negative for O-alkyl C, Di-O-alkyl C, OCH3/NCH and COO/N-C=O groups. The PC2 loading was high and negative for the aromatic C-O group. The biplot also revealed differences in C functional groups of HS between land uses. The PC1 presented a separation between the FA with other humic fractions, and the FA were characterized by large abundant of O-alkyl C and Di-O-alkyl C but low amounts of alkyl C and aromatic C. The HAs formed a cluster in the fourth quadrant of biplot, indicating their enrichment in aromatic C and aromatic C-O. The distribution of Hus indicated that it was rich in alkyl C and aromatic C. As can be seen in Figure 6b–d, sample points of different land use were relatively dispersed in PCA. Therefore, the carbon skeletons of 13C NMR spectra of each humic substance under different land use were similar, but the relative contents of various functional groups were obviously different.
In the biplot of FA (Figure 6b), PF had more O-alkyl C and Di-O-alkyl C on the PC1 axis, but less aromatic C and aromatic C-O. There were more O-alkyl C and Di-O-alkyl C and less aromatic C and aromatic C-O along the PC1 axis under PF (Figure 6b). These results indicated that PF tended to increase the percentages of carbohydrates and decrease those of aromatics. As could also be seen from Table 2, PF had the highest ratio of aliphatic C/aromatic C. The ratio is an important index of humification [58]. As a fruit, pitaya was applied a lot of organic fertilizer during its growth, and withered and pruned leaves in the roots of the pitaya are used as green manure. Thus, carbohydrates, proteins, fatty acids, etc. were incorporated into the soil, resulting in the formation of FAs in pitaya soil with more aliphatic compounds. In the biplot of HA (Figure 6c), CF was significantly different from other land uses along the PC1 axis. It might be that the HA of CF had a high percentage of aromatic carbon and, therefore, had a high degree of humification. Ferrari et al. studied soils under corn cultivation fertilized with different organic and mineral fertilizers and observed that high levels of the typical aromatics and methoxy-functional groups in lignin [59]. These results were also consistent with those of Tadini et al. [52]. In the axis of PC2, there were more alkyl C of HA in GL (Figure 6c), indicating that HA of GL had a prominent aliphatic. These aliphatic compounds might be derived from microbial secretions, since microbial metabolism was one of the possible pathways of formation of humic substance described in the literature [5,60]. In the PCA plot of humin (Figure 6d), there was a significant difference in PC1 between YM treatment and other treatments, characterized by high contents of alkyl C and O-Alkyl C, and low contents of COO/N-C=O and aromatic C-O. Studies showed that alkyl C was the most stable form of SOM [61]. Hu in CF contained a large amount of alkyl C, indicating that Hu in CF was stable [62]. The aromatic C-O content of CF treatment was low, indicating a low lignin content and high maturity. Previous studies have reported a decrease in the aromatization of Hu in agricultural or forest soils after the long-term application of mineral fertilizers [63,64]. The functional group content of Hu in GL was opposite to that in CF (Figure 6d), indicating that the contents of polypeptides and carboxylic acids in Hu with GL were higher. OCH3/NCH contents were higher than that of other land uses in the 13C NMR spectra (Figure 5) and PCA plots (Figure 6) of three humic fractions in FL. Studies have shown that NCH was usually attributed to protein fragments [65]. Therefore, the abundance of protein substances in three humic fractions of FL were relatively high. The protein substances were mainly derived from microorganisms and plants, and the decomposition of forest litter might increase the accumulation of original and labile SOM in the soil [66]. The ratios of A/O-A and hydrophobic C/hydrophilic C of the three humic fractions in CF were the highest (Table 2). The A/O-A ratio were indicators of the degree of SOM decomposition and the change in organic matter [26]. The high ratio corresponded to the enhanced stability of C against degradation [67]. The Hu aromaticity index in the CF treatment was the highest, which also indicated that the Hu in the CF treatment was of high maturity and high humification decomposition intensity. CF was the most disturbed among five land uses, and the disturbance of soil might lead to the loss of active organic carbon in soil first, so the carbon components that were more difficult to decompose remained.
4. Conclusions
Our results show that soil organic carbon content in both afforestation and naturally restored grassland are significantly higher than in the sugarcane field, corn field and pitaya field. Different land uses in the same area also have a certain impact on the amount of soil humic fractions. The structural characteristics of humic fractions of five different land uses show that different land uses directly affect the structure of humic fractions. Three humic fractions in afforestation contain more unstable components. HA and Hu in grassland contain more newly formed substances and carboxylic acid compounds. The HA and Hu of corn field show high maturity. Therefore, factors such as crops grown in different land use types, field management practices, use of organic fertilizers and surface litter are incorporated into the structure of formed of humic substances in the soil. Moreover, the results of this study have important guiding significance for improving the storage and stability of soil organic carbon in karst areas.
Author Contributions
Conceptualization, investigation, methodology, validation, writing—original draft preparation, funding acquisition, T.C.; supervision, project administration, writing—review and editing, J.Z.; resources, W.L. All authors have read and agreed to the published version of the manuscript.
Funding
This research was funded by the Guangxi Natural Science Foundation (No.: 2020GXNSFBA297134), the Start−up Scientific Foundation of Nanning Normal University (No.: 602021239169) and the Opening Foundation of Key Laboratory of Earth Surface Processes and Intelligent Simulation of Nanning Normal University (No.: GTEU-KLOP-X1807).
Institutional Review Board Statement
Not applicable.
Informed Consent Statement
Not applicable.
Data Availability Statement
The data presented in this study are available in article.
Conflicts of Interest
The authors declare no conflict of interest.
References
- Chowdhury, S.; Bolan, N.; Farrell, M.; Sarkar, B.; Sarker, J.R.; Kirkham, M.B.; Hossain, M.Z.; Kim, G.-H. Chapter Two—Role of cultural and nutrient management practices in carbon sequestration in agricultural soil. In Advances in Agronomy; Sparks, D.L., Ed.; Academic Press: New York, NY, USA, 2021; Volume 166, pp. 131–196. [Google Scholar]
- Lal, R. Soil carbon sequestration to mitigate climate change. Geoderma 2004, 123, 1–22. [Google Scholar] [CrossRef]
- Tinoco, P.; Almendros, G.; González-Vila, F.J.; Sanz, J.; González-Pérez, J.A. Revisiting molecular characteristics responsive for the aromaticity of soil humic acids. J. Soils Sediments 2015, 15, 781–791. [Google Scholar] [CrossRef]
- De Nobili, M.; Bravo, C.; Chen, Y. The spontaneous secondary synthesis of soil organic matter components: A critical examination of the soil continuum model theory. Appl. Soil. Ecol. 2020, 154, 103655. [Google Scholar] [CrossRef]
- Dou, S.; Shan, J.; Song, X.; Cao, R.; Wu, M.; Li, C.; Guan, S. Are humic substances soil microbial residues or unique synthesized compounds? A perspective on their distinctiveness. Pedosphere 2020, 30, 159–167. [Google Scholar] [CrossRef]
- Berg, B.; Mcclaugherty, C. Plant Litter, Decomposition, Humus Formation, Carbon Sequestration, 4th ed.; Springer Nature Switzerland AG: Cham, Switzerland, 2020. [Google Scholar]
- Ding, Y.; Nie, Y.; Chen, H.; Wang, K.; Querejeta, J.I. Water uptake depth is coordinated with leaf water potential, water-use efficiency and drought vulnerability in karst vegetation. New Phytol. 2021, 229, 1339–1353. [Google Scholar] [CrossRef] [PubMed]
- Wang, K.; Zhang, C.; Chen, H.; Yue, Y.; Zhang, W.; Zhang, M.; Qi, X.; Fu, Z. Karst landscapes of China: Patterns, ecosystem processes and services. Landsc. Ecol. 2019, 34, 2743–2763. [Google Scholar] [CrossRef]
- Jiang, Z.; Lian, Y.; Qin, X. Rocky desertification in Southwest China: Impacts, causes, and restoration. Earth Sci. Rev. 2014, 132, 1–12. [Google Scholar] [CrossRef]
- Liu, J.; Zhang, Z.; Xu, X.; Kuang, W.; Zhou, W.; Zhang, S.; Li, R.; Yan, C.; Yu, D.; Wu, S.; et al. Spatial patterns and driving forces of land use change in China during the early 21st century. J. Geogr. Sci. 2010, 20, 483–494. [Google Scholar] [CrossRef]
- Hayes, M.H.B.; Swift, R.S. Vindication of humic substances as a key component of organic matter in soil and water. In Advances in Agronomy; Academic Press: New York, NY, USA, 2020; Volume 163, pp. 1–37. [Google Scholar]
- Wang, Z.; Yue, F.; Xue, L.; Wang, Y.; Qin, C.; Zeng, J.; Ding, H.; Fu, Y.; Li, S. Soil nitrogen transformation in different land use and implications for karst soil nitrogen loss controlling. Catena 2023, 225, 107026. [Google Scholar] [CrossRef]
- Gupta, M.K.; Sharma, S.D.; Kumar, M. Sequestered organic carbon stock in the soils under different land uses in western region of Haryana. Indian. For. 2015, 141, 718–725. [Google Scholar]
- Martí-Roura, M.; Hagedorn, F.; Rovira, P.; Romanyà, J. Effect of land use and carbonates on organic matter stabilization and microbial communities in Mediterranean soils. Geoderma 2019, 351, 103–115. [Google Scholar] [CrossRef]
- Poeplau, C.; Don, A.; Vesterdal, L.; Leifeld, J.; Van Wesemael, B.; Schumacher, J.; Gensior, A. Temporal dynamics of soil organic carbon after land-use change in the temperate zone–carbon response functions as a model approach. Glob. Chang. Biol. 2011, 17, 2415–2427. [Google Scholar] [CrossRef]
- Han, X.; Zhao, F.; Tong, X.; Deng, J.; Yang, G.; Chen, L.; Kang, D. Understanding soil carbon sequestration following the afforestation of former arable land by physical fractionation. Catena 2017, 150, 317–327. [Google Scholar] [CrossRef]
- Zhong, Z.; Han, X.; Xu, Y.; Zhang, W.; Fu, S.; Liu, W.; Ren, C.; Yang, G.; Ren, G. Effects of land use change on organic carbon dynamics associated with soil aggregate fractions on the Loess Plateau, China. Land. Degrad. Dev. 2019, 30, 1070–1082. [Google Scholar] [CrossRef]
- Volikov, A.B.; Kholodov, V.A.; Kulikova, N.A.; Philippova, O.I.; Ponomarenko, S.A.; Lasareva, E.V.; Parfyonova, A.M.; Hatfield, K.; Perminova, I.V. Silanized humic substances act as hydrophobic modifiers of soil separates inducing formation of water-stable aggregates in soils. Catena 2016, 137, 229–236. [Google Scholar] [CrossRef]
- Deng, S.; Zheng, X.; Chen, X.; Zheng, S.; He, X.; Ge, T.; Kuzyakov, Y.; Wu, J.; Su, Y.; Hu, Y. Divergent mineralization of hydrophilic and hydrophobic organic substrates and their priming effect in soils depending on their preferential utilization by bacteria and fungi. Biol. Fert. Soils 2021, 57, 65–76. [Google Scholar] [CrossRef]
- Ma, L.; Xiao, B.; Di, X.; Huang, W.; Wang, S. Characteristics and distributions of humic acids in two soil profiles of the southwest China Karst area. Acta Geochim. 2016, 35, 85–94. [Google Scholar] [CrossRef]
- Dou, S. Soil Organic Matter; Science Press: Beijing, China, 2010. [Google Scholar]
- Cui, T.; Li, Z.; Wang, S. Effects of in-situ straw decomposition on composition of humus and structure of humic acid at different soil depths. J. Soils Sediments 2017, 17, 2391–2399. [Google Scholar] [CrossRef]
- Kuwatsuka, S.; Watanabe, A.; Itoh, K.; Arai, S. Comparison of two methods of preparation of humic and fulvic acids, IHSS method and NAGOYA method. Soil. Sci. Plant Nutr. 1992, 38, 23–30. [Google Scholar] [CrossRef]
- Zhang, Z.; Liu, S.; Wang, X.; Huang, S.; Sun, K.; Xia, X. Differences in structure and composition of soil humic substances and their binding for polycyclic aromatic hydrocarbons in different climatic zones. Environ. Pollut. 2023, 322, 121121. [Google Scholar] [CrossRef]
- dos Santos, J.V.; Fregolente, L.G.; Mounier, S.; Hajjoul, H.; Ferreira, O.P.; Moreira, A.B.; Bisinoti, M.C. Fulvic acids from Amazonian anthropogenic soils: Insight into the molecular composition and copper binding properties using fluorescence techniques. Ecotoxicol. Environ. Safe 2020, 205, 111173. [Google Scholar] [CrossRef] [PubMed]
- Ji, H.; Han, J.; Xue, J.; Hatten, J.A.; Wang, M.; Guo, Y.; Li, P. Soil organic carbon pool and chemical composition under different types of land use in wetland: Implication for carbon sequestration in wetlands. Sci. Total Environ. 2020, 716, 136996. [Google Scholar] [CrossRef] [PubMed]
- de Aguiar, T.C.; de Oliveira Torchia, D.F.; van Tol de Castro, T.A.; Tavares, O.C.H.; de Abreu Lopes, S.; de Souza da Silva, L.; Castro, R.N.; Berbara, R.L.L.; Pereira, M.G.; García, A.C. Spectroscopic–chemometric modeling of 80 humic acids confirms the structural pattern identity of humified organic matter despite different formation environments. Sci. Total Environ. 2022, 833, 155133. [Google Scholar] [CrossRef]
- Gogoi, A.; Sahoo, U.K.; Saikia, H. Vegetation and ecosystem carbon recovery following shifting cultivation in Mizoram-Manipur-Kachin rainforest eco-region, Southern Asia. Ecol. Process 2020, 9, 21. [Google Scholar] [CrossRef]
- Ahirwal, J.; Gogoi, A.; Sahoo, U.K. Stability of soil organic carbon pools affected by land use and land cover changes in forests of eastern Himalayan region, India. Catena 2022, 215, 106308. [Google Scholar] [CrossRef]
- Bai, X.; Guo, Z.; Huang, Y.; An, S. Root cellulose drives soil fulvic acid carbon sequestration in the grassland restoration process. Catena 2020, 191, 104575. [Google Scholar] [CrossRef]
- Baer, S.G.; Kitchen, D.J.; Blair, J.M.; Rice, C.W. Changes in Ecosystem Structure and Function along a Chronosequence of Restored Grasslands. Ecol. Appl. 2002, 12, 1688–1701. [Google Scholar] [CrossRef]
- Lal, R.; Negassa, W.; Lorenz, K. Carbon sequestration in soil. Curr. Opin. Environ. Sustain. 2015, 15, 79–86. [Google Scholar] [CrossRef]
- Mishra, G.; Sarkar, A. Studying the relationship between total organic carbon and soil carbon pools under different land management systems of Garo hills, Meghalaya. J. Environ. Manag. 2020, 257, 110002. [Google Scholar] [CrossRef]
- Lungmuana; Singh, S.B.; Vanthawmliana; Saha, S.; Dutta, S.K.; Rambuatsaiha; Singh, A.R.; Boopathi, T. Impact of secondary forest fallow period on soil microbial biomass carbon and enzyme activity dynamics under shifting cultivation in North Eastern Hill region, India. Catena 2017, 156, 10–17. [Google Scholar] [CrossRef]
- Chu, L.; Grafton, R.Q.; Nguyen, H. A global analysis of the break-even prices to reduce atmospheric carbon dioxide via forest plantation and avoided deforestation. Policy Econ. 2022, 135, 102666. [Google Scholar] [CrossRef]
- Guimarães, D.V.; Gonzaga, M.I.S.; da Silva, T.O.; da Silva, T.L.; da Silva Dias, N.; Matias, M.I.S. Soil organic matter pools and carbon fractions in soil under different land uses. Soil. Tillage Res. 2013, 126, 177–182. [Google Scholar] [CrossRef]
- Sun, C.; Liu, J.; Wang, Y.; Zheng, N.; Wu, X.; Liu, Q. Effect of long-term cultivation on soil organic carbon fractions and metal distribution in humic and fulvic acid in black soil, Northeast China. Soil. Res. 2012, 50, 562–569. [Google Scholar] [CrossRef]
- Loke, P.F.; Kotzé, E.; Preez, C.C.; Twigge, L. Dynamics of Soil Carbon Concentrations and Quality Induced by Agricultural Land Use in Central South Africa. Soil. Sci. Soc. Am. J. 2019, 83, 366–379. [Google Scholar] [CrossRef]
- Kotzé, E.; Loke, P.F.; Akhosi-Setaka, M.C.; Du Preez, C.C. Land use change affecting soil humic substances in three semi-arid agro-ecosystems in South Africa. Agric. Ecosyst. Environ. 2016, 216, 194–202. [Google Scholar] [CrossRef]
- Caravaca, F.; Lax, A.; Albaladejo, J. Aggregate stability and carbon characteristics of particle-size fractions in cultivated and forested soils of semiarid Spain. Soil. Tillage Res. 2004, 78, 83–90. [Google Scholar] [CrossRef]
- Stevenson, F.J. Humus Chemistry: Genesis, Composition, Reactions, 2nd ed.; John Wiley & Sons: New York, NY, USA, 1994. [Google Scholar]
- Raiesi, F. The quantity and quality of soil organic matter and humic substances following dry-farming and subsequent restoration in an upland pasture. Catena 2021, 202, 105249. [Google Scholar] [CrossRef]
- Godlewska, P.; Schmidt, H.P.; Ok, Y.S.; Oleszczuk, P. Biochar for composting improvement and contaminants reduction. A review. Bioresour. Technol. 2017, 246, 193–202. [Google Scholar] [CrossRef]
- Yu, Z.; Liu, X.; Chen, C.; Liao, H.; Chen, Z.; Zhou, S. Molecular insights into the transformation of dissolved organic matter during hyperthermophilic composting using ESI FT-ICR MS. Bioresour. Technol. 2019, 292, 22007. [Google Scholar] [CrossRef]
- Abakumov, E.V.; Cajthaml, T.; Brus, J.; Frouz, J. Humus accumulation, humification, and humic acid composition in soils of two post-mining chronosequences after coal mining. J. Soils Sediments 2013, 13, 491–500. [Google Scholar] [CrossRef]
- He, S.; Zheng, Z.; Zhu, R. Long-term tea plantation effects on composition and stabilization of soil organic matter in Southwest China. Catena 2021, 199, 105132. [Google Scholar] [CrossRef]
- Polyakov, V.; Loiko, S.; Istigechev, G.; Lapidus, A.; Abakumov, E. Elemental and molecular composition of humic acids isolated from soils of tallgrass temperate rainforests (Chernevaya taiga) by1H-13C HECTCOR NMR spectroscopy. Agronomy 2021, 11, 1998. [Google Scholar] [CrossRef]
- Mielnik, L.; Hewelke, E.; Weber, J.; Oktaba, L.; Jonczak, J.; Podlasiński, M. Changes in the soil hydrophobicity and structure of humic substances in sandy soil taken out of cultivation. Agric. Ecosyst. Environ. 2021, 319, 107554. [Google Scholar] [CrossRef]
- Jindo, K.; Hernández, T.; García, C.; Sánchez-Monedero, M.A. Influence of Stability and Origin of Organic Amendments on Humification in Semiarid Soils. Soil. Sci. Soc. Am. J. 2011, 75, 2178–2187. [Google Scholar] [CrossRef]
- Tan, K.H. Humic Matter in Soil and the Environment: Principles and Controversies, 2nd ed; CRC Press: Boca Raton, FL, USA, 2014. [Google Scholar]
- Tadini, A.M.; Bernardi, A.C.C.; Milori, D.M.B.P.; Oliveira, P.P.A.; Pezzopane, J.R.M.; Martin-Neto, L. Spectroscopic characteristics of humic acids extracted from soils under different integrated agricultural production systems in tropical regions. Geoderma Reg. 2022, 28, e00476. [Google Scholar] [CrossRef]
- Tadini, A.M.; Xavier, A.A.P.; Milori, D.M.B.P.; Oliveira, P.P.A.; Pezzopane, J.R.; Bernardi, A.C.C.; Martin-Neto, L. Evaluation of soil organic matter from integrated production systems using laser-induced fluorescence spectroscopy. Soil. Till Res. 2021, 211, 105001. [Google Scholar] [CrossRef]
- Tadini, A.M.; Goranov, A.I.; Martin-Neto, L.; Bernardi, A.C.C.; Oliveira, P.P.A.; Pezzopane, J.R.M.; Hatcher, P.G. Structural characterization using 2D NMR spectroscopy and TMAH-GC × GC-MS: Application to humic acids from soils of an integrated agricultural system and an Atlantic native forest. Sci. Total Environ. 2022, 815, 152605. [Google Scholar] [CrossRef] [PubMed]
- Dou, S.; Chen, E.; Xu, X.; Tan, S.; Zhang, J. Effect of improving soil fertility by organic material application (ISFOMA) on structural characteristics of humic acids in soil. Acta Pedol. Sin. 1992, 29, 199–207. [Google Scholar]
- Aranda, V.; Macci, C.; Peruzzi, E.; Masciandaro, G. Biochemical activity and chemical-structural properties of soil organic matter after 17 years of amendments with olive-mill pomace co-compost. J. Environ. Manag. 2015, 147, 278–285. [Google Scholar] [CrossRef]
- Spaccini, R.; Piccolo, A. Molecular characteristics of humic acids extracted from compost at increasing maturity stages. Soil. Biol. Biochem. 2009, 41, 1164–1172. [Google Scholar] [CrossRef]
- Vinci, G.; Cangemi, S.; Bridoux, M.; Spaccini, R.; Piccolo, A. Molecular properties of the Humeome of two calcareous grassland soils as revealed by GC/qTOF-MS and NMR spectroscopy. Chemosphere 2021, 279, 130518. [Google Scholar] [CrossRef]
- Xu, J.; Zhao, B.; Li, Z.; Chu, W.; Mao, J.; Olk, D.C.; Zhang, J.; Xin, X.; Wei, W. Demonstration of chemical distinction among soil humic fractions using quantitative solid-state 13C NMR. J. Agric. Food Chem. 2019, 67, 8107–8118. [Google Scholar] [CrossRef]
- Ferrari, E.; Francioso, O.; Nardi, S.; Saladini, M.; Ferro, N.D.; Morari, F. DRIFT and HR MAS NMR characterization of humic substances from a soil treated with different organic and mineral fertilizers. J. Mol. Struct. 2011, 998, 216–224. [Google Scholar] [CrossRef]
- Guo, X.; Liu, H.; Wu, S. Humic substances developed during organic waste composting: Formation mechanisms, structural properties, and agronomic functions. Sci. Total Environ. 2019, 662, 501–510. [Google Scholar] [CrossRef] [PubMed]
- Gao, L.; Wang, B.; Li, S.; Han, Y.; Zhang, X.; Gong, D.; Ma, M.; Liang, G.; Wu, H.; Wu, X.; et al. Effects of different long-term tillage systems on the composition of organic matter by 13C CP/TOSS NMR in physical fractions in the Loess Plateau of China. Soil. Tillage Res. 2019, 194, 104321. [Google Scholar] [CrossRef]
- Mylotte, R.; Verheyen, V.; Reynolds, A.; Dalton, C.; Patti, A.F.; Chang, R.R.; Burdon, J.; Hayes, M.H.B. Isolation and characterisation of recalcitrant organic components from an estuarine sediment core. J. Soils Sediments 2015, 15, 211–224. [Google Scholar] [CrossRef]
- Zhang, J.; Dou, S.; Song, X. Effect of long-term combined nitrogen and phosphorus fertilizer application on 13C CPMAS NMR spectra of humin in a typic hapludoll of northeast China. Eur. J. Soil. Sci. 2009, 60, 966–973. [Google Scholar] [CrossRef]
- Preston, C.M.; Newman, R.H. A long-term effect of N fertilization on the 13C CPMAS NMR of de-ashed soil humin in a second-growth Douglas-fir stand of coastal British Columbia. Geoderma 1995, 68, 229–241. [Google Scholar] [CrossRef]
- Zhou, Z.; Chen, N.; Cao, X.; Chua, T.; Mao, J.; Mandel, R.D.; Bettis, E.A.; Thompson, M.L. Composition of clay-fraction organic matter in Holocene paleosols revealed by advanced solid-state NMR spectroscopy. Geoderma 2014, 223–225, 54–61. [Google Scholar] [CrossRef]
- Hayes, M.H.B.; Mylotte, R.; Swift, R.S. Humin: Its Composition and Importance in Soil Organic Matter. In Advances in Agronomy; Academic Press: New York, NY, USA, 2017; Volume 143, pp. 47–138. [Google Scholar]
- Sun, H.; Jiang, J.; Cui, L.; Feng, W.; Wang, Y.; Zhang, J. Soil organic carbon stabilization mechanisms in a subtropical mangrove and salt marsh ecosystems. Sci. Total Environ. 2019, 673, 502–510. [Google Scholar] [CrossRef]
Figure 1.
The map of the location of the Pingguo National Field Observation and Research Station of Karst Ecosystem, Guangxi.
Figure 1.
The map of the location of the Pingguo National Field Observation and Research Station of Karst Ecosystem, Guangxi.
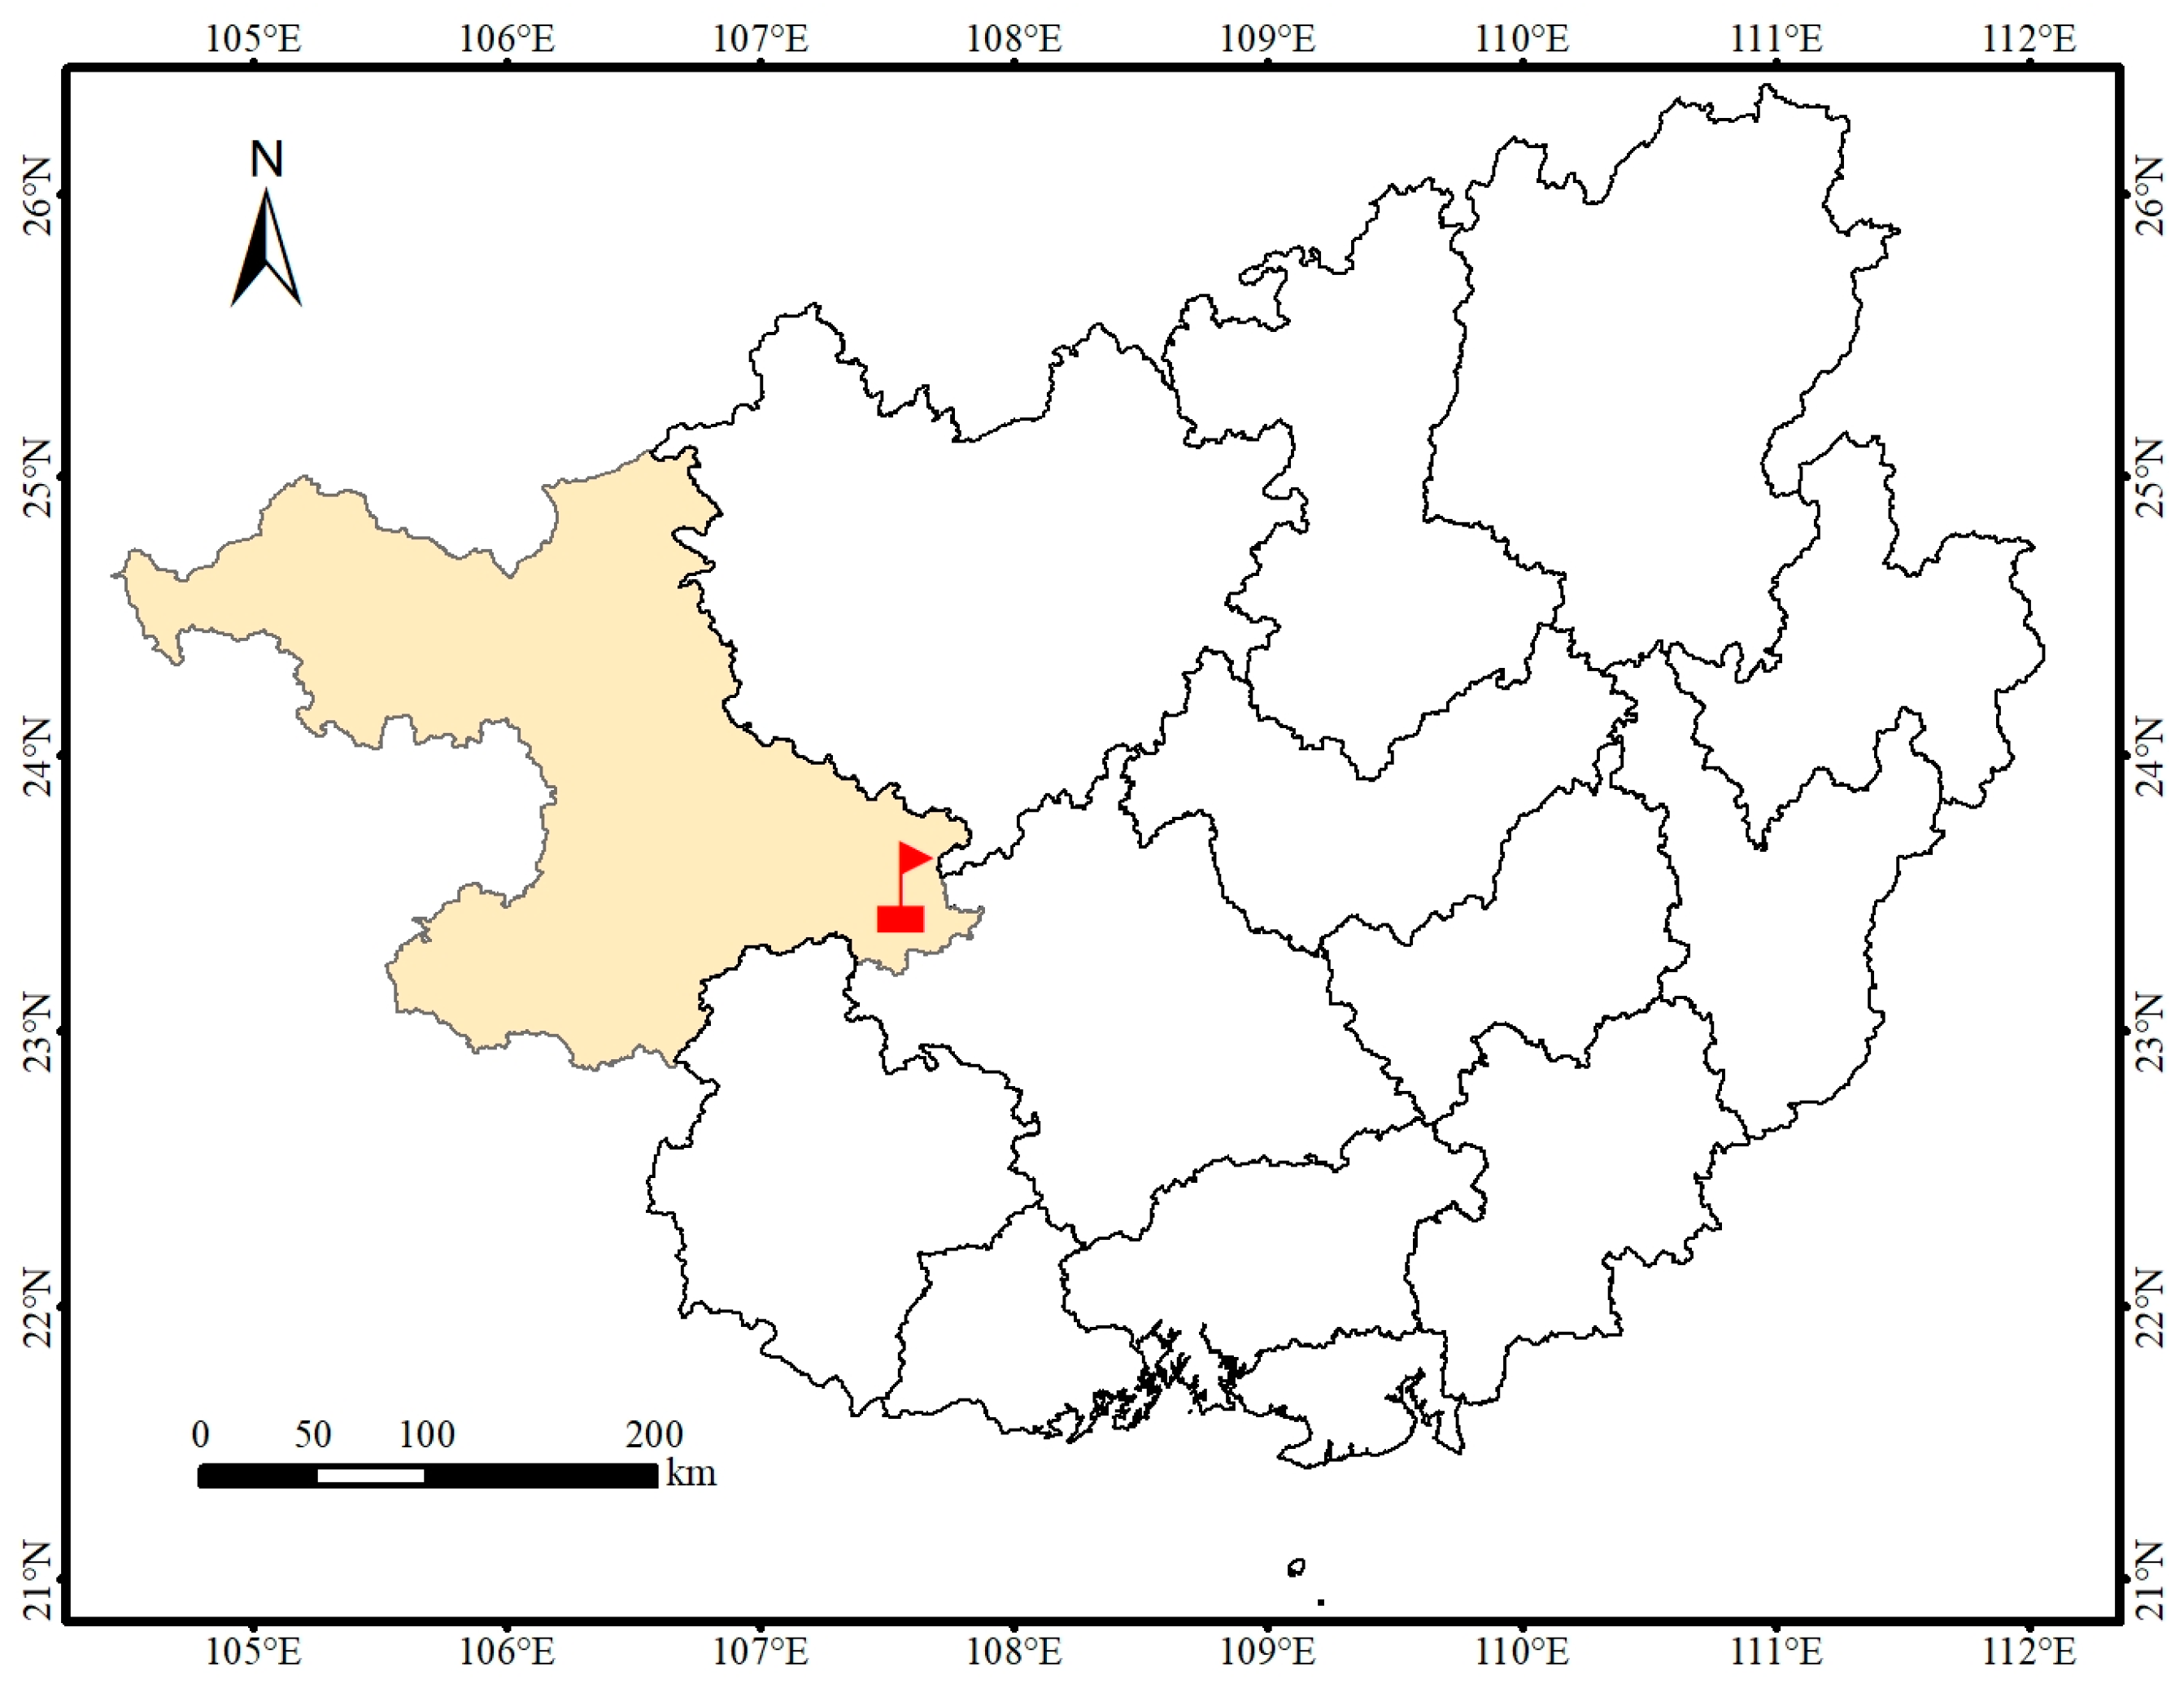
Figure 2.
Soil organic carbon content in five different land uses. Error bars represent the standard deviations of the mean (n = 3). Different lowercase letters indicate significant differences among different land uses (p < 0.05). AF: afforestation, GL: grassland, SF: sugarcane field, CF: corn field, PF: pitaya field.
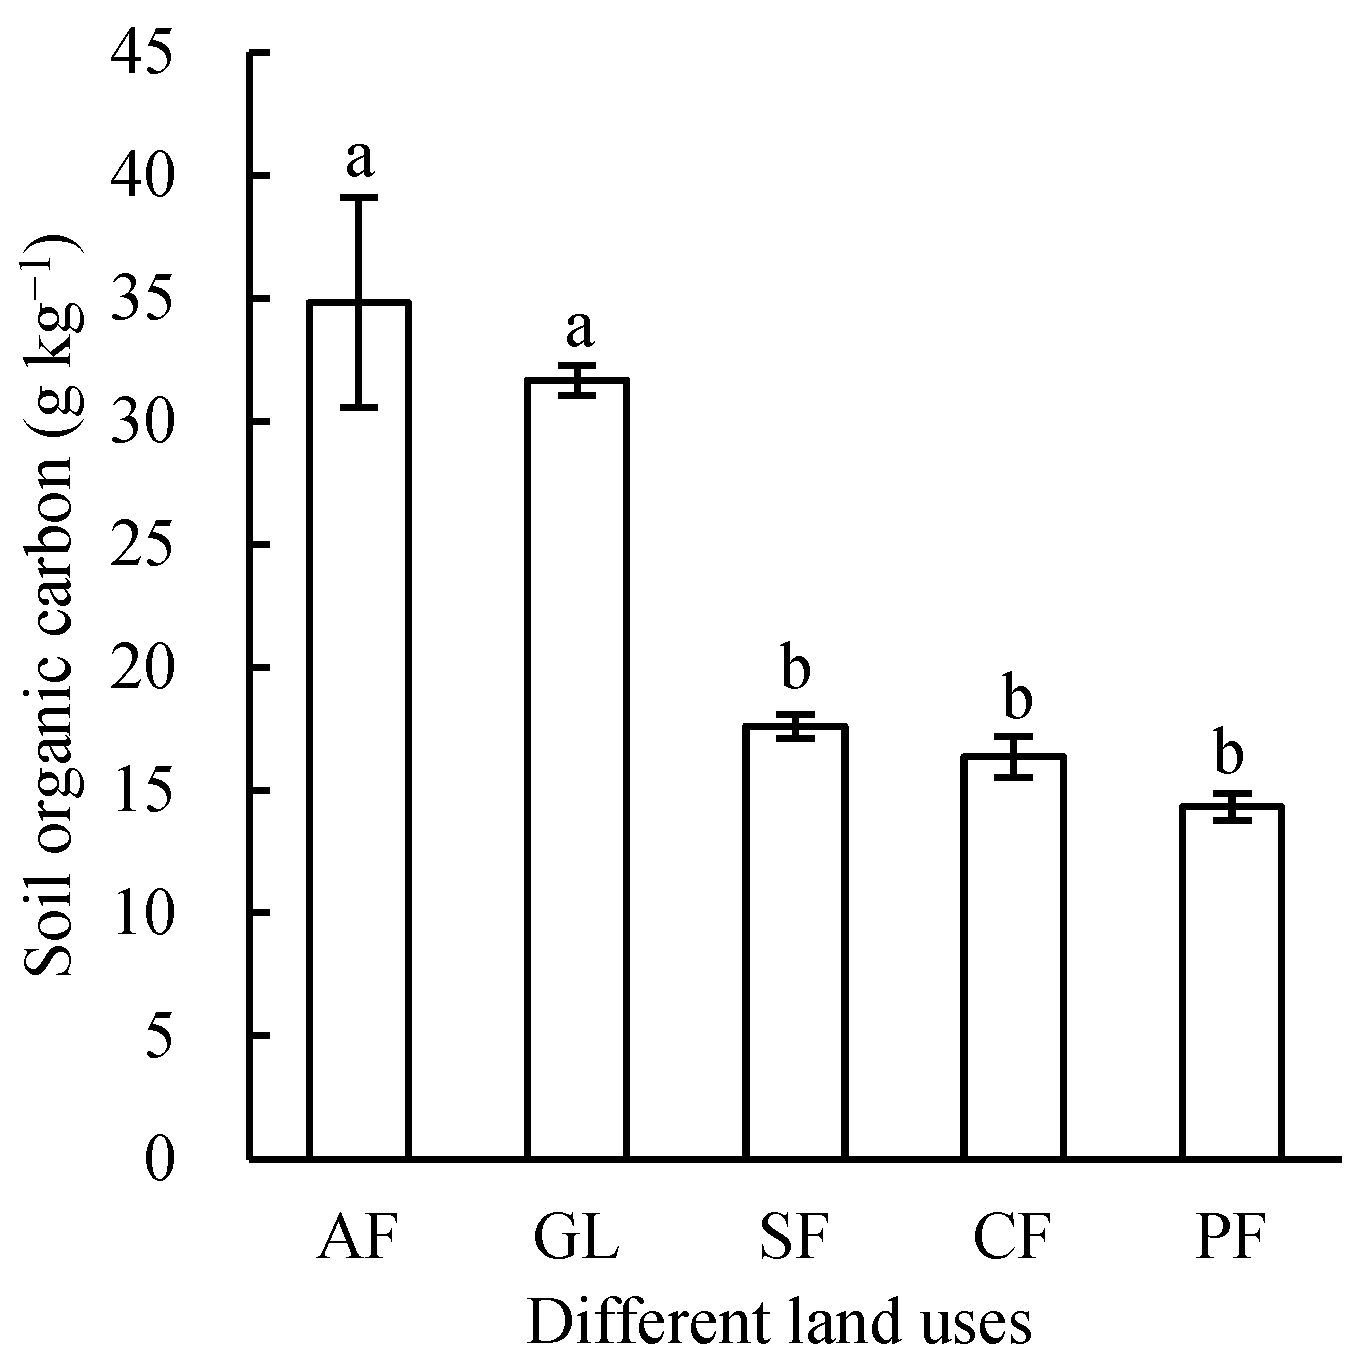
Figure 3.
Contents of humic fractions under different land uses. Error bars represent the standard deviations of the mean (n = 3). Different lowercase letters indicate significant differences among different land uses (p < 0.05). AF: afforestation, GL: grassland, SF: sugarcane field, CF: corn field, PF: pitaya field.

Figure 4.
Humus quality under different land uses. Error bars represent the standard deviations of the mean (n = 3). Different lowercase letters indicate significant differences among different land uses (p < 0.05). AF: afforestation, GL: grassland, SF: sugarcane field, CF: corn field, PF: pitaya field.
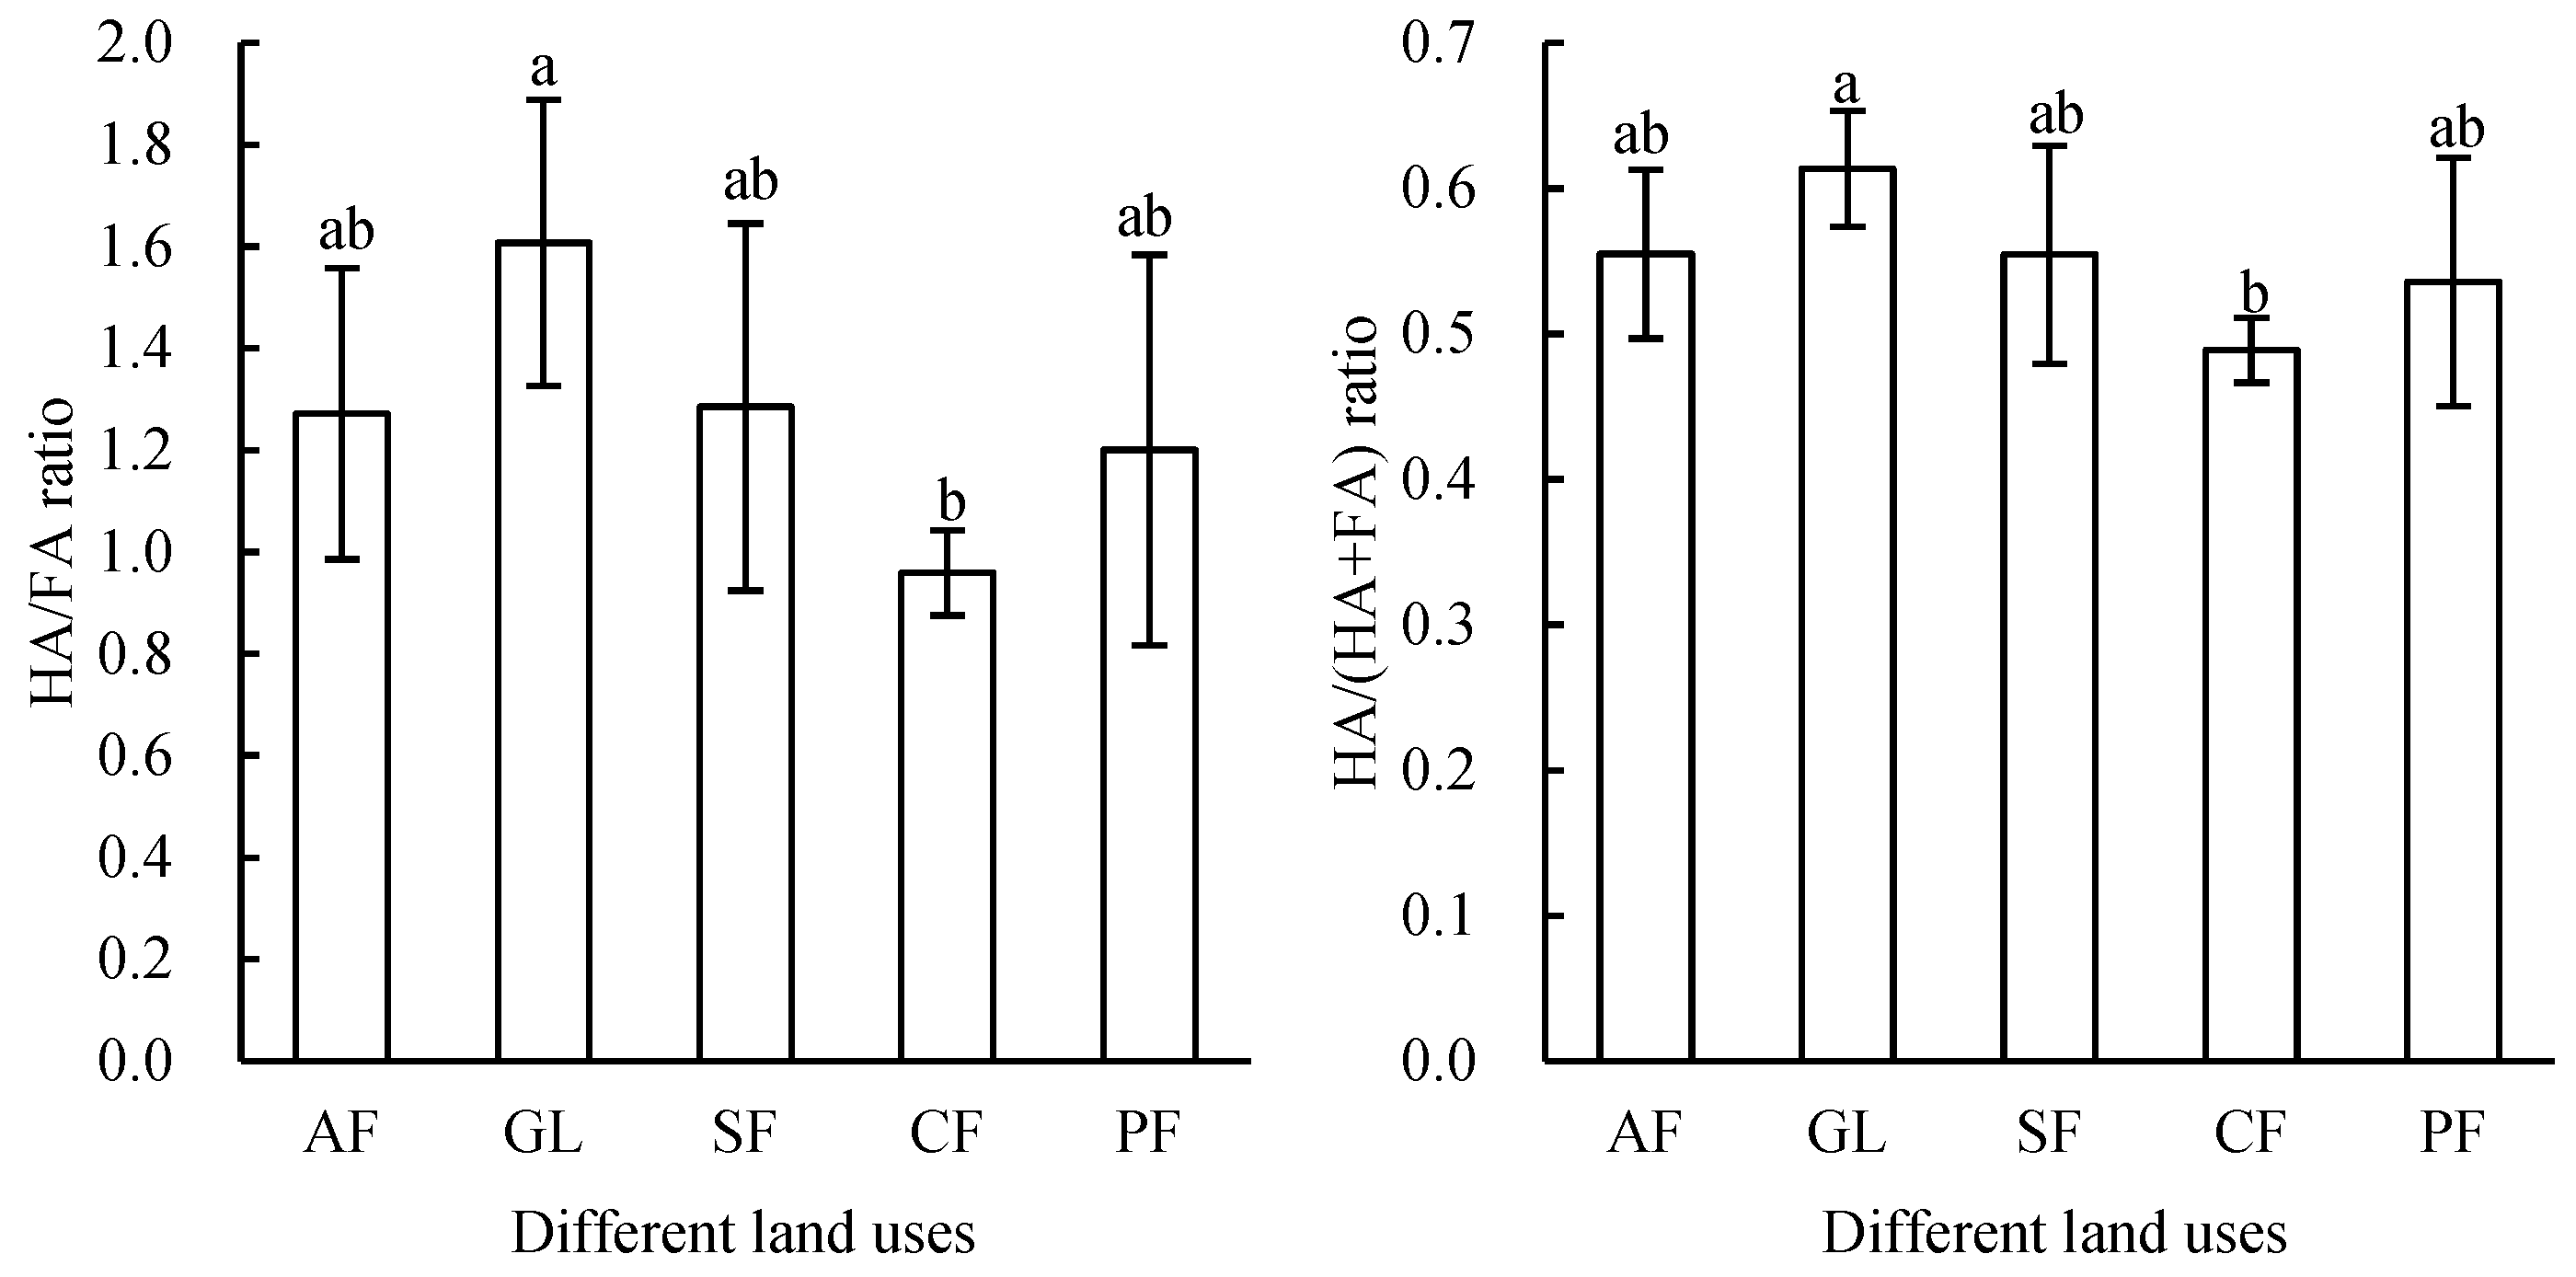
Figure 5.
13C cross polarization/total side-band suppression (CP/TOSS) NMR spectra acquired from humic substances for five land uses. AF: afforestation, GL: grassland, SF: sugarcane field, CF: corn field, PF: pitaya field, FA: fulvic acid, HA: humic acid, Hu: humin.
Figure 5.
13C cross polarization/total side-band suppression (CP/TOSS) NMR spectra acquired from humic substances for five land uses. AF: afforestation, GL: grassland, SF: sugarcane field, CF: corn field, PF: pitaya field, FA: fulvic acid, HA: humic acid, Hu: humin.

Figure 6.
Biplot generated by principal component analysis for (a) functional groups of fulvic acids, humic acids and humins, (b) functional groups of FA from all soils, (c) functional groups of HA from all soils and (d) functional groups of Hu from all soils. AF: afforestation, GL: grassland, SF: sugarcane field, CF: corn field, PF: pitaya field, FA: fulvic acid, HA: humic acid, Hu: humin.

Table 1.
Elemental analyses of humic fractions under different land uses. AF: afforestation, GL: grassland, SF: sugarcane field, CF: corn field, PF: pitaya field, FA: fulvic acid, HA: humic acid, Hu: humin.
Table 1.
Elemental analyses of humic fractions under different land uses. AF: afforestation, GL: grassland, SF: sugarcane field, CF: corn field, PF: pitaya field, FA: fulvic acid, HA: humic acid, Hu: humin.
| C (%) | H (%) | N (%) | O (%) | C/N | H/C | O/C | |
|---|---|---|---|---|---|---|---|
| GL-Hu | 56.24 | 5.25 | 4.01 | 34.5 | 16.37 | 1.12 | 0.46 |
| AF-Hu | 55.27 | 5.49 | 3.54 | 35.7 | 18.24 | 1.19 | 0.48 |
| SF-Hu | 45.19 | 6.58 | 2.04 | 46.2 | 25.85 | 1.75 | 0.77 |
| CF-Hu | 41.51 | 6.33 | 2.34 | 49.8 | 20.70 | 1.83 | 0.90 |
| PF-Hu | 36.99 | 3.32 | 1.90 | 57.8 | 22.74 | 1.08 | 1.17 |
| GL-HA | 53.73 | 4.71 | 4.42 | 37.1 | 14.18 | 1.05 | 0.52 |
| AF-HA | 52.82 | 4.83 | 4.67 | 37.7 | 13.18 | 1.10 | 0.54 |
| SF-HA | 51.80 | 4.62 | 4.07 | 39.5 | 14.86 | 1.07 | 0.57 |
| CF-HA | 52.56 | 4.59 | 3.99 | 38.9 | 15.36 | 1.05 | 0.55 |
| PF-HA | 53.27 | 4.57 | 4.03 | 38.1 | 15.41 | 1.03 | 0.54 |
| GL-FA | 37.78 | 5.51 | 2.18 | 54.5 | 20.26 | 1.75 | 1.08 |
| AF-FA | 35.72 | 5.16 | 1.32 | 57.8 | 31.50 | 1.73 | 1.21 |
| SF-FA | 54.35 | 6.28 | 2.21 | 37.2 | 28.65 | 1.39 | 0.51 |
| CF-FA | 47.38 | 5.32 | 2.50 | 44.8 | 22.11 | 1.35 | 0.71 |
| PF-FA | 36.57 | 5.02 | 1.97 | 56.4 | 21.71 | 1.65 | 1.16 |
Table 2.
Chemical composition of organic matter (% organic carbon functional groups) in humic substances extracted from five land uses’ soil. AF: afforestation, GL: grassland, SF: sugarcane field, CF: corn field, PF: pitaya field.
Table 2.
Chemical composition of organic matter (% organic carbon functional groups) in humic substances extracted from five land uses’ soil. AF: afforestation, GL: grassland, SF: sugarcane field, CF: corn field, PF: pitaya field.
| Alkyl C | OCH3/NCH | O-Alkyl C | Di-O-Alkyl C | Aromatic C | Aromatic C-O | COO/N-C=O | Alkyl C/O-Alkyl C | Aliphatic C/Aromatic C | Hydrophobic C/Hydrophilic C | Aromaticity | |
|---|---|---|---|---|---|---|---|---|---|---|---|
| 0–45 | 45–60 | 60–90 | 90–110 | 110–145 | 145–160 | 160–190 | |||||
| Fulvic acid | |||||||||||
| CD | 13.57 | 8.20 | 30.29 | 10.10 | 15.93 | 3.79 | 19.25 | 0.28 | 3.15 | 0.49 | 4.21 |
| LD | 12.34 | 8.27 | 31.60 | 8.49 | 15.40 | 3.74 | 20.16 | 0.26 | 3.17 | 0.46 | 4.12 |
| GZ | 14.55 | 8.12 | 27.58 | 9.81 | 17.60 | 4.57 | 17.77 | 0.32 | 2.71 | 0.58 | 3.85 |
| HL | 11.76 | 7.81 | 33.46 | 10.22 | 14.75 | 3.66 | 18.32 | 0.23 | 3.43 | 0.43 | 4.03 |
| YM | 13.29 | 8.19 | 26.04 | 8.59 | 19.19 | 5.10 | 19.60 | 0.31 | 2.31 | 0.60 | 3.76 |
| Humic acid | |||||||||||
| CD | 20.56 | 6.39 | 9.78 | 5.39 | 33.73 | 7.78 | 16.37 | 0.95 | 1.01 | 1.64 | 4.33 |
| LD | 19.83 | 8.17 | 11.48 | 5.91 | 30.09 | 7.83 | 16.52 | 0.78 | 1.20 | 1.37 | 3.84 |
| GZ | 17.48 | 7.39 | 11.93 | 5.55 | 32.77 | 8.24 | 16.64 | 0.70 | 1.03 | 1.41 | 3.98 |
| HL | 18.12 | 6.34 | 10.51 | 5.80 | 34.96 | 7.79 | 16.67 | 0.80 | 0.95 | 1.55 | 4.49 |
| YM | 16.02 | 6.58 | 9.27 | 5.23 | 39.12 | 7.93 | 15.68 | 0.76 | 0.79 | 1.72 | 4.94 |
| Humin | |||||||||||
| CD | 26.25 | 7.09 | 11.02 | 4.99 | 29.40 | 7.87 | 13.65 | 1.14 | 1.32 | 1.73 | 3.73 |
| LD | 25.00 | 7.73 | 15.21 | 7.47 | 25.52 | 7.47 | 11.60 | 0.82 | 1.68 | 1.38 | 3.41 |
| GZ | 31.66 | 4.70 | 15.05 | 6.27 | 26.96 | 5.64 | 9.72 | 1.22 | 1.77 | 1.80 | 4.78 |
| HL | 20.21 | 4.79 | 10.21 | 5.00 | 39.58 | 7.71 | 12.29 | 1.01 | 0.85 | 2.09 | 5.14 |
| YM | 46.45 | 3.32 | 18.01 | 0.47 | 26.54 | 1.42 | 3.79 | 2.13 | 2.44 | 2.91 | 18.67 |
Disclaimer/Publisher’s Note: The statements, opinions and data contained in all publications are solely those of the individual author(s) and contributor(s) and not of MDPI and/or the editor(s). MDPI and/or the editor(s) disclaim responsibility for any injury to people or property resulting from any ideas, methods, instructions or products referred to in the content. |
© 2023 by the authors. Licensee MDPI, Basel, Switzerland. This article is an open access article distributed under the terms and conditions of the Creative Commons Attribution (CC BY) license (https://creativecommons.org/licenses/by/4.0/).
Share and Cite
MDPI and ACS Style
Cui, T.; Zhang, J.; Luo, W. The Quantity and Quality of Humic Substances following Different Land Uses in Karst Peak-Cluster Depression in Guangxi, China. Agriculture 2023, 13, 2246. https://doi.org/10.3390/agriculture13122246
AMA Style
Cui T, Zhang J, Luo W. The Quantity and Quality of Humic Substances following Different Land Uses in Karst Peak-Cluster Depression in Guangxi, China. Agriculture. 2023; 13(12):2246. https://doi.org/10.3390/agriculture13122246
Chicago/Turabian StyleCui, Tingting, Jianbing Zhang, and Weiqun Luo. 2023. "The Quantity and Quality of Humic Substances following Different Land Uses in Karst Peak-Cluster Depression in Guangxi, China" Agriculture 13, no. 12: 2246. https://doi.org/10.3390/agriculture13122246
Note that from the first issue of 2016, this journal uses article numbers instead of page numbers. See further details here.