
Evaluation of Microbiological and Chemical Properties of Soils as a Result of Anthropogenic Denudation

1
Department of Microbiology and Food Technology, Faculty of Agriculture and Biotechnology, Bydgoszcz University of Science and Technology, 6 Bernardyńska Street, 85-029 Bydgoszcz, Poland
2
Department of Biogeochemistry and Soil Science, Faculty of Agriculture and Biotechnology, Bydgoszcz University of Science and Technology, 6 Bernardyńska Street, 85-029 Bydgoszcz, Poland
*
Author to whom correspondence should be addressed.
Agriculture 2023, 13(12), 2247; https://doi.org/10.3390/agriculture13122247
Submission received: 12 November 2023
/
Revised: 30 November 2023
/
Accepted: 4 December 2023
/
Published: 6 December 2023
(This article belongs to the Special Issue Soil Management for Sustainable Agriculture)
Abstract
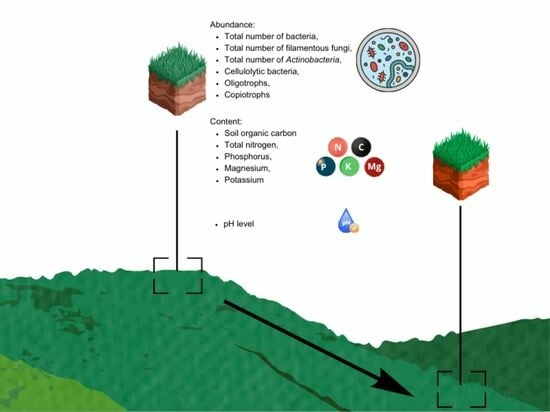
:Excessive agricultural intensification adversely affects soil quality, particularly in hilly terrain, leading to increased erosion. Anthropogenic denudation, intensified by tillage erosion, results in the displacement of soil material from hilltops and shoulders to their bases. The research hypothesis posits that tillage erosion adversely affects the microbiological and chemical properties of soils, especially at the hilltops of intensively cultivated areas. The study aimed to assess the microbiological and chemical properties of Luvisols cultivated under conventional plowing in the moraine region of the Southern Krajna Lakeland, Poland. The evaluation focused on the results of soil sample analyses taken from the hilltops and foothills of eroded mounds. Microbiological investigations included determining the abundance of actinomycetes, filamentous fungi, heterotrophic bacteria, cellulolytic microorganisms, copiotrophs, and oligotrophs. Additionally, pH values and the contents of phosphorus, potassium, magnesium, total organic carbon, and nitrogen were determined. A higher abundance of bacteria, actinomycetes, and copiotrophs was observed at the foothills. Statistically significant differences due to slope effects were noted for all chemical parameters, with higher concentrations of organic carbon, nitrogen, potassium, and phosphorus found in the foothill areas. Understanding denudation processes can contribute to sustainable soil resource use and agrocenosis conservation.
1. Introduction
The increasing pressure on natural resources, driven by population growth and the consequent need to enhance food production, is one of the contemporary challenges facing the maintenance, protection, and restoration of agrobiocenosis [1,2]. Agricultural production itself is critically tied to the soil; initially, the growth of production relied on expanding the cultivated land area (currently approximately 1.6 billion hectares). Over time, however, investments in agricultural intensification, understood as an increase in crop production per unit area, have increased [3]. Such a condition has the potential to disrupt the sustainable development of agriculture, characterized by the system’s capacity to consistently uphold food production without exerting degradative impacts on the natural environment [4]. Sustaining global efforts to monitor changes occurring directly in the soil and indirectly in agriculture allows for early identification of threats related to environmental protection and the global food production system. There is a scientific consensus confirming that systematic monitoring of soil erosion is a key element in the effective implementation of sustainable agricultural practices. Understanding erosion processes and their impact on soil structure and chemical and microbial composition is fundamental to achieving a sustainable ecological balance [5]. Detailed microbiological and chemical analyses of soil enable an understanding of the causes, prevention, minimization, and combatting of the adverse effects of soil degradation [6,7,8]. To this end, tools based on indicators of potential risk of soil productivity loss have been implemented to enable the predictive control of agroecosystems [9].
The intensification of agricultural production, particularly in developed countries, coupled with the occurrence of extreme weather events, has the potential to disrupt water relations and induce alterations in the soil environment, including phenomena such as cracking, crusting, and degradation of soil structure and aggregation [8,10]. The erosion rate is not only dependent on the topography and climatic conditions. Numerous factors influence the intensity of soil degradation processes, including soil type, texture, aggregate structure, cultivation system, cultivation practices, and the type of cultivated plant [9,11]. An additional factor influencing the acceleration of soil erosion processes is the socio-economic factors that impact the selection of environmentally unfavorable practices within the farming system [12]. The problem of soil erosion is so significant that it has been classified as the greatest global threat to soil functionality and health, thus affecting humanity’s food security [13,14].
One of the key indicators of soil quality is soil microbiota. A detailed understanding of the dynamics of changes within specific groups of microorganisms in the soil environment is crucial, given that soil microbiota constitutes a significant component of the ecosystem’s response to erosive processes [15]. The rapid response of soil microorganisms is attributed to their reaction to the degradative impact of erosive processes on abiotic factors (pH, particle size composition, carbon, and nitrogen content), which directly shape the populations of fungi and bacteria [16]. Subsequently, alterations and disturbances in soil microbiota result in changes related to the availability of elements, nitrogen and phosphorus binding, organic matter accumulation, and mass and energy cycling. These processes ultimately exert a negative impact on the physiological stress of plants, leading to a decline in crop yield [17,18].
Luvisols, the prevailing soil group in the lowland and upland areas of Poland, significantly impact agricultural production due to their classification as relatively fertile soils [4]. Currently, soil degradation in Europe is a recognized and growing issue. This phenomenon is particularly noticeable in moraine areas, where slope processes lead to the displacement of soil material from the summit of the slope towards the foothills [6,19]. Inappropriate cultivation practices intensify the denudation effect on the soil, recognized as the surface lowering of the slope in a terrain with relief. The process of slope erosion is comprehensive and can involve the entire soil profile, ranging from the topsoil layer to the bedrock [6,20]. Anthropogenic denudation (accelerated erosion) is recognized as one of the more serious threats to the geoenvironment, given its impact on the productivity of plant production [2]. It is worth noting that areas subjected to significant anthropogenic pressure, particularly since the beginning of human settlement, are especially vulnerable. Currently, these processes intensify due to deforestation, extensive drainage networks, and, above all, as a result of agricultural intensification and the use of advanced agricultural machinery. This accelerates the truncation of pedons and leads to the exposure of deeper genetic horizons in soil profiles on elevated terrain, potentially resulting in physical, chemical, and biological changes in soil properties. This phenomenon applies not only to the summit but also to the foothills of the hillslope [3,6,21].
Changes in soil management practices can affect soil morphology, water retention, chemical properties, and biological activity. In particular, tillage practices lead to the intensification of slope processes [3,22,23]. Soil erosion leads to transformations of the soil cover of young morainic terrains of mesoregions in northern Poland. Main alterations relate to soil truncation on summits of slopes, whereas at footslopes and toeslopes and within local depressions, colluvial material is accumulated [24,25].
Given the challenges posed by climate change, a growing population, and soil degradation, it is essential to focus more on protecting and monitoring agricultural soils. These soils, which are particularly susceptible to erosion processes, require increased attention to ensure sustainable crop production. Monitoring fields in moraine terrain is among the top priorities for modern agriculture in Poland. Sustainable agricultural practices enable more efficient use of production resources and better environmental protection. Therefore, it is essential to have knowledge about the actual quality of soils and biological activity, especially in soils prone to erosion.
The research hypothesis states that agricultural erosion has a detrimental effect on the microbiological and chemical properties of soils subjected to intensive cultivation under a conventional agricultural system. This phenomenon is particularly pronounced in regions characterized by undulating topography, such as hilly or moraine landscapes. Under such topographic conditions, the erosive forces associated with agricultural activities are amplified because the post-glacial terrain promotes the formation of runoff paths for soil particles, nutrients, and organic matter. The undulating nature of the terrain contributes to accelerating erosion, intensifying the movement of essential components and affecting the composition of the soil microbiota.
The aim of the study was to assess the microbiological and chemical properties of the topsoil and subsoil layers of Luvisols subjected to anthropogenic denudation in the moraine region of the Southern Krajna Lakeland (northern Poland). The assessment included the quantification of actinobacteria, the total count of fungi and bacteria, as well as the count of copiotrophic, cellulolytic, and oligotrophic microorganisms in the soil at the summit and foothills of the hills. The study compared the content of plant-available forms of phosphorus, potassium, and magnesium, as well as the content of total organic carbon and nitrogen, along with pH values. In addition, the grain size composition was analyzed and the electrical conductivity (EC) of soil was determined. Comparisons of microbiological and physicochemical parameters were conducted for two genetic horizons: topsoil (0–30 cm) and subsoil (30–50 cm). Monitoring potential microbiological and chemical changes may contribute to a better understanding of the erosion dynamics in Luvisols subjected to intense anthropogenic pressure in areas with diverse topography.
2. Materials and Methods
2.1. Study Sites and Sampling
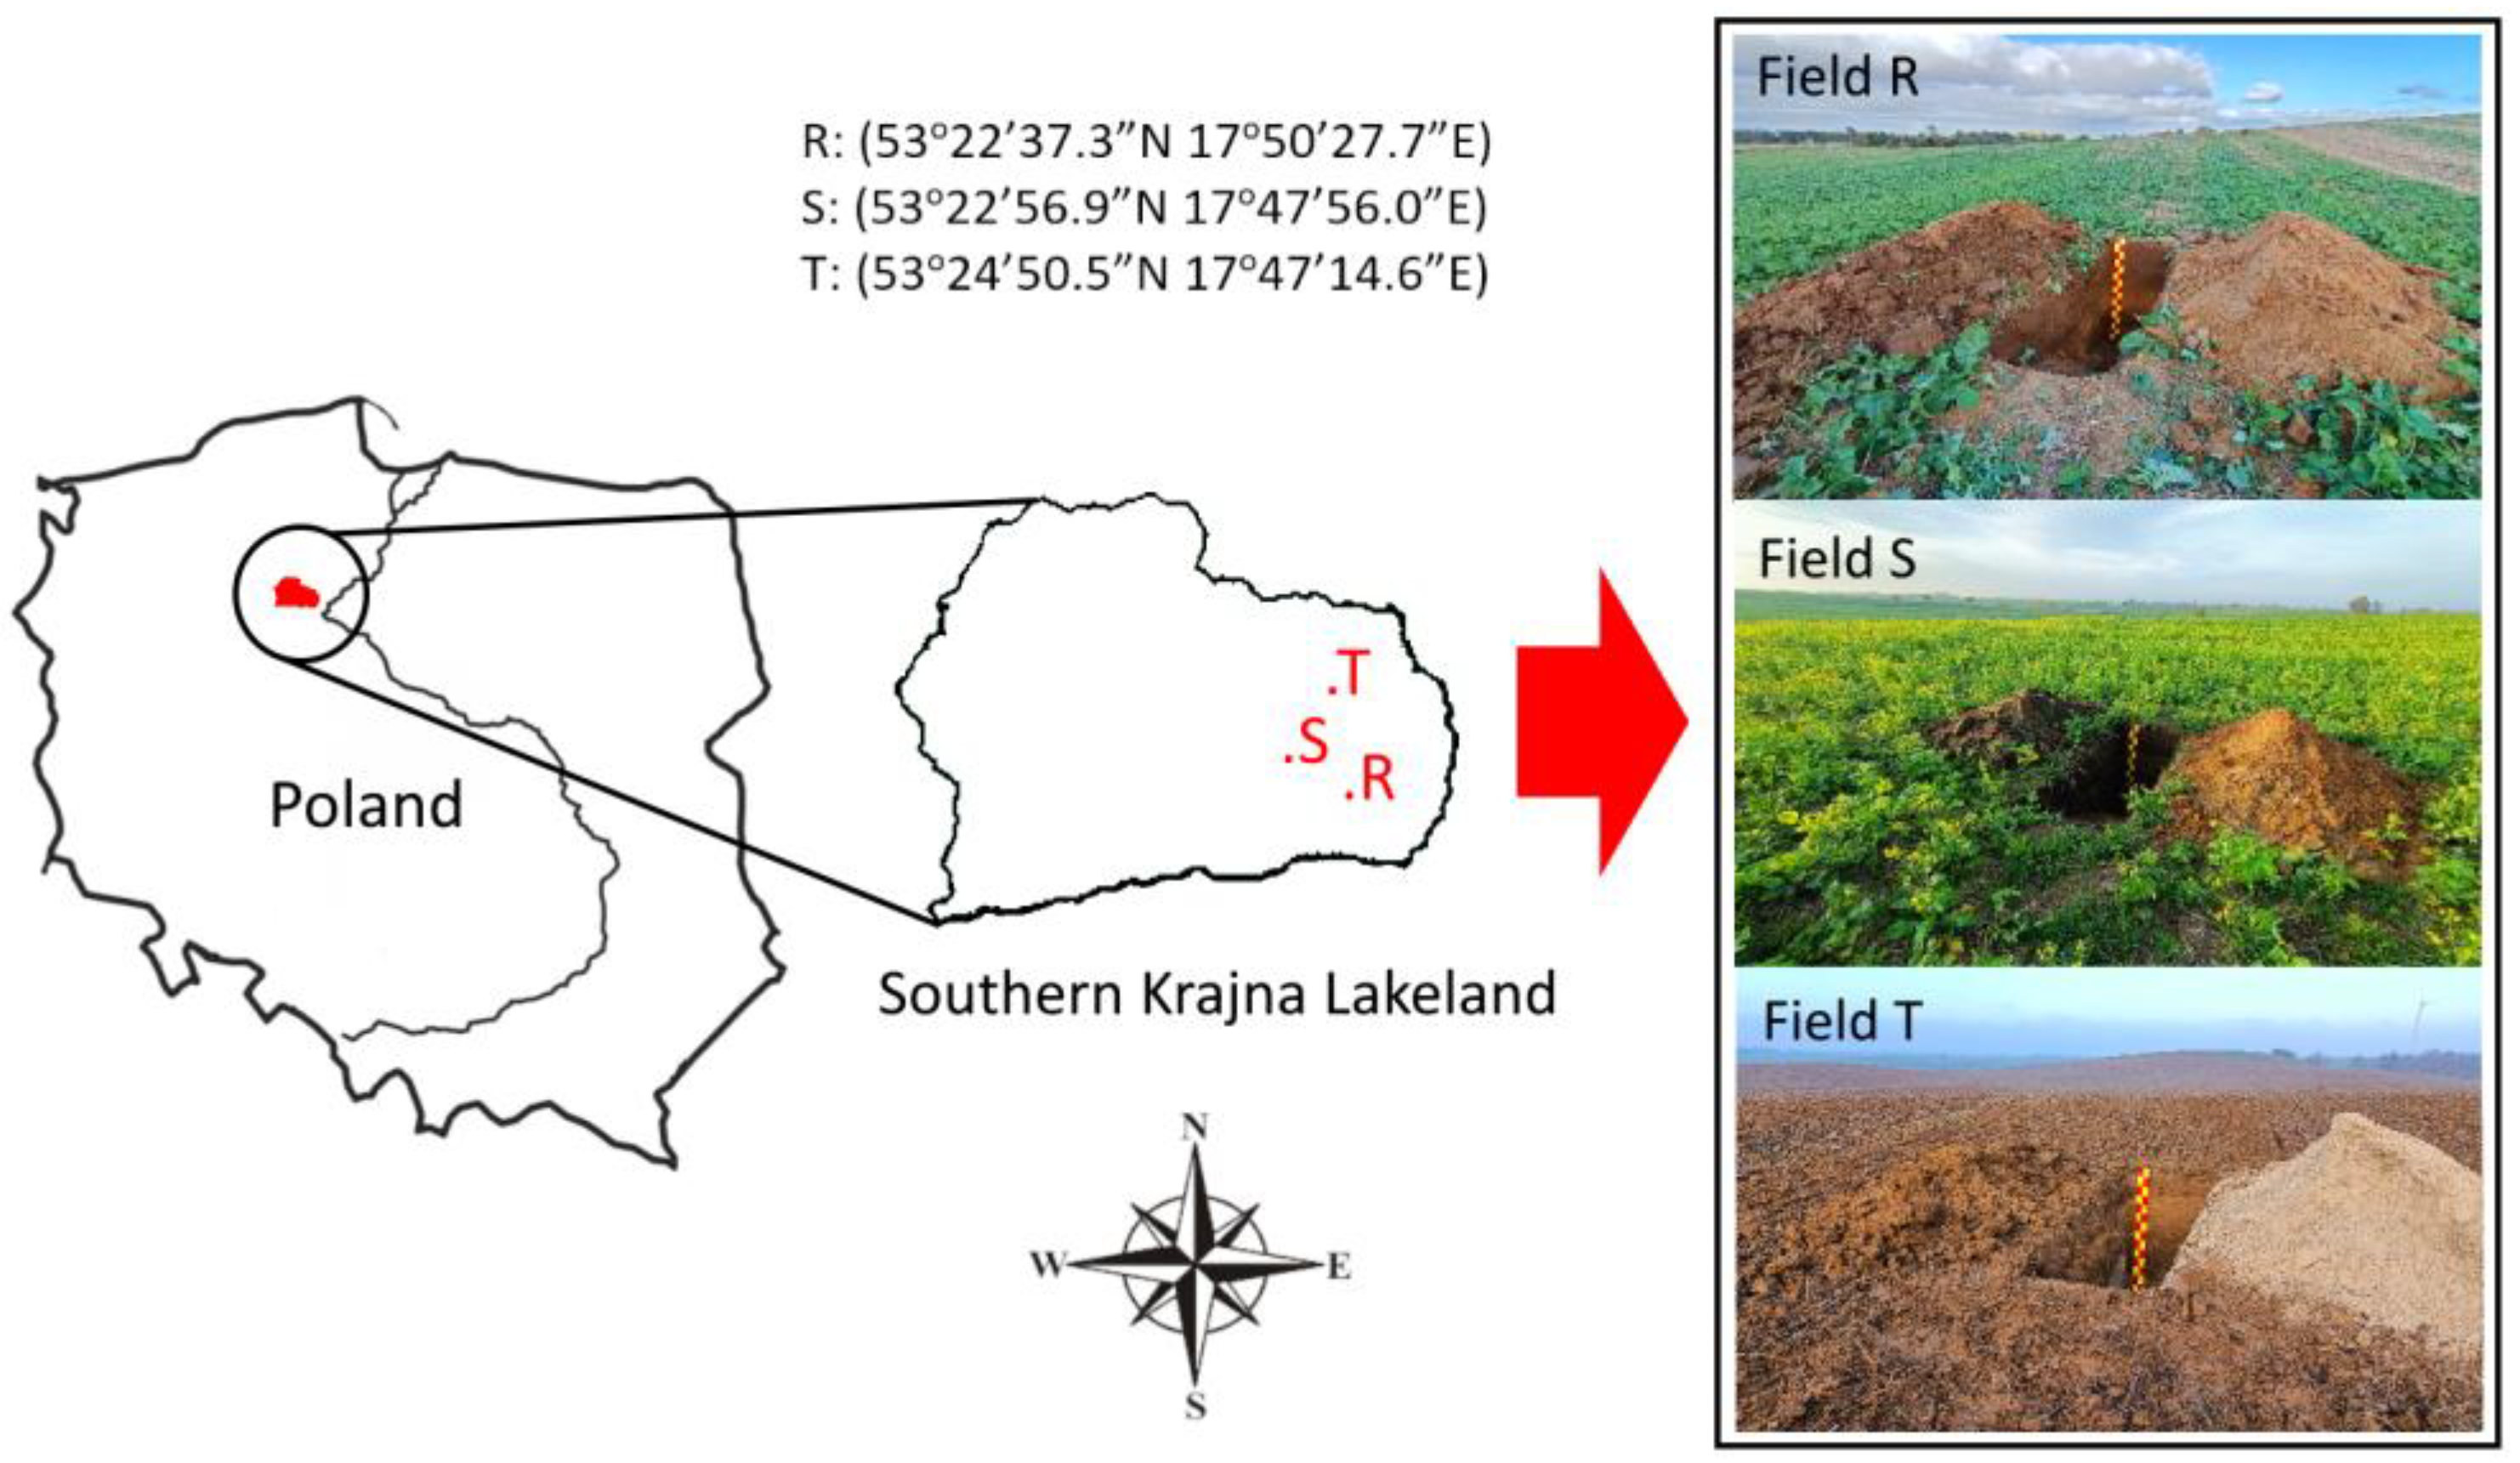
The research was conducted in the mesoregion of the South Baltic Lakeland (northern Poland)—specifically, the Southern Krajna Lakeland, with an average elevation of 115.6 m above sea level [26,27]. The climate of the studied region is temperate, with an average annual temperature of 7.8 °C (average annual minimum temperature of 3.8 °C and average annual maximum temperature of 12.8 °C) and a long-term average annual rainfall of 504 mm. Farmers do not implement proper crop rotation on the examined fields, which would enrich the soil with organic matter serving as a water reservoir. Winter wheat and rapeseed dominate the crop rotation on the surveyed fields. Unfortunately, farmers choose this option to ensure the financial stability of their farms. While this positively affects the profitability of production and enables farm development, it deteriorates soil fertility and the potential for biodiversity.
Three arable fields were selected (designated as R, S, T) that exhibited the typical mosaic topography characteristic of this area (Figure 1).
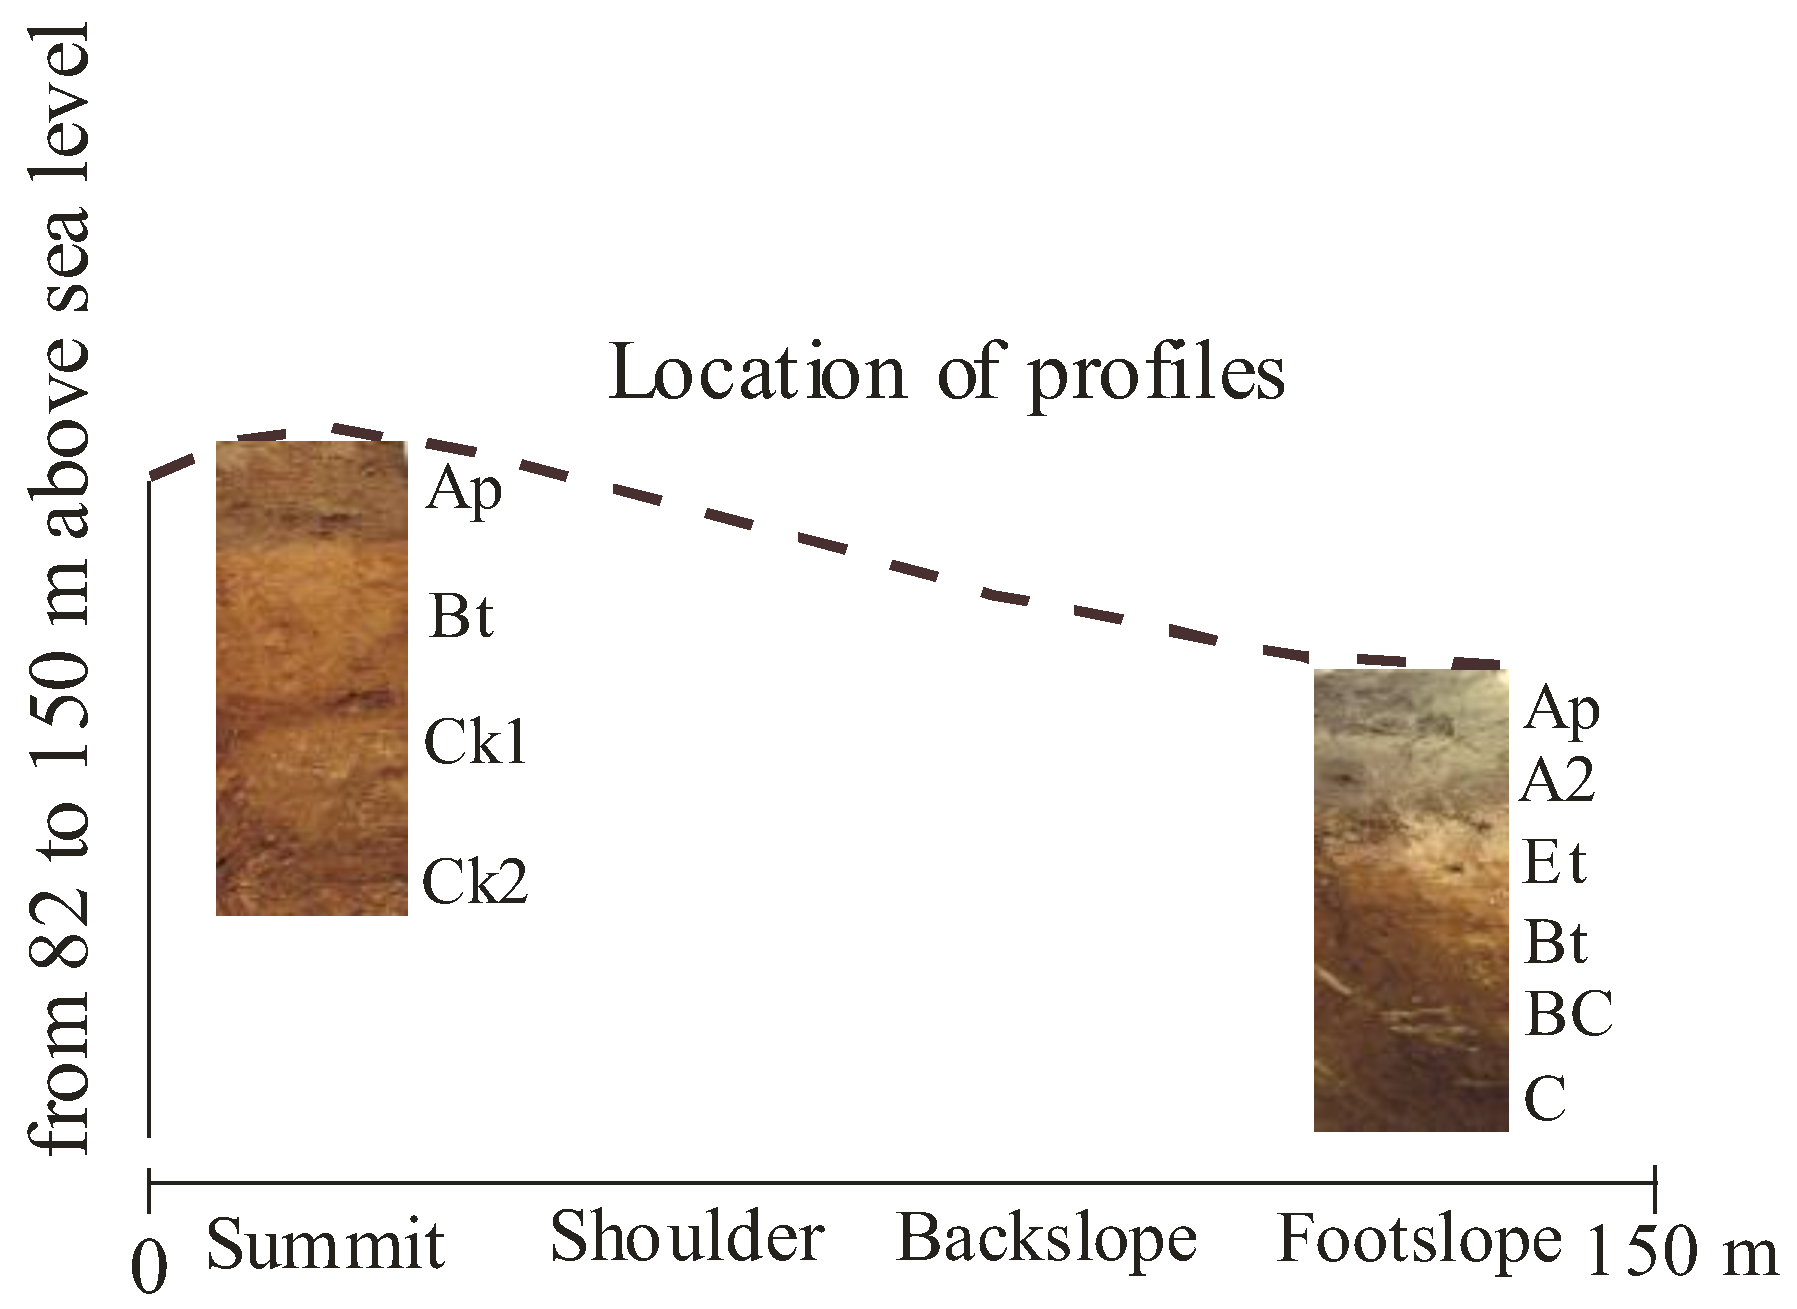
A total of 6 soil pits were excavated, representative of the soil cover in the studied region. All soil samples were collected after the winter wheat harvest, which was fertilized with a similar dose of NPK (average NPK fertilizer consumption was 140 kg: 80 kg N, 25 kg P, 35 kg K). A conventional cultivation system and similar agrotechnical treatments were applied uniformly across all locations. For each location (arable field), two soil pits were excavated: one at the summit of the hill and another at its foothills. Soil samples for testing were taken from the hills on the northern side of slopes ranging from 82 to 150 m above sea level. The length of the slope ranged from 90 to 150 m (Figure 2).
The locations of the soil pits were distant from buildings and roads. From each soil pit, soil samples were collected from two genetic horizons (Ap-surface and subsoil), corresponding to depths of 0–30 cm and 30–50 cm, respectively, in October 2022 (Table 1).
These samples were stored in plastic containers, allowing gas exchange, then cooled to 4 °C and transported to the laboratory. Soil samples for chemical analysis were placed in plastic bags, air-dried, and sieved through a 2-mm mesh screen.
2.2. Microbiological Analyses
Microbiological analyses of soil samples included quantitative determinations for the following groups of microorganisms:
- Actinobacteria (Ac),
- Total bacterial count (B),
- Total fungal count (Ff),
- Cellulolytic bacteria (Ce),
- Oligotrophs (Ol),
- Copiotrophs (Co).
For all determinations, 10 g of soil were weighed and introduced into 90 mL of Ringer’s solution. Subsequently, the samples were shaken for 25 min at room temperature. Following the homogenization of the suspension, a series of 10-fold dilutions (10−1 to 10−7) were prepared. Subsequently, 1000 µL of the soil solution was transferred onto dedicated selective media (Table 2).
The incubation of microorganisms was carried out at 25–28 °C for 4 days for B, Ff, Co, and Ce; 10 days for actinobacteria, and 14 days for oligotrophic microorganisms. All analyses were performed in three replicates. The count of colony-forming units (cfu) obtained was determined per 1 g of soil dry matter. (cfu × g−1 d.m. of soil).
2.3. Soil Sample Chemical Analyses
The texture of soil samples was determined using a laser diffraction particle size analyzer (Mastersizer 2000, Malvern Instruments, Malvern, UK). Potentiometric measurements of pH values were conducted in a 1 M KCl (1:2.5 w/v) solution [33] using a pH Meter (CP-551—Elmetron, Zabrze, Poland). The total organic carbon (TOC) and total nitrogen (TN) content were determined using a CN dry combustion analyzer (Vario Max CN, Elementar Analysensysteme GmbH, Hanau, Germany). The content of available magnesium (Mg) was assessed using the Schachtschabel method [34]. The contents of available forms of phosphorus (P) [35] and potassium (K) were determined by the Egner–Riehm method [36]. The content of forms available to plants was determined by atomic absorption spectroscopy and atomic emission spectroscopy using a Thermo Solaar S4 Atomic Absorption Spectrometer (Thermo Electron Corporation, Waltham, MA, USA). Measuring ECs with a conductivity meter in a soil-water extract was based on a fixed soil:solution ratio (1:5). The water-soluble forms of cations were based on the extraction with distilled water. Soluble salts were measured by the 1:5 (v:v) soil:de-ionized water extraction method. All the measurements were performed in three replications. Finally, Ca, Mg, K, and Na contents were measured using a Thermo Solaar S4 Atomic Absorption Spectrometer (Thermo Electron Corporation, Waltham, MA, USA).
2.4. Statistical Analyses
The obtained results of microbiological and chemical parameters underwent statistical analysis through a two-way analysis of variance (ANOVA). The first factor (A) was associated with the location of the soil pit (A1—summit and A2—footslope), while the second factor was related to the depth (B1—surface level 0–30 cm and B2—subsurface level 30–50 cm). To assess the significance of these factors and their mutual interactions, Tukey’s post hoc test with a 95% confidence interval was conducted, enabling a comparison of the mean values of the analyzed parameters.
In order to better explain the soil variation in terms of selected parameters (biological and chemical) and the relationship between them, the multivariate statistical method Principal Component Analysis (PCA) was used. The use of PCA also made it possible to present correlations between the studied parameters. Differences between objects were analyzed using PCA based on the mean values of all investigated soil features. Two principal components (PC1 and PC2) were used to rank the cases. A cluster analysis (CA) was also carried out. CA allowed the separation of groups of sites based on the diversity of variables, which was graphically presented in the form of a dendrogram. The Ward method [37] was employed to calculate the distances between individual clusters. All statistical analyses were conducted using Statistica 12 PL software from StatSoft [38].
3. Results
3.1. Microbiological Analysis
Analyses of microbiological data revealed statistically significant differences in the abundance of selected microbial groups both between surface and subsurface levels and between locations at the summit and footslope (Table 3). Concerning the overall bacterial count, test field T exhibited the most substantial decrease between surface levels, with a notable increase in colony-forming units (cfu) in soil samples collected at the footslope by 674.20% (LSD0.05 = 10.868).
A similar phenomenon was also observed for actinobacteria in field S, where a statistically significant decrease in cfu was noted with an increase in horizontal position in the surface level (LSD0.05 = 0.431) and in the case of fungi abundance (field T). Tendencies related to changes in bacterial abundance between the examined levels at the summit and foothill were also observed; in all cases, a decrease in cfu was noted with the depth of sample collection.
In the case of trophic groups of microorganisms (Ce, Co, and Ol), the research results demonstrated greater diversity (Table 4). The abundance of cellulose-degrading microorganisms was higher at the summit of the slope than at its footslope. This trend reversed in soil samples from subsurface levels, where a higher abundance of cellulolytic microbes was observed at the foot of the slope. On the other hand, no statistically significant differences were found in any of the tested fields for this trophic group. Copiotrophs, however, predominated at the foot of the slope, regardless of the surveyed location. The soil samples from field R revealed statistically significant differences (LSD0.05 = 13.543) between the summit and the footslope in the presence of oligotrophic microorganisms. These microbes, inhabiting an environment with a reduced supply of energy substrates, clearly dominated on the slope of the field.
3.2. Chemical Analysis
Statistically significant differences were demonstrated for selected chemical parameters of soils between the summit and footslope of the hills, as well as between the genetic levels (Table 5). In terms of pH values, statistically lower pH values were observed at the footslope in two fields (S and T). Both TOC and TN contents indicated higher accumulation at the footslope, regardless of the genetic level. No statistically significant differences were noted in the content of available Mg; however, on fields R and S, Mg content was higher in the surface level at the summit, while for field T, the same trend was observed for TOC and TN. The content of available forms of K and P differed significantly between slope locations, irrespective of depth.
3.3. TOC:TN Ratio and Granulometric Composition
The highest values of the TOC:TN ratio for locations R and T were observed in the surface level at the footslope, while for location S, they were found in the subsurface level at the summit. Similarly high values were noted in the subsurface profile at the footslope. The lowest values were recorded for the surface level (fields S and T) at the summit of the hill (Figure 3).
The particle size analysis revealed a higher proportion of sand in the surface level at the footslope, contrasting with the surface layer at the summit of the slope (Figure 4). The silt fraction, on the other hand, was higher in the surface and subsurface levels at the summit of the hill. Variations in the clay fraction were minor and did not exceed 6% in the composition of all examined samples. Nevertheless, higher values were also observed in the upper parts of the surveyed elevations.
3.4. Soil Electrical Conductivity
The surface layer of footslopes soil exhibited significantly lower average content of water-soluble forms of magnesium and calcium compared to summits (Table 6). However, in the soil material of the 0–30 cm layer of footslopes, a higher average content of water-soluble sodium was observed (Table 7). The average content of water-soluble potassium was lower in the surface layer of footslopes compared to summits. In the subsurface layer of the investigated footslope soils, a significantly higher average content of Na and Mg, and a significantly lower average content of Ca were recorded compared to summits. The highest content of water-soluble calcium cations was observed in the S and T subsurface horizons containing calcium carbonate.
The soil material of the investigated areas did not exhibit salinity characteristics. In soil samples taken from the plow layer in summits, higher average values of ECs were recorded compared to footslopes. However, in the subsurface layer (B2), higher average values of EC were found in footslope soil. Tillage erosion processes did not significantly determine the values of soil electrical conductivity in the soil material on cultivated hillslopes.
3.5. Principal Component Analysis—PCA
Multivariate PCA (Figure 5) was employed to determine the nature and strength of correlations among the soil microbiological and chemical parameters studied (B, Ac, Ff, Co, Ce, Ol, pH, TOC, TN, available Mg, P, and K), hillslope location, and genetic level. Two principal components (PC1 and PC2) were extracted from the available data, explaining a total variance of 71.63%. PC1 accounted for the majority of the variance at 55.14%, while PC2 explained 16.49%. The PCA revealed that the first component (PC1) was significantly negatively associated with TOC (−0.823), TN (−0.751), and assimilated forms of K (−0.710) and P (−0.694). The second component, PC2, can be interpreted as describing microbial abundance, as it was significantly positively correlated with Ff, B, Co, Ac, Ol, and Ce.
The application of Cluster Analysis (CA) to the discussed parameters allowed for the determination of similarities (differences) between the sampling point’s location and depth (Figure 6). Based on the dendrogram generated from the obtained data, three clusters were identified. Cluster 1, in the majority of cases (3 out of 5), grouped locations where soil samples were taken from the summit of the hills. These locations (RA1B1, RA1B2, and TA1B1) were characterized by a higher abundance of actinobacteria and the concentration of available phosphorus on the summit, compared to location S. Soil with the highest pH values and a lower overall bacterial count in the subsurface layer at the summit (locations SA1B2 and TA1B2) was grouped in Cluster 2. Cluster 3 distinguished 5 objects (RA2B1, TA2B1, SA2B1, TA2B2, SA1B1) where soil samples from the footslope were characterized by the highest content of TOC, TN, assimilated forms of P and K, and a higher abundance of selected microbial groups (Co, Ac).
4. Discussion
Erosion and geomorphic processes are primarily associated with the impact of water, glaciers, and ice sheets on the Earth’s surface. Currently, in the Anthropocene, the predominant geomorphic factor is the direct and indirect influence of human activities [39,40]. To date, the majority of studies on soil erosion have been dedicated to assessing changes in physicochemical parameters, with fewer focusing on the analysis of bacterial and fungal communities, as well as individual trophic groups. Addressing this gap in the literature has the potential to contribute to the formulation of a comprehensive approach for the early detection and prevention of anthropogenic erosion. In addition, this paper analyzes Luvisols, which, due to their widespread occurrence, impact food security and the stability of crop production [41,42].
In this study, all examined groups of microorganisms exhibited significant differences in abundance between the cultivation layer and the subsurface layer, regardless of the location on the eroded slope. This aligns with the scientific consensus, indicating that individual horizons should be treated as distinct ecological habitats [43]. The decrease in the abundance of microorganisms along the depth gradient is influenced by several factors. Among the main factors is the increase in bulk density, which reduces the oxygen level, thereby limiting the developmental conditions for aerobic microorganisms [44]. Additionally, it is noteworthy that the arable layer contains more labile organic compounds, thereby promoting the development of heterotrophic microbiota. Another factor directly shaping the levels of microbial abundance is the impact of rainfall on the arable layer. Intense precipitation leads to soil moisture and the release of carbon from aggregates, contributing to increased availability of energy substrates [38,39].
The conducted research revealed variations in the microbial abundance in soil sampled from the summit compared to that at the foot of eroded slopes. While a significant increase in the overall bacterial count was observed in field T (LSD = 10.868), with a rise in count between the foot and summit in the plow layer by 666.77%, correlating with other reports [45,46,47], a similar phenomenon was not observed for oligotrophs and cellulolytic microorganisms. The higher level of oligotrophic abundance in the plow layer at the summit of the slope can be justified by lower carbon availability, creating an ecological niche for organisms with lower environmental requirements and enhancing the competitive advantage of this trophic group [48]. Although all soil samples were taken from post-wheat harvest sites, and changes in physicochemical parameters favored locations at the slope’s base, cellulolytic microorganisms predominated at the summit. As highlighted by Huang et al. [49], sunlight intensity on the slope significantly influences microbial abundance, pointing to a relatively higher count of Gram-negative bacteria and aerobic microorganisms in shaded positions. The results obtained also revealed the prevalence of actinomycetes over the fungal population. This trend aligns with the evolutionary strategy of actinomycetes, as their capacity to metabolize a broad spectrum of hydrolytic enzymes and bioactive compounds enables them to exert fungistatic effects [50]. Furthermore, it has been demonstrated that the abundance of fungi in the soil is dependent on the use of organic fertilizers, which promote the proliferation of mycorrhizal fungi [51]. The soil pH is also of significance, indicating better environmental adaptation of fungi to lower pH levels [52]. In the case of our own research on two cultivation fields, the pH value at the hill’s summit was alkaline and decreased to neutral with the depth of the soil samples. This trend may also indicate less favorable conditions for the development of fungi, as the optimal pH for their environment is slightly acidic.
All tested sites exhibited statistically significant differences in pH values, which increased with a decrease in elevation, confirming findings from previous studies [53]. The higher pH values, persisting at the summit on two sites, result from the presence of CaCO3, indicating a shallowing of the soil profile and mixing with calcium carbonate-rich bedrock [54]. Changes in organic carbon content are also a crucial indicator of advancing soil degradation, contributing to a reduction in soil productivity. The decrease in TOC content in the upper part of the hill aligns with the trend associated with the displacement of substrates along the elevation gradient. Moreover, as noted by Jia et al., the slope gradient plays a significant role in influencing changes in soil organic carbon content, particularly concerning water erosion [55]. The phenomenon of TOC transport, as a result of tillage erosion, leads to increased concentration at the deposition site at the foot of the hill, thereby hindering its decomposition and reducing bioavailability [56]. Observations regarding the dynamics of TN content levels on the slope are similar to the changes occurring in TOC. The connection between the redistribution of these two important elements has already been noted in previous studies [57,58]. Following a meta-analysis of 204 studies, Li et al. highlighted that the conversion of severely degraded fields into grassland contributes to enhancing the overall soil TOC and TN content, aligning with the principles of sustainable agricultural management [59].
It is worth noting that this trend also applies to the concentrations of assimilable forms of phosphorus and potassium. The presence of these elements is controlled by the amount of organic matter in the soil, which, due to precipitation and cultivation practices, moves along the slope gradient and accumulates at the foot. Subsequently, as a result of the degradation of organic components by microorganisms, there is a release of elements and their reintegration into the nutrient cycle [53]. In the case of plant-available magnesium, no statistically significant changes were found in the levels of the altitude gradient, but it is noticeable that two fields showed higher levels of this element at the summit of the slope, which was also noted by other authors [60]. There is a possibility that, similar to the higher pH level at the summit of the hill, the element is released by the bedrock due to soil erosion.
Nutrients removed from cultivated fields along with plant yields must be adequately balanced by applied fertilizers. This is particularly important in precision agriculture, which focuses on improving the efficiency of agricultural production. Precision agriculture technologies allow for optimizing fertilization, the use of plant protection products, and the amount of fuel needed for cultivation operations [61,62]. This enables better utilization of agroecosystem capabilities, especially concerning non-renewable soil cover exposed to anthropogenic denudation.
5. Conclusions
In moraine areas subjected to intense agricultural anthropopression, the slope effect plays a significant role in shaping soil microbiota and changes in chemical parameters. The conducted research indicates a clear tendency to accumulate higher levels of organic carbon, total nitrogen, and plant-available forms of P and K at the foot of the slope, likely resulting from the transfer of soil material due to tillage and water erosion. Also, for most of the studied microbial groups, more stimulating conditions for their development were observed at the foot than at the summit, associated with the accumulation of larger quantities and easier access to nutritional substrates in these areas.
Microbial analysis indicates significant differences in microecosystems, depending on soil conditions and location. Variances in microbial composition between surface and depth, as well as among different locations, suggest the presence of specific microenvironments in the study area. These environments are strongly linked to the supply of nutrients and chemical elements, which are directly shaped by erosion processes. Recognizing the role of microorganisms could be a crucial aspect in better understanding, monitoring, and safeguarding biodiversity and the sustainable functioning of ecosystems. Monitoring microbiological and chemical changes in soil quality can be utilized as a prognostic tool to assess further erosive changes. Determining the impact of tillage erosion on the content of organic carbon and nitrogen, as well as shaping pH values and nutrient content in the soil is essential for targeted protection of agrocenosis.
The study found that over-intensification of agriculture negatively affects soil in moraine areas, leading to erosion. Cultivation operations move soil components from the tops of hills to the foothills. The findings underscore the need to adapt agricultural practices to the terrain, especially in hilly areas, and to use sustainable agriculture for long-term soil and environmental protection.
Managing the cultivation system and counteracting the effect of anthropogenic denudation is crucial both from an agricultural and environmental protection standpoint. By better understanding these processes and their consequences, one can contribute to the sustainable use of soil resources and the protection of agrocenosis.
Author Contributions
Conceptualization, P.K. and M.P.; methodology, B.B.-B. and M.K.; formal analysis, P.K. and M.P.; data curation, P.K., M.P., B.B.-B. and M.K.; writing—original draft preparation, P.K. and B.B.-B.; writing—review and editing, B.B.-B. and M.K.; visualization, P.K.; supervision, B.B.-B. and M.K.; funding acquisition, P.K. All authors have read and agreed to the published version of the manuscript.
Funding
The APC was funded by Bydgoszcz University of Science and Technology, as part of the “Działania Naukowe Młodych” program, grant number: DNM/22/2023.
Institutional Review Board Statement
Not applicable.
Data Availability Statement
Data is contained within the article.
Conflicts of Interest
The authors declare no conflict of interest.
References
- Alewell, C.; Egli, M.; Meusburger, K. An Attempt to Estimate Tolerable Soil Erosion Rates by Matching Soil Formation with Denudation in Alpine Grasslands. J. Soils Sediments 2015, 15, 1383–1399. [Google Scholar] [CrossRef]
- Conforti, M.; Buttafuoco, G. Assessing Space–Time Variations of Denudation Processes and Related Soil Loss from 1955 to 2016 in Southern Italy (Calabria Region). Environ. Earth Sci. 2017, 76, 457. [Google Scholar] [CrossRef]
- Przewoźna, B. Changes of Bulk Density, Air-Water Properties and Morphology of Soils in Basins without Outlets as an Effect of Erosion and Anthropogenic Denudation (a Study from Northwestern Poland). Soil Sci. Plant Nutr. 2014, 60, 30–37. [Google Scholar] [CrossRef]
- Kabała, C.; Musztyfaga, E. Clay-Illuvial Soils in the Polish and International Soil Classifications. Soil Sci. Annu. 2015, 66, 204–213. [Google Scholar] [CrossRef]
- Gray, J.M.; Leys, J.F.; Yang, X.; Zhang, M. Monitoring of Sustainable Land Management Using Remotely Sensed Vegetation Cover and Variable Tolerable Soil Erosion Targets across New South Wales, Australia. Soil Use Manag. 2023, 39, 849–866. [Google Scholar] [CrossRef]
- Świtoniak, M.; Bednarek, R. Denudacja Antropogeniczna. In Antropogeniczne Przekształcenia Pokrywy Glebowej Brodnickiego Parku Krajobrazowego; Wyd. Nauk.: Toruń, Poland, 2014; pp. 57–84. ISBN 978-83-231-3280-6. [Google Scholar]
- Tomlinson, I. Doubling Food Production to Feed the 9 Billion: A Critical Perspective on a Key Discourse of Food Security in the UK. J. Rural Stud. 2013, 29, 81–90. [Google Scholar] [CrossRef]
- Al-Kaisi, M.M.; Elmore, R.W.; Guzman, J.G.; Hanna, H.M.; Hart, C.E.; Helmers, M.J.; Hodgson, E.W.; Lenssen, A.W.; Mallarino, A.P.; Robertson, A.E.; et al. Drought Impact on Crop Production and the Soil Environment: 2012 Experiences from Iowa. J. Soil Water Conserv. 2013, 68, 19A–24A. [Google Scholar] [CrossRef]
- Jin, F.; Yang, W.; Fu, J.; Li, Z. Effects of Vegetation and Climate on the Changes of Soil Erosion in the Loess Plateau of China. Sci. Total Environ. 2021, 773, 145514. [Google Scholar] [CrossRef]
- Yao, Y.; Liu, Y.; Zhou, S.; Song, J.; Fu, B. Soil Moisture Determines the Recovery Time of Ecosystems from Drought. Glob. Change Biol. 2023, 29, 3562–3574. [Google Scholar] [CrossRef]
- Pandey, S.; Kumar, P.; Zlatic, M.; Nautiyal, R.; Panwar, V.P. Recent Advances in Assessment of Soil Erosion Vulnerability in a Watershed. Int. Soil Water Conserv. Res. 2021, 9, 305–318. [Google Scholar] [CrossRef]
- Boardman, J.; Poesen, J.; Evans, R. Socio-Economic Factors in Soil Erosion and Conservation. Environ. Sci. Policy 2003, 6, 1–6. [Google Scholar] [CrossRef]
- Montanarella, L.; Pennock, D.J.; McKenzie, N.; Badraoui, M.; Chude, V.; Baptista, I.; Mamo, T.; Yemefack, M.; Singh Aulakh, M.; Yagi, K.; et al. World’s Soils Are under Threat. Soil 2016, 2, 79–82. [Google Scholar] [CrossRef]
- Panagos, P.; Borrelli, P.; Robinson, D. FAO Calls for Actions to Reduce Global Soil Erosion. Mitig. Adapt. Strateg. Glob. Change 2020, 25, 789–790. [Google Scholar] [CrossRef]
- Qiu, L.; Zhang, Q.; Zhu, H.; Reich, P.B.; Banerjee, S.; van der Heijden, M.G.A.; Sadowsky, M.J.; Ishii, S.; Jia, X.; Shao, M.; et al. Erosion Reduces Soil Microbial Diversity, Network Complexity and Multifunctionality. ISME J. 2021, 15, 2474–2489. [Google Scholar] [CrossRef]
- Abdul Rahman, N.S.N.; Abdul Hamid, N.W.; Nadarajah, K. Effects of Abiotic Stress on Soil Microbiome. Int. J. Mol. Sci. 2021, 22, 9036. [Google Scholar] [CrossRef]
- Lehman, R.M.; Cambardella, C.A.; Stott, D.E.; Acosta-Martinez, V.; Manter, D.K.; Buyer, J.S.; Maul, J.E.; Smith, J.L.; Collins, H.P.; Halvorson, J.J.; et al. Understanding and Enhancing Soil Biological Health: The Solution for Reversing Soil Degradation. Sustainability 2015, 7, 988–1027. [Google Scholar] [CrossRef]
- Khmelevtsova, L.E.; Sazykin, I.S.; Azhogina, T.N.; Sazykina, M.A. Influence of Agricultural Practices on Bacterial Community of Cultivated Soils. Agriculture 2022, 12, 371. [Google Scholar] [CrossRef]
- Piotrowska-Długosz, A.; Kobierski, M.; Długosz, J. Enzymatic Activity and Physicochemical Properties of Soil Profiles of Luvisols. Materials 2021, 14, 6364. [Google Scholar] [CrossRef]
- Loba, A.; Zhang, J.; Tsukamoto, S.; Kasprzak, M.; Beata Kowalska, J.; Frechen, M.; Waroszewski, J. Multiproxy Approach to the Reconstruction of Soil Denudation Events and the Disappearance of Luvisols in the Loess Landscape of South-Western Poland. Catena 2023, 220, 106724. [Google Scholar] [CrossRef]
- Radziuk, H.; Świtoniak, M. The Effect of Erosional Transformation of Soil Cover on the Stability of Soil Aggregates within Young Hummocky Moraine Landscapes in Northern Poland. Agronomy 2022, 12, 2595. [Google Scholar] [CrossRef]
- Kobierski, M. Morphology, Properties and Mineralogical Composition of Eroded Luvisols in Selected Morainic Areas of the Kujavian and Pomeranian Province. Univ. Technol. Life Sci. Bydg. 2013, Monograph No. 166, 1–121. [Google Scholar]
- Świtoniak, M. Use of Soil Profile Truncation to Estimate Influence of Accelerated Erosion on Soil Cover Transformation in Young Morainic Landscapes, North-Eastern Poland. Catena 2014, 116, 173–184. [Google Scholar] [CrossRef]
- Świtoniak, M.; Mroczek, P.; Bednarek, R. Luvisols or Cambisols? Micromorphological Study of Soil Truncation in Young Morainic Landscapes—Case Study: Brodnica and Chełmno Lake Districts (North Poland). Catena 2016, 137, 583–595. [Google Scholar] [CrossRef]
- Pindral, S.; Świtoniak, M. The Usefulness of Soil-Agricultural Maps to Identify Classes of Soil Truncation. Soil Sci. Annu. 2017, 68, 2–10. [Google Scholar] [CrossRef]
- Solon, J.; Borzyszkowski, J.; Bidłasik, M.; Richling, A.; Badora, K.; Balon, J.; Brzezińska-Wójcik, T.; Chabudziński, Ł.; Dobrowolski, R.; Grzegorczyk, I.; et al. Physico-Geographical Mesoregions of Poland: Verification and Adjustment of Boundaries on the Basis of Contemporary Spatial Data. Geogr. Pol. 2018, 91, 143–170. [Google Scholar] [CrossRef]
- Kostrzewski, A.; Zwoliński, Z.; Andrzejewski, L.; Florek, W.; Mazurek, M.; Niewiarowski, W.; Podgórski, Z.; Rachlewicz, G.; Smolska, E.; Stach, A.; et al. Współczesna ewolucja rzeźby młodoglacjalnej Niżu Polskiego. In Współczesne Przemiany Rzeźby Polski; Bogucki Wydawnictwo Naukowe: Kraków, Poland, 2021; pp. 483–571. ISBN 978-83-7986-382-2. [Google Scholar]
- IUSS Working Group WRB. World Reference Base for Soil Resources. International Soil Classification System for Naming Soils and Creating Legends for Soil Maps, 4th ed.; International Union of Soil Sciences (IUSS): Vienna, Austria, 2022. [Google Scholar]
- Crawford, D.L.; Lynch, J.M.; Whipps, J.M.; Ousley, M.A. Isolation and Characterization of Actinomycetes Antagonists of a Fungal Root Pathogen. Appl. Environ. Microbiol. 1996, 59, 3899–3905. [Google Scholar] [CrossRef]
- Atlas, R.M. Handbook of Microbiological Media; CRC Press: Boca Raton, FL, USA, 2010; ISBN 978-0-429-13049-6. [Google Scholar]
- Gupta, V.; Gulati, P.; Bhagat, N.; Dhar, M.S.; Virdi, J. Detection of Yersinia Enterocolitica in Food: An Overview. European. J. Clin. Microbiol. Infect. Dis. 2015, 34, 641–650. [Google Scholar] [CrossRef]
- Hattori, R.; Hattori, T. Sensitivity to Salts and Organic Coumpounds of Soil Bacteria Isolated on Diluted Media. J. Gen. Appied Microbiol. 1980, 26, 1–14. [Google Scholar] [CrossRef]
- ISO 10390:2005; Soil, Treated Biowaste and Sludge—Determination of PH. Polish Committee for Standardizations: Warsaw, Poland, 2013.
- PN-R-04020; Agricultural Analysis. Determination of the Content Available Magnesium. Polish Standards Committee: Warszawa, Poland, 1994.
- PN-R-04023; Agricultural Analysis—Determination of the Content of Available Phosphorus in Mineral Soils. Polish Standards Committee: Warszawa, Poland, 1996.
- PN-R-04022; Agricultural Analysis—Determination of the Content Available Potassium in Mineral Soils. Polish Standards Committee: Warszawa, Poland, 1996.
- Ward, J.H. Hierarchical Grouping to Optimize an Objective Function. J. Am. Stat. Assoc. 1963, 58, 236–244. [Google Scholar] [CrossRef]
- Statistica. Data Analysis Software System, Version 12; TIBCO Software Inc.: Palo Alto, CA, USA, 2019. Available online: https://www.Tibco.Com/Products/Data-Science(accessed on 15 October 2023).
- Cendrero, A.; Remondo, J.; Beylich, A.A.; Cienciala, P.; Forte, L.M.; Golosov, V.N.; Gusarov, A.V.; Kijowska-Strugała, M.; Laute, K.; Li, D.; et al. Denudation and Geomorphic Change in the Anthropocene; a Global Overview. Earth Sci. Rev. 2022, 233, 104186. [Google Scholar] [CrossRef]
- Zalasiewicz, J.; Waters, C.N.; Williams, M.; Barnosky, A.D.; Cearreta, A.; Crutzen, P.; Ellis, E.; Ellis, M.A.; Fairchild, I.J.; Grinevald, J.; et al. When Did the Anthropocene Begin? A Mid-Twentieth Century Boundary Level Is Stratigraphically Optimal. Quat. Int. 2015, 383, 196–203. [Google Scholar] [CrossRef]
- Mabuhay, J.A.; Nakagoshi, N.; Isagi, Y. Influence of Erosion on Soil Microbial Biomass, Abundance and Community Diversity. Land Degrad. Dev. 2004, 15, 183–195. [Google Scholar] [CrossRef]
- Gapeshin, D.I.; Ivanova, A.E.; Gracheva, T.A.; Pozdnyakov, L.A.; Demidov, V.V. Microbiological Indicators of Erosion Processes in Arable Alluvial Soils. Mosc. Univ. Soil Sci. Bull. 2022, 77, 374–383. [Google Scholar] [CrossRef]
- Michel, H.M.; Williams, M.A. Soil Habitat and Horizon Properties Impact Bacterial Diversity and Composition. Soil Sci. Soc. Am. J. 2011, 75, 1440–1448. [Google Scholar] [CrossRef]
- Alaoui, A.; Diserens, E. Mapping Soil Compaction—A Review. Curr. Opin. Environ. Sci. Health 2018, 5, 60–66. [Google Scholar] [CrossRef]
- Sul, W.J.; Asuming-Brempong, S.; Wang, Q.; Tourlousse, D.M.; Penton, C.R.; Deng, Y.; Rodrigues, J.L.M.; Adiku, S.G.K.; Jones, J.W.; Zhou, J.; et al. Tropical Agricultural Land Management Influences on Soil Microbial Communities through Its Effect on Soil Organic Carbon. Soil Biol. Biochem. 2013, 65, 33–38. [Google Scholar] [CrossRef]
- Denef, K.; Six, J.; Paustian, K.; Merckx, R. Importance of Macroaggregate Dynamics in Controlling Soil Carbon Stabilization: Short-Term Effects of Physical Disturbance Induced by Dry–Wet Cycles. Soil Biol. Biochem. 2001, 33, 2145–2153. [Google Scholar] [CrossRef]
- Jamshidi, A.H.; Sun, L.; Niu, Y.; Liu, X.; Fan, Z.; Yi, W.; Zhang, S. Slope Gradient Altered Microbial Community Composition in the Sloping Cropland in Black Soil. Catena 2023, 232, 107416. [Google Scholar] [CrossRef]
- Naylor, D.; McClure, R.; Jansson, J. Trends in Microbial Community Composition and Function by Soil Depth. Microorganisms 2022, 10, 540. [Google Scholar] [CrossRef]
- Huang, Y.-M.; Liu, D.; An, S.-S. Effects of Slope Aspect on Soil Nitrogen and Microbial Properties in the Chinese Loess Region. Catena 2015, 125, 135–145. [Google Scholar] [CrossRef]
- Selim, M.S.M.; Abdelhamid, S.A.; Mohamed, S.S. Secondary Metabolites and Biodiversity of Actinomycetes. J. Genet. Eng. Biotechnol. 2021, 19, 72. [Google Scholar] [CrossRef] [PubMed]
- Xiang, X.; Liu, J.; Zhang, J.; Li, D.; Xu, C.; Kuzyakov, Y. Divergence in Fungal Abundance and Community Structure between Soils under Long-Term Mineral and Organic Fertilization. Soil Tillage Res. 2020, 196, 104491. [Google Scholar] [CrossRef]
- Rousk, J.; Bååth, E.; Brookes, P.C.; Lauber, C.L.; Lozupone, C.; Caporaso, J.G.; Knight, R.; Fierer, N. Soil Bacterial and Fungal Communities across a PH Gradient in an Arable Soil. ISME J. 2010, 4, 1340–1351. [Google Scholar] [CrossRef] [PubMed]
- Khan, F.; Hayat, Z.; Ramzan, M.; Shah, Z.; Hanif, M. Effect of Slope Position on Physico-Chemical Properties of Eroded Soil. Soil Environ. 2013, 31, 22–28. [Google Scholar]
- Matecka, P.; Świtoniak, M. Delineation, Characteristic and Classification of Soils Containing Carbonates in Plow Horizons within Young Moraine Areas. Soil Sci. Ann. 2020, 71, 23–36. [Google Scholar] [CrossRef]
- Jia, S.; He, X.; Wei, F. Soil Organic Carbon Loss under Different Slope Gradients in Loess Hilly Region. Wuhan Univ. J. Nat. Sci. 2007, 12, 695–698. [Google Scholar] [CrossRef]
- Dungait, J.A.J.; Ghee, C.; Rowan, J.S.; McKenzie, B.M.; Hawes, C.; Dixon, E.R.; Paterson, E.; Hopkins, D.W. Microbial Responses to the Erosional Redistribution of Soil Organic Carbon in Arable Fields. Soil Biol. Biochem. 2013, 60, 195–201. [Google Scholar] [CrossRef]
- Zhang, J.H.; Wang, Y.; Li, F.C.; Zhang, J.H.; Wang, Y.; Li, F.C. Soil Organic Carbon and Nitrogen Losses Due to Soil Erosion and Cropping in a Sloping Terrace Landscape. Soil Res. 2015, 53, 87–96. [Google Scholar] [CrossRef]
- Nie, X.-J.; Zhang, H.-B.; Su, Y.-Y. Soil Carbon and Nitrogen Fraction Dynamics Affected by Tillage Erosion. Sci. Rep. 2019, 9, 16601. [Google Scholar] [CrossRef]
- Li, Y.; Li, Y.; Zhang, Q.; Xu, G.; Liang, G.; Kim, D.-G.; Carmona, C.R.; Yang, M.; Xue, J.; Xiang, Y.; et al. Enhancing Soil Carbon and Nitrogen through Grassland Conversion from Degraded Croplands in China: Assessing Magnitudes and Identifying Key Drivers of Phosphorus Reduction. Soil Tillage Res. 2024, 236, 105943. [Google Scholar] [CrossRef]
- Brubaker, S.C.; Jones, A.J.; Lewis, D.T.; Frank, K. Soil Properties Associated with Landscape Position. Soil Sci. Soc. Am. J. 1993, 57, 235–239. [Google Scholar] [CrossRef]
- Yarashynskaya, A.; Prus, P. Precision Agriculture Implementation Factors and Adoption Potential: The Case Study of Polish Agriculture. Agronomy 2022, 12, 2226. [Google Scholar] [CrossRef]
- Breza-Boruta, B.; Kotwica, K.; Bauza-Kaszewska, J. Effect of Tillage System and Organic Matter Management Interactions on Soil Chemical Properties and Biological Activity in a Spring Wheat Short-Time Cultivation. Energies 2021, 14, 7451. [Google Scholar] [CrossRef]
Figure 1.
Location of tested fields (photos of profile pits at the foot of the hills).

Figure 2.
Locations of soil profiles (the example given here is site R). Abbreviations: Ap—plow horizon, A2—hummus horizon, Et—luvic horizon, Bt—argic horizon, BC—transitional horizon between argic and parent material, C—parent material, Ck1—parent material with calcium carbonate, Ck2—second parent material with calcium carbonate.

Figure 3.
Carbon to nitrogen ratio values.
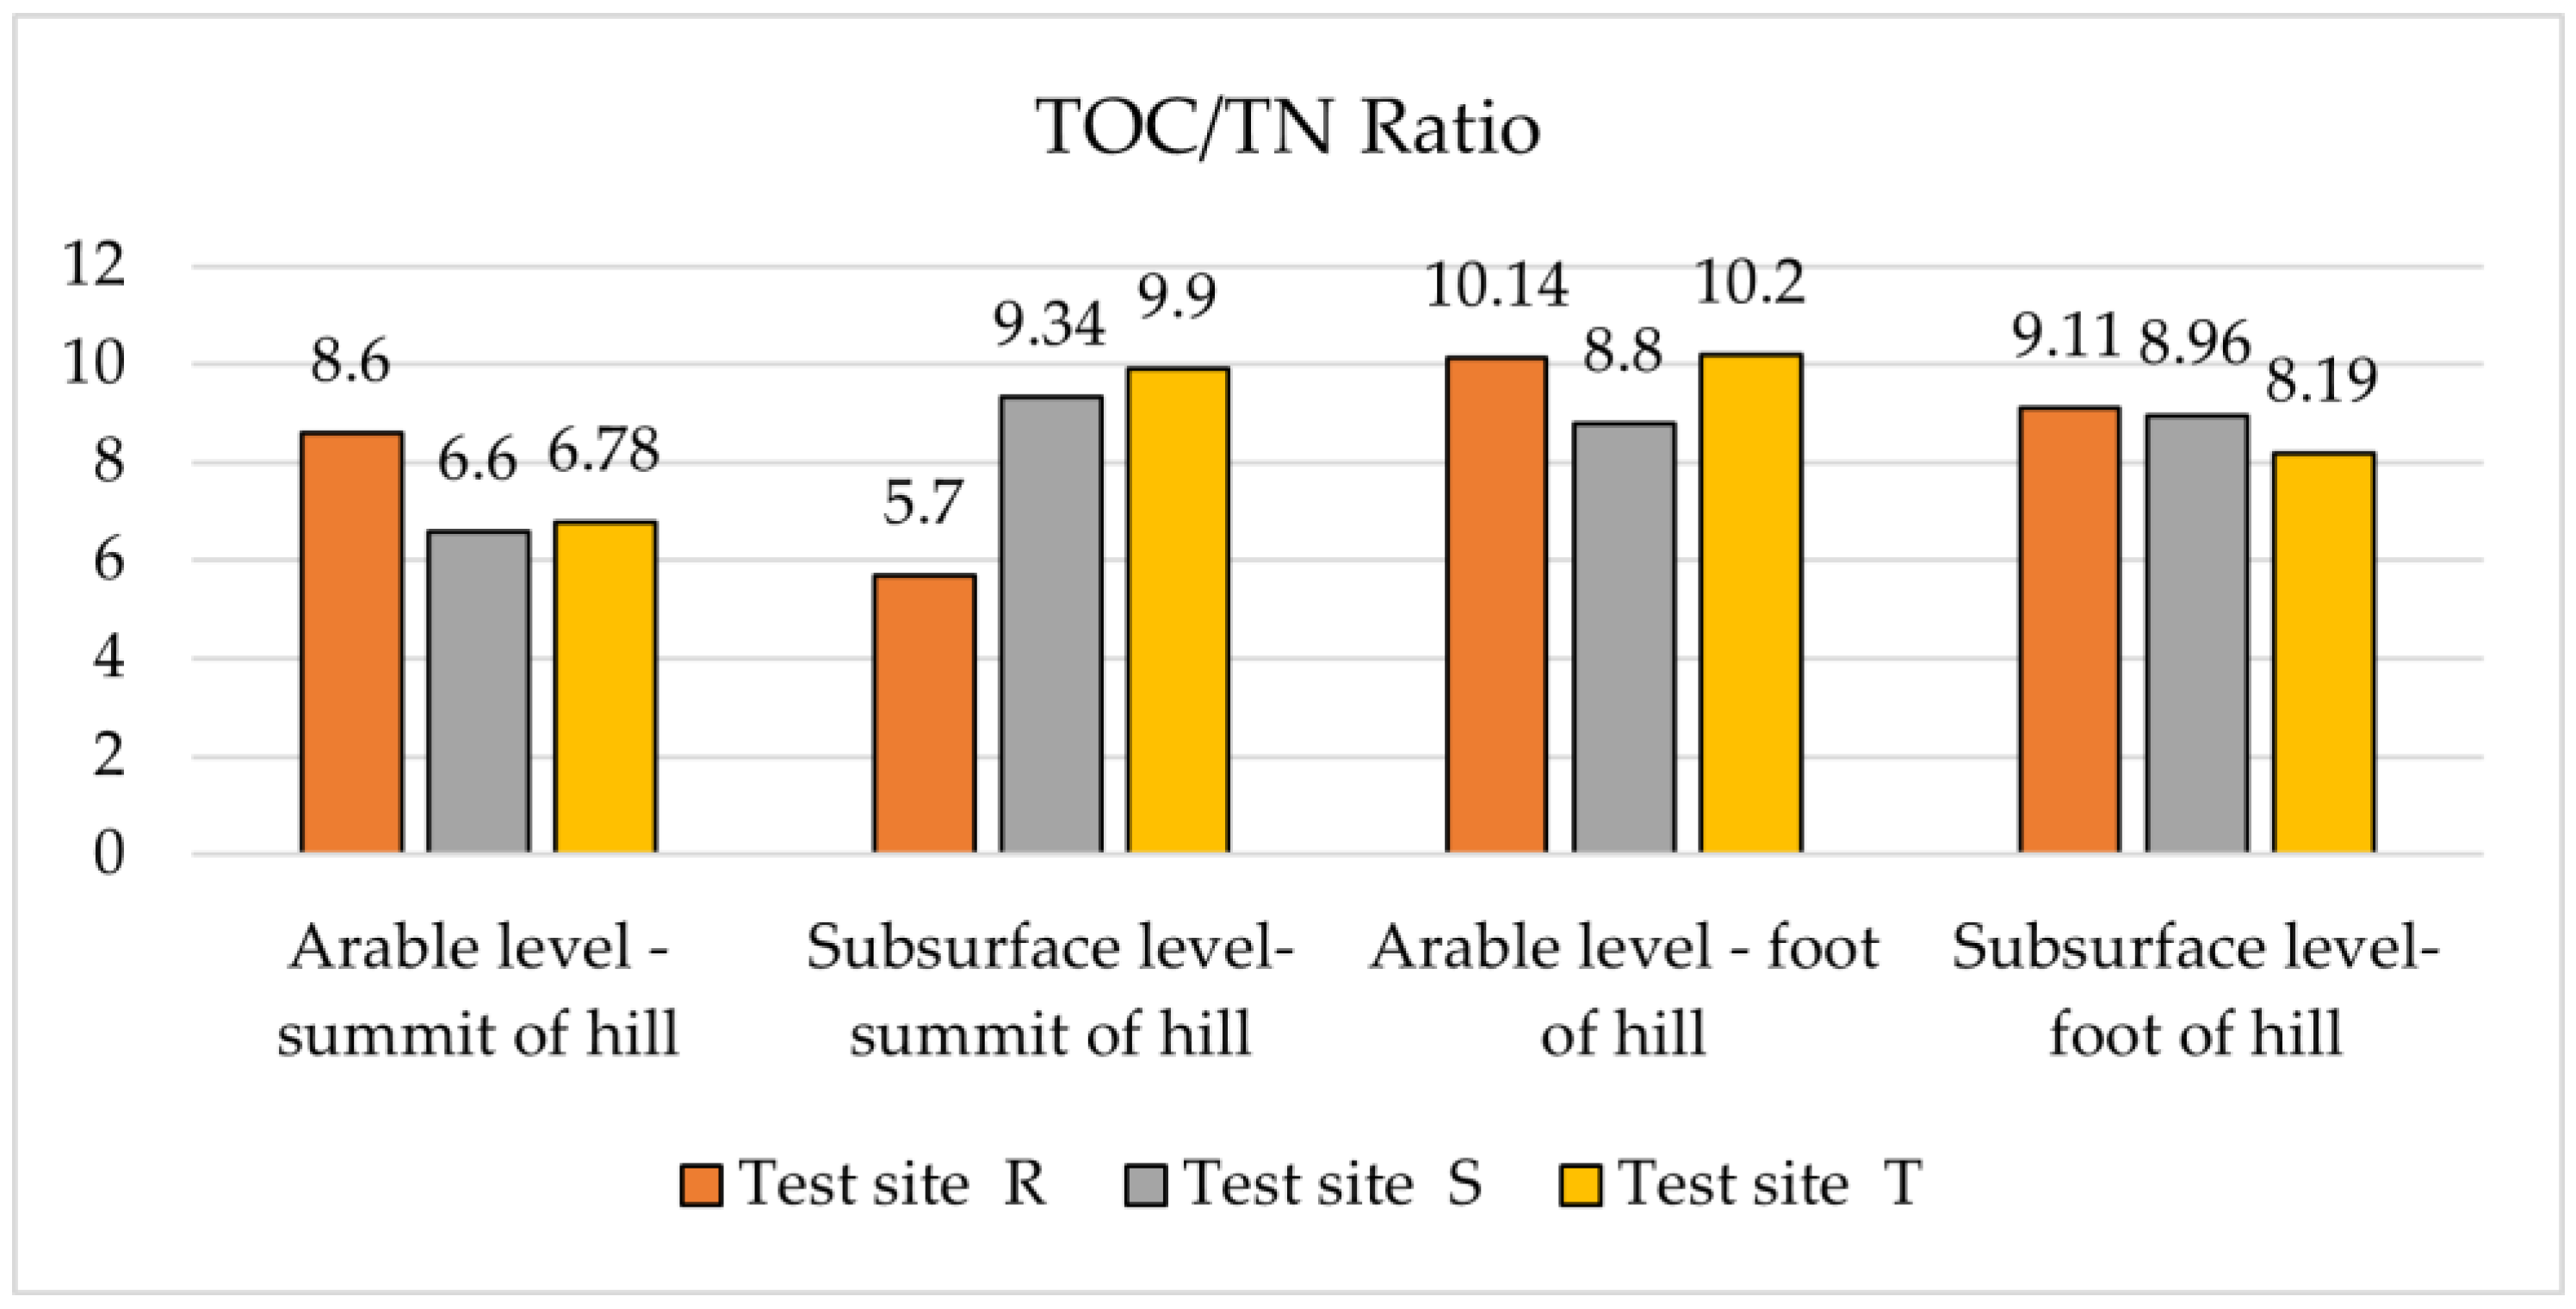
Figure 4.
Particle size composition. Percentage content of sand (2.0–0.05 mm), silt (0.05–0.002 mm), clay (<0.002 mm).
Figure 4.
Particle size composition. Percentage content of sand (2.0–0.05 mm), silt (0.05–0.002 mm), clay (<0.002 mm).
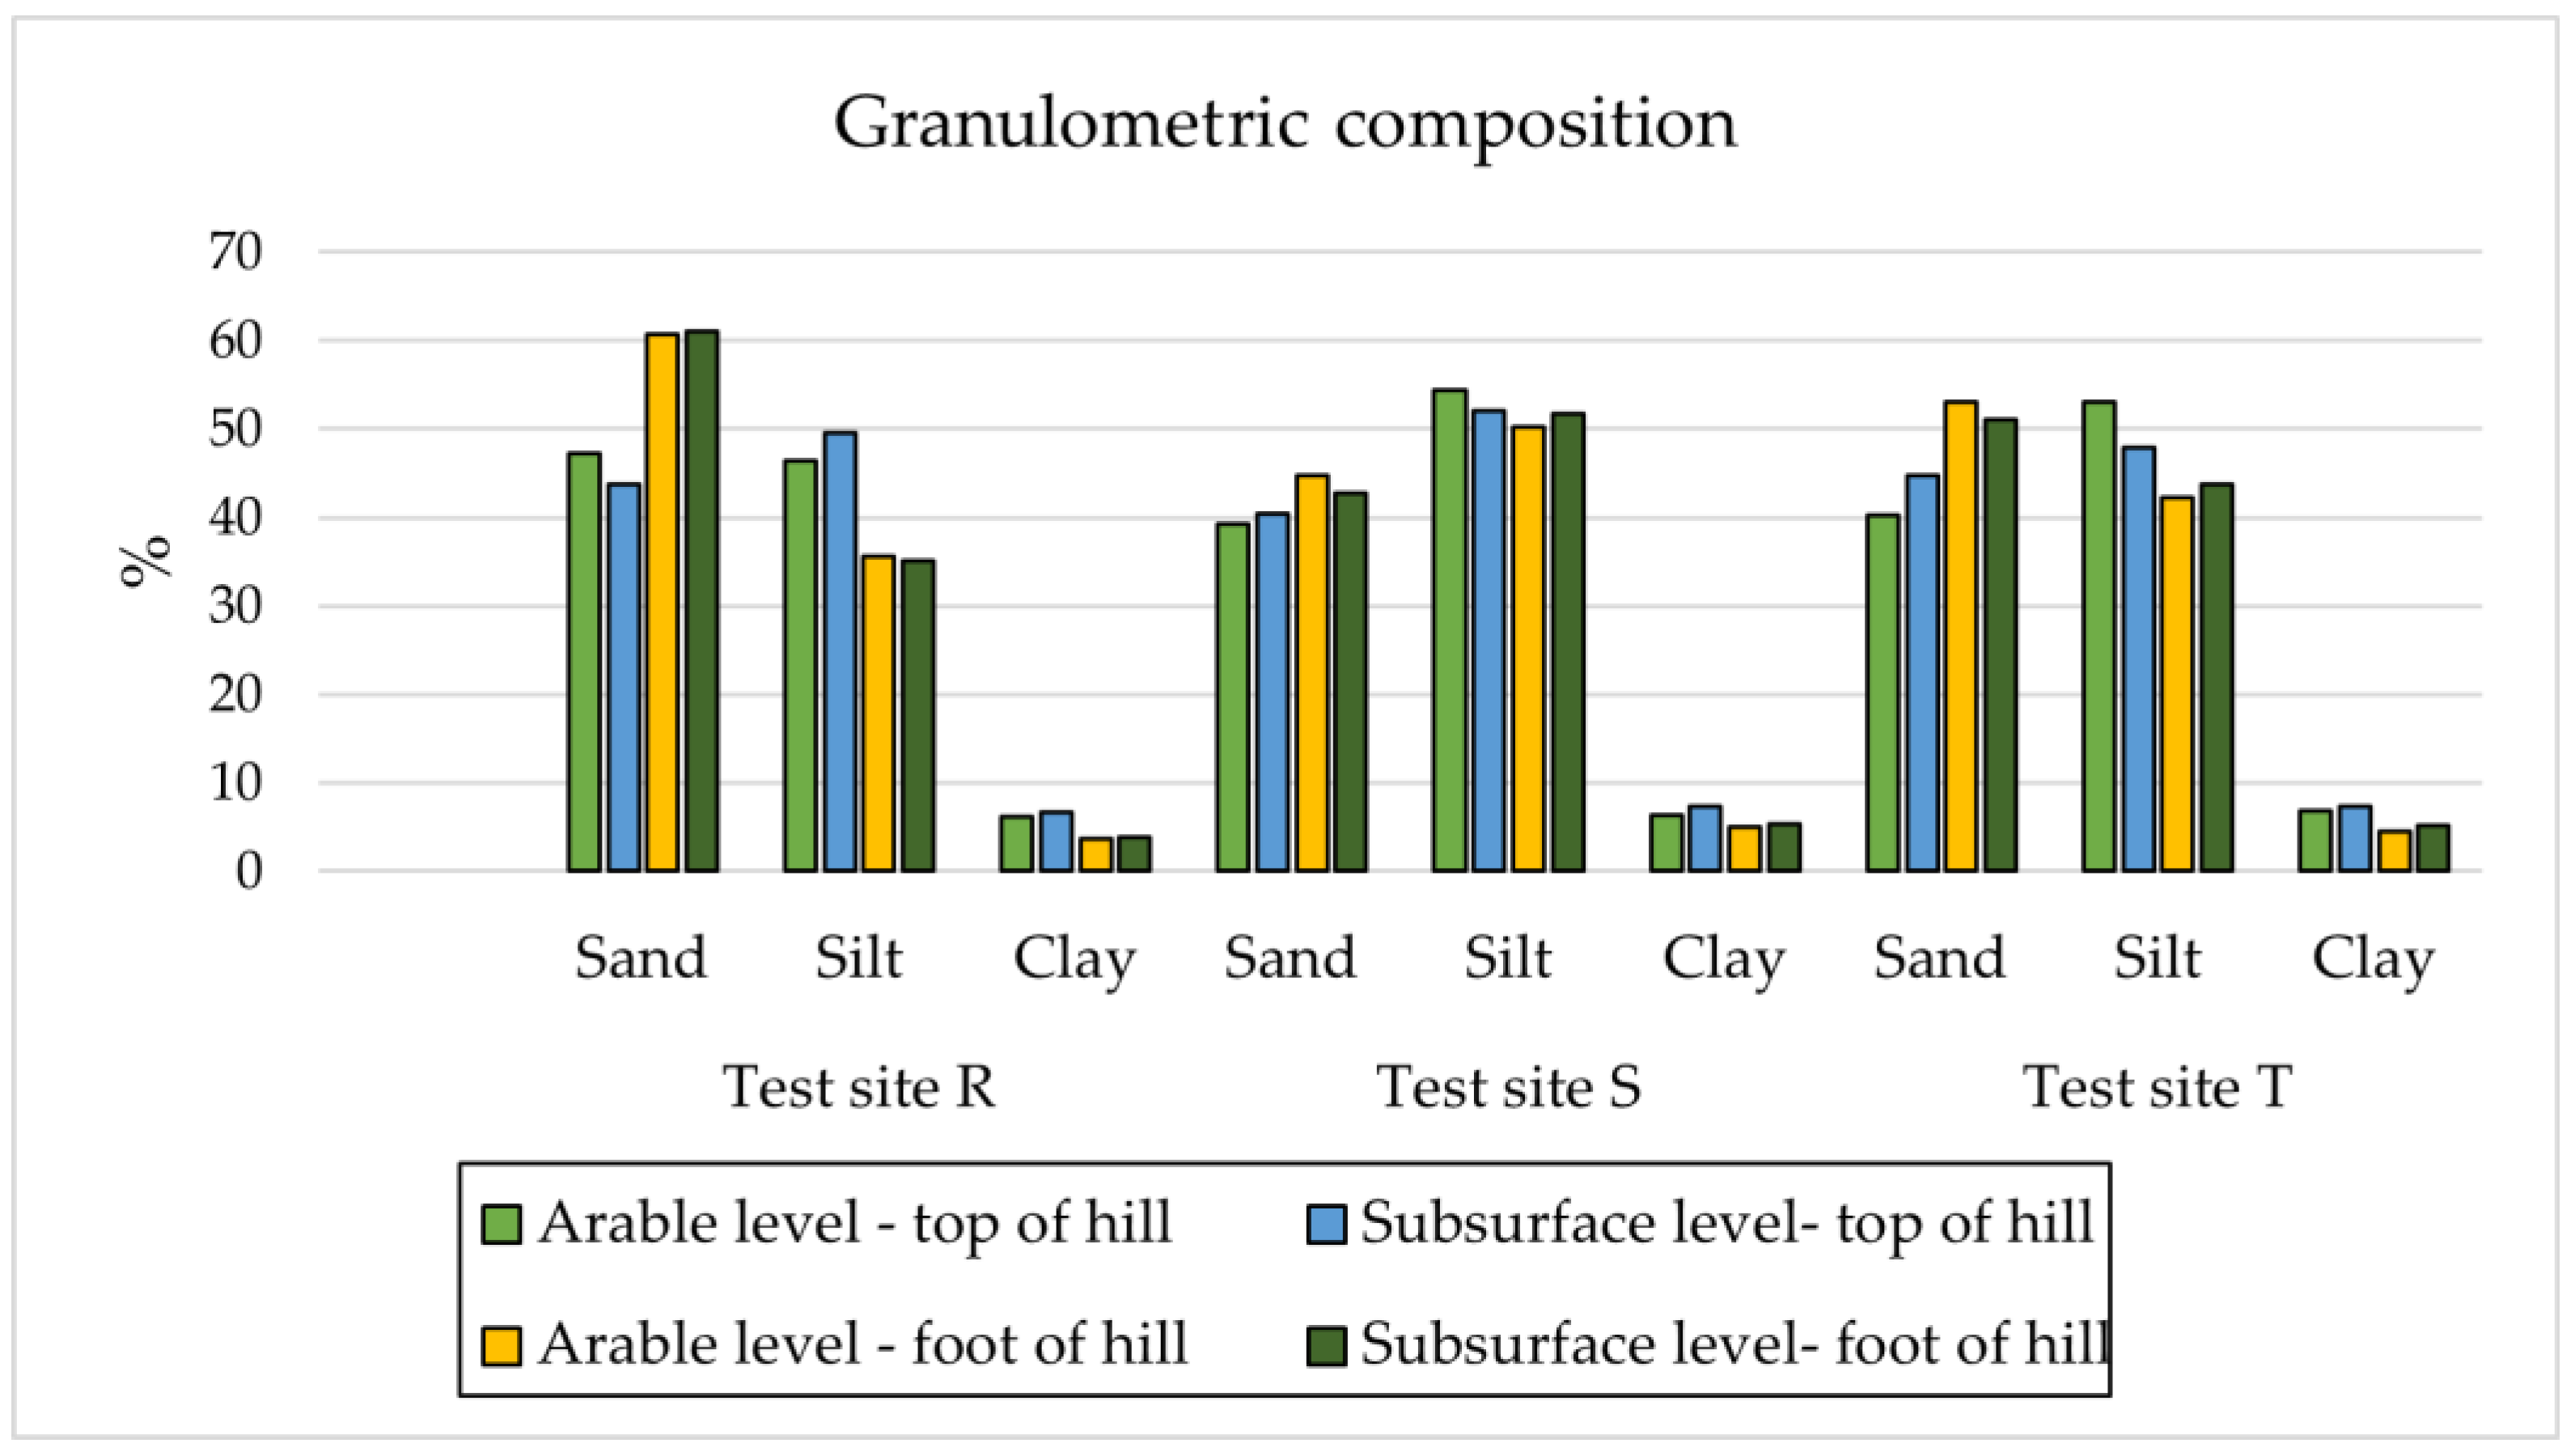
Figure 5.
PCA—principal component analysis. PC1, PC2 of the studied soil microbiological properties (B, Ac, Ft, Ce, Co, Ol) and chemical properties (pH, TOC, TN, content of available P, K, and Mg). Abbreviations: see Table 2 and Table 4.
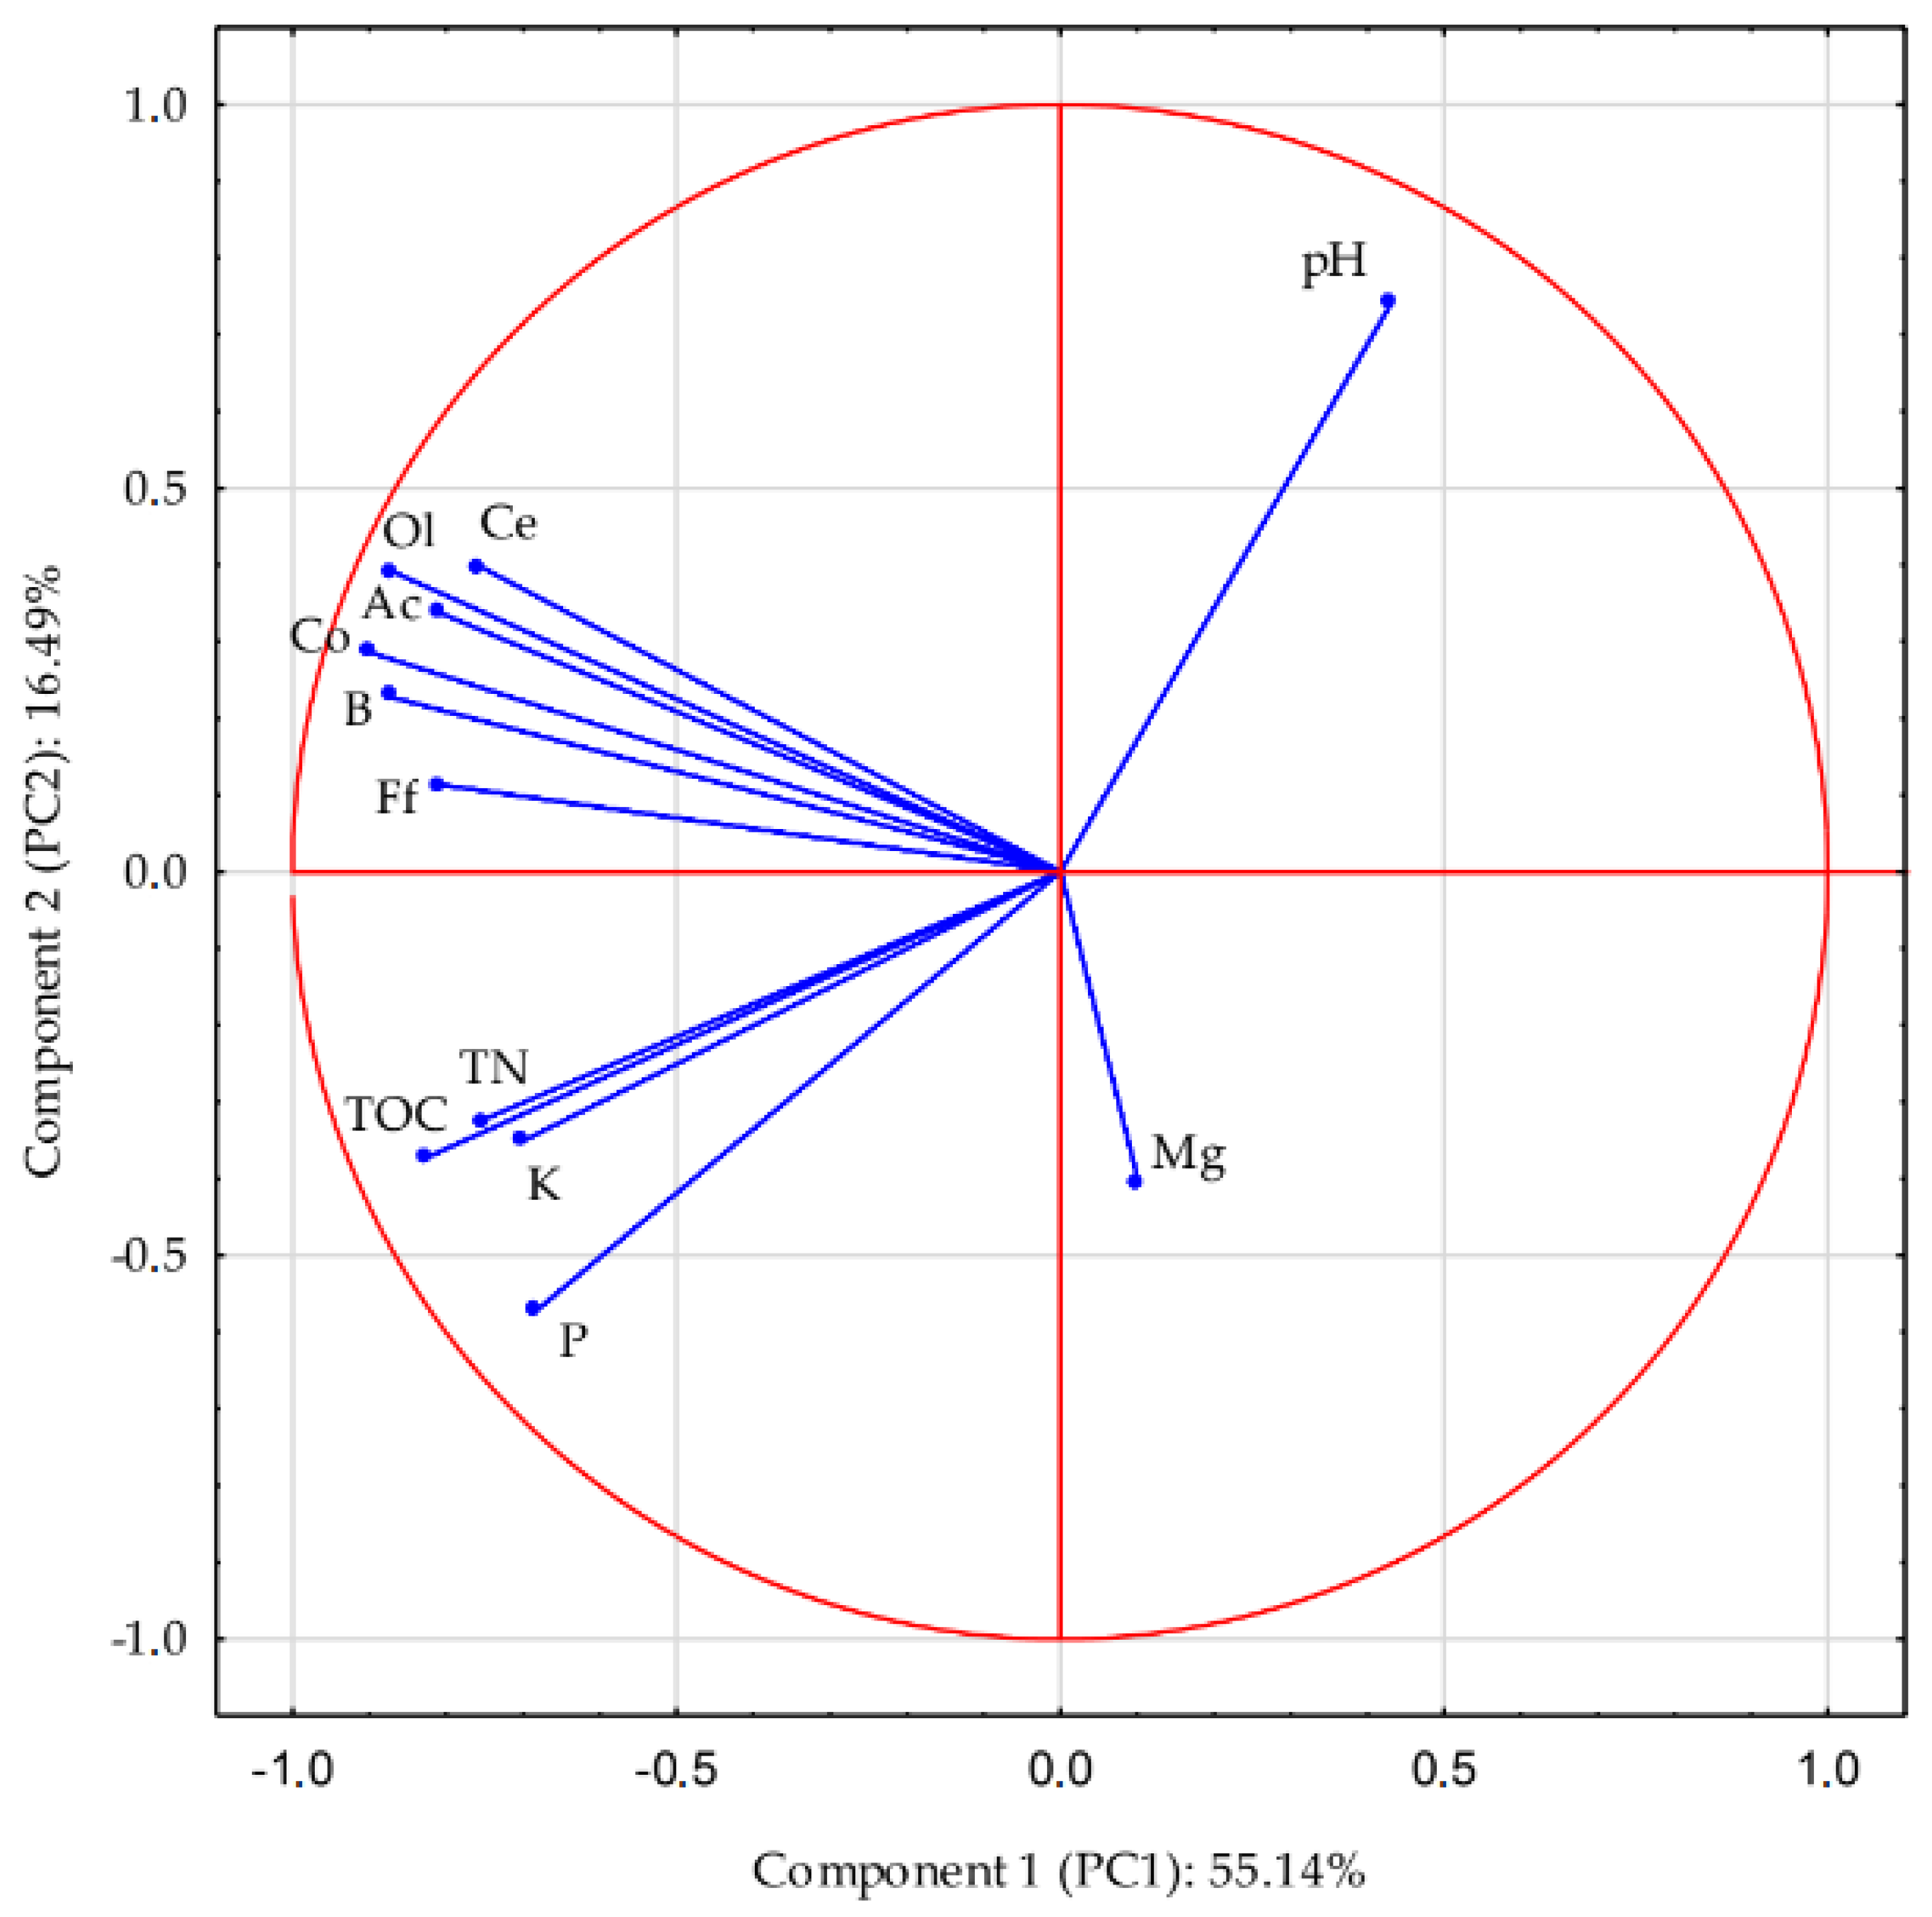
Figure 6.
Dendrogram analysis of physicochemical and microbial soil characteristics. Abbreviations: see Table 3.
Figure 6.
Dendrogram analysis of physicochemical and microbial soil characteristics. Abbreviations: see Table 3.


Table 1.
The compilation of media used for the isolation and cultivation of microorganisms from the investigated soil samples.
Table 1.
The compilation of media used for the isolation and cultivation of microorganisms from the investigated soil samples.
| Site | Profile | Soil Classification WRB 2022 [28] | Sampling |
|---|---|---|---|
| R | Ap-Bt-Ck1-Ck2 | Epicutanic Luvisol | A1—Summit: B1—Ap horizon; B2—Bt horizon |
| Ap-A2-Et-BC-C | Haplic Luvisol | A2—Footslope: B1—Ap horizon: B2—A2 horizon | |
| S | Ap-Ck1-Ck2-Ck3 | Calcaric, Eutric Regosol | A1—Summit: B1—Ap horizon; B2—Ck1 horizon |
| Ap-A2-Et-EB-Bt-C | Haplic Luvisol | A2—Footslope: B1—Ap horizon: B2—A2 horizon | |
| T | Ap-Ck1-Ck2-2Ck | Calcaric, Eutric Regosol | A1—Summit: B1—Ap horizon; B2—Ck1 horizon |
| Ap-A2-Et-EB-Bt1-Bt2-C | Haplic Luvisol | A2—Footslope: B1—Ap horizon: B2—A2 horizon |
Table 2.
The compilation of media used for the isolation and cultivation of microorganisms from the investigated soil samples.
Table 2.
The compilation of media used for the isolation and cultivation of microorganisms from the investigated soil samples.
| Tested Groups of Microorganisms | Applied Medium | Reference |
|---|---|---|
| Ac | Modified yeast extract-glucose medium (YGA) | [29] |
| B | Standard nutrient agar | [30] |
| Ff | Rose–Bengal agar with 30 µg mL−1 streptomycin | [30] |
| Ce | Agar containing 0.1% sodium carboxymethylcellulose | [31] |
| Ol | Modified medium with limited nutrients | [32] |
| Co | Modified medium with additional nutrients | [32] |
Table 3.
The number of bacteria, fungi, and actinomycetes in the soil, depending on the soil profile and location on the slope.
Table 3.
The number of bacteria, fungi, and actinomycetes in the soil, depending on the soil profile and location on the slope.
| Level of Factor B | Test Site R | Test Site S | Test Site T | ||||||
|---|---|---|---|---|---|---|---|---|---|
| Level of Factor A * | |||||||||
| A1 | A2 | Mean | A1 | A2 | Mean | A1 | A2 | Mean | |
| Heterotrophic bacteria (B) (106 cfu g−1) | |||||||||
| B1 | 27.3 a | 23.0 a | 25.2 a | 18.7 a | 18.7 | 18.7 a | 3.1 a | 24.0 a | 13.6 a |
| B2 | 6.1 a | 5.2 a | 5.7 b | 2.3 b | 2.4 | 2.3 b | 2.5 a | 1.3 b | 1.9 b |
| Mean | 16.7 | 14.1 | 10.5 | 10.5 | 2.8 | 12.6 | |||
| LSD0.05 | A = n.s.; B = 5.499; A/B = n.s.; B/A = n.s. | A = n.s.; B = 3.991; A/B = n.s.; B/A = n.s. | A = 7.685; B = 7.685; A/B = 10.868; B/A = 10.868 | ||||||
| Actinobacteria (Ac) (105 cfu g−1) | |||||||||
| B1 | 28.7 a | 30.7 a | 29.7 a | 18.0 a | 28.7 a | 23.3 a | 27.0 a | 52.0 a | 3.9 b |
| B2 | 18.7 a | 26.3 a | 22.5 a | 8.6 b | 6.8 b | 7.6 b | 2.0 a | 10.8 a | 6.4 a |
| Mean | 23.7 | 28.5 | 18.6 | 12.3 | 14.0 | 31.0 | |||
| LSD0.05 | A = n.s.; B = n.s.; A/B = n.s.; B/A = n.s. | A = 0.305; B = 0.305; A/B = 0.431; B/A = 0.431 | A = 1.252; B = 1.252; A/B = n.s.; B/A = n.s. | ||||||
| Filamentous fungi (Ff) (105 cfu g−1) | |||||||||
| B1 | 5.0 a | 3.0 a | 4.0 a | 3.0 a | 4.0 a | 3.2 a | 2.0 a | 13.0 a | 7.5 a |
| B2 | 1.0 a | 1.0 a | 1.4 b | 1.0 a | 2.0 a | 1.2 b | 1.0 b | 1.0 b | 1.0 b |
| Mean | 3.1 | 2.3 | 1.6 | 2.8 | 1.30 | 0.7 | |||
| LSD0.05 | A = n.s.; B = 0.133; A/B = n.s.; B/A = n.s. | A = 0.108; B = 0.108; A/B = n.s.; B/A = n.s. | A = 0.436; B = 0.436; A/B = 0.616; B/A = 0.616 | ||||||
* Levels of factor A: A1 (summit), A2 (footslope); Levels of factor B: B1 (surface level), B2 (subsurface level); LSD—Least Significant Difference, significance of differences tested with Tukey’s test at p ≤ 0.05; n.s.—not significant; a,b—letters in columns indicate significant differences at p ≤ 0.05.
Table 4.
The number of cellulolytic, copiotrophic, and oligotrophic microorganisms in the soil, depending on the soil profile and location on the slope.
Table 4.
The number of cellulolytic, copiotrophic, and oligotrophic microorganisms in the soil, depending on the soil profile and location on the slope.
| Level of Factor B | Test Site R | Test Site S | Test Site T | ||||||
|---|---|---|---|---|---|---|---|---|---|
| Level of Factor A | |||||||||
| A1 | A2 | Mean | A1 | A2 | Mean | A1 | A2 | Mean | |
| Cellulolytic microorganisms (Ce) (106 cfu g−1) | |||||||||
| B1 | 8.0 a | 5.3 a | 6.7 a | 6.3 a | 3.3 a | 4.8 a | 5.1 a | 4.8 a | 5.0 a |
| B2 | 1.0 a | 1.2 a | 1.1 b | 1.4 b | 3.3 a | 1.6 b | 0.5 a | 0.8 a | 0.6 b |
| Mean | 4.5 | 3.3 | 3.9 | 1.7 | 2.8 | 2.8 | |||
| LSD0.05 | A = n.s.; B = 2.255; A/B = n.s.; B/A = n.s. | A = 1.360; B = 1.360; A/B = 1.923; B/A = 1.923 | A = n.s; B = 4.218; A/B = n.s; B/A = n.s. | ||||||
| Copiotrophic microorganisms (Co) (106 cfu g−1) | |||||||||
| B1 | 14.3 a | 24.7 a | 19.5 a | 15.0 a | 19.3 a | 17.2 a | 11.3 a | 24.0 a | 15.5 a |
| B2 | 2.9 a | 6.0 a | 4.4 b | 2.6 a | 3.2 a | 3.0 b | 1.1 a | 1.3 a | 1.2 b |
| Mean | 8.6 | 15.3 | 8.8 | 11.3 | 4.0 | 12.7 | |||
| LSD0.05 | A = n.s.; B = 9.367; A/B = n.s.; B/A = n.s. | A = n.s.; B = 6.255; A/B = n.s.; B/A = n.s. | A = n.s.; B = 12.619; A/B= n.s.; B/A = n.s. | ||||||
| Oligotrophic microorganisms (Ol) (106 cfu g−1) | |||||||||
| B1 | 65.0 a | 40.0 a | 52.6 a | 51.0 a | 34.0 a | 42.5 a | 37.3 a | 64.0 a | 50.7 a |
| B2 | 13.9 a | 6.9 a | 10.4 b | 6.0 b | 14.2 b | 10.3 b | 2.2 a | 0.6 a | 1.4 b |
| Mean | 39.5 | 23.4 | 28.6 | 24.1 | 19.8 | 32.3 | |||
| LSD0.05 | A = 13.543; B = 13.543 A/B = n.s.; B/A = n.s. | A = n.s.; B = 9.224; A/B = 13.045; B/A = 13.045 | A = n.s.; B = 14.400; A/B = n.s.; B/A = n.s. | ||||||
Abbreviations: see Table 3. a,b—letters in columns indicate significant differences at p ≤ 0.05.
Table 5.
pH level, TOC, TN, available Mg, P, and K content of the soil, depending on the soil profile and location on the slope.
Table 5.
pH level, TOC, TN, available Mg, P, and K content of the soil, depending on the soil profile and location on the slope.
| Level of Factor B | Test Site R | Test Site S | Test Site T | ||||||
|---|---|---|---|---|---|---|---|---|---|
| Level of Factor A | |||||||||
| A1 | A2 | Mean | A1 | A2 | Mean | A1 | A2 | Mean | |
| pH value | |||||||||
| B1 | 6.33 a | 7.14 a | 6.73 a | 8.18 b | 6.48 a | 7.33 a | 8.36 b | 7.01 a | 7.66 a |
| B2 | 6.65 a | 6.94 a | 6.79 a | 8.52 a | 6.17 b | 7.34 a | 8.72 a | 6.67 b | 7.69 a |
| Mean | 6.49 | 7.04 | 8.35 | 6.33 | 8.54 | 6.82 | |||
| LSD0.05 | A = 0.313; B = n.s. A/B = n.s.; B/A = n.s. | A = 0.233; B = n.s. A/B = 0.330; B/A = 0.330 | A = 0.055; B = n.s. A/B = 0.077; B/A = 0.077 | ||||||
| Total Organic Carbon (TOC) (g·kg−1) | |||||||||
| B1 | 5.94 a | 7.30 a | 6.62 a | 6.92 a | 9.79 a | 8.33 a | 5.49 a | 9.21 a | 7.35 a |
| B2 | 2.85 b | 6.38 b | 4.62 b | 2.71 b | 8.25 b | 5.48 b | 3.94 b | 5.90 b | 4.92 b |
| Mean | 4.40 | 6.84 | 4.82 | 8.99 | 4.72 | 7.56 | |||
| LSD0.05 | A = 0.117; B = 0.117; A/B = 0.165; B/A = 0.165 | A = 1.055; B = 1.055; A/B = 1.492; B/A = 1.492 | A = 0.233; B = 0.233; A/B = 0.329.; B/A = 0.329 | ||||||
| Total Nitrogen (TN) (g·kg−1) | |||||||||
| B1 | 0.69 a | 0.71 a | 0.70 a | 1.05 a | 1.10 a | 1.08 a | 0.81 a | 0.90 a | 0.86 a |
| B2 | 0.50 a | 0.70 a | 0.60 a | 0.29 b | 0.92 b | 0.61 b | 0.40 b | 0.72 b | 0.56 b |
| Mean | 0.60 | 0.71 | 0.67 | 1.01 | 0.61 | 0.81 | |||
| LSD0.05 | A = n.s.; B = n.s.; A/B = n.s.; B/A = n.s. | A = 0.129; B = 0.129; A/B = 0.182; B/A = 0.182 | A = 0.091; B = 0.091; A/B = 0.129; B/A = 0.129 | ||||||
| Magnesium (Mg) (mg·kg−1) | |||||||||
| B1 | 30.7 a | 22.6 a | 26.65 a | 30.2 a | 27.6 a | 28.88 a | 17.5 a | 24.8 a | 21.13 a |
| B2 | 41.1 a | 19.8 a | 30.45 a | 21.00 a | 29.4 a | 25.18 a | 29.4 a | 30.2 a | 29.78 a |
| Mean | 35.90 | 21.20 | 25.55 | 29.40 | 23.45 | 27.45 | |||
| LSD0.05 | A = 11.851; B = n.s.; A/B = n.s.; B/A = n.s. | A = n.s.; B = n.s.; A/B = n.s.; B/A = n.s. | A = n.s; B = n.s.; A/B = n.s.; B/A = n.s. | ||||||
| Phosphorus (P) (mg·kg−1) | |||||||||
| B1 | 97.5 a | 119.1 a | 108.28 a | 32.5 a | 125.5 a | 79.00 a | 60.5 a | 122.7 a | 91.60 a |
| B2 | 51.7 b | 94.9 b | 73.28 b | 21.5 a | 98.9 a | 54.68 b | 31.1 b | 111.3 b | 71.20 b |
| Mean | 74.58 | 106.98 | 21.48 | 112.20 | 45.80 | 117.00 | |||
| LSD0.05 | A = 9.908; B = 9.908; A/B = 14.012; B/A = 14.012 | A = 10.175; B = 10.175; A/B = n.s.; B/A = n.s. | A = 6.276; B 6.276; A/B = 8.875; B/A = 8.875 | ||||||
| Potassium (K) (mg·kg−1) | |||||||||
| B1 | 128.4 a | 185.4 a | 156.9 a | 212.7 a | 251.0 a | 231.85 a | 125.8 a | 223.3 a | 174.55 a |
| B2 | 117.5 a | 101.2 b | 109.4 b | 116.3 a | 142.8 a | 129.55 b | 85.7 b | 221.1 a | 153.40 b |
| Mean | 122.93 | 143.30 | 164.50 | 196.90 | 105.75 | 222.20 | |||
| LSD0.05 | A = 13.381; B = 13.381; A/B = 18.923; B/A = 18.923 | A = 20.524; B = 20.524; A/B = n.s.; B/A = n.s. | A = 11.377; B = 11.377; A/B = 16.090; B/A = 16.090 | ||||||
Abbreviations: see Table 3. a,b—letters in columns indicate significant differences at p ≤ 0.05.
Table 6.
Sodium, potassium, magnesium, and calcium in the water-soluble fraction of surface soil horizon and values of soil electrical conductivity.
Table 6.
Sodium, potassium, magnesium, and calcium in the water-soluble fraction of surface soil horizon and values of soil electrical conductivity.
| Location | Na | K | Mg | Ca | ECs |
| g·kg−1 | µS·cm−1 | ||||
| R A1B1 | 6.6 ± 3.39 | 44.3 ± 1.27 | 15.9 ± 5.80 | 79.0 ± 1.84 | 93.4 ± 8.20 |
| S A1B1 | 12.7 ± 4.17 | 77.9 ± 3.81 | 17.3 ± 1.27 | 201.0 ± 9.90 | 118.0 ± 3.68 |
| T A1B1 | 8.7 ± 2.05 | 36.7 ± 0.92 | 16.4 ± 4.24 | 210.5 ± 2.12 | 166.9 ± 3.46 |
| Mean | 9.33 | 53.0 | 16.3 | 163.5 | 126.1 |
| R A2B1 | 16.4 ± 4.38 | 38.3 ± 4.38 | 15.7 ± 1.63 | 40.8 ± 3.53 | 101.7 ± 1.34 |
| S A2B1 | 11.1 ± 3.32 | 49.0 ± 1.63 | 13.7 ± 3.53 | 47.7 ± 3.61 | 148.6 ± 1.27 |
| T A2B1 | 10.0 ± 0.35 | 21.2 ± 1.55 | 15.3 ± 0.56 | 33.4 ± 0.28 | 105.9 ± 0.78 |
| Mean | 12.5 | 36.2 | 14.0 | 40.6 | 118.7 |
| p = 0.30 | p = 0.32 | p = 0.022 * | p = 0.045 * | p = 0.79 | |
Abbreviations: see Table 3; ECs—soil electrical conductivity, p—significance factor, *—statistically significant.
Table 7.
Sodium, potassium, magnesium, and calcium in the water-soluble fraction of subsurface soil horizon and values of soil electrical conductivity.
Table 7.
Sodium, potassium, magnesium, and calcium in the water-soluble fraction of subsurface soil horizon and values of soil electrical conductivity.
| Location | Na | K | Mg | Ca | ECs |
| g·kg−1 | µS·cm−1 | ||||
| R A1B2 | 9.5 ± 1.83 | 32.5 ± 1.55 | 11.6 ± 1.48 | 78.7 ± 4.10 | 70.2 ± 6.22 |
| S A1B2 | 10.7 ± 2.19 | 40.5 ± 3.60 | 17.3 ± 2.33 | 240.5 ± 3.53 | 68.6 ± 7.71 |
| T A1B2 | 10.6 ± 0,21 | 23.2 ± 0.99 | 13.6 ± 4.31 | 233.0 ± 2.12 | 159.3 ± 7.78 |
| Mean | 10.3 | 34.1 | 14.2 | 184.1 | 99.4 |
| R A2B2 | 12.5 ± 0.85 | 42.7 ± 0.28 | 19.7 ± 1.77 | 32.8 ± 1.91 | 117.8 ± 6.64 |
| S A2B2 | 12.3 ± 0.85 | 95.6 ± 0.56 | 22.5 ± 3.68 | 44.7 ± 1.77 | 148.5 ± 2.90 |
| T A2B2 | 12.8 ± 0.71 | 41.5 ± 0.14 | 18.6 ± 3.82 | 32.6 ± 0.21 | 105.7 ± 4.38 |
| Mean | 12.5 | 59.9 | 20.3 | 36.7 | 124.0 |
| p = 0.005 * | p = 0.21 | p = 0.04 * | p = 0.49 | p = 0.49 | |
Disclaimer/Publisher’s Note: The statements, opinions and data contained in all publications are solely those of the individual author(s) and contributor(s) and not of MDPI and/or the editor(s). MDPI and/or the editor(s) disclaim responsibility for any injury to people or property resulting from any ideas, methods, instructions or products referred to in the content. |
© 2023 by the authors. Licensee MDPI, Basel, Switzerland. This article is an open access article distributed under the terms and conditions of the Creative Commons Attribution (CC BY) license (https://creativecommons.org/licenses/by/4.0/).
Share and Cite
MDPI and ACS Style
Kanarek, P.; Breza-Boruta, B.; Pawłowski, M.; Kobierski, M. Evaluation of Microbiological and Chemical Properties of Soils as a Result of Anthropogenic Denudation. Agriculture 2023, 13, 2247. https://doi.org/10.3390/agriculture13122247
AMA Style
Kanarek P, Breza-Boruta B, Pawłowski M, Kobierski M. Evaluation of Microbiological and Chemical Properties of Soils as a Result of Anthropogenic Denudation. Agriculture. 2023; 13(12):2247. https://doi.org/10.3390/agriculture13122247
Chicago/Turabian StyleKanarek, Piotr, Barbara Breza-Boruta, Mateusz Pawłowski, and Mirosław Kobierski. 2023. "Evaluation of Microbiological and Chemical Properties of Soils as a Result of Anthropogenic Denudation" Agriculture 13, no. 12: 2247. https://doi.org/10.3390/agriculture13122247
Note that from the first issue of 2016, this journal uses article numbers instead of page numbers. See further details here.