
Effects of Tillage and Sowing Methods on Soil Physical Properties and Corn Plant Characters
1
College of Engineering, Northeast Agricultural University, Harbin 150030, China
2
Key Laboratory of Combining Farming and Animal Husbandry, Ministry of Agriculture and Rural Affairs, Harbin 150030, China
*
Author to whom correspondence should be addressed.
Agriculture 2023, 13(3), 600; https://doi.org/10.3390/agriculture13030600
Submission received: 16 January 2023
/
Revised: 17 February 2023
/
Accepted: 25 February 2023
/
Published: 1 March 2023
(This article belongs to the Special Issue Soil Management for Sustainable Agriculture)
Abstract
:In the northeast plains of China, the intensive utilization of agricultural soils has been a persistent issue, and finding ways to utilize soil resources efficiently and sustainably through a scientifically-driven management system has become a crucial challenge for agricultural production. Conservation tillage is a crucial technology for sustainable agriculture. Currently, plow and rotary tillage are the dominant methods used in Mollisols, but there is limited information on the effects of different conservation tillage practices in this region. The objective of this study was to investigate the short-term impact of tillage and sowing methods on soil physical properties and corn plant growth and to examine the relationship between soil physical properties and plant characteristics during various stages of growth. This study consisted of four tillage and sowing methods: plow tillage and precision seeder sowing (PTS), rotary tillage and precision seeder sowing (RTS), no-tillage and no-tillage seeder sowing (NTS), and no-tillage and precise sowing in stubble field (STS) (all four treatments involved total straw return). The results indicated that the soil penetration resistance (SPR) in the 10–40 cm soil layer under the PTS treatment was significantly lower (by 11.9% to 18%) compared to the other treatments (p < 0.05). On average, the soil moisture content in the NTS treatment was 2.7% and 1.4% higher than that of the PTS and RTS treatments. Additionally, soil temperature was 5.6% to 8.6% lower under the STS treatment compared to the other treatments during late corn growth. The RTS treatment also significantly reduced the bulk density of surface soil. High SPR impeded early crop growth but did not impact mid-crop development, while low soil temperature was one of the main factors affecting late corn growth and development as temperatures decreased. Based on the comparisons, we found that the short-term implementation of conservation tillage did not result in a significant decrease in corn yield. We believe that the short-term implementation of NTS tillage sowing practices in Mollisol regions is a feasible option.
1. Introduction
Northeast China boasts a significant amount of straw production and low average temperatures, making it a critical and challenging region for the comprehensive mineralization of straw in the country [1]. To effectively utilize straw and minimize the negative impact of straw returning to the fields during actual production, combining tillage measures can significantly improve the utilization efficiency of straw. However, extended and extensive tillage leads to a rapid depletion of soil nutrients [2]. This is especially true in the black soil region of Northeast China, where long-term and intensive tillage causes the soil environment to deteriorate and the plow layer to become shallow [3]. The objective of soil tillage is to create an environment suitable for crop growth by storing water and maintaining moisture and to enhance crop production. Selecting the appropriate tillage methods to improve soil structure and balance the relationship between various components in the soil environment will create favorable conditions for crop growth and increase production and efficiency through mechanical action [4]. Currently, plowing and rotary tillage are the main tillage methods used in Northeast China. Deep-plowing combined with straw or organic fertilizer can significantly improve soil physical structure, optimize soil three-phase ratio, and increase corn yield and harvest index [5]. A study conducted by Misbah in Ethiopia found that short-term deep tillage significantly reduced soil bulk density and penetration resistance, significantly increased soil infiltration rates, and effectively countered soil degradation [6]. Rotary tillage can decrease soil bulk density in the 0–20 cm soil layer, increase the field’s water-holding capacity and soil porosity, and significantly enhance seedling plant height, stem diameter, leaf area, and dry weight per plant [7,8]. In his study of the Mediterranean region, Pietro believes that rototilling exposes organic matter to oxidation processes, crushing it and destroying soil aggregates [9]. Conservation tillage has significant ecological benefits, improving soil quality, enhancing water and fertilizer retention capacity, and controlling soil erosion. Currently, conservation tillage technologies centered on straw mulching and reduced/no-tillage are widely promoted in Northeast China. No-tillage has a positive impact on soil physical properties, but the extent of change varies with time and soil texture, and the implementation of no-tillage should be combined with straw mulching and crop rotation [10,11]. In comparison to traditional tillage, the yield-increasing effect of no-tillage with stubble increased as the planting years expanded [12]. Kahlon found that long-term use of conservation tillage and straw mulch enhances soil structural stability and carbon sequestration and that no-tillage has a higher infiltration capacity and better hydraulic conductivity than plow tillage and a lower stockpile density and infiltration resistance than tillage in the east-central region of the United States [13]. The impact of soil’s physical properties on plant growth is significant, and no-tillage practices can have negative effects. No-tillage increases soil penetration resistance (SPR) and reduces soil temperature, which can hinder the accumulation of dry matter in maize during the seedling stage and negatively impact yield formation [14]. On the other hand, deep plowing can effectively reduce soil penetration resistance and promote the early above-ground growth of crops [15]. Research has indicated that SPR can not only affect soil physical properties but also have a profound impact on crop growth and yield [16,17]. Currently, research has been focused on the effects of various tillage and planting methods on soil physical properties and crop yield. However, it remains unclear how soil physical properties impact crop growth and development under different tillage and sowing methods. Conservation tillage is a key technology for sustainable agricultural development, but various conservation tillage practices can have different impacts on the soil environment. When compared to no-tillage with stubble cutting, no-tillage and precise sowing in stubble fields are more effective in protecting the soil from wind and rain erosion. Nonetheless, studies are mostly limited to the performance and adaptability of no-tillage precision seeders, and there has been limited research on the impact of no-tillage and precise sowing in stubble fields on soil physical properties and crop growth. In the Mollisols region of Northeast China, field positioning tests were conducted to analyze the effects of different tillage and planting methods on soil physical properties and crop yield under the condition of total straw return. Four methods were selected for this analysis: plow tillage and sowing, rotary tillage and sowing, no-tillage and sowing, and no-tillage and precise sowing in stubble fields. This study also explores the impact of soil physical properties on plant growth during different stages, using redundancy analysis. These findings will provide a foundation for enhancing soil quality in the Northeast Mollisol region and selecting the most appropriate tillage and planting methods based on local conditions.
2. Materials and Methods
2.1. Experimental Site
Experiments in the field were carried out at the Xiangyang Experimental Base (located at latitude 126.92° E and longitude 45.77° N) of Northeast Agricultural University in Heilongjiang Province, China. The region experiences a continental monsoon climate, with an average temperature of 3.7 °C per year and an average rainfall of 400–600 mm. The area enjoys a frost-free period that lasts 135–145 days annually. The temperature and rainfall patterns during the experiment are depicted in Figure 1. The soil used in this study was silty clay loam Mollisols, and its physical and chemical characteristics are presented in Table 1 [18].
2.2. Experimental Design
The test was carried out from October 2020 to September 2021, and the data was collected on 20 June 2021 (50 days after corn sowing), 10 August 2021 (100 days after corn sowing), and 30 September 2021 (150 days after corn sowing). The experiment consisted of four treatments: plow tillage and precision seeder sowing (PTS); rotary tillage and precision seeder sowing (RTS); no-tillage and no-tillage seeder sowing (NTS); and no-tillage and precise sowing in stubble fields (STS). All treatments were carried out under conditions of total straw return. Table 2 lists the details of the four tillage and sowing methods. The treatments were designed using a completely randomized block method with three repetitions each. Each treatment was 8 m in length and 2.6 m in width. The corn was planted in ridges with a 65 cm row spacing and an average plant spacing of 23 cm. All other planting and management practices were in line with the local conventional farming methods.
2.3. Methods for Determination of Indicators and Analysis
The soil physical properties and corn plant characters data were measured at 50 days, 100 days, and 150 days after corn sowing, and the yield was measured after harvest under different tillage and sowing methods.
2.3.1. Methods for Determination of Soil Physical Properties
Soil penetration resistance (SPR) and soil temperature were measured directly in the field, while soil bulk density and soil moisture content were calculated by taking in situ soil and measuring the relevant indexes in the laboratory, and there was no rainfall in the test field for 5 consecutive days before the data testing. SPR data were measured using a PV6.08 penetration resistance meter (test accuracy: 0.1 MPa) manufactured by Eijkelkamp. (There was no rainfall for five consecutive days before the SPR measurements were taken, with the focus on the ultimate effect of the SPR under different treatments. Therefore, the analysis of the SPR data was not adjusted for covariates using soil water content data). One profile was selected for each plot, with three replications, and the measurement depth was 0–80 cm. The center line of the seedling strip was used as the central measurement point of the section, and a pair of measurement points were set up every 11 cm on both sides, with a section width of 66 cm. The SPR data were collected automatically at 1 cm depth intervals [19].
Determination of soil temperature at 5 cm, 15 cm, 25 cm, and 35 cm depth using TPJ-21 soil temperature recorder (test accuracy: 0.5 °C), 4 layers, and 3 repetitions [20]. The undisturbed soil at a depth of 5 cm, 15 cm, 25 cm, and 35 cm was taken using a ring knife (volume V = 100 cm3), 4 layers, and 3 repetitions. Using JE1002 electronic balance (testing accuracy: 0.01 g) to weigh the aluminum box, the soil sample, and the total weight of the aluminum box. Drying the soil sample using DG-101-1S electric constant temperature drying oven (testing accuracy: ±1 °C), and the moisture content at different soil depths was determined according to national standard NY/T 52-1987 [21], based on which the soil bulk density was calculated [20].
2.3.2. Methods for Determination of Plant Growth Characters and Yield Components
Ten plants were randomly selected from each plot, and multiple measurements were taken to study their growth. The height of the corn plant was measured from the top of the spike to the base of the stem using steel tape with a precision of 0.1 cm. The diameter of the stem was determined by measuring the maximum width of the second section using a vernier caliper with a precision of 0.01 mm [22]. The spike height from the corn base to the bottom was measured using steel tape with a precision of 0.1 cm 150 days after sowing [23]. The full length of the cob was measured with steel tape having an accuracy of 0.1 cm, and the spike length was calculated. The length of the cob’s convex tip, without the corn kernels, was measured using a vernier caliper with a precision of 0.01 mm. The sample plants were further examined by removing the corn bush leaves and whiskers, counting the number of rows per ear and grains per row, and determining the weight of 100 harvested corn seeds [20].
2.3.3. Method for Determination of Corn Yield
After corn ripening, we randomly select two adjacent ridges in each test plot, 3.85 m long (5 m2), as the production test area. After manual threshing, the grain quality was measured by electronic balance. The dry matter quality of corn grains was measured by the whole grain-drying method according to national standard GB/T5009.3-2016 [24]. The corn grain moisture content C0 (%) in the test plot is calculated as follows:
where
m0 = the mass of the aluminum box and the sample before baking, g,
m1 = the mass of the aluminum box and the sample after baking, g, and
m = the mass of the aluminum box, g.
The corn yield M (g) under the condition of standard moisture content in the test plot is as follows:
where
C = the standard moisture content of corn; here, C = 14%.
2.4. Methods of Data Analyses
The test data was plotted with Origin 2018. Statistical analysis was performed by SPSS 23.0. Correlation analysis was made by R software, and redundancy analysis was made by Canoco 5.0 [25].
3. Results
3.1. Effects of Tillage and Sowing Methods on Soil Physical Properties
3.1.1. Effects of Tillage and Sowing Methods on SPR
In order to visually compare the differences of SPR in different periods under each treatment method, the tested 0–80 cm was divided into 8 soil layers equally with 10 cm as a soil layer, and the SPR of different soil layers in different periods under different tillage and sowing methods were analyzed for significance, and the results are shown in Table 3.
The results indicate that the tillage sowing methods had a significant impact on soil penetration resistance (SPR) at various depths and times. Overall, SPR tended to increase with increasing soil depth. At 50 days after sowing, the PTS treatment showed an 11.9% to 18% lower SPR compared to other treatments in the 10–40 cm soil layer (p < 0.05). Conversely, the NTS treatment displayed a 21.6% to 23.6% higher SPR compared to other treatments in the 30–80 cm soil layer (p < 0.05). At 100 days after sowing, the differences among treatments in the 0–40 cm soil layer were minimal. However, in the 50–80 cm soil layer, the NTS treatment showed a higher SPR compared to other treatments by 18.2% to 31.9% (p < 0.05). At 150 days after sowing, the NTS treatment had a higher SPR than other treatments in all soil layers except for the 30–40 cm layer. In general, the average SPR variation among soil layers was in descending order for the STS treatment (12.8%), followed by NTS (12.7%), RTS (9.9%), and PTS (9.9%) treatments. Between 50 to 100 days after sowing, the SPR for each treatment generally showed a decrease. The largest decrease was observed in the 10–20 cm soil layer under the NTS treatment. From 100 to 150 days after sowing, the changes in SPR were primarily concentrated in the 10–30 cm soil layer. The SPR for the PTS, RTS, and STS treatments decreased, while it increased for the NTS treatment.
3.1.2. Effects of Tillage and Sowing Methods on Soil Moisture Content and Temperature
According to Figure 2, the impact of tillage methods on soil moisture content is primarily evident in the soil depth range of 5 to 15 cm. At 50 days after sowing (Figure 2a), the tillage method had a pronounced effect on the moisture content of the 5 cm soil layer. The PTS treatment resulted in 11.2% and 10.7% lower moisture content compared to the RTS and STS treatments, respectively. Furthermore, the PTS treatment was significantly lower than the NTS treatment at 12.7% (p < 0.05). The highest mean variation in moisture content with increasing soil depth was observed in the PTS treatment, reaching 7.5%. At 150 days after sowing (Figure 2c), the tillage methods had a notable impact on the soil layer between 5 to 15 cm. In the 5 cm soil layer, the moisture content of the PTS treatment was significantly lower compared to the other treatments, with a range of 6.5% to 9.8% (p < 0.05). Meanwhile, in the 15 cm soil layer, the moisture content of the NTS treatment was significantly higher compared to the RTS treatment by 4.8% (p < 0.05). Among the three tests, the mean soil moisture content values in each soil layer followed a descending order of NTS, STS, RTS, and PTS. The NTS treatment increased the soil moisture content by 2.7% and 1.4% in comparison to the PTS and RTS treatments, respectively. On the other hand, the STS treatment increased the soil moisture content by 1.8% and 0.5% in comparison to the PTS and RTS treatments, respectively.
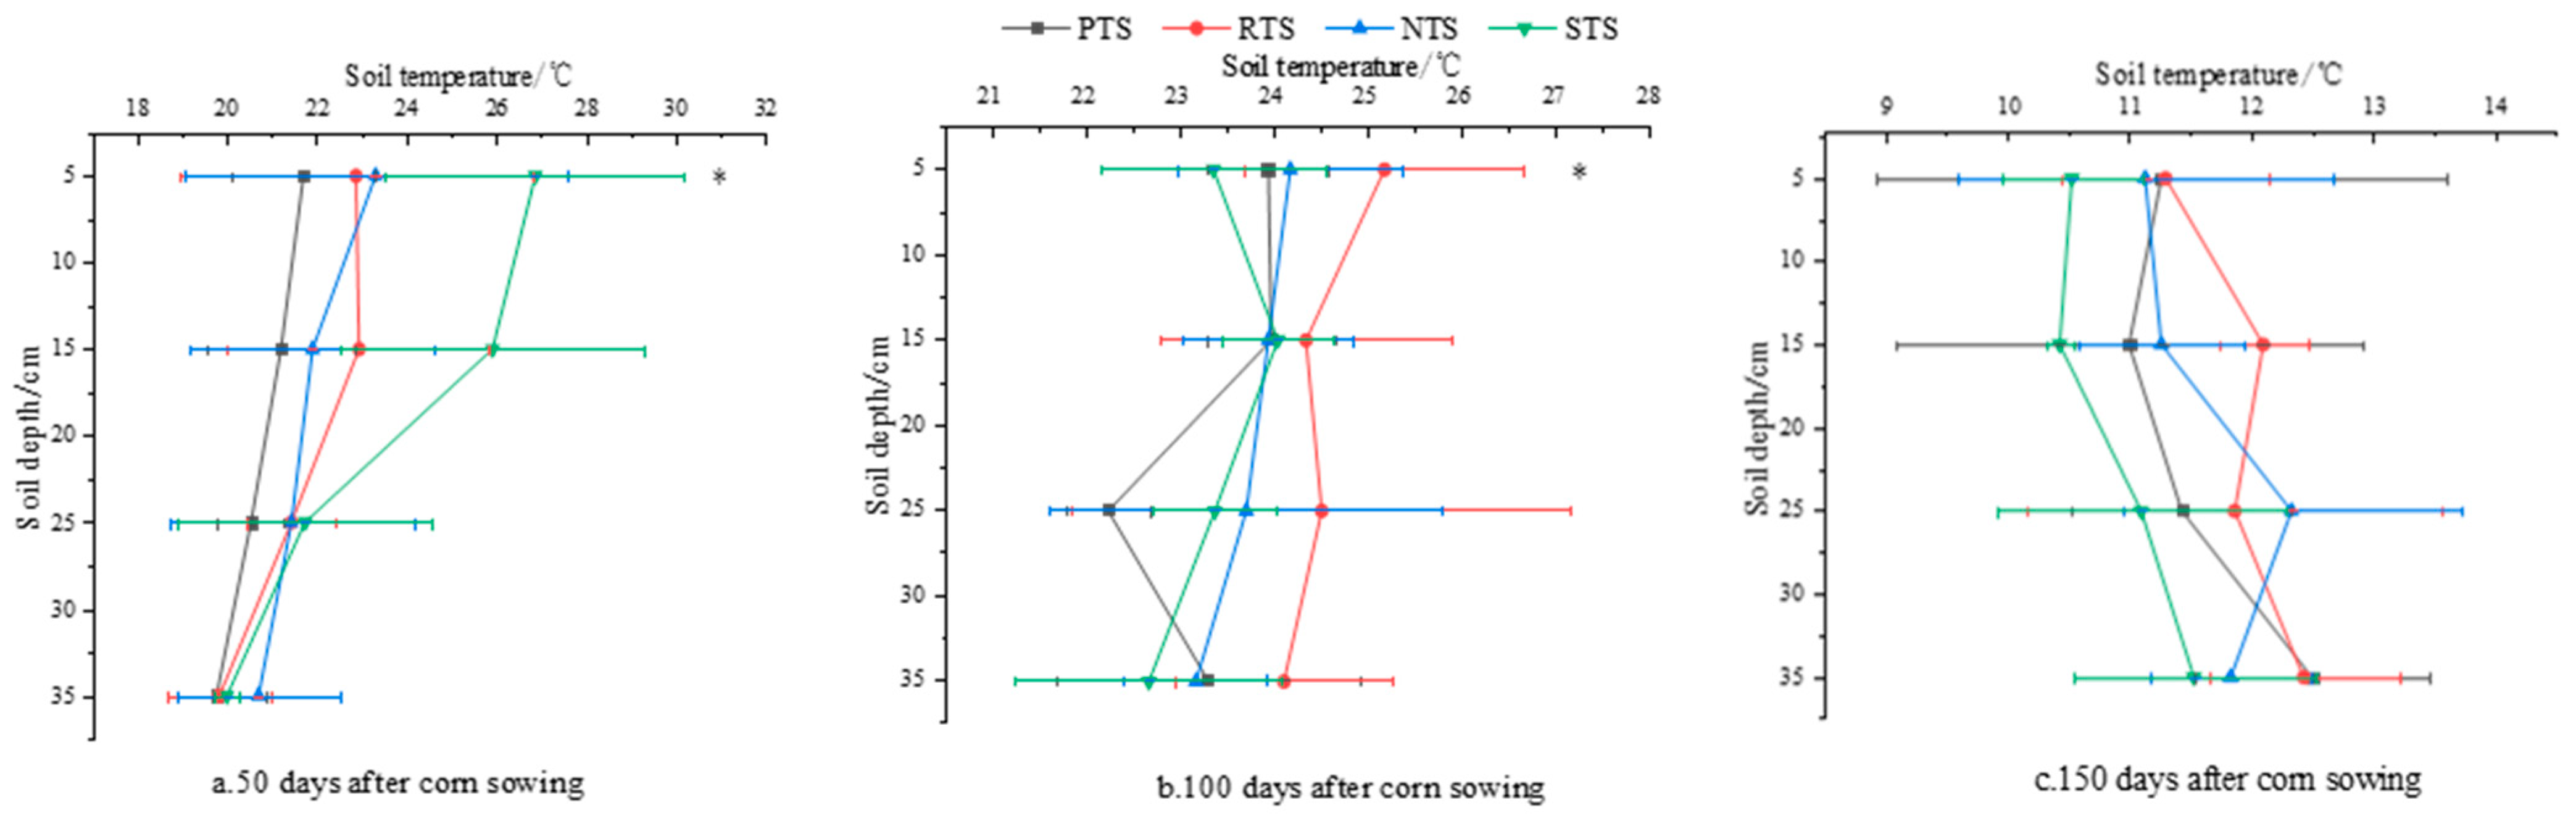
The impact of the tillage method on surfer soil temperature was significant (Figure 3). At 50 days after sowing (Figure 3a), the soil temperature in the 5 cm layer was 17.4% and 15.2% higher in the STS treatment compared to the RTS and NTS treatments, respectively. Additionally, the STS treatment was found to be 23.7% higher than the PTS treatment (p < 0.05). At 100 days after sowing (Figure 3b), the RTS treatment showed an increase in soil temperature by 5.2% and 4.1% compared to the PTS and NTS treatments, respectively. Moreover, the RTS treatment was 7.8% higher than the STS treatment (p < 0.05). In the 5–35 cm soil layer, the soil temperature was found to be higher in the RTS treatment compared to all other treatments. At 150 days after sowing (Figure 3c), the soil temperature in the 5–35 cm layer of the STS treatment was lower than the other three treatments, ranging from a decrease of 5.6% to 8.6%. The soil temperature showed a declining trend with increasing depth at 50 and 100 days after sowing. However, as the temperature drops, at 150 days after sowing, the overall trend of soil temperature showed an increase with the increase of soil depth, suggesting the transmission of heat from the bottom to the top. In the 5 cm soil layer, the soil temperature of the NTS, STS, RTS, and PTS treatments decreased by 5.9%, 8.7%, 9.1%, and 9.9%, respectively, with the order of soil temperature being RTS > PTS > NTS > STS.
3.1.3. Effects of Tillage and Sowing Methods on Soil Bulk Density
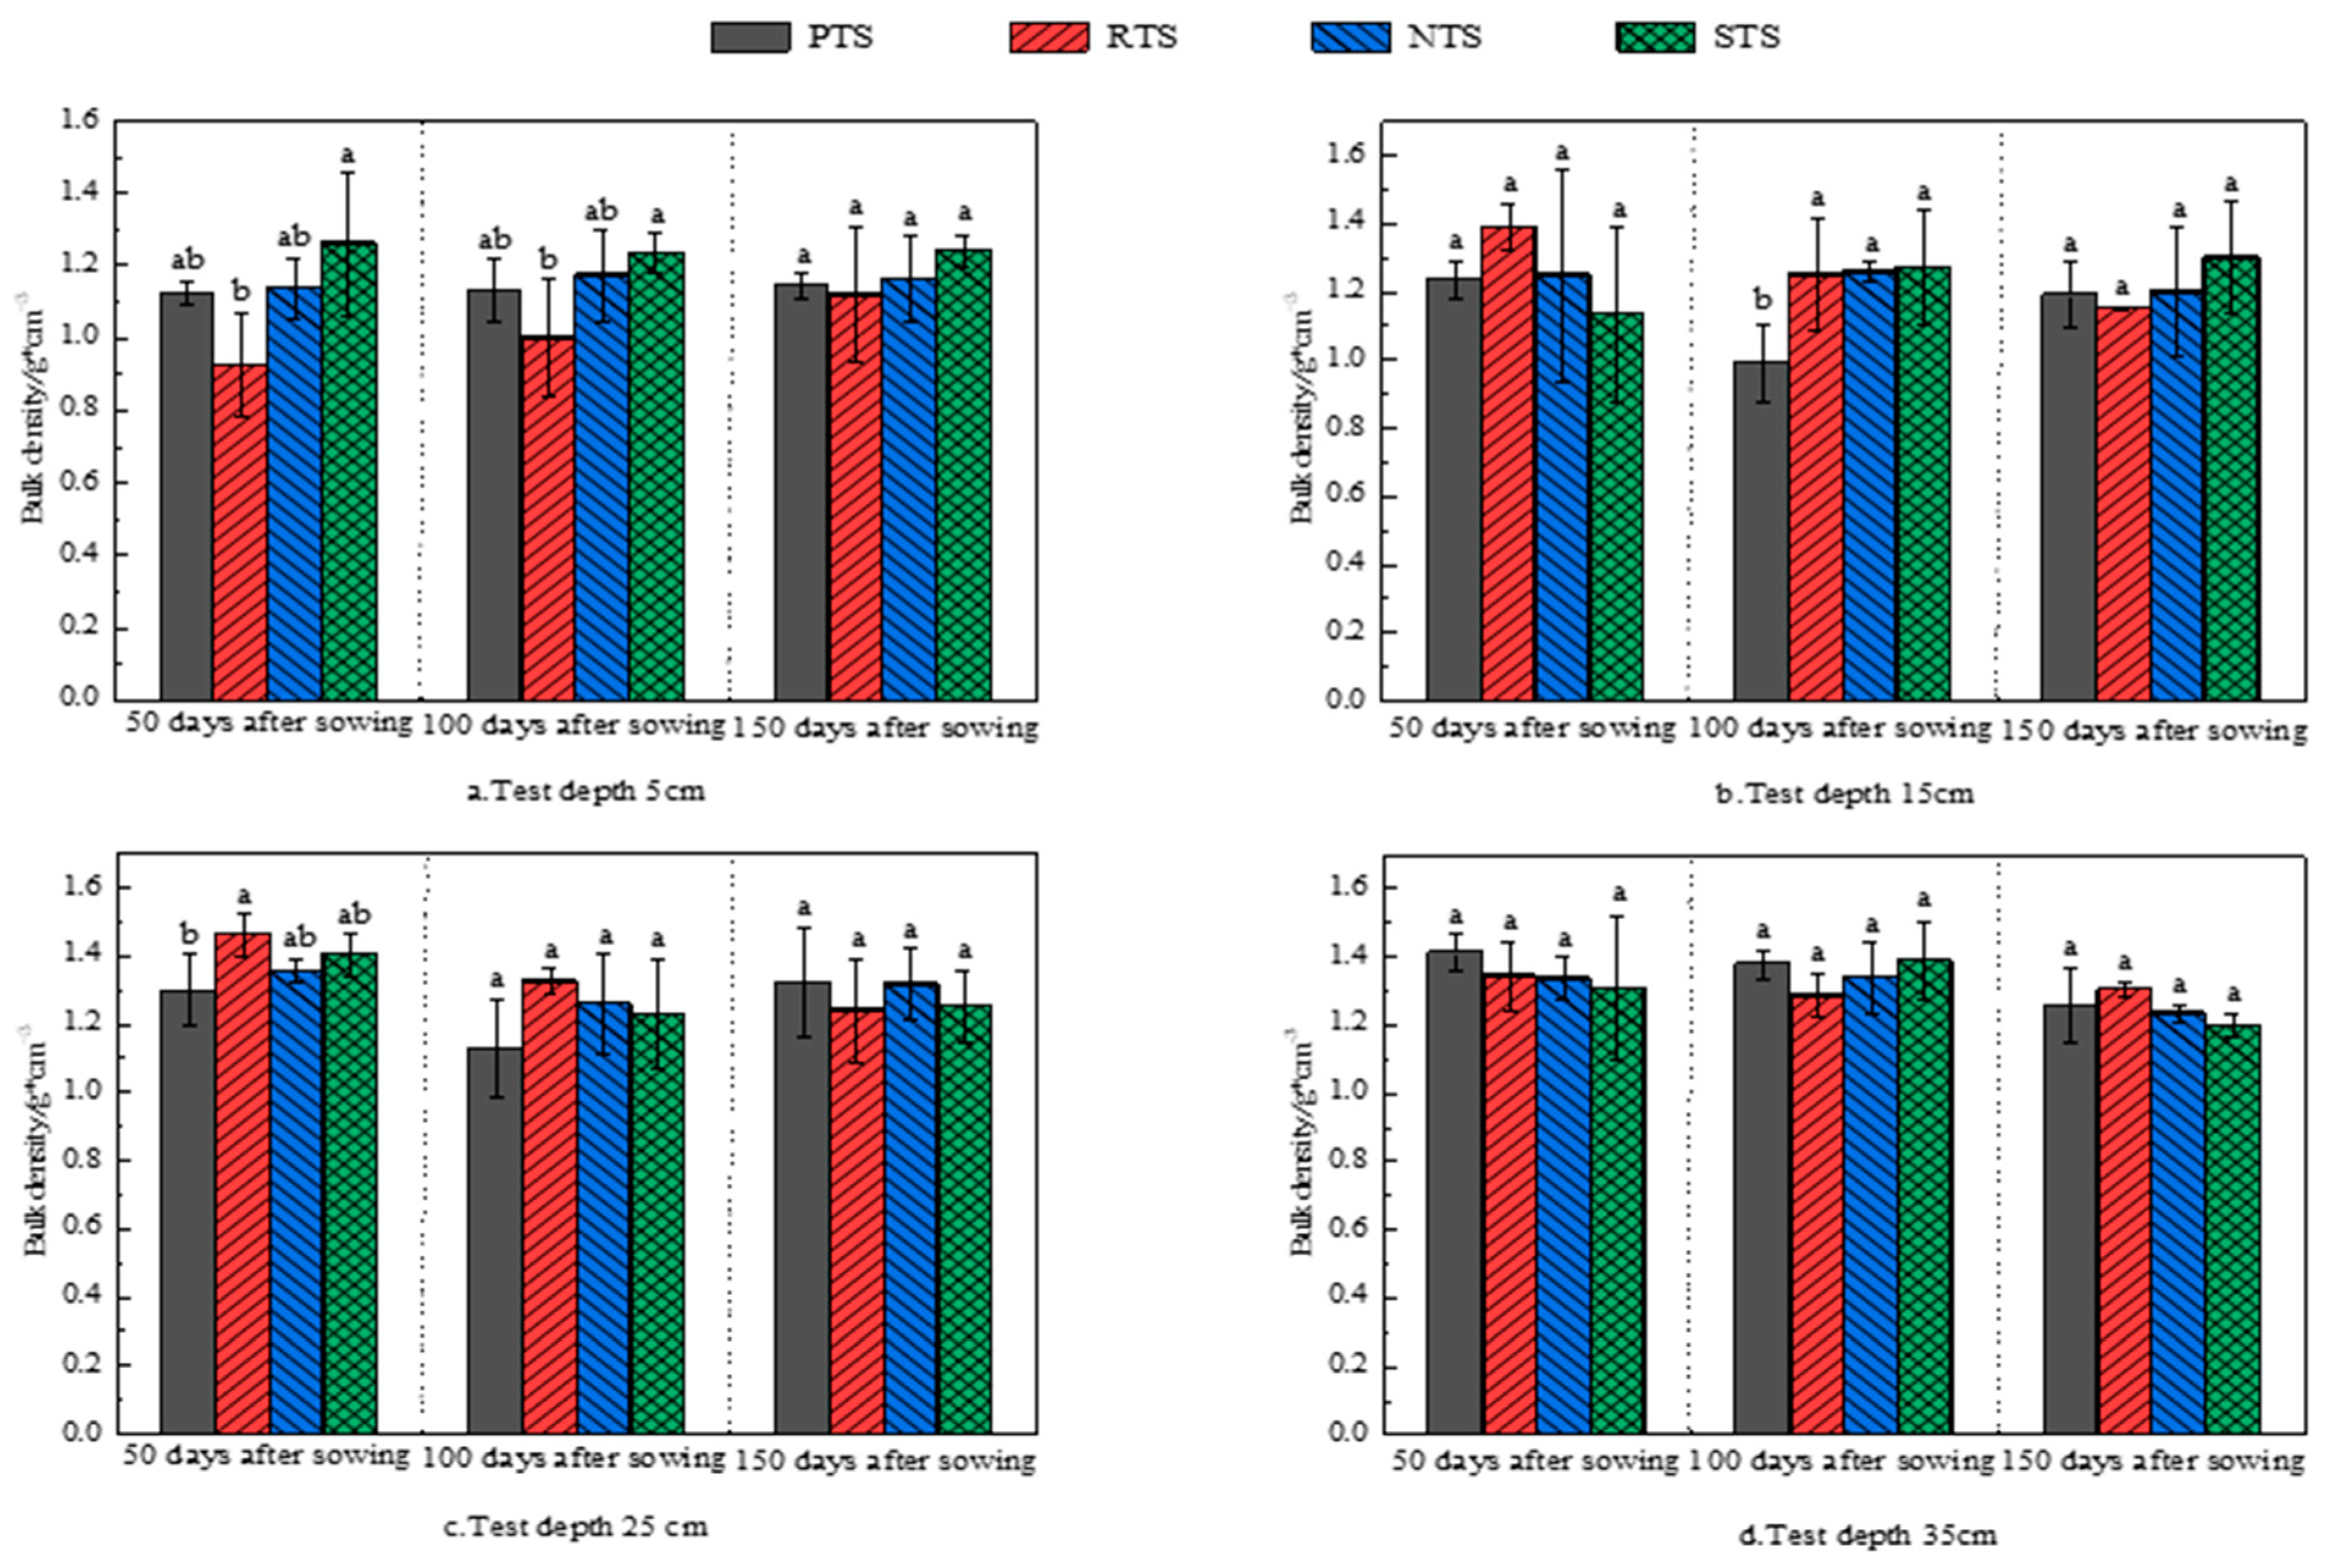
The response law of soil bulk density under four tillage and sowing methods is shown in Figure 4.
Overall, soil bulk density increases with depth. However, in the 5-cm soil layer (Figure 4a), the soil bulk density of RTS decreases significantly by 26.5% and 18.9% compared to STS after 50 and 100 days of sowing, respectively (p < 0.05). As time goes by, the soil bulk density of RTS increases, and after 150 days of sowing, there is no significant difference compared to other treatments. On average, the soil bulk density of PTS is 2% and 8.9% lower than NTS and STS, respectively. Meanwhile, the soil bulk density of RTS is, on average, 12.3% and 18.4% lower than NTS and STS, respectively. In the 15 cm soil layer (Figure 4b), the PTS treatment resulted in a significantly lower soil bulk density of 20.9% to 22.1% compared to the other three tillage sowing methods after 100 days of sowing (p < 0.05). In the 25 cm soil layer (Figure 4c), the soil bulk density of the RTS treatment was significantly higher than that of the PTS treatment by 12.8% after 50 days of sowing (p < 0.05). The difference in soil bulk density between treatments is more significant in the 5 cm soil at 50 and 100 days after corn sowing but is not significant in the 35 cm soil 50–150 days after corn sowing. At the same depth, the difference in soil bulk density between treatments gradually decreases with time. RTS exhibits a smaller average soil bulk density in 0–30 cm soil depth 150 days after corn sowing. From 50 to 100 days after sowing, there was an overall decreasing trend in soil bulk density for PTS, RTS, and NTS, while STS showed an increasing trend. In the 25 cm soil layer, all four treatments showed a decrease in soil bulk density, with the greatest decrease observed in the PTS treatment and the smallest decrease in the NTS treatment. From 100 to 150 days after sowing, RTS, NTS, and STS showed a decreasing trend in soil bulk density, while the PTS treatment showed an increasing trend. The change in soil bulk density was not consistent among the different treatments across different soil layers.
3.2. Effects of Tillage and Sowing Methods on Plant Characters and Yield
The growth of corn plants under different tillage and sowing methods is shown in Figure 5.
Under different tillage and sowing methods, there is a significant difference in corn plant height 50 days after sowing (Figure 5a). The plant height of NTS is 22.3–27.5% lower compared to the other treatments, and the difference is significant (p < 0.05). However, there is no significant difference in plant height between the treatments 100 and 150 days after sowing. NTS shows the fastest growth rate in plant height from 50 to 100 days after sowing, but its subsequent growth rate is slower than the other treatments. Although there is no significant difference in plant height at 150 days after sowing, NTS still has a shorter average plant height compared to the other treatments. The stem diameter of corn also shows significant differences across the three growth periods (Figure 5b). At 50 days after sowing, the stem diameter of NTS is 33.2–35.3% lower compared to the other treatments, with the difference being significant (p < 0.05). NTS has the fastest growth rate in stem diameter from 50 to 100 days after sowing, which follows the same trend as the corn plant height of NTS. From 100 to 150 days, RTS has the fastest growth rate in stem diameter, while STS has the slowest growth rate. At 150 days after sowing, the stem diameter of STS is the lowest, being 9.9% and 10.5% lower than RTS and NTS, respectively, with the difference being significant (p < 0.05). The spike height of corn was measured at 150 days after sowing (Figure 5c). The spike height of PTS is 6.3% higher than that of STS, and the difference is significant (p < 0.05). There is no difference in spike height between NTS and RTS. According to Equations (1) and (2), the yield of corn in the experiment plot under standard water content was calculated, and a significant analysis of the yield was performed, as shown in Table 4.
The results show that the convex tip length, number of rows per ear, and 100-grain weight of NTS are slightly higher than the other treatments, but the difference does not reach a significant level between treatments. The corn yield of different tillage and sowing methods follows RTS > PTS > NTS > STS, but there is no significant difference between treatments.
3.3. Correlation Analysis of Soil Physical Properties, Plant Characters, and Yield under Different Tillage and Sowing Methods
3.3.1. Correlation Analysis
By Pearson correlation analysis, the correlation relationship among soil physical properties, corn plant characters, and yield in 0–40 cm soil at 150 days after corn sowing is shown in Figure 6.
Plant stem diameter and yield of corn are strongly correlated and positively correlated. SPR in 35 cm soil is negatively correlated with corn yield. The soil temperature in 5 cm soil is strongly correlated with corn plant height, and the soil temperature in 15 cm soil and SPR in 5 cm soil are positively correlated with corn stem diameter. SPR of the adjacent soil layer is correlated.
3.3.2. Redundancy Analysis
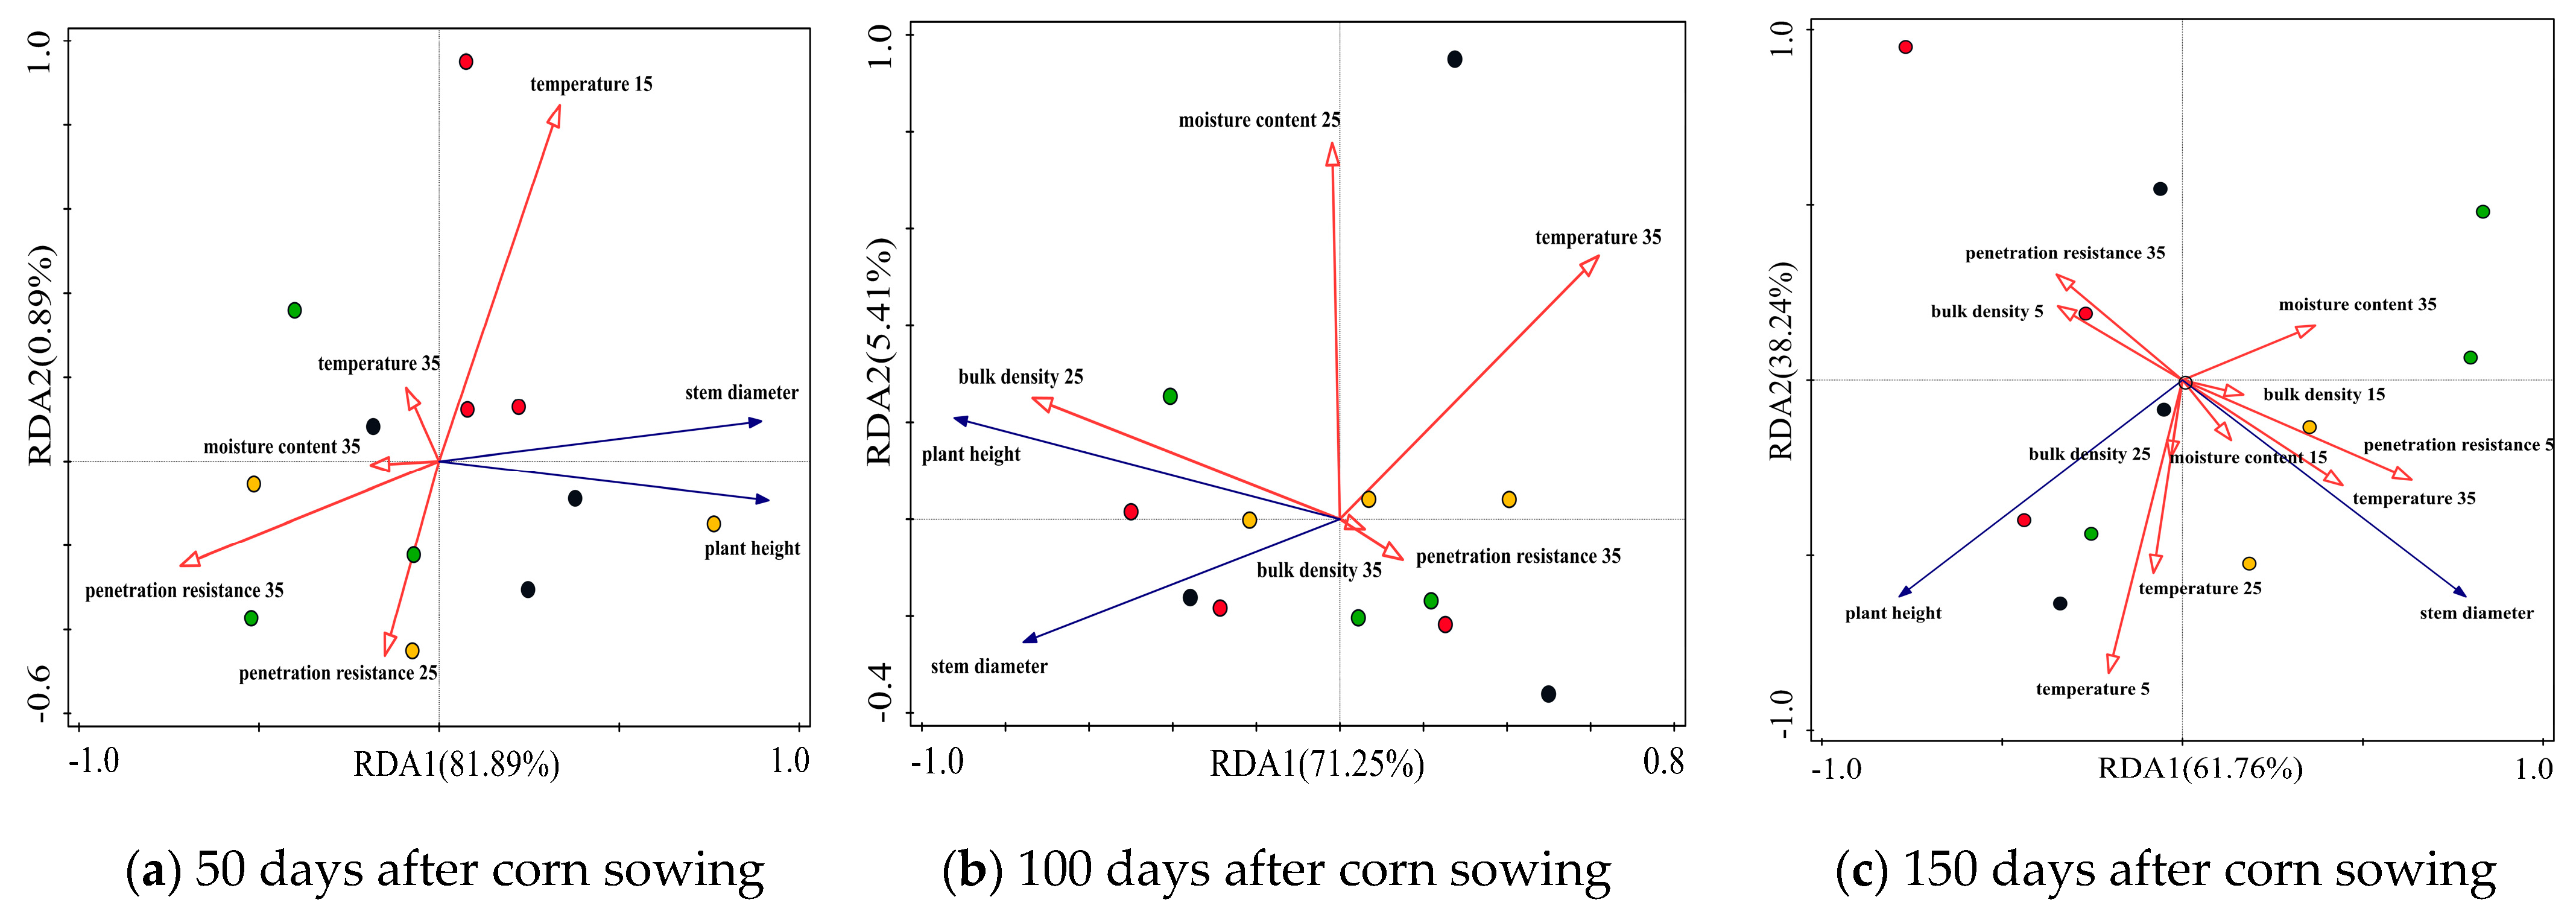
By redundancy analysis of soil physical property indexes, corn plant height, and stem diameter in 0–40 cm soil layer in three periods, the two-dimensional ranking of the effects of soil physical properties on plant characters, and the explanatory degree of impact factors are obtained, as shown in Figure 7 and Table 5.
At 50 days after corn sowing, the explanatory contribution of each impact factor to corn plant growth is SPR (51.8%), moisture content (23.6%), and temperature (7.4%) in descending order. Among the factors, SPR in 35 cm soil has the highest explanatory degree to plant growth (42.2%) and is negatively correlated with corn plant height and stem diameter (Figure 7a). At 100 days after corn sowing, the explanatory contribution of each impact factor to corn plant growth is soil bulk density (47.8%), temperature (23%), moisture content (4.3%), and SPR (1.6%) in descending order. Among the factors, soil bulk density in 25 cm soil has the highest explanatory degree to plant growth (38.9%) and is positively correlated with corn plant height and stem diameter (Figure 7b). At 150 days after corn sowing, the explanatory contribution of each impact factor to corn plant growth is the temperature (43.6%), penetration resistance (35.7%), bulk density (15.3%), and moisture content (5.4%), in descending order. Among the factors, SPR in 5 cm soil has the highest explanatory degree to plant growth (33.2%) and is positively correlated with corn stem diameter and negatively correlated with corn plant height (Figure 7c).
On the whole, SPR has a high degree of explanation to plant growth in the early and later stages of corn growth, reaching 51.8% and 35.7%, respectively. The soil moisture content has a great influence on the early growth of the plant, and the interpretability is 23.6% 50 days after corn sowing. The importance of soil temperature in the whole plant growth process gradually increased, from 7.4% in the early stage of corn growth to 43.6% in the later stage. Soil bulk density has a great influence on the mid-term growth of corn, and its interpretability is as high as 47.8% 100 days after corn sowing.
4. Discussion
SPR is a crucial factor impacting soil physical properties. Research indicates that SPR increases with soil depth, a result of both cover pressure and internal soil friction [26,27]. During the early stages of corn growth, the SPR of the 10–40 cm soil layer under the PTS treatment was significantly lower compared to the other treatments. This is because deep tillage creates larger soil pores, which in turn reduces soil bulk density and penetration resistance [28]. The NTS treatment resulted in higher soil penetration resistance and sustained high SPR values throughout the corn reproductive period, which is consistent with previous studies [29]. The variation among soil layers under PTS and RTS treatment was comparatively small, which could be attributed to tillage improving soil pore conditions [2] and having a more pronounced effect on subsoil improvement, thus reducing SPR differences among soil layers. Soil moisture and temperature play a crucial role in the growth and development of crops [30]. Studies show that tillage practices have a greater impact on the surface soil moisture content. Conservation tillage, in particular, can improve soil moisture levels due to the presence of straw cover and stubble that delay runoff, increase water infiltration, and reduce surface water evaporation [31]. In the early stage of corn growth, the soil moisture content under PTS increases the most with the soil depth, indicating that deep plowing can increase the water infiltration rate [32]. The effect of tillage methods on soil temperature was mainly observed in the topsoil layer. The impact of temperature on plant growth increased with plant growth and reached its peak 150 days after sowing. At this stage, the temperature of the 5–35 cm soil layer under the STS treatment was lower than the other treatments. As the temperature drops, the soil temperature showed an increasing trend with increasing depth 150 days after sowing, which indicated heat conduction from bottom to top, with NTS having the best thermal conductivity, followed by STS, RTS, and PTS. The results are consistent with previous studies [33]. The temperature of the 35 cm soil layer was higher under RTS treatment, which might be due to the loosened and porous soil structure that has a warming effect on the deeper layers [34].
The rotary tillage (RTS) method resulted In a reduction of surface soil bulk density due to the shallow depth of tillage and the porous soil structure created by it. This had a greater impact on the topsoil. At a depth of 5 cm, the average values of bulk density under the PTS and RTS treatments were lower than those of the NTS and STS treatments, and the differences between treatments became smaller as the soil depth increased. This suggests that tillage can indeed reduce soil bulk density, but primarily in the top 10 cm of soil [10,35]. Over time, the difference between treatments becomes smaller, indicating that the effects of subsoiling and tillage on soil bulk density only persist for one to two seasons in fertile soil [26]. The early growth of corn was impacted by tillage and sowing methods, with the differences between treatments becoming less pronounced as the corn grew. The NTS treatment hampered the initial growth of the crop, but from 50 to 100 days, its growth rate was significantly higher than the other treatments. Wang et al. showed that under no-tillage conditions, straw mulching could improve the seedling emergence rate, but it was not conducive to the accumulation of dry matter at the jointing stage, which may be improved with the further decomposition of straw [36]. The most rapid growth period of corn was from 50 to 100 days after planting; the growth rate slowed down in 100 to 150 days; during this period, the growth rate of NTS and STS treatments was lower than that of PTS and RTS treatments. Wang et al. showed that plow tillage treatment significantly increased the number of ears, number of grains per row, and 100-grain weight of corn, which was inconsistent with the results of this study, that may be related to the soil type and the gene shape of the corn variety itself [37]. According to the findings of Pittelkow, a combination of no-tillage, straw mulching, and rotation can mitigate the adverse effects of no-tillage on crop yield and, under certain conditions, even yield the same or greater output compared to traditional tillage methods [11]. There was no difference in corn yield among the four tillage and sowing methods, which is inconsistent with the research results of Xu, which may be related to soil texture, weather, and climate [38]. Crop growth is sensitive to SPR and soil moisture in the early stage of corn growth, which is consistent with the results given by Xiong et al. [39]. Yu showed that corn growth was sensitive to waterlogging and negatively correlated with it [40]. Colombi et al. discovered that SPR could affect seedling emergence rate, nutrient uptake, root morphology, and crop yield [41]. As the plants grow, the effect of soil moisture content on corn decreases while the impact of temperature increases, with the explanation degree reaching 43.6% 150 days after corn sowing. The reason is that the temperature decreases with corn plant growth, and the soil temperature are different under different tillage and sowing methods, which affects the growth and development of the plants in the later period. Hatfield et al. found that corn is a temperature-sensitive crop, and even a 1 °C difference can greatly impact its growth and development [42]. As shown in Figure 3c and Figure 7c, the low-soil temperature may be the reason for the slow growth of stem diameter and plant height in the late stages under NTS and STS treatment. In summary, corn at different growth stages has a different sensitivity to soil physical properties. Under NTS, SPR and moisture content were higher, which affected the early growth of corn, but with the change of the sensitivity of corn growth to indexes, the early deficiency will be made up in the middle growth of corn. With the temperature decreasing in the later period, temperature becomes one of the main factors affecting corn growth, which is caused by the differences in the cropping system and climate in northeast China.
5. Conclusions
The results of this study indicate that the short-term application of different tillage and sowing methods has a significant impact on soil physical properties and plant growth. High soil penetration resistance impeded early crop growth, but the PTS treatment method reduced this resistance in the 0–40 cm soil layer. The effect of tillage on soil moisture content was concentrated in the 5–15 cm soil layer, and both the NTS and STS treatments increased soil moisture content. The impact of tillage and sowing methods on soil bulk density was most pronounced in the 5 cm soil layer, with RTS treatment significantly reducing surface soil bulk density. As the temperature decreased, its influence on plant growth increased, and the STS treatment resulted in low soil temperature, which might inhibit the later development of the crop. Among the measured plant characters, stem diameter was found to have a strong correlation with yield. The results showed that the short-term implementation of conservation tillage did not cause a significant decrease in corn yield and that the short-term implementation of NTS treatment is considered feasible.
Author Contributions
Y.W. was responsible for the experiments, performed the statistical analysis, and wrote this manuscript. S.Y. was responsible for the experiments and revised this manuscript. J.Q., J.S., Z.L. and X.H. supervised the experiments and revised this manuscript. All authors have read and agreed to the published version of the manuscript.
Funding
This study was supported by National Key R&D Projects during the Fourteenth Five Year Plan “Integration of key technologies for high-performance seeding and demonstration application of intelligent seeder” (2021YFD2000405), Open project of Key Laboratory of Combining Farming and Animal Husbandry, Ministry of Agriculture and Rural Affairs.
Institutional Review Board Statement
Not applicable.
Data Availability Statement
The data presented in this study are available on request from the corresponding author.
Conflicts of Interest
The authors declare no conflict of interest.
References
- Cong, H.B.; Meng, H.B.; Yu, J.D. Analysis of long-term mechanism for development of straw industry in northeast China under guidance of “Green-concept”. Trans. CSAE 2021, 37, 314–321. [Google Scholar] [CrossRef]
- Yan, L.; La, Y.P.; Dong, T.H. Soil physical properties and vertical distribution of root systems affected by tillage methods in black soil slope farmlands in Northeast China. Trans. CSAE 2021, 37, 125–132. [Google Scholar] [CrossRef]
- Zhang, X.Y.; Liu, X.B. Key issues of Mollisols research and soil erosion control strategies in China. Bull. Soil Water Conserv. 2020, 40, 340–344. [Google Scholar] [CrossRef]
- Chen, N.N.; Li, J.; Lv, W.; Wang, S.L. Effects of different rotational tillage patterns on soil physical properties and yield of winter wheat-spring maize rotation field in Weibei highland. Chin. J. Eco-Agric. 2015, 23, 1102–1111. [Google Scholar] [CrossRef]
- Li, N.; Long, J.H.; Han, X.Z.; Zhang, F.Q.; Lei, W.Y.; Sheng, M.; Han, Z.Y. Effects of short-term plowing and organic amendments on soil physical properties and maize yield in dark brown soil in Northeast China. Trans. CSAE 2021, 37, 99–107. [Google Scholar] [CrossRef]
- Misban, A.H.; Habtamu, M.; Petra, S.; Prossie, N.; Seifu, A.T.; Simon, L.; Jennie, B.; Tammo, S.S. Deep Tillage Improves Degraded Soils in the (Sub) Humid Ethiopian Highlands. Land 2019, 8, 159. [Google Scholar] [CrossRef] [Green Version]
- Dong, J.X.; Song, W.J.; Cong, P. Improving Farmland Soil Physical Properties by Rotary Tillage Combined with High Amount of Granulated Straw. Sci. Agric. Sin. 2021, 54, 2789–2803. [Google Scholar] [CrossRef]
- Zhu, M.; Shi, Y.X.; Sun, Z.Y.; Wang, X.L.; Zhang, D.; Kong, F.L.; Yuan, J.C. Effect of straw return and rotary tillage on soil physical properties and mechanical sowing quality of maize in Central Sichuan. Chin. J. Eco–Agric. 2017, 25, 1025–1033. [Google Scholar] [CrossRef]
- Catania, P.; Badalucco, L.; Laudicina, V.A.; Vallone, M. Effects of tilling methods on soil penetration resistance, organic carbon and water stable aggregates in a vineyard of semiarid Mediterranean environment. Environ. Earth Sci. 2018, 77, 348. [Google Scholar] [CrossRef]
- Blanco-Canqui, H.; Ruis, S.J. No-tillage and soil physical environment. Geoderma 2018, 326, 164–200. [Google Scholar] [CrossRef]
- Pittelkow, C.M.; Liang, X.; Linquist, B.A.; Groenigen, K.J.; Lee, J.; Lundy, M.E.; Gestel, N.; Six, J.; Venterea, R.T.; Kessel, C. Productivity limits and potentials of the principles of conservation agriculture. Nature 2015, 517, 365. [Google Scholar] [CrossRef] [PubMed]
- Lu, B.L.; Bao, X.G.; Che, Z.X.; Zhang, J.D.; Wu, K.S.; Yang, X.J. Effects of long-term no-tillage with crop stubbles on yield and stability of spring wheat in Hexi Oasis Irrigated Areas. Trans. CSAE 2022, 38, 117–126. [Google Scholar] [CrossRef]
- Kahlon, M.S.; Lal, R.; Ann-Varughese, M. Twenty two years of tillage and mulching impacts on soil physical characteristics and carbon sequestration in Central Ohio. Soil Tillage Res. 2013, 126, 151–158. [Google Scholar] [CrossRef]
- Gu, S.Y.; Zhu, Y.W.; Guo, X.J.; Cai, Y.T.; Wu, S.; Zhang, Z.H.; Zhang, H.H. Effects of Different Tillage Ways on Seedling Growth of Maize and Soil Physical Properties in Mollisol Region. Acta Agric. Boreali-Sin. 2018, 33, 226–231. [Google Scholar] [CrossRef]
- Zhao, H.B.; He, J.; Li, H.W.; Wang, Q.J.; Li, W.Y.; Liu, W.Z. Effect of Straw Returning Manners on Seedbed Soil Physical Properties and Winter Wheat Growth. Trans. Chin. Soc. Agric. Mach. 2018, 49, 60–67. [Google Scholar] [CrossRef]
- Orzech, K.; Wanic, M.; Zaluski, D. The Effects of Soil Compaction and Different Tillage Systems on the Bulk Density and Moisture Content of Soil and the Yields of Winter Oilseed Rape and Cereals. Agriculture 2021, 11, 666. [Google Scholar] [CrossRef]
- Linhares, A.; Gonalves, W.G.; Costa, K. Are the yield of sunflower and Paiaguas palisadegrass biomass influenced by soil physical quality? Soil Tillage Res. 2021, 208, 104873. [Google Scholar] [CrossRef]
- Yan, L.; Jiang, X.X.; Ji, X.N.; Zhou, L.; Li, S.Y.; Chen, C.; Li, P.; Zhu, Y.C.; Dong, T.H.; Meng, Q.F. Distribution of water-stable aggregates under soil tillage practices in a black soil hillslope cropland in Northeast China. J. Soils Sediments 2020, 20, 24–31. [Google Scholar] [CrossRef]
- Qiao, J.Y.; Zhang, D.; Zhang, H.B.; Zhang, B.; Chen, H.T.; Shen, L.P.; Zheng, D.M.; Sun, J. Effects of soil compaction by various tractors on soil penetration resistance and soybean yields. Trans. CSAE 2019, 35, 26–33. [Google Scholar] [CrossRef]
- Wang, Y.J. Soil Physical Properties and Effect Evaluation of Mechanized Tillage Planting Methods in Black Sloping Farmland. Ph.D. Thesis, Northeast Agricultural University, Harbin, China, 2021. [Google Scholar]
- NY/T52-1987; National Standards of the People’s Republic of China. Method for the Determination of soil Water Content. National Bureau of Standards: Beijing, China, 1987.
- Wang, Q.J.; Jiao, F.; Liu, F.; Chang, B.C.; Jiang, H.; Jiang, Y.; Mi, G.; Zhou, X. Effect of straw pulverization and concentrated deep-buried into field on growth and yield of maize. Trans. CSAE 2018, 34, 153–159. [Google Scholar] [CrossRef]
- You, S.T.; Deng, C.; Li, H.M.; Lv, M.; Li, Z.M.; Liu, H.F. QTL Mapping of Plant Height and Ear Height in Maize. J. Henan Agric. Sci. 2019, 48, 20–25. [Google Scholar] [CrossRef]
- GB5009.3—2016; State health and Family Planning Commission of the People’s Republic of China. Determination of moisture in Food. China Standards Press: Beijing, China, 2016.
- Canoco 5. Canoco for Visualization of Multivariate Data—WUR. Available online: https://www.wur.nl/en/show/Canoco-for-visualization-of-multivariate-data.htm#:~:text=Canoco%20is%20a%20software%20package,of%20the%20two%2C%20constrained%20ordination (accessed on 1 February 2022).
- Bogunovic, I.; Pereira, P.; Kisic, I.; Sajko, K.; Sraka, M. Tillage management impacts on soil compaction, erosion and crop yield in Stagnosols (Croatia). CATENA 2018, 160, 376–384. [Google Scholar] [CrossRef]
- Gao, W.; Whalley, W.R.; Tian, Z.; Liu, J.; Ren, T. A simple model to predict soil penetrometer resistance as a function of density, drying and depth in the field. Soil Tillage Res. 2016, 155, 190–198. [Google Scholar] [CrossRef]
- Wang, Y.K.; Zhang, Z.B.; Jiang, F.H.; Guo, Z.C.; Peng, X.H. Evaluating soil physical quality indicators of a Vertisol as affected by different tillage practices under wheat-maize system in the North China Plain. Soil Tillage Res. 2021, 209, 104970. [Google Scholar] [CrossRef]
- Burgos Hernández, T.D.; Slater, B.K.; Corbalá, R.T.; Shaffer, J.M. Assessment of long-term tillage practices on physical properties of two Ohio soils. Soil Tillage Res. 2019, 186, 270–279. [Google Scholar] [CrossRef]
- Yang, Y. Effcets of Different Tillage Measures on Soil Physical and Chemical Characters and Crop Yield in Cropland. Ph.D. Thesis, Northwest A&F University, Xianyang, China, 2017. [Google Scholar]
- Li, Y.J.; Wu, J.Z.; Huang, M.; Yao, Y.Q.; Zhang, C.J.; Cai, D.X.; Jin, K. Effects of different tillage systems on photosynthesis characteristics of flag leaf and water use efficiency in winter wheat. Trans. CSAE 2006, 22, 44–48. [Google Scholar]
- Mohanty, M.; Bandyopadhyay, K.K.; Painuli, D.K.; Ghosh, P.K.; Misra, A.K.; Hati, K.M. Water transmission characteristics of a Vertisol and water use efficiency of rainfed soybean (Glycine max (L.) Merr.) under subsoiling and manuring. Soil Tillage Res. 2007, 93, 420–428. [Google Scholar] [CrossRef]
- Lu, Y.L.; Zhang, M.; Liu, X.N.; Ren, T.S.; Wang, Y.J. Effects of soil water content and bulk density on thermal conductivity of plough layer soil in arid land and its prediction. Trans. CSAE 2018, 34, 146–151. [Google Scholar] [CrossRef]
- Yang, J.Y.; Gu, S.Y.; Li, Y.H.; He, W.Y.; Tang, Y.; Zhai, C.; Du, L. Effects of Deep Ploughing-rotary Tillage Combined with Organic Fertilizer on Black Soil Physical Properties. Chin. J. Soil Sci. 2021, 52, 1290–1298. [Google Scholar] [CrossRef]
- Awe, G.O.; Reichert, J.M.; Fontanela, E. Sugarcane production in the subtropics: Seasonal changes in soil properties and crop yield in no-tillage, inverting and minimum tillage. Soil Tillage Res. 2020, 196, 104447. [Google Scholar] [CrossRef]
- Wang, L.X.; Li, Z.P.; Liu, S.P.; Du, J.P. Effects of Different Tillage and Mulching Methods on the Growth and Photosynthetic Characteristics of Maize. J. Maize Sci. 2016, 24, 142–146. [Google Scholar] [CrossRef]
- Wang, Y.H.; Xi, L.L.; Zhou, X.; Shen, D.F. Effects of deep tillage treatments on summer maize yield and soil physicochemical properties. Shanxi Agric. Univ. Nat. Sci. Ed. 2018, 38, 9–14. [Google Scholar] [CrossRef]
- Xu, Y.Y.; Wang, J.H.; Liu, Y.T.; Gao, P.; Wang, Y.X.; Yang, H.Y.; Yu, K.C.; Ge, X.L.; Chi, L.; Fan, S.J. Effects of Different Returning Methods of Straw on Soil Physical Property, Yield of Corn. Maize Sci. 2018, 26, 78–84. [Google Scholar] [CrossRef]
- Xiong, P.; Zhang, Z.; Hallett, P.D.; Peng, X. Variable responses of maize root architecture in elite cultivars due to soil compaction and moisture. Plant Soil 2020, 455, 79–91. [Google Scholar] [CrossRef]
- Yu, W.D.; Feng, L.P.; Sheng, S.X.; Shi, L. Effect of waterlogging at jointing and tasseling stages on growth and yield of summer maize. Trans. CSAE 2014, 30, 127–136. [Google Scholar] [CrossRef]
- Colombi, T.; Torres, L.C.; Walter, A.; Keller, T. Feedbacks between soil penetration resistance, root architecture and water uptake limit water accessibility and crop growth—A vicious circle. Sci. Total Environ. 2018, 626, 1026–1035. [Google Scholar] [CrossRef] [PubMed]
- Hatfield, J.L.; Allmaras, R.R.; Rehm, G.W.; Lowery, B. Ridge tillage for corn and soybean production: Environmental quality impacts. Soil Tillage Res. 1998, 48, 145–154. [Google Scholar] [CrossRef]
Figure 1.
Mean temperature and rainfall during the experimental period.
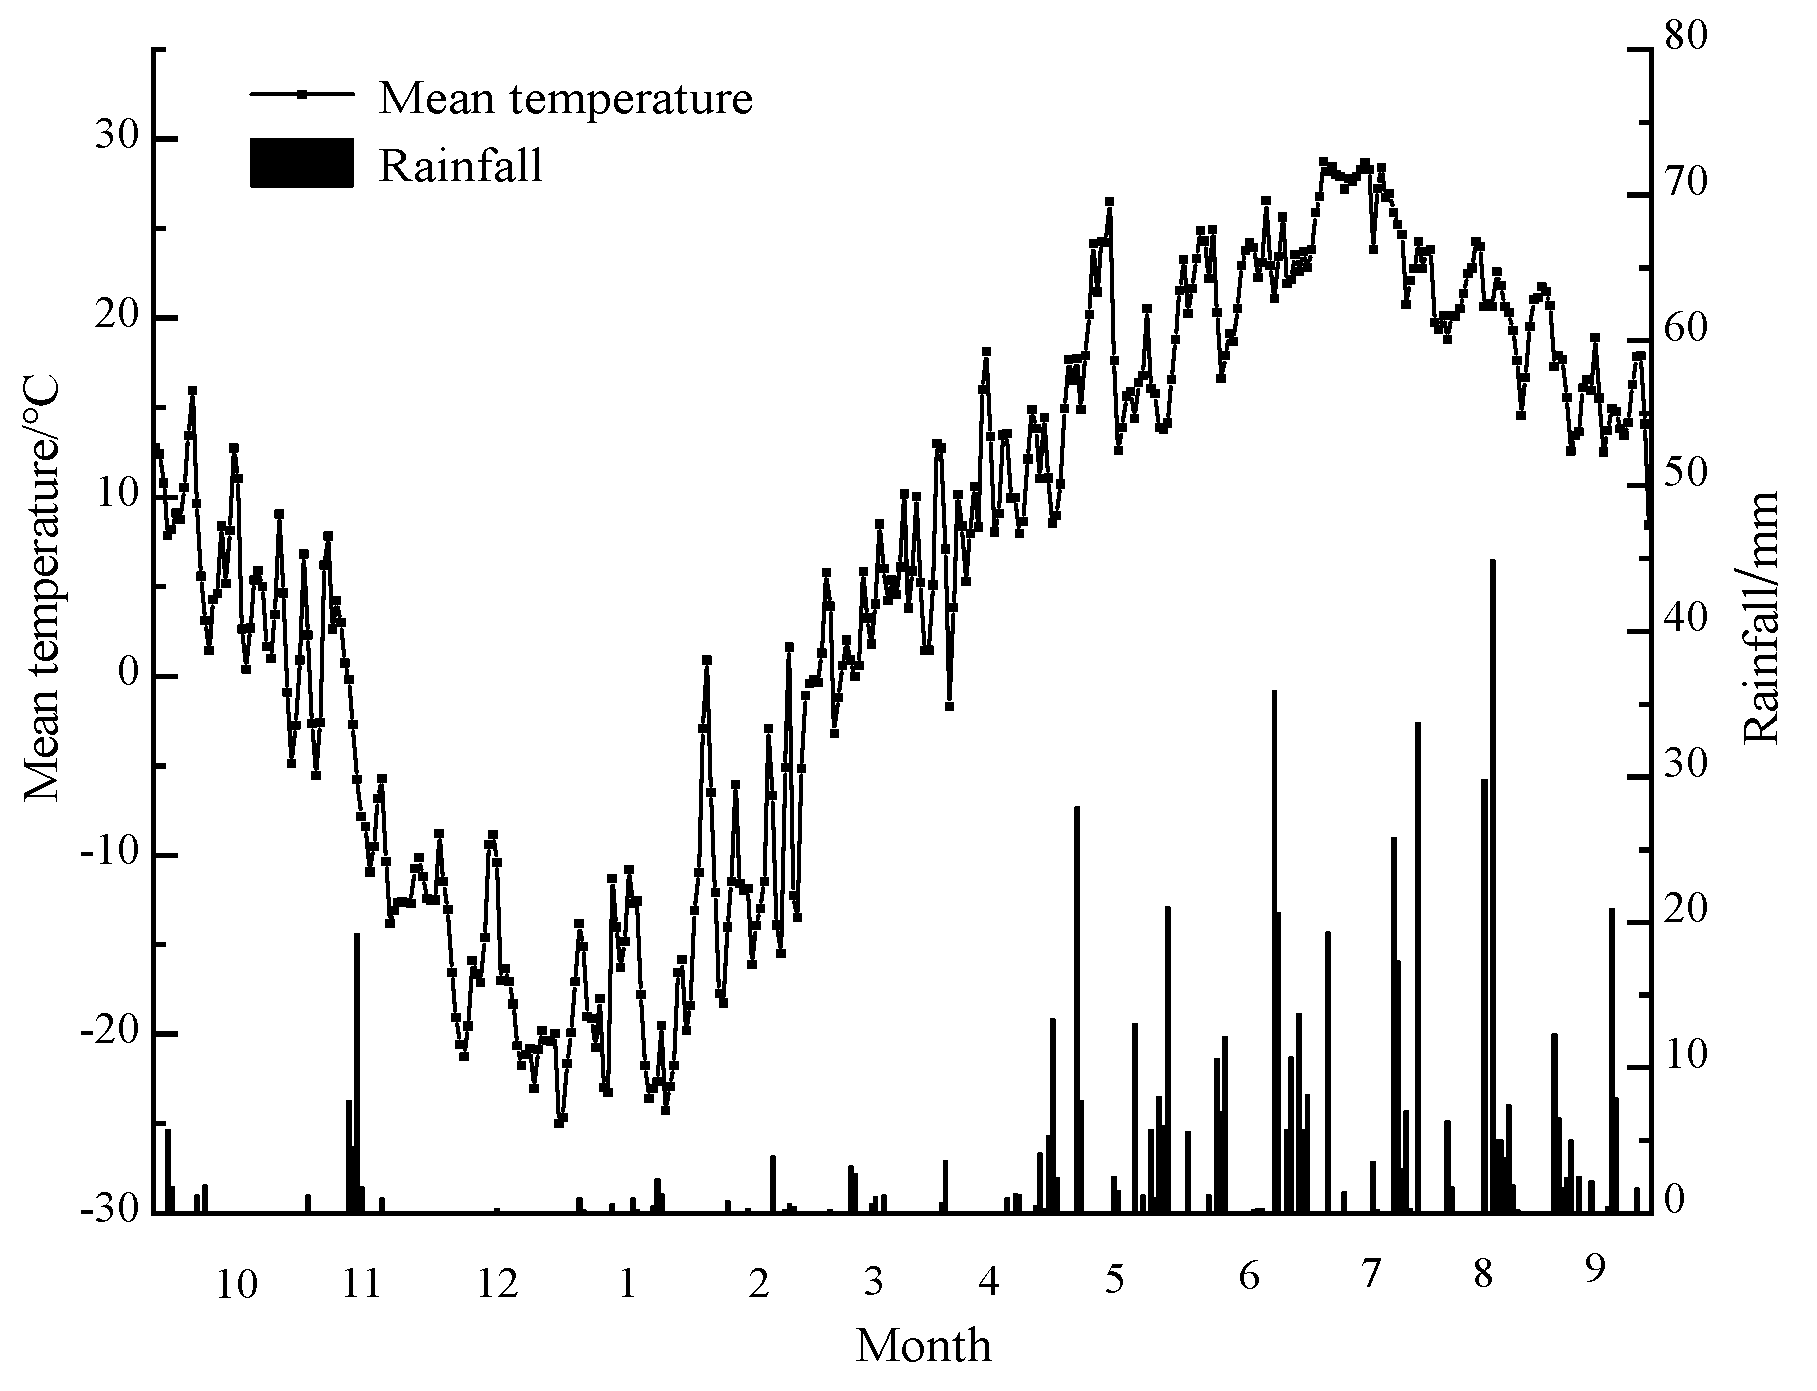
Figure 2.
Effect of tillage and sowing methods on soil moisture content. Note: * Indicates a significant difference at 0.05 level. PTS—plow tillage and sowing; RTS—rotary tillage and sowing; NTS—no-tillage and sowing; STS—no-tillage and precise sowing in stubble field. The same below.
Figure 2.
Effect of tillage and sowing methods on soil moisture content. Note: * Indicates a significant difference at 0.05 level. PTS—plow tillage and sowing; RTS—rotary tillage and sowing; NTS—no-tillage and sowing; STS—no-tillage and precise sowing in stubble field. The same below.

Figure 3.
Effect of tillage and sowing methods on soil temperature.

Figure 4.
Effect of tillage and sowing methods on soil bulk density. Note: PTS—plow tillage and sowing; RTS—rotary tillage and sowing; NTS—no-tillage and sowing; STS—no-tillage and precise sowing in stubble field. Different lowercase letters indicate significant differences between the same test time, the same soil depth, and different tillage methods (p < 0.05).

Figure 5.
Changes in crop growth under different tillage and sowing methods.Note: PTS—plow tillage and sowing; RTS—rotary tillage and sowing; NTS—no-tillage and sowing; STS—no-tillage and precise sowing in stubble field. Different small letters indicate that there are significant differences between different tillage and sowing methods at the same test time (p < 0.05). The same below.
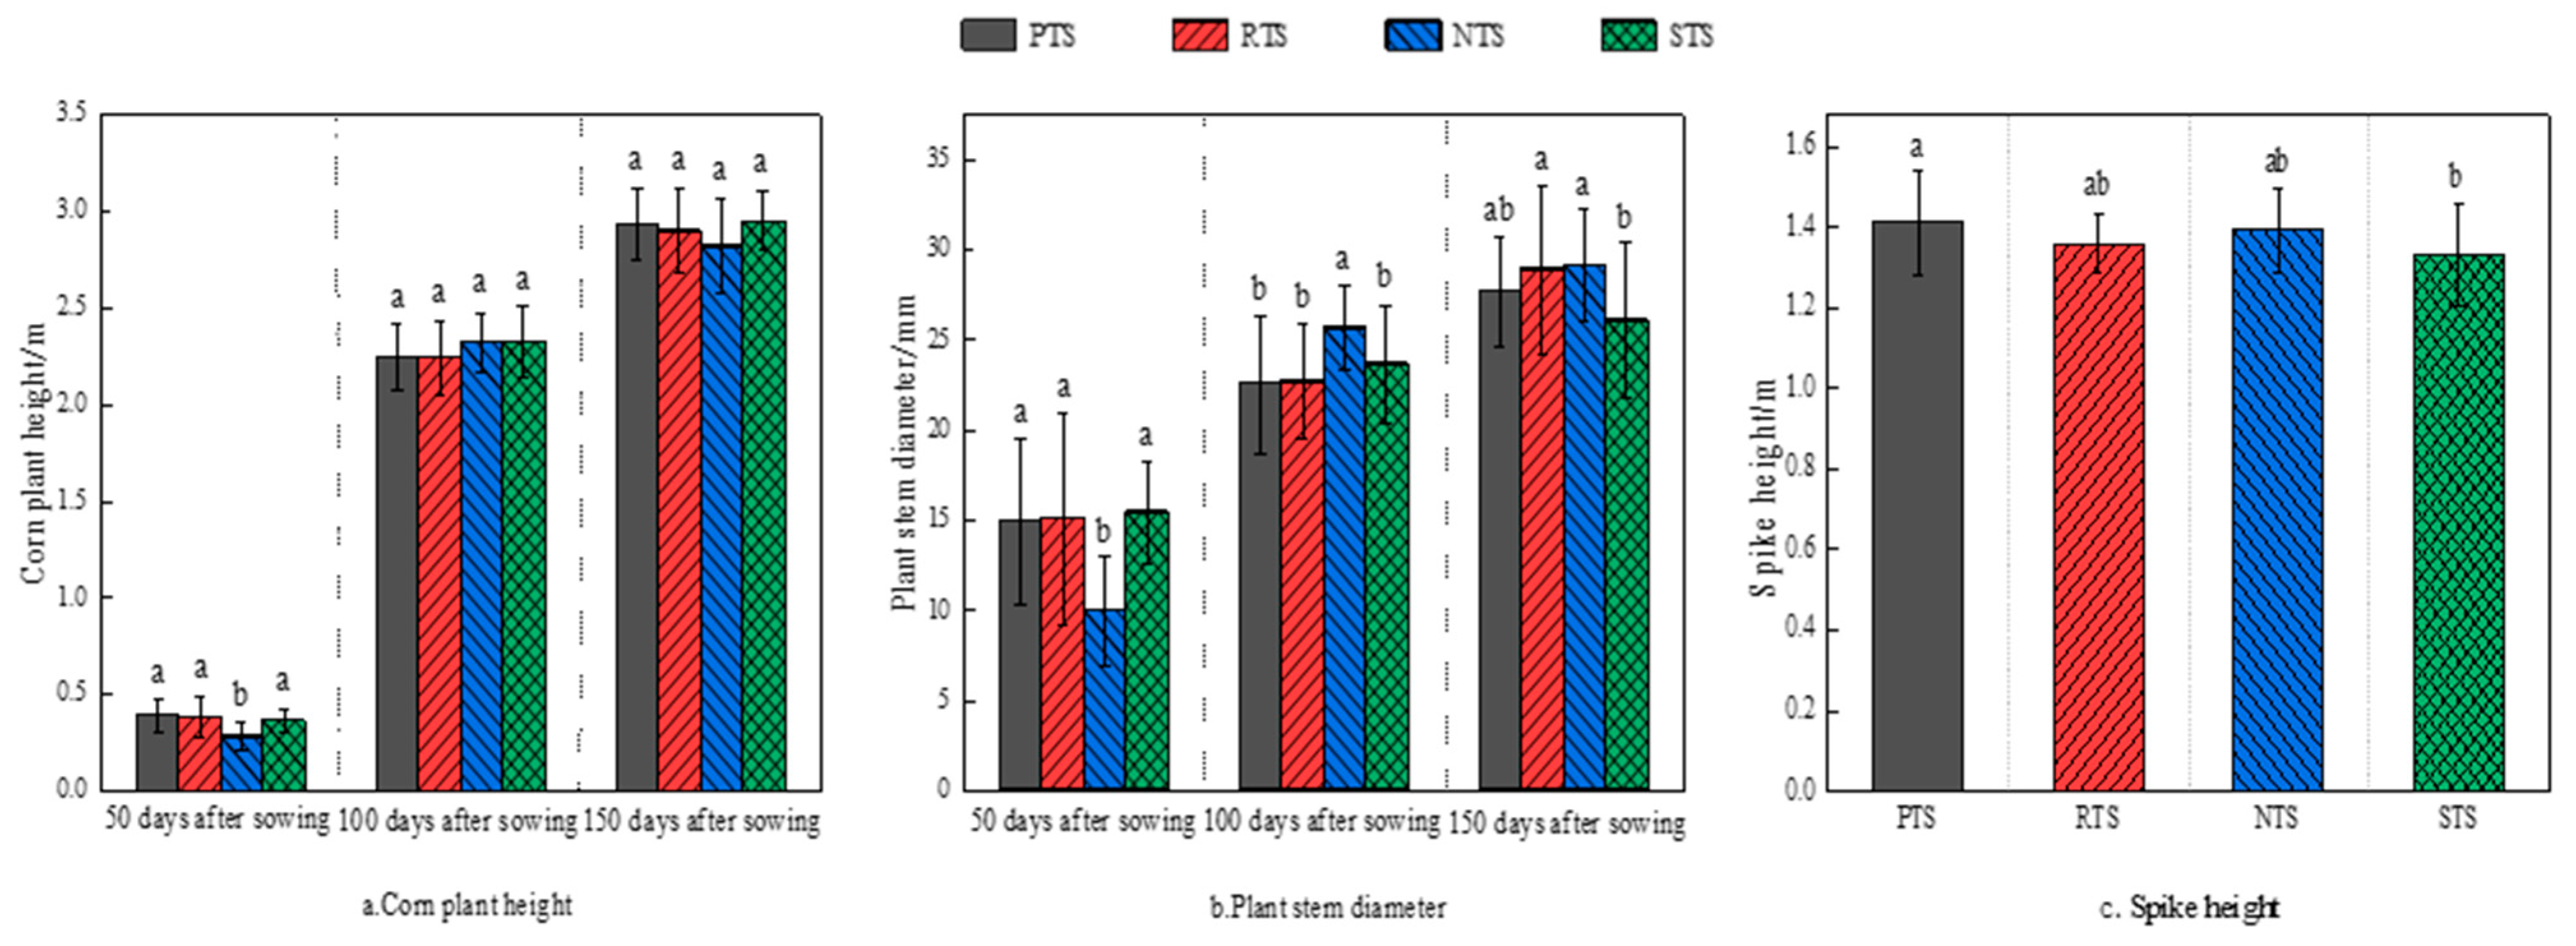
Figure 6.
Pearson correlation among soil physical properties, plant characters, and yield. Note: V1, V2, V3, and V4 are, respectively, mean soil bulk density in 5 cm, 15 cm, 25 cm, and 35 cm soil; V5, V6, V7, and V8 are mean moisture content in 5 cm, 15 cm, 25 cm, and 35 cm soil; V9, V10, V11, V12 are, respectively, mean temperature in 5 cm, 15 cm, 25 cm, and 35 cm soil; V13, V14, V15, and V16 are mean SPR in 5 cm, 15 cm, 25 cm, and 35 cm soil; V17 are mean corn plant height; V18 is mean plant stem diameter; V19 is mean spike height; V20 is mean corn yield. *, ** and *** indicate significant correlations at 0.10, 0.05, and 0.01 probability, respectively.
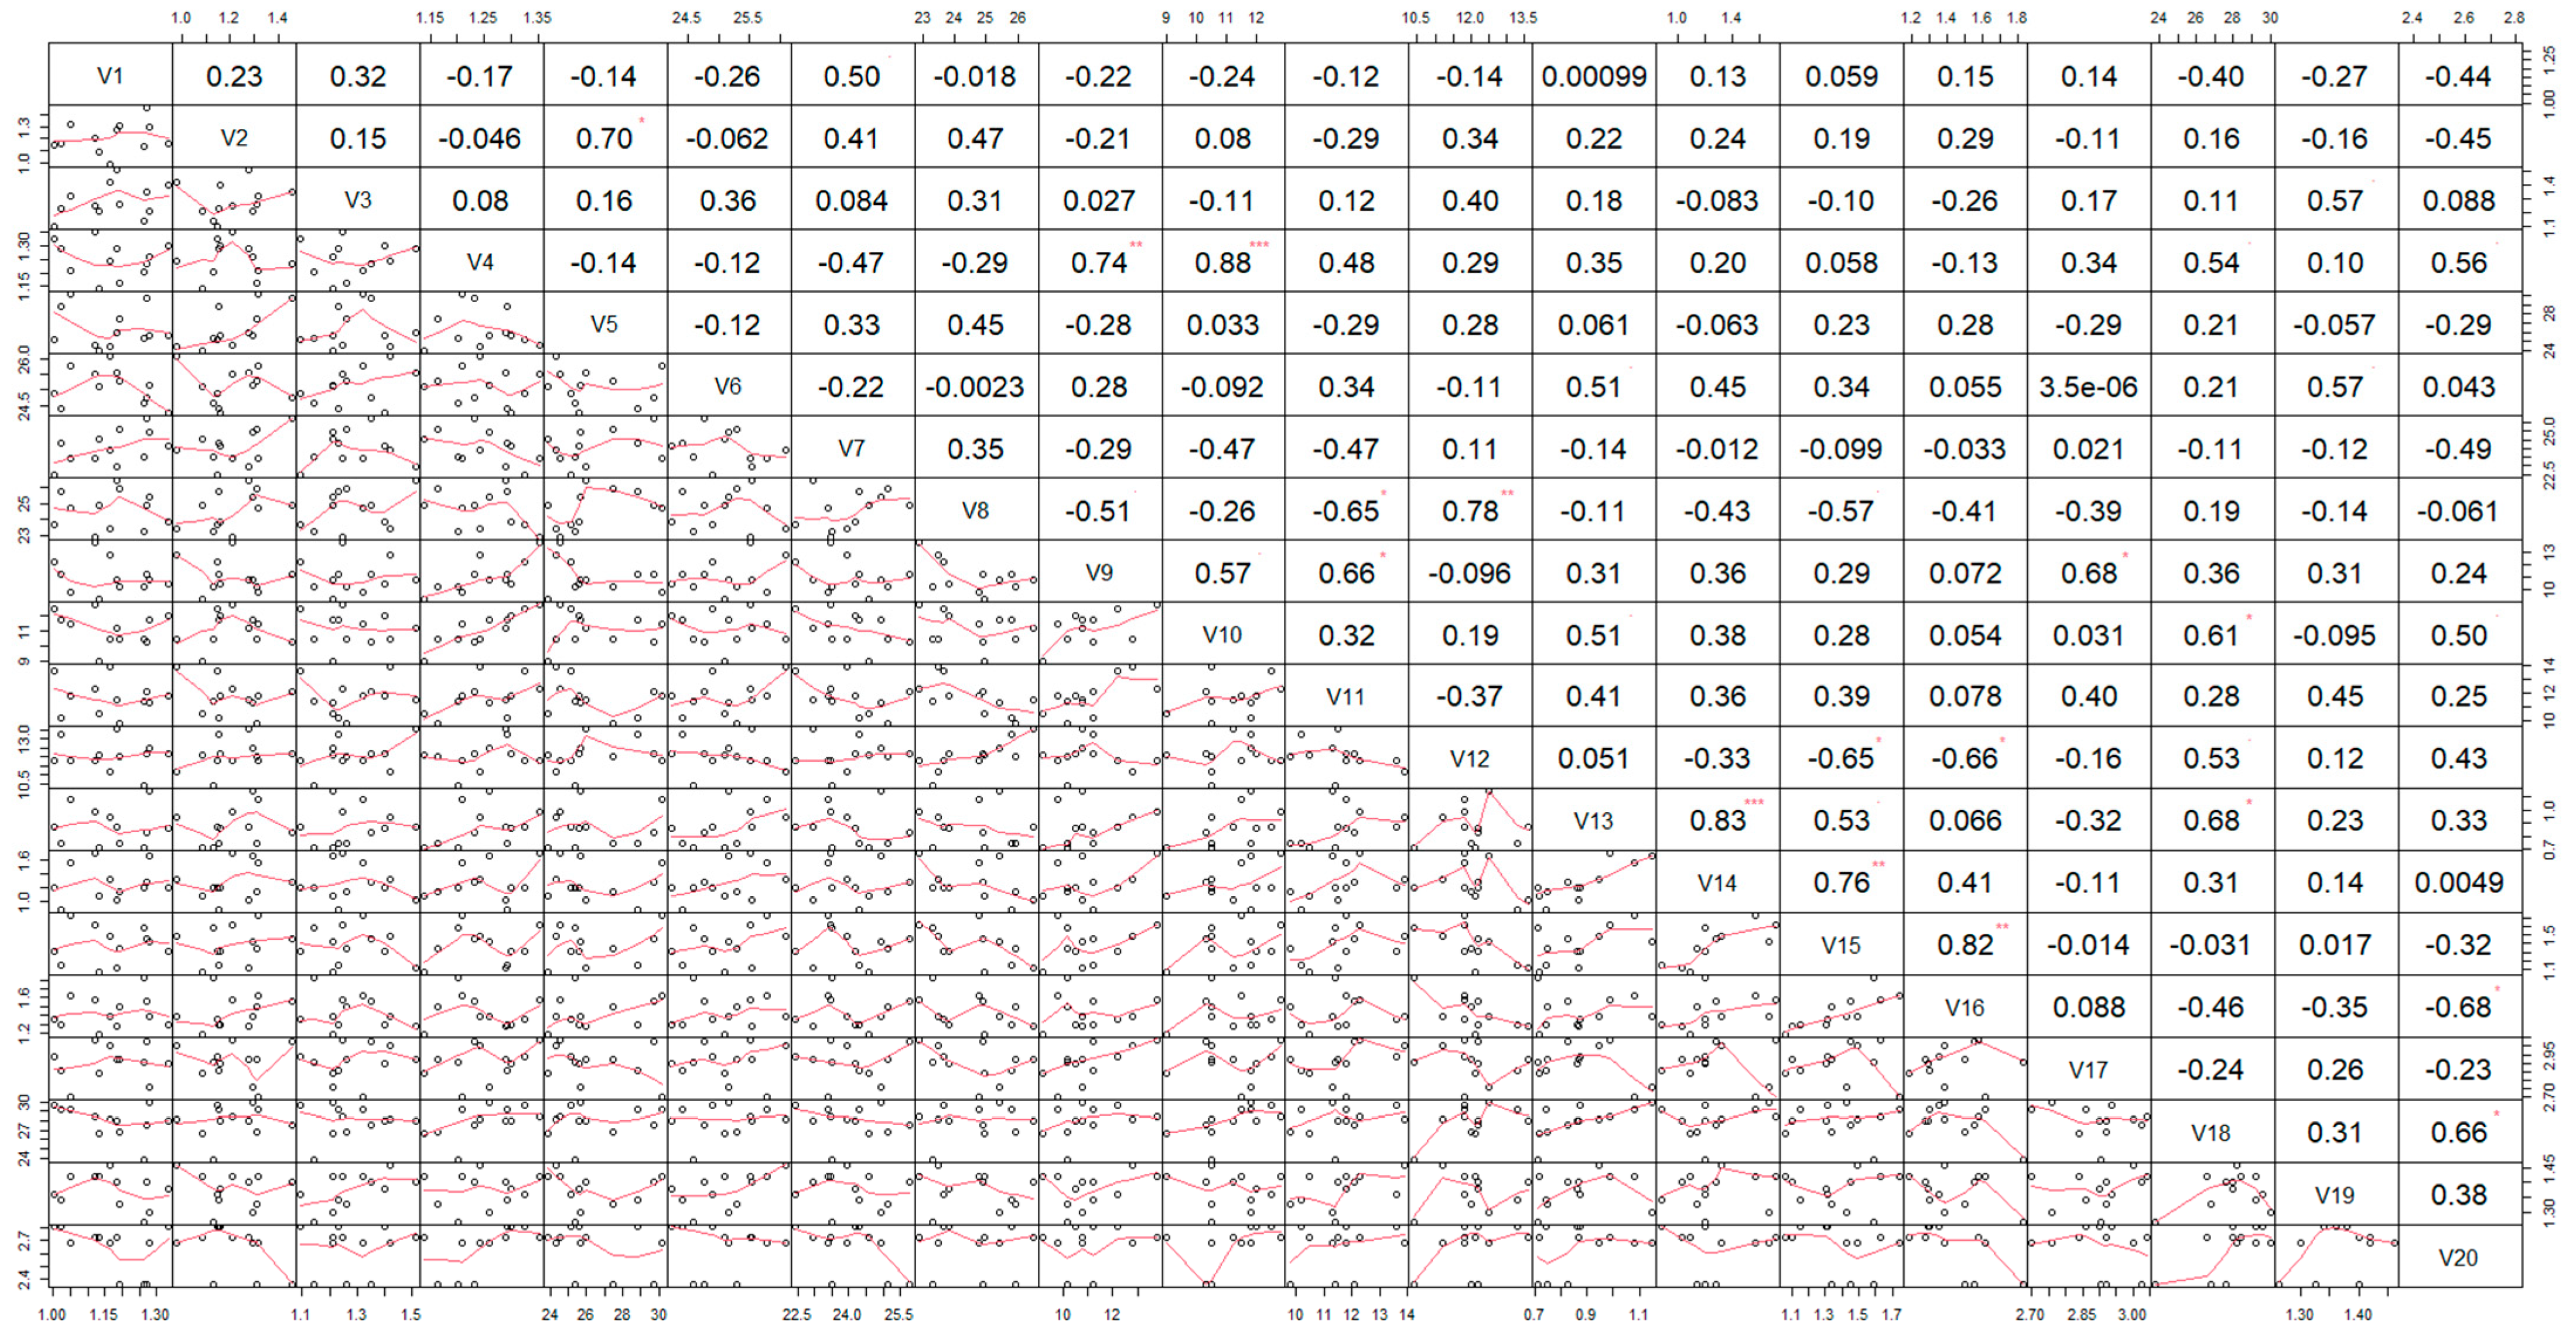
Figure 7.
RDA two-dimensional ranking diagram of plant characters and soil physical properties. Note: SPR 5, 15, 25, and 35 are, respectively, mean soil penetration resistance in 5 cm,15 cm, 25 cm, and 35 cm; Moisture content 5, 15, 25, and 35 are, respectively, mean soil moisture content in 5 cm, 15 cm, 25 cm, and 35 cm; Temperature 5, 15, 25, and 35 are, respectively, mean soil temperature in 5 cm, 15 cm, 25 cm, and 35 cm; Bulk density 5, 15, 25, and 35 are, respectively, mean soil bulk density in 5 cm, 15 cm, 25 cm, and 35 cm. The same below.

Table 1.
Physical and chemical properties of test soil.
| Parameter | Value |
|---|---|
| Soil organic matter/g·kg−1 | 24.5 |
| Available phosphorus/mg·kg−1 | 20.5 |
| Available potassium/mg·kg−1 | 100 |
| Ammonium nitrogen/mg·kg−1 | 32.5 |
| Nitrate nitrogen/mg·kg−1 | 14.3 |
| Moisture content/% | 36.3 |
| pH | 6.03 |
Table 2.
Test plan.
| Cultivation and Sowing Mode of Corn Stubble | Concrete Measure |
|---|---|
| Plow tillage and sowing (PTS) | After the corn is harvested, all the straws are crushed with a length of ≤10 cm [Model:6B-1204,Manufacturer: John Deere(U.S.)], and evenly scattered on the ground. Then, a moldboard plow shall be used to turn it 25 cm deep[Model:Case PUMA 210, Manufacturer: Case IH(Shanghai, China)]. After turning it, it shall be harrowed twice, with a depth of 15–18 cm. Then, it shall be ridged and suppressed, and the next spring shall be seeded with a precision seeder [Model:BY484-2,Manufacturer: John Deere(U.S.)]. |
| Rotary tillage and sowing (RTS) | After the corn is harvested, all the straws are crushed with a length of ≤10 cm[Model:6B-1204,Manufacturer: John Deere(U.S.)], evenly scattered on the ground, and then deeply loosened for 30 cm [Model:1SB-570, Manufacturer: WRNZ(Harbin,China)]. Use rotary cultivator to mix straw in 0–15 cm soil layer [Model:TM140, Manufacturer: New Holland(U.S.)], and then ridge and suppress. The next spring, precision seeders are used for sowing [Model:BY484-2, Manufacturer: John Deere(U.S.)]. |
| No-tillage and sowing (NTS) | After the corn is harvested, all the corn stalks will be crushed with a length of ≤10 cm, and the ground will be covered evenly. The next spring, no-tillage seeder will be used for direct sowing [Model:2BMF-4 No-tillage seeder, Manufacturer: Jilin Kangda(Jilin,China)]. |
| No-tillage and precise sowing in stubble field (STS) | During the harvest of corn, 40–60 cm stubble shall be left, and the next spring, do not conduct any treatment on the corn stubble and soil before sowing, no-tillage precision planter shall be used to directly sow the original stubble field [Model:2BMFJ-BLY2 stubble precision seeder, Manufacturer: Northeast Agricultural University]. |
Table 3.
Significance analysis of soil penetration resistance.
| Test Period | Treatment | Soil Depth/cm | |||||||
|---|---|---|---|---|---|---|---|---|---|
| 0–10 | 10–20 | 20–30 | 30–40 | 40–50 | 50–60 | 60–70 | 70–80 | ||
| 50 days after corn sowing | PTS | 1.01 b | 1.25 c | 1.34 c | 1.41 c | 1.53 b | 1.61 b | 1.62 b | 1.74 bc |
| RTS | 1.1 ab | 1.53 a | 1.66 a | 1.57 b | 1.58 b | 1.61 b | 1.63 b | 1.65 c | |
| NTS | 1.15 a | 1.49 a | 1.63 a | 1.76 a | 1.84 a | 1.89 a | 1.97 a | 2.32 a | |
| STS | 1.01 b | 1.43 b | 1.55 b | 1.56 b | 1.55 b | 1.51 c | 1.62 b | 1.79 b | |
| 100 days after corn sowing | PTS | 0.85 ab | 1.13 b | 1.42 a | 1.45 b | 1.39 c | 1.39 c | 1.49 c | 1.6 c |
| RTS | 0.93 a | 1.28 a | 1.43 a | 1.46 b | 1.44 c | 1.53 b | 1.57 c | 1.7 b | |
| NTS | 0.82 b | 1.17 b | 1.31 b | 1.48 b | 1.55 b | 1.64 a | 2.05 a | 2.22 a | |
| STS | 0.83 b | 1.34 a | 1.46 a | 1.66 a | 1.66 a | 1.6 ab | 1.68 b | 1.72 b | |
| 150 days after corn sowing | PTS | 0.86 b | 1.28 b | 1.26 c | 1.35 c | 1.38 b | 1.42 c | 1.48 d | 1.44 c |
| RTS | 0.83 b | 1.09 d | 1.26 c | 1.32 c | 1.41 b | 1.53 b | 1.71 b | 1.73 b | |
| NTS | 1.06 a | 1.51 a | 1.55 a | 1.46 b | 1.59 a | 1.71 a | 1.92 a | 1.92 a | |
| STS | 0.76 b | 1.2 c | 1.46 b | 1.63 a | 1.56 a | 1.56 b | 1.61 c | 1.66 b | |
Note: PTS—plow tillage and sowing; RTS—rotary tillage and sowing; NTS—no-tillage and sowing; STS—no-tillage and precise sowing in stubble field. Different small letters indicate that there are significant differences between different tillage modes in the same test period (p < 0.05). The same below.
Table 4.
Effects of tillage and sowing methods on corn yield.
| Tillage Methods | Yield Components | Yield (kg·hm−2) | ||||
|---|---|---|---|---|---|---|
| Spike Length (cm) | Convex Tip Length (cm) | Number of Rows per Ear | Number of Grains per Row (Individual) | 100 Grain Weight (g) | ||
| PTS | 22.59 ± 2.00 a | 0.8 ± 1.0 a | 18.87 ± 2.01 a | 39.53 ± 5.39 a | 38.42 ± 1.03 a | 2725.44 ± 272.53 a |
| RTS | 22.72 ± 2.55 a | 0.85 ± 0.69 a | 18.53 ± 1.74 a | 40.13 ± 4.99 a | 38.73 ± 4.96 a | 2805.76 ± 294.29 a |
| NTS | 22.52 ± 2.23 a | 1.16 ± 1.06 a | 19.07 ± 1.80 a | 40.27 ± 3.21 a | 40.12 ± 3.57 a | 2686.92 ± 177.43 a |
| STS | 23.68 ± 2.31 a | 0.73 ± 1.02 a | 18.53 ± 1.89 a | 40.10 ± 4.60 a | 36.9 ± 2.09 a | 2358.5 ± 325.12 a |
PTS—plow tillage and sowing; RTS—rotary tillage and sowing; NTS—no-tillage and sowing; STS—no-tillage and precise sowing in stubble field.
Table 5.
Explanatory degree and significance test of impact factors.
| 50 Days after Corn Sowing | 100 Days after Corn Sowing | 150 Days after Corn Sowing | |||||||||
|---|---|---|---|---|---|---|---|---|---|---|---|
| Influence Factors | Explanation Rate (%) | F | p | Influence Factors | Explanation Rate (%) | F | p | Influence Factors | Explanation Rate (%) | F | p |
| SPR 35 | 42.2 | 7.3 | 0.014 | Bulk density 25 | 38.9 | 6.4 | 0.018 | SPR 5 | 33.2 | 8 | 0.008 |
| SPR 25 | 9.6 | 3.1 | 0.102 | Bulk density 35 | 8.9 | 2.4 | 0.128 | SPR 35 | 2.5 | 1.7 | 0.28 |
| Moisture content 35 | 23.6 | 6.2 | 0.032 | Temperature 35 | 23 | 5.4 | 0.02 | Temperature 5 | 29.3 | 4.1 | 0.03 |
| Temperature 35 | 6.7 | 2.6 | 0.148 | Moisture content 25 | 4.3 | 1.2 | 0.278 | Temperature 35 | 13.8 | 4.7 | 0.038 |
| Temperature 15 | 0.7 | 0.2 | 0.7 | SPR 35 | 1.6 | 0.4 | 0.672 | Temperature 25 | 0.5 | 308 | 0.15 |
| Bulk density 5 | 10 | 5.1 | 0.022 | ||||||||
| Bulk density 15 | 4.1 | 5 | 0.028 | ||||||||
| Bulk density 25 | 1.2 | 5.2 | 0.11 | ||||||||
| Moisture content 15 | 3.8 | 2.3 | 0.134 | ||||||||
| Moisture content 35 | 1.6 | 2.9 | 0.18 | ||||||||
Disclaimer/Publisher’s Note: The statements, opinions and data contained in all publications are solely those of the individual author(s) and contributor(s) and not of MDPI and/or the editor(s). MDPI and/or the editor(s) disclaim responsibility for any injury to people or property resulting from any ideas, methods, instructions or products referred to in the content. |
© 2023 by the authors. Licensee MDPI, Basel, Switzerland. This article is an open access article distributed under the terms and conditions of the Creative Commons Attribution (CC BY) license (https://creativecommons.org/licenses/by/4.0/).
Share and Cite
MDPI and ACS Style
Wang, Y.; Yang, S.; Sun, J.; Liu, Z.; He, X.; Qiao, J. Effects of Tillage and Sowing Methods on Soil Physical Properties and Corn Plant Characters. Agriculture 2023, 13, 600. https://doi.org/10.3390/agriculture13030600
AMA Style
Wang Y, Yang S, Sun J, Liu Z, He X, Qiao J. Effects of Tillage and Sowing Methods on Soil Physical Properties and Corn Plant Characters. Agriculture. 2023; 13(3):600. https://doi.org/10.3390/agriculture13030600
Chicago/Turabian StyleWang, Ying, Sen Yang, Jian Sun, Ziguang Liu, Xinmiao He, and Jinyou Qiao. 2023. "Effects of Tillage and Sowing Methods on Soil Physical Properties and Corn Plant Characters" Agriculture 13, no. 3: 600. https://doi.org/10.3390/agriculture13030600
Note that from the first issue of 2016, this journal uses article numbers instead of page numbers. See further details here.