

Effect of Nitrogen Application Methods on Yield and Grain Quality of an Extremely Early Maturing Rice Variety

Crop Research Department, Chungcheongnamdo Agricultural Research and Extension Services, Yesan 340861, Chungcheongnamdo, Republic of Korea
*
Author to whom correspondence should be addressed.
Agriculture 2023, 13(4), 832; https://doi.org/10.3390/agriculture13040832
Submission received: 15 March 2023
/
Revised: 31 March 2023
/
Accepted: 3 April 2023
/
Published: 5 April 2023
(This article belongs to the Special Issue Agrotechnology of Improving Yield and Quality in Field Crops under Climate Change)
Abstract
:This study aimed to investigate the effect of nitrogen application methods on the yield and grain quality of an extremely early maturing rice variety. The experiment was conducted in the rice research field of Chungnam Agricultural Research and Extension Services, South Korea, in 2019 and 2020. Two nitrogen application methods, BD (100% as a basal dressing) and BTD (70% as a basal dressing + 30% as a top dressing), with three different nitrogen levels (70 kg/ha, 90 kg/ha, and 110 kg/ha), were employed. The results showed that BD treatment had comparable or higher head rice yields and improved grain quality compared to BTD treatment at all nitrogen levels. Additionally, the SPAD value at heading date was highly correlated with both the protein content (r2 = 0.838**) and glossiness of cooked rice (r2 = 0.630**). Therefore, this study suggests that BD treatment could be an effective approach to improve the productivity and quality of extremely early maturing rice varieties while saving on labor costs, and the SPAD value can be used as an index to infer the taste of rice. In conclusion, this study provides useful insights into nitrogen application methods that can be used to enhance the yield and quality of extremely early maturing rice varieties.
1. Introduction
Rice (Oryza sativa L.) is a vital crop that sustains a significant portion of the world’s population, particularly in Asia, where it serves as a staple food. In response to climate change threatening rice production, early maturing rice varieties with short growing periods have emerged as a promising approach to boost productivity and reduce methane emissions. This approach has been supported by several studies which have shown that early maturing rice varieties not only reduce the duration of the anaerobic period but also enable farmers to harvest rice earlier and plant other crops in the same season [1,2]. Recently, Bbareumi, an extremely early maturing rice variety with a substantially shorter growing period than typical early maturing rice, has been developed and selected as a variety in response to climate change [3,4]. This rice variety is being cultivated in agricultural fields to enhance productivity through double cropping.
The protein content of grains, along with the amylose content, is a factor that determines the taste of rice. When the protein content is high, the hardness of rice increases, and the viscosity decreases, resulting in a worse taste. The protein content of rice varies depending on the variety, cultivation environment, and weather conditions [5,6,7]. Several studies have shown that the protein content of rice grains can be significantly affected by nitrogen levels and that increasing nitrogen levels resulted in a significant increase in the protein content of rice grains [8,9,10]. Furthermore, nitrogen application has the potential to impact the expression of genes related to grain quality in rice, which includes those that are involved in amino acid and protein metabolism [11,12,13]. Therefore, standard nitrogen levels have been set to optimize both yield and grain quality in rice production, as the nitrogen level is a critical factor that can largely affect the protein content and other quality characteristics of rice grains.
In addition, other studies suggested that the timing of nitrogen application can have an influence on the protein content of rice grains. Although the specific timing and increase in protein content varied depending on the conditions of the studies, delaying the application of nitrogen fertilizer to rice plants can lead to an increase in the protein content of rice grains [14,15]. Thus, proper management of nitrogen fertilization can help to improve both the protein content and overall quality of rice grains while maintaining optimal yields. In Korea, the recommended nitrogen fertilizer rates vary depending on the desired rice quality, with 70 kg/ha for premium rice, 90 kg/ha for high-quality rice, and 110 kg/ha for regular rice [16]. For mid-late maturing rice in the plains, the standard nitrogen split method involves applying 70% of the fertilizer as basal dressing and 30% as top dressing at the panicle initiation stage (around 60 days after transplanting). However, due to the fewer than 50 days from the transplanting to heading of extremely early maturing rice, there is a need to develop a new fertilization method that can achieve efficient farming and improve rice quality.
As living standards have improved, rice consumption per person has decreased due to the availability and consumption of Western-style convenience foods. Consequently, there has been a growing demand for high-quality rice, driven by consumers who are increasingly seeking rice with certain taste and grain appearance traits [17,18,19]. Thus, continuous studies have been conducted to enhance the quality of early maturing rice varieties, as these varieties with high protein content and low appearance quality have resulted in poor taste [20,21,22,23]. However, there has been little research on the cultivation of extremely early maturing rice varieties.
This study was conducted to investigate the yield and grain quality of an extremely early maturing rice variety according to nitrogen application methods and to develop a cultivation technology that can improve productivity and grain quality while saving on labor.
2. Materials and Methods
2.1. Meteorological Data
To investigate the meteorological conditions during the rice cultivation period in Yesan, South Korea, from 2019 and 2020, weather data from the Korea Meteorological Administration (https://www.weather.go.kr (accessed on 13 February 2023)) were used.
2.2. Experimental Site and Rice Plant Material
This study was carried out from 2019 to 2020 at the rice research field of the Chungcheongnamdo Agricultural Research and Extension Services located in Yesan, Chungcheongnamdo, South Korea (36°44′ N, 126°49′ E). Bbareumi, an extremely early maturing variety with a growing period of less than 100 days from transplanting to harvest, was used. Additionally, soil analysis was performed before the test to determine the appropriate fertilizer based on the characteristics of the soil. Soil samples were obtained at a depth of 0–30 cm, and the collected samples were air-dried, crushed thoroughly, sieved through a 2 mm sieve, and chemically characterized through laboratory analysis (Table 1). The pH and electrical conductivity (EC) of the soil samples were determined using a pH meter (Orion Star A211, Thermo Scientific, Waltham, MA, USA). The other chemical properties of the soil were measured according to the manuals of NIAST [24].
2.3. Experimental Treatments
Treatments for nitrogen application methods are summarized in Table 2. The experiment consisted of two nitrogen application methods (BD: 100% as a basal dressing; BTD: 70% as a basal dressing +30% as a top dressing) and three nitrogen levels (70 kg/ha for premium rice, 90 kg/ha for high-quality rice, and 110 kg/ha for regular rice), with three replications over two years. Each plot had a size of 16.5 m2 (5 m long and 3.3 m wide) and the amount of nitrogen according to the rice quality was calculated using urea as follows [16]:
[70 kg/ha: N (kg/ha) = 71.0 − 0.85 × OM (organic matter) + 0.16 × SiO2]
[90 kg/ha: N (kg/ha) = 91.4 − 1.09 × OM (organic matter) + 0.20 × SiO2]
[110 kg/ha: N (kg/ha) = 111.7 − 1.33 × OM (organic matter) + 0.25 × SiO2]
2.4. Cultivation Methods
To prevent diseases transmitted by rice seeds such as Blast and Bakanae disease, the rice seeds were soaked in 15 °C cold water for 2 days. They were then disinfected with Tebuconazole + Prochloraz copper chloride [25]. The disinfected seeds were sown in nursery boxes and grown in a greenhouse for 3 weeks before being manually transplanted on 3 May. A total of 3–5 seedlings were transplanted hill−1 with a spacing of 14 cm between plants and 30 cm between rows. After transplanting, the rice field was immediately flooded, and a depth of 3–5 cm was maintained until 30 days after heading. Afterward, it was dried for harvest. Harvesting was carried out once the accumulated temperature had reached 1000 °C after heading. The accumulated temperature was calculated as the sum of the daily mean temperature after the heading date. Chemical pesticides to control pests and diseases were applied only once immediately after transplanting.
2.5. Traits Evaluation
2.5.1. Agronomic Traits
Heading date was determined when 50% of the panicles were headed, and days to heading was calculated as the number of days from transplanting date to heading date. For panicle length and number hill−1, 10 randomly selected rice plants from each plot were examined at the maturity stage; panicle length was measured from the panicle neck to the panicle tip. For spikelet number and percentage of ripened grain, three rice plants from each plot were harvested before harvest and manually threshed to separate the grains from the straws. Spikelet (unfilled and filled grains) number panicle−1 was manually counted and air-dried and then submerged in water to distinguish the unfilled and filled grains. The percentage of ripened grains was determined as the number of filled grains per panicle divided by the total number of grains (unfilled and filled grains) panicle−1. To determine milled rice yield, 50 rice plants in each plot were selected and harvested, threshed, air-dried, and weighed. In addition, 500 g of rough rice was de-hulled for brown rice and polished for milled rice. The milled rice yield was then calculated. The 1000-grain weight was evaluated by measuring the weight of 1000 randomly selected brown rice grains. Additionally, the milled rice yield and the 1000-grain weight were corrected for 15% grain moisture content. Head rice yield was calculated by multiplying the milled rice yield by head rice rate. The SPAD value was measured with a Chlorophyll Meter (SPAD-502, Minolta Camera Co., Tokyo, Japan) at heading date using ten random rice plants selected in each plot and measuring the center of the top second leaf of each plant.
2.5.2. Grain Quality Traits
Appearance traits of milled rice were automatically calculated using a grain inspector (Cervitec 1625, Foss, Höganäs, Sweden) with a sample of approximately 1000 grains. The head rice rate was defined as the percentage of translucent grains that accounted for more than 3/4 of the whole grains, the chalky rice rate was the percentage of grains with an opaque and chalky appearance covering more than half of the grain, and the others were the percentages of broken and damaged rice. The protein content (PC) of milled rice was measured using 100g milled rice samples with a grain analyzer (Infratec 1241, Foss, Höganäs, Sweden), and glossiness of cooked rice (GCR) was measured using 33 g milled rice samples with a Toyo taste meter (MA-90R2, Yakayama, Toyo) in accordance with the manufacturer’s instructions.
2.6. Statistical Analysis
Statistical analyses such as t-tests, ANOVA (analysis of variance), correlation analysis, and regression analysis were performed using IBM SPSS software (Ver. 20.0.0). The data were arranged into tables and figures, produced using Microsoft Excel 2019.
3. Results
3.1. Meteorological Conditions during Rice Growing Periold
Meteorological data (rainfall and minimum and maximum temperatures) from the transplanting to harvest of Bbareumi rice was organized into 15 days and is shown in Figure 1. The maximum temperature in 2019 was higher than in 2020 during the growth period, except from early June to late June. Notably, the minimum temperature of rice tillering and panicle initiation stage in 2019 was lower than in 2020. Rainfall was higher in 2020 compared to 2019, with the highest amount of rainfall recorded in late July.
3.2. Agronomic Traits
The heading date and yield-related traits according to nitrogen application methods are summarized in Table 3. All the traits investigated in this study showed significant differences between years. The heading date in 2020 was two days earlier than that in 2019, indicating that it took 51 days from transplanting to heading. Compared to 2019, longer culm and panicle lengths and a greater panicle number hill−1 and m−2 were observed in 2020, and all traits showed an increasing trend as the nitrogen fertilizer levels increased. Additionally, the BD treatment (100% basal dressing) resulted in shorter culm and panicle lengths but a greater panicle number hill−1 compared to the BTD treatment (70% basal dressing + 30% top dressing). The highest panicle number hill−1 was 14.7 and 16.8 in 2019 and 2020, respectively, in the BD110 treatment.
The chlorophyll content of the leaves was measured at heading date for two years. The results indicated that the SPAD value increased with higher amounts of fertilizer, and the BTD treatment showed a higher SPAD value than the BD treatment. The BTD110 treatment had the highest SPAD values of 39.1 and 37.9 in 2019 and 2020, respectively. On the other hand, the BD70 treatment had the lowest SPAD values of 34.3 and 33.6 in 2019 and 2020, respectively (Figure 2).
Comparing the data from 2019 and 2020, it was observed that in 2020, the spikelet number hill−1, spikelet number m−2, and the ripened grains number m−2 were all higher than the values recorded in 2019 (Table 4). In addition, the 1000-grain weight was 0.1 g heavier in 2020, but there was no statistically significant difference, and the ripening rate was 6.1% higher than in 2019. The spikelet number m−2 increased as the nitrogen levels increased under the same nitrogen application method, and those of the BTD treatment were higher than BD. The highest spikelet numbers m−2 were observed in the BTD110 treatment, with 29,657 and 32,102 in 2019 and 2020, respectively. The highest ripened grain numbers m−2 were 23,904 in the BTD110 treatment in 2019 and 24,507 in the BD110 treatment in 2020. However, the BTD110 treatment exhibited the lowest ripened grain rate, while the BD70 treatment demonstrated the highest. Additionally, the 1000-grain weight showed a slight decrease as the amount of fertilizer applied increased in 2019.
3.3. Grain Quality Traits
The impact of nitrogen application on grain quality traits was evaluated by examining several factors, such as appearance, protein content, and the glossiness of cooked rice, and the results are presented in Table 5. Compared to 2020, in 2019, the head rice rate was higher, while the GCR (grain chalkiness rate) value was lower. Specifically, the head rice rate was higher in the BD (basal dressing) treatment compared to the BTD (basal and topdressing) treatment. The treatment with the highest head rice rate was BD70, which showed rates of 90.9% and 84.9% in 2019 and 2020, respectively. The protein content of rice grains increased as the nitrogen level increased under the same nitrogen application method. Furthermore, the BTD treatment had a higher protein content than the BD treatment under the same nitrogen level. In particular, the BTD110 treatment showed the highest protein contents of 7.1% and 6.9% in 2019 and 2020, respectively. However, the GCR showed the lowest values in the BTD110 treatment, which was in contrast to the protein content.
We observed an increase in the milled rice yield in 2020 for all treatments compared to 2019 [Figure 3a]. Additionally, the milled rice yield increased as the nitrogen levels applied increased under the same nitrogen application method. The highest milled rice yield was observed in the BD110 treatment in 2020, at 529 t ha−1, while the highest milled rice yield in 2019 was observed in the BTD110 treatment, at 4.89 t ha−1. The head rice yield of the BD treatment was similar to or higher than the BTD treatment [Figure 3b]. Furthermore, the head rice yield did not increase sharply as the nitrogen levels increased. The BD110 treatment showed the highest head rice yield of 4.39 t ha−1 in 2020, while in 2019, both the BD110 and the BTD110 treatments had the highest head rice yields of 4.19 t ha−1 and 4.22 t ha−1, respectively. Overall, the results suggested that increasing the amount of nitrogen application can increase the milled rice yield, and the BD treatment could be a feasible method to achieve higher head rice yield, as it showed similar or higher yields compared to the BTD treatment under the same nitrogen level.
3.4. Relationship among the Traits
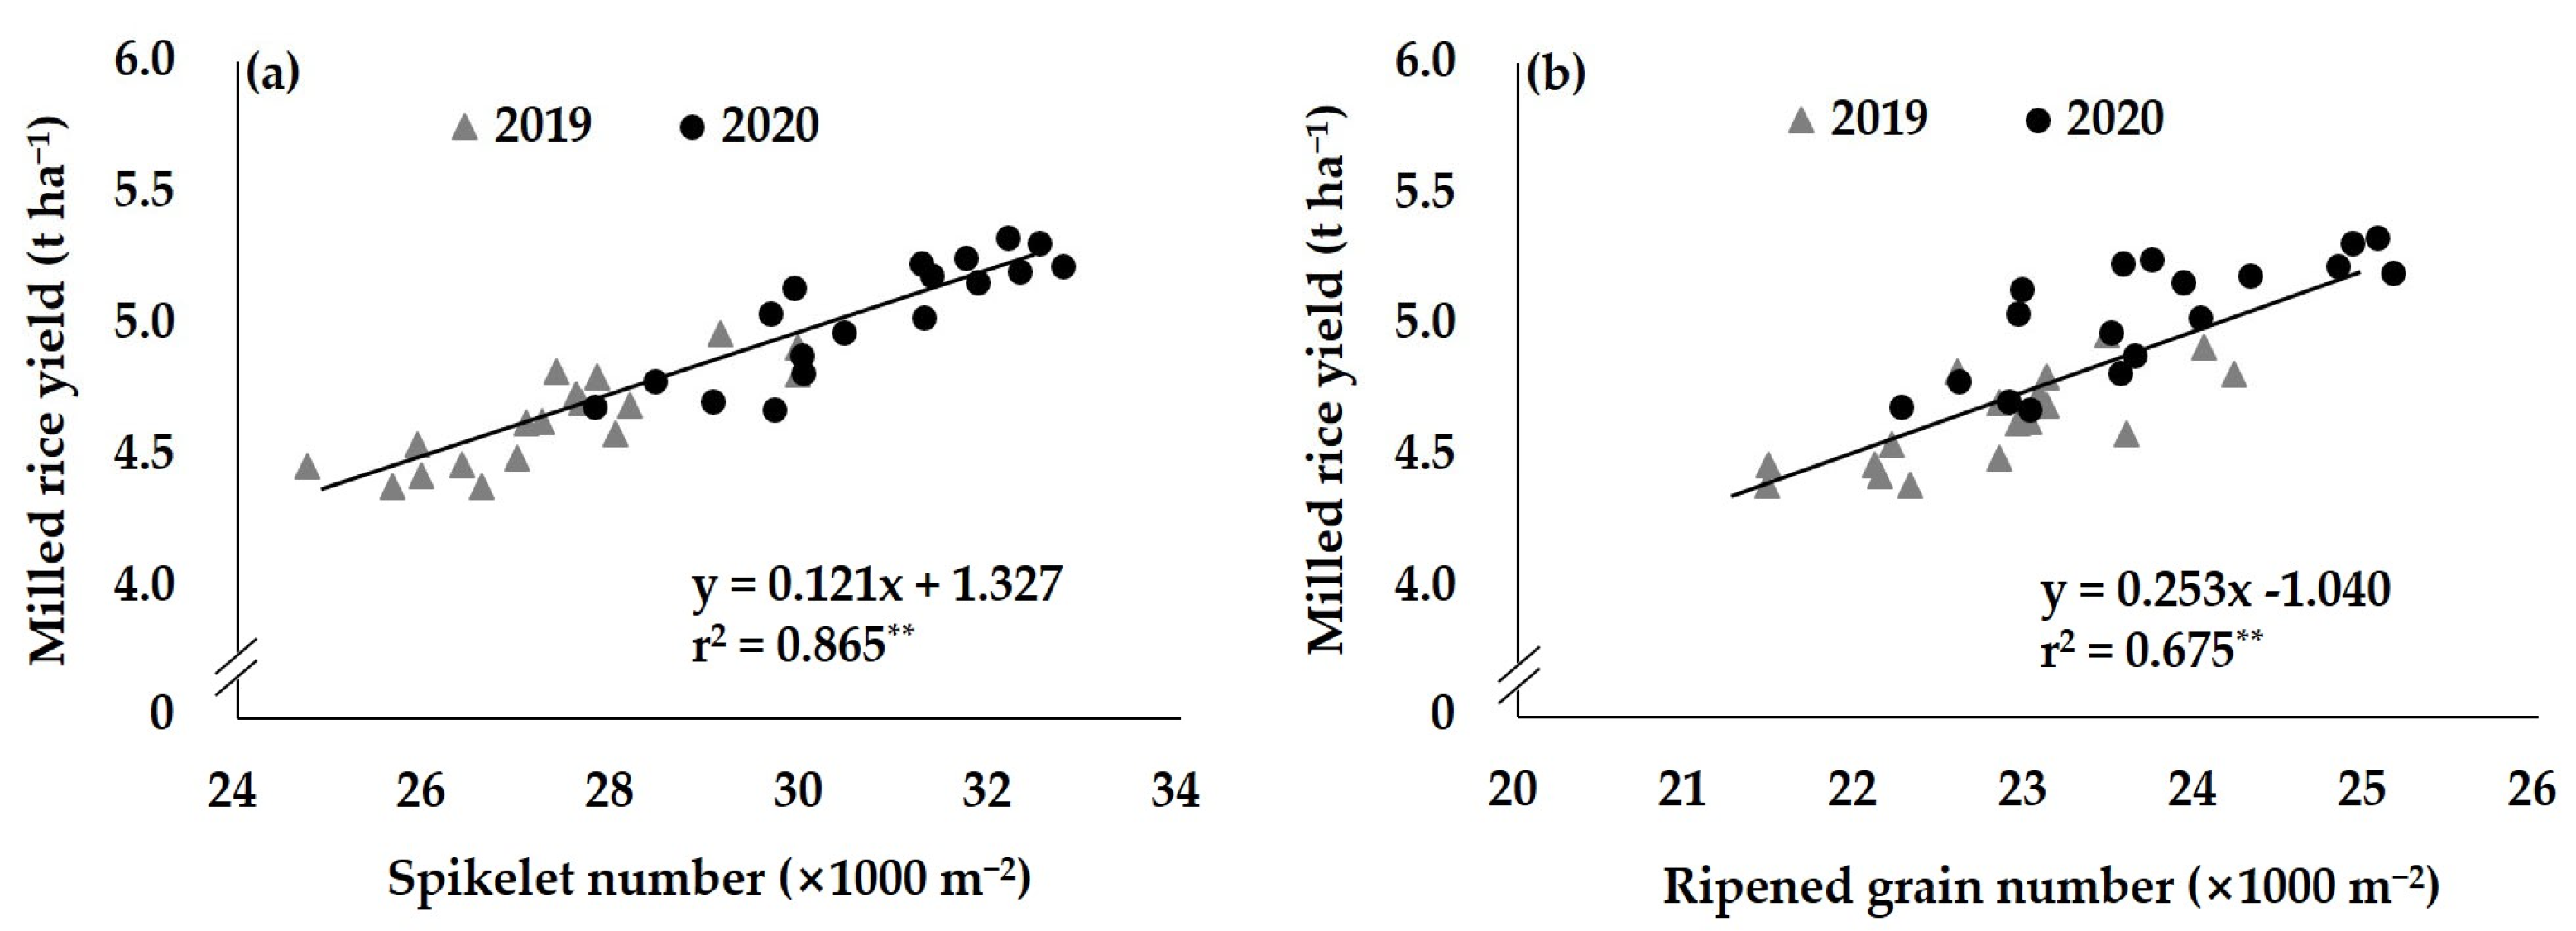
Figure 4 illustrates the results of a correlation analysis conducted to examine the relationship between the milled yield and spikelet number m−2. The analysis revealed that milled rice yield had a significant and strong positive correlation with both spikelet number m−2 and ripened grain number m−2, with correlation coefficients of r2 = 0.865** and r2 = 0.675**, respectively. The study found that the correlation between milled rice yield and spikelet number m−2 was stronger than that between the milled rice yield and the ripened grain number m−2. Therefore, a regression equation could more accurately predict the milled rice yield based on the spikelet number m−2. However, in contrast to the results for milled rice yield, the head rice yield was more strongly correlated with the ripened grain number m−2 (r2 = 0.305**) than with the spikelet number m−2 (r2 = 0.223**). Therefore, a regression equation based on the ripened grain number m−2 could more effectively estimate the head rice yield (Figure 5).
A correlation analysis was conducted to investigate the relationship between the SPAD values measured at the heading date and the indirect indicators of rice taste, including the protein content of milled rice and the glossiness of cooked rice. The results are summarized in Figure 6. The findings showed that the SPAD values was positively correlated with protein content (r2 = 0.838**) and negatively correlated with the glossiness of cooked rice (r2 = 0.630**). These results suggested that the SPAD values can be employed as an estimator of the indirect indicators of rice taste.
4. Discussion
An extremely early maturing rice variety has the potential to decrease methane gas emissions and increase grain productivity through double cropping. However, limited research has been conducted on the optimal cultivation techniques for this variety, specifically regarding nitrogen application methods. Therefore, this study aimed to assess the impact of different nitrogen application methods on the yield and grain quality of extremely early maturing rice varieties.
4.1. Importance of Temperature at Vegetative Growth Period
Bbareumi, an extremely early maturing rice variety, has a short vegetative growth period of fewer than 50 days, which emphasizes the importance of early growth. This study found that in 2019, low temperatures during the early growth stage led to reduced growth, resulting in a decrease in the milled rice yield due to a lower number of spikelet m−2 compared to 2020. This suggests that temperature during the early growth period plays a critical role in increasing the yield of extremely early maturing rice varieties. Studies have reported that high temperatures increased the nitrogen utilization rate in rice, while low temperatures decreased it, suggesting that high temperatures accelerate plant growth and increase the demand for nitrogen, while low temperatures reduce plant growth and nitrogen demand [26,27,28,29,30]. In addition, this study highlights the importance of considering temperature when growing extremely early maturing rice varieties, as the temperature can significantly influence the growth of rice plants [4].
4.2. Variation in Agronomic Traits and Yield
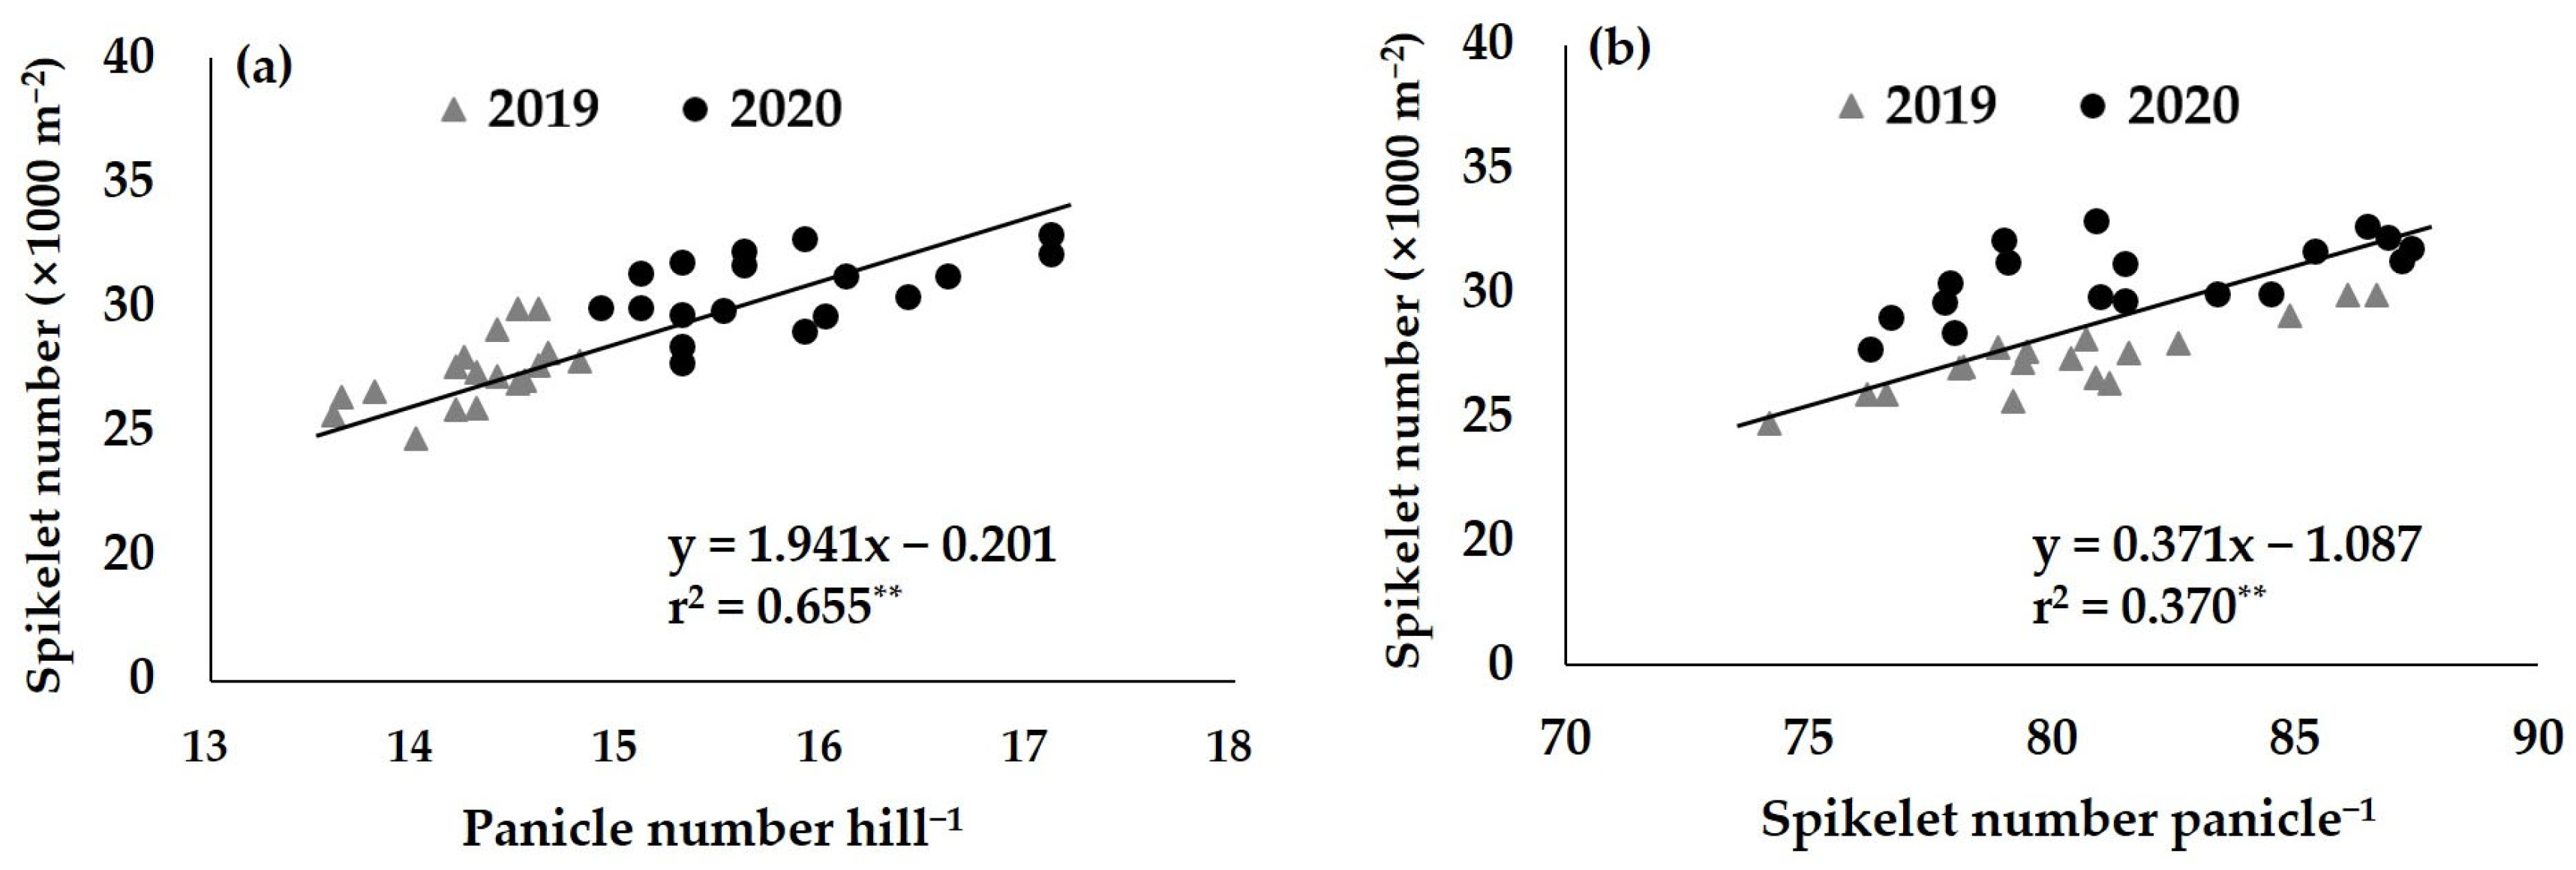
The results of this study showed that in 2019, the panicle number hill−1 and number of spikelet m−2 were lower compared to 2020, which led to a decrease in yield across all treatment groups. However, all traits investigated across both years with respect to the nitrogen levels and application methods showed consistent trends. The productivity of rice can be attributed to yield components, which include the number of panicles, the number of spikelets, the rate of ripened grains, and the weight of 1000 grains [31,32,33,34]. Panicle and spikelet numbers are determined before the heading date, while the other components are influenced by weather conditions during the grain-filling period. Among them, spikelet number m−2 largely explains the variation in yield and is considered as an important factor [35,36,37,38]; it is calculated by multiplying the number of panicles by the spikelet number panicle−1. To identify which traits have a greater impact on spikelet number m−2, correlation analyses were conducted with the panicle number hill−1 and the spikelet number m−2, respectively (Figure 7). The results indicated that both traits showed a highly significant positive correlation with spikelet number m−2, showing that they are important determinants of rice yield. Interestingly, the number of panicles hill−1 exhibited a stronger correlation with spikelet number m−2 than the number of spikelet panicle−1, with r2 = 0.655** and r2 = 0.370**, respectively. Furthermore, the study suggested that securing more panicles during the vegetative stage is crucial for achieving stable yield when growing extremely early maturing rice varieties.
In this study, it was observed that the panicle number and the spikelet number varied depending on the application methods, even when the same amount of nitrogen fertilizer was used. In the BD treatment (100% nitrogen applied as a basal dressing), a higher panicle number hill−1 was observed, while the spikelet number panicle−1 was lower. Conversely, the opposite trend was observed in the BTD treatment (70% nitrogen as basal and 30% nitrogen as top-dressing). The observed variation in the traits depending on the application methods of nitrogen fertilizer is likely due to differences in the timing and availability of nitrogen to the rice plants. In the BD treatment, the nitrogen was available to the rice plants early on, allowing for more tiller and ultimately resulting in a higher panicle number hill−1. Conversely, in the BTD treatment, the nitrogen was applied twice, and the top-dressing may have resulted in a larger number of panicles and greater spikelet number panicle−1 due to the higher availability of nitrogen during panicle initiation. More nitrogen was absorbed by rice plants or lost from the soil before panicle initiation as the SPAD values were different between the BD and BTD treatments. Overall, the timing and availability of nitrogen appear to be crucial factors in determining the number of panicles and grains of rice, and different application methods can lead to different outcomes. These results were supported by several studies, showing that delaying the application of nitrogen fertilizer to rice plants can lead to an increase in the protein content of rice grains [13,14,15].
The SPAD values, which indicate chlorophyll content, revealed that the BD treatment had SPAD values ranging from 33.6 to 36.4, while the BTD treatment had slightly higher values from 35.4 to 39.1. Several studies reported that the SPAD values measured at the heading date typically range from 31.7 to 39.2 under different environments and rice varieties [39,40]. These findings suggested that an early maturing rice variety may not experience a nitrogen shortage during the grain-filling stage, even though 100% basal nitrogen is applied. Consequently, there were only small differences in the milled rice yield between the two nitrogen application methods under same nitrogen level (Figure 3).
4.3. Effect of Nitrogen Application on Milled Rice Grain Quality
As the demand for high-quality rice increases, head rice yield is becoming more important than milled rice yield. This is because it indicates the degree of milling efficiency and the level of damage to the rice grains during milling, which ultimately affects the quality of the final product [17,18,19]. In this study, BD treatment showed similar or higher head rice yield compared to BTD treatment, even under the same nitrogen level. This can be attributed to the negative correlation between the spikelet number panicle−1 and the ripened grain rate, as well as the positive correlation between the ripened grain rate and the head rice rate. In this study, BD treatment had fewer spikelet panicle−1 than BTD treatment, resulting in higher ripened grain rates and higher head rice rate. Therefore, the head rice yield was similar or higher, even though the milled rice yield was similar or low.
The protein content of rice is a crucial determinant of its quality, as it influences the sensory properties of cooked rice such as texture and taste. Rice with a high protein content tends to have reduced texture and can undergo accelerated aging, which compromises its quality [41,42]. Conversely, rice with a low protein content is generally considered to be of higher quality due to its superior sensory properties. In addition to protein content, the glossiness of cooked rice (GCR) is another important quality attribute used to assess the sensory properties of rice [43]. In this study, we observed significant variations in protein content and GCR based on the nitrogen application methods used, even when the same amount of nitrogen was applied. Specifically, the BTD treatment resulted in a higher protein content and lower GCR value compared to the BD treatment at all nitrogen levels. These findings suggested that the nitrogen application method can affect the quality of extremely early maturing rice. Additionally, the results showed that even when nitrogen is applied as a 100% basal dressing, an extremely early maturing rice variety may not experience nitrogen shortage during the grain-filling stage, as the head rice yield in BD treatment was comparable to or higher than that in the BTD treatment, and it showed a higher GCR with low protein content. These results suggest that the BD treatment could be an effective strategy for improving the yield and grain quality of an extremely early maturing rice variety while saving labor.
In addition, we found that the SPAD value at the heading date was highly correlated with both the protein content and the GCR value. Specifically, a higher chlorophyll content at the heading date resulted in an increased protein content of rice but decreased glossiness, suggesting that the chlorophyll content at the heading date can be used as an index to infer the taste of an extremely early maturing rice. Further research is needed to clarify this relationship.
5. Conclusions
This study found that an extremely early maturing rice variety may not experience a nitrogen shortage during the grain-filling stage, even though 100% nitrogen fertilizer was applied as a basal dressing. The milled rice yield of the BD treatment was similar to the BTD treatment under the same nitrogen level. In addition, the head rice yield in the BD treatment was comparable to or higher than that in the BTD treatment, and the BD treatment showed a higher GCR and a lower protein content. Therefore, the BD treatment could be an effective strategy for improving the yield and quality of an extremely early maturing rice variety while saving labor. This information can be useful for farmers and rice breeders seeking to improve the yields and the quality of rice using extremely early maturing rice varieties in response to climate change.
Author Contributions
Conceptualization, Y.Y.; methodology, Y.Y.; software, Y.Y.; formal analysis, Y.Y.; investigation, Y.L. and G.K.; data curation, Y.Y.; writing—original draft preparation, Y.Y.; writing—review and editing, Y.Y.; visualization, G.C.; supervision, T.Y. and H.K.; project administration, T.Y.; funding acquisition, H.K. All authors have read and agreed to the published version of the manuscript.
Funding
This study was carried out with the support of the Chungcheongnamdo Agricultural Research and Extension Services, South Korea (Project No. LP0042352020) and Rural Development Administration, South Korea (Project No. PJ0158202021).
Data Availability Statement
The corresponding author can be contacted to request the data presented in this study.
Acknowledgments
The author is thankful to Eunmi Lee, Kun Kim, Hyekyun Kim, Misook Lee, Jeongsook Jeon, Heesook Lim, and Jongmi Park for their technical support in the rice research field.
Conflicts of Interest
The authors declare no conflict of interest.
References
- Gutierrez, J.; Kim, S.Y.; Kim, P.J. Effect of rice cultivar on CH4 emissions and productivity in Korean paddy soil. Field Crops Res. 2013, 146, 16–24. [Google Scholar] [CrossRef]
- Jiang, M.; Li, X.; Xin, L.; Tan, M.; Zhang, W. Impacts of Rice Cropping System Changes on Paddy Methane Emissions in Southern China. Land 2023, 12, 270. [Google Scholar] [CrossRef]
- Yun, Y.T.; Chung, C.T.; Kim, G.C.; Yun, T.S. ‘Bbareumi,’ An Extremely Early-Maturing Rice Cultivar Adaptable for Early Transplanting in the Chungnam Plain Area. Korean J. Breed Sci. 2022, 54, 238–243. [Google Scholar] [CrossRef]
- Yun, Y.T.; Kim, G.C.; Cho, G.W.; Yun, T.S. Changes in Growth and Quality Traits According to Transplanting Dates using ‘Bbareumi,’ an Extremely Early Maturing Rice Cultivar in the Chungnam Plain Area. Korean J. Breed Sci. 2022, 54, 305–314. [Google Scholar] [CrossRef]
- Peng, B.; Kong, H.; Li, Y.; Wang, L.; Zhong, M.; Sun, L.; Gao, G.; Zhang, Q.; Luo, L.; Wang, G.; et al. OsAAP6 functions as an important regulator of grain protein content and nutritional quality in rice. Nat. Commun. 2014, 5, 4847. [Google Scholar] [CrossRef] [Green Version]
- Yang, Y.; Guo, M.; Sun, S.; Zou, Y.; Yin, S.; Liu, Y.; Tang, S.; Gu, M.; Yang, Z.; Yan, C. Natural variation of OsGluA2 is involved in grain protein content regulation in rice. Nat. Commun. 2019, 10, 1949. [Google Scholar] [CrossRef] [Green Version]
- Shi, S.; Wang, E.; Li, C.; Cai, M.; Cheng, B.; Cao, C.; Jiang, Y. Use of protein content, amylose content, and RVA parameters to evaluate the taste quality of rice. Front. Nutr. 2022, 8, 1223. [Google Scholar] [CrossRef]
- Liang, H.; Gao, S.; Ma, J.; Zhang, T.; Wang, T.; Zhang, S.; Wu, Z. Effect of nitrogen application rates on the nitrogen utilization, yield and quality of rice. Food Nutr. Sci. 2021, 12, 13–27. [Google Scholar] [CrossRef]
- Zhu, D.W.; Zhang, H.C.; Guo, B.W.; Ke, X.; DAI, Q.G.; Wei, H.Y.; Gao, H.; Hu, Y.J.; Cui, P.Y.; HUO, Z.Y. Effects of nitrogen level on yield and quality of japonica soft super rice. J. Integr. Agric. 2017, 16, 1018–1027. [Google Scholar] [CrossRef]
- Shi, S.; Zhang, G.; Li, L.; Chen, D.; Liu, J.; Cao, C.; Jiang, Y. Effects of nitrogen fertilizer on the starch structure, protein distribution, and quality of rice. ACS Food Sci. Technol. 2022, 2, 1347–1354. [Google Scholar] [CrossRef]
- Wang, X.; Wang, K.; Yin, T.; Zhao, Y.; Liu, W.; Shen, Y.; Ding, Y.; Tang, S. Nitrogen fertilizer regulated grain storage protein synthesis and reduced chalkiness of rice under actual field warming. Front. Plant Sci. 2021, 12, 715436. [Google Scholar] [CrossRef]
- Chen, Y.; Wang, M.; Ouwerkerk, P.B. Molecular and environmental factors determining grain quality in rice. Food Energy Secur. 2012, 1, 111–132. [Google Scholar] [CrossRef]
- Fiaz, S.; Ahmad, S.; Noor, M.A.; Wang, X.; Younas, A.; Riaz, A.; Riaz, A.; Ali, F. Applications of the CRISPR/Cas9 System for Rice Grain Quality Improvement: Perspectives and Opportunities. Int. J. Mol. Sci. 2019, 20, 888. [Google Scholar] [CrossRef] [Green Version]
- Nguyen, T.H.; Kim, M.H.; Lee, B.W. Response of grain yield and milled-rice protein content to nitrogen topdress timing at panicle initiation stage of rice. Korean J. Crop Sci. 2006, 51, 1–13. [Google Scholar]
- Kim, M.H.; Lee, K.J.; Lee, B.W. Response of Grain Protein Content to Nitrogen Top dress Rate at Panicle Initiation Stage under Different Growth and Plant Nitrogen Status of Rice. Korean J. Crop Sci. 2007, 52, 104–111. [Google Scholar]
- Rural Development Administration (RDA). Available online: http://soil.rda.go.kr/soil/index.jsp (accessed on 10 February 2023).
- Prom-U-Thai, C.; Rerkasem, B. Rice quality improvement. A review. Agron. Sustain. Dev. 2020, 40, 28. [Google Scholar] [CrossRef]
- Custodio, M.C.; Cuevas, R.P.; Ynion, J.; Laborte, A.G.; Velasco, M.L.; Demont, M. Rice quality: How is it defined by consumers, industry, food scientists, and geneticists? Trends Food Sci. Technol. 2019, 92, 122–137. [Google Scholar] [CrossRef]
- Oh, S.K. Development of rice varieties for processing and trend of food industry. Food Ind. Nutr. 2016, 21, 8–14. [Google Scholar]
- Yang, W.H.; Park, J.H.; Choi, J.S.; Kang, S.G.; Kim, S.J. Yield characteristics and related agronomic traits affected by the transplanting date in early maturing varieties of rice in the central plain area of Korea. Korean J. Crop Sci. 2019, 64, 165–175. [Google Scholar] [CrossRef]
- Lee, J.H.; Park, D.S.; Kwak, D.Y.; Yeo, U.S.; Song, Y.C.; Kim, C.S.; Jeon, M.G.; Oh, B.G.; Shin, M.S.; Kim, J.K. Yield and grain quality of early maturing rice cultivars as affected by early transplanting in Yeongnam plain area. Korean J. Crop Sci. 2008, 53, 326–332. [Google Scholar]
- Yun, Y.T.; Chung, C.T.; Lee, Y.J.; Na, H.J.; Lee, J.C.; Lee, D.H.; Lee, K.W.; Kang, J.W.; Ahn, S.N. Variation of yield and quality in early maturing rice cultivars by transplanting date in Chungnam plain area in Korea. Plant Breed Biotech. 2015, 3, 47–57. [Google Scholar] [CrossRef]
- Yun, Y.T.; Chung, C.T.; Lee, Y.J.; Na, H.J.; Lee, J.C.; Lee, S.G.; Lee, K.W.; Yoon, Y.H.; Kang, J.W.; Lee, H.S.; et al. QTL mapping of grain quality traits using introgression lines carrying Oryza rufipogon chromosome segments in Japonica rice. Rice 2016, 9, 62. [Google Scholar] [CrossRef] [PubMed] [Green Version]
- National Institute of Agricultural Science and Technology (NIAST). Methods of Soil Chemical Analysis; RDA: Suwon, Republic of Korea, 2010; pp. 13–144. [Google Scholar]
- Yun, Y.T.; Chung, C.T.; Kim, G.C.; Kim, B.R. Improving Efficiency and Effectiveness of Disinfection by Soaking Seeds before Rice Seed Disinfection. Korean J. Crop Sci. 2022, 67, 137–146. [Google Scholar] [CrossRef]
- Dou, Z.; Tang, S.; Li, G.; Liu, Z.; Ding, C.; Chen, L.; Wang, S.; Ding, Y. Application of nitrogen fertilizer at heading stage improves rice quality under elevated temperature during grain-filling stage. Crop Sci. 2017, 57, 2183–2192. [Google Scholar] [CrossRef] [Green Version]
- Shi, W.; Yin, X.; Struik, P.C.; Xie, F.; Schmidt, R.C.; Jagadish, K.S. Grain yield and quality responses of tropical hybrid rice to high night-time temperature. Field Crops Res. 2016, 190, 18–25. [Google Scholar] [CrossRef]
- Shimono, H.; Fujimura, S.; Nishimura, T.; Hasegawa, T. Nitrogen uptake by rice (Oryza sativa L.) exposed to low water temperatures at different growth stages. J. Agron. Crop Sci. 2012, 198, 145–151. [Google Scholar] [CrossRef]
- Jia, Y.; Wang, J.; Qu, Z.; Zou, D.; Sha, H.; Liu, H.; Sun, J.; Zheng, H.; Wang, J.; Yang, L.; et al. Effects of low water temperature during reproductive growth on photosynthetic production and nitrogen accumulation in rice. Field Crops Res. 2019, 242, 107587. [Google Scholar] [CrossRef]
- Hwang, W.H.; Kang, J.R.; Baek, J.S.; An, S.H.; Jeong, J.H.; Jeong, H.Y.; Lee, H.S.; Yun, J.T.; Lee, G.H.; Choi, K.J. Effect of active nutrient uptake on heading under low temperature in rice. Korean J. Crop Sci. 2016, 61, 163–170. [Google Scholar] [CrossRef] [Green Version]
- Chen, K.; Lyskowski, A.; Jaremko, L.; Jaremko, M. Genetic and molecular factors determining grain weight in rice. Front. Plant Sci. 2021, 12, 1444. [Google Scholar] [CrossRef]
- Yuan, H.; Qin, P.; Hu, L.; Zhan, S.; Wang, S.; Gao, P.; Li, J.; Jin, M.; Xu, Z.; Gao, Q.; et al. OsSPL18 controls grain weight and grain number in rice. J. Genet. Genom. 2019, 46, 41–51. [Google Scholar] [CrossRef]
- Ying, J.Z.; Ma, M.; Bai, C.; Huang, X.H.; Liu, J.L.; Fan, Y.Y.; Song, X.J. TGW3, a major QTL that negatively modulates grain length and weight in rice. Mol. Plant 2018, 11, 750–753. [Google Scholar] [CrossRef] [Green Version]
- Sakamoto, T.; Matsuoka, M. Identifying and exploiting grain yield genes in rice. Curr. Opin. Plant Biol. 2008, 11, 209–214. [Google Scholar] [CrossRef]
- Abookheili, F.A.; Mobasser, H.R. Effect of planting density on growth characteristics and grain yield increase in successive cultivations of two rice cultivars. Agrosyst. Geosci Environ. 2021, 4, e20213. [Google Scholar] [CrossRef]
- Meas, V.; Shon, D.; Lee, Y.H. Impacts of Planting Density on Nutrients Uptake by System of Rice Intensification under No-tillage Paddy in Korea. Korean J. Soil Sci. Fertil. 2011, 44, 98–103. [Google Scholar] [CrossRef] [Green Version]
- Ren, D.; Li, Y.; He, G.; Qian, Q. Multifloret spikelet improves rice yield. New Phytol. 2020, 225, 2301–2306. [Google Scholar] [CrossRef] [Green Version]
- Son, Y.; Park, S.T.; Kim, S.C.; Lee, S.S.; Lee, S.K. Varietal response on different planting densities in rice. Res. Rept. RDA 1989, 34, 1–6. [Google Scholar]
- Hong, K.P.; Kim, Y.G.; Joung, W.K.; Shon, G.M.; Song, G.W.; Choi, Y.J.; Choe, Z.R. Varietal Differences and Time Course Changes in Greenness Values in Rice Leaf. Korean J. Crop Sci. 2003, 48, 479–483. [Google Scholar]
- Zhang, L.; Hashimoto, N.; Saito, Y.; Obara, K.; Ishibashi, T.; Ito, R.; Yamamoto, S.; Maki, M.; Homma, K. Validation of Relation between SPAD and Rice Grain Protein Content in Farmer Fields in the Coastal Area of Sendai, Japan. AgriEngineering 2023, 5, 369–379. [Google Scholar] [CrossRef]
- Hu, Y.; Cong, S.; Zhang, H. Comparison of the Grain Quality and Starch Physicochemical Properties between Japonica Rice Cultivars with Different Contents of Amylose, as Affected by Nitrogen Fertilization. Agriculture 2021, 11, 616. [Google Scholar] [CrossRef]
- Balindong, J.L.; Ward, R.M.; Liu, L.; Rose, T.J.; Pallas, L.A.; Ovenden, B.W.; Snell, P.J.; Waters, D.L.E. Rice grain protein composition influences instrumental measures of rice cooking and eating quality. J. Cereal Sci. 2018, 79, 35–42. [Google Scholar] [CrossRef] [Green Version]
- Kwon, S.W.; Cho, Y.C.; Lee, J.H.; Kim, J.J.; Kim, M.K.; Choi, I.S.; Hwang, H.G.; Koh, H.J.; Kim, Y.G. Identification of quantitative trait loci associated with rice eating quality traits using a population of recombinant inbred lines derived from a cross between two temperate japonica cultivars. Mol. Cells 2011, 31, 437–445. [Google Scholar] [CrossRef] [PubMed] [Green Version]
Figure 1.
Distribution of rainfall and minimum and maximum temperatures of two years (2019–2020). The data were obtained from the Korean Meteorological Administration.
Figure 1.
Distribution of rainfall and minimum and maximum temperatures of two years (2019–2020). The data were obtained from the Korean Meteorological Administration.

Figure 2.
Variation in SPAD value according to nitrogen application methods. Means with the same letters in 2019 and 2020 are not significantly different at 5% level as determined by Duncan’s multiple range test.
Figure 2.
Variation in SPAD value according to nitrogen application methods. Means with the same letters in 2019 and 2020 are not significantly different at 5% level as determined by Duncan’s multiple range test.

Figure 3.
Milled rice yield (a) and head rice yield (b) according to nitrogen application methods. Means with the same letters in 2019 and 2020 are not significantly different at 5% level as determined by Duncan’s multiple range test.
Figure 3.
Milled rice yield (a) and head rice yield (b) according to nitrogen application methods. Means with the same letters in 2019 and 2020 are not significantly different at 5% level as determined by Duncan’s multiple range test.

Figure 4.
Relationship between the milled rice yield and (a) spikelet number m−2 and (b) ripened grain number m−2. **: significant at p < 0.01.
Figure 4.
Relationship between the milled rice yield and (a) spikelet number m−2 and (b) ripened grain number m−2. **: significant at p < 0.01.

Figure 5.
Relationship between the head rice yield and (a) spikelet number m−2 and (b) ripened grain number m−2. **: significant at p < 0.01.
Figure 5.
Relationship between the head rice yield and (a) spikelet number m−2 and (b) ripened grain number m−2. **: significant at p < 0.01.

Figure 6.
Relationship of SPAD value with (a) protein content of milled rice and (b) glossiness of cooked rice. **: significant at 0.01.
Figure 6.
Relationship of SPAD value with (a) protein content of milled rice and (b) glossiness of cooked rice. **: significant at 0.01.

Figure 7.
Relationship between spikelet number m−2 and (a) panicle number hill−1 and (b) spikelet number panicle−1. **: significant at p < 0.01.
Figure 7.
Relationship between spikelet number m−2 and (a) panicle number hill−1 and (b) spikelet number panicle−1. **: significant at p < 0.01.


Table 1.
Soil chemical properties of the rice research field used in this study.
| Property | pH (1:5) | EC (dS/m) | Organic Matter (g/kg) | Available P2O5 (g/kg) | Available SiO2 (g/kg) | Exchangeable Cation (cmolckg−1) | ||
|---|---|---|---|---|---|---|---|---|
| K | Ca | Mg | ||||||
| Data | 6.3 | 0.37 | 16.2 | 25 | 353 | 0.3 | 6.6 | 1.7 |
| Recommendation | 6.0–6.5 | - | 30–50 | 80–120 | >157 | 0.2–0.3 | 5.0–6.0 | 1.5–2.0 |
Table 2.
Summary of treatments for nitrogen application methods.
| Treatment | Application Method | Total Nitrogen (kg/ha) | Split Application Method (kg/ha) | |
|---|---|---|---|---|
| Basal Dressing | Top Dressing | |||
| BD70 | Basal dressing | 70 (100%) | 70 (100%) | - |
| BD90 | 90 (100%) | 90 (100%) | - | |
| BD110 | 110 (100%) | 110 (100%) | - | |
| BTD70 | Basal + Top dressing | 70 (100%) | 49 (70%) | 21 (30%) |
| BTD90 | 90 (100%) | 63 (70%) | 27 (30%) | |
| BTD110 | 110 (100%) | 77 (70%) | 33 (30%) | |
Basal dressing was applied during leveling 3 days prior to transplanting and top dressing was applied 24 days prior to heading date.
Table 3.
Heading date and panicle-related traits according to nitrogen application methods.
| Year | Treatment | Heading Date (m.dd) | Days to Heading (Days) | Culm Length (cm) | Panicle Length (cm) | Panicle Number Hill−1 | |
|---|---|---|---|---|---|---|---|
| 2019 | Basal (BD) | BD70 | 6.26 a | 53 a | 62.4 d | 17.8 c | 14.2 c |
| BD90 | 6.26 a | 53 a | 63.8 c | 18.1 bc | 14.5 b | ||
| BD110 | 6.26 a | 53 a | 65.3 b | 18.3 b | 14.7 a | ||
| Basal + Top (BTD) | BTD70 | 6.26 a | 53 a | 64.5 bc | 18.2 b | 13.7 d | |
| BTD90 | 6.26 a | 53 a | 65.4 b | 18.5 ab | 14.2 c | ||
| BTD110 | 6.26 a | 53 a | 67.1 a | 18.7 a | 14.5 b | ||
| Mean | BD | 6.26 | 53 | 63.8 | 18.1 | 14.4 | |
| BTD | 6.26 | 53 | 65.6 | 18.5 | 14.1 | ||
| t-test | ns | ns | ** | * | ** | ||
| 2020 | Basal (BD) | BD70 | 6.24 a | 51 a | 70.6 c | 19.2 c | 15.5 b |
| BD90 | 6.24 a | 51 a | 71.3 c | 19.3 c | 16.3 a | ||
| BD110 | 6.24 a | 51 a | 72.5 b | 19.5 bc | 16.8 a | ||
| Basal + Top (BTD) | BTD70 | 6.24 a | 51 a | 73.4 ab | 19.6 bc | 15.1 b | |
| BTD90 | 6.24 a | 51 a | 74.0 | 19.8 ab | 15.4 b | ||
| BTD110 | 6.24 a | 51 a | 75.8 | 20.1 a | 15.6 b | ||
| Mean | BD | 6.24 | 51 | 71.5 | 19.3 | 16.2 | |
| BTD | 6.24 | 51 | 71.0 | 19.8 | 15.4 | ||
| t-test | ns | ns | ** | ** | ** | ||
| Mean | 2019 | 6.26 | 53 | 64.7 | 18.3 | 14.3 | |
| 2020 | 6.24 | 51 | 72.9 | 19.6 | 15.8 | ||
| t-test | ** | ** | ** | ** | ** | ||
Means with the same letters in 2019 and 2020 are not significantly different at 5% level as determined by Duncan’s multiple range test. *, **: significantly different at p < 0.05 and 0.01, respectively. ns: not significant.
Table 4.
Grain-related traits according to nitrogen application methods.
| Year | Treatment | Spikelet No. Panicle−1 | Spikelet No. m−2 | Ripened Grain (%) | Ripened Grain No. m−2 | 1000-Grain Weight (g) | |
|---|---|---|---|---|---|---|---|
| 2019 | Basal (BD) | BD70 | 75.7 d | 25,526 c | 85.9 a | 21,932 c | 20.5 a |
| BD90 | 78.6 c | 27,080 b | 84.7 b | 22,925 b | 20.3 ab | ||
| BD110 | 79.7 bc | 27,863 b | 82.6 d | 23,014 b | 20.1 ab | ||
| Basal + Top (BTD) | BTD70 | 80.4 bc | 26,200 c | 83.8 bc | 21,956 c | 20.3 ab | |
| BTD90 | 81.5 b | 27,657 b | 83.4 cd | 23,077 b | 20.0 b | ||
| BTD110 | 85.9 a | 29,657 a | 80.6 e | 23,904 a | 20.1 ab | ||
| Mean | BD | 78.0 | 26,823 | 84.4 | 22,624 | 20.3 | |
| BTD | 82.6 | 27,838 | 82.6 | 22,979 | 20.1 | ||
| t-test | ** | ** | ** | ns | * | ||
| 2020 | Basal (BD) | BD70 | 76.9 d | 28,410 c | 79.5 a | 22,574 b | 20.4 a |
| BD90 | 78.3 d | 30,440 b | 77.1 bc | 23,478 ab | 20.3 a | ||
| BD110 | 80.5 cd | 31,966 a | 76.7 c | 24,507 a | 20.1 a | ||
| Basal + Top (BTD) | BTD70 | 83.1 bc | 29,884 b | 78.3 ab | 23,390 ab | 20.5 a | |
| BTD90 | 85.0 ab | 31,174 ab | 77.4 bc | 24,135 a | 20.3 a | ||
| BTD110 | 86.4 a | 32,102 a | 75.2 d | 24,154 a | 20.3 a | ||
| Mean | BD | 78.6 | 30,322 | 77.8 | 23,558 | 20.3 | |
| BTD | 84.9 | 31,054 | 77.0 | 23,893 | 20.3 | ||
| t-test | ** | ** | ** | ns | ns | ||
| Mean | 2019 | 80.3 | 27,331 | 83.5 | 22,801 | 20.2 | |
| 2020 | 81.7 | 30,663 | 77.4 | 23,706 | 20.3 | ||
| t-test | ns | ** | ** | ** | ns | ||
Means with the same letters in 2019 and 2020 are not significantly different at 5% level as determined by Duncan’s multiple range test. *, **: significant at p < 0.05 and 0.01, respectively. ns: not significant.
Table 5.
Grain quality traits according to nitrogen application methods.
| Year | Treatment | Appearance Traits | Protein (%) | Glossiness of Cooked Rice | ||||
|---|---|---|---|---|---|---|---|---|
| Head | Chalky | Broken | Damaged | |||||
| 2019 | Basal (BD) | BD70 | 90.9 a | 7.1 d | 1.6 b | 0.4 a | 6.4 e | 58.8 a |
| BD90 | 89.4 b | 8.2 cd | 2.1 a | 0.3 a | 6.5 d | 58.6 a | ||
| BD110 | 88.6 b | 9.1 c | 2.2 a | 0.1 a | 6.7 c | 58.3 a | ||
| Basal + Top (BTD) | BTD70 | 89.3 b | 8.9 c | 1.5 b | 0.3 a | 6.8 b | 57.4 b | |
| BTD90 | 88.4 b | 10.2 b | 1.2 b | 0.2 a | 6.9 b | 57.1 b | ||
| BTD110 | 86.2 c | 12.2 a | 1.2 b | 0.4 a | 7.1 a | 56.1 c | ||
| Mean | BD | 89.6 | 8.1 | 2.0 | 0.3 | 6.5 | 58.6 | |
| BTD | 88.0 | 10.4 | 1.3 | 0.3 | 6.9 | 56.9 | ||
| t-test | ** | ** | ** | ns | ** | ** | ||
| 2020 | Basal (BD) | BD70 | 84.9 a | 10.4 b | 4.5 d | 0.2 a | 6.2 c | 61.8 a |
| BD90 | 84.0 ab | 10.7 b | 5.2 c | 0.1 a | 6.3 c | 61.3 ab | ||
| BD110 | 82.9 b | 12.9 a | 3.8 d | 0.4 a | 6.5 b | 60.9 b | ||
| Basal + Top (BTD) | BTD70 | 82.5 b | 10.7 b | 6.5 b | 0.3 a | 6.5 b | 60.1 c | |
| BTD90 | 80.8 d | 14.0 a | 4.9 c | 0.3 a | 6.8 a | 59.5 c | ||
| BTD110 | 78.9 e | 13.5 a | 7.2 a | 0.4 a | 6.9 a | 58.2 d | ||
| Mean | BD | 83.9 | 11.3 | 4.5 | 0.2 | 6.3 | 61.3 | |
| BTD | 80.7 | 12.7 | 6.2 | 0.3 | 6.7 | 59.3 | ||
| t-test | ** | ** | * | * | ** | ** | ||
| Mean | 2019 | 88.8 | 9.3 | 1.6 | 0.3 | 6.7 | 57.7 | |
| 2020 | 82.3 | 12.0 | 5.4 | 0.3 | 6.5 | 60.3 | ||
| t-test | ** | ** | ** | ns | * | ** | ||
Means with the same letters in 2019 and 2020 are not significantly different at 5% level as determined by Duncan’s multiple range test. *, **: significant at p < 0.05 and 0.01, respectively. ns: not significant.
Disclaimer/Publisher’s Note: The statements, opinions and data contained in all publications are solely those of the individual author(s) and contributor(s) and not of MDPI and/or the editor(s). MDPI and/or the editor(s) disclaim responsibility for any injury to people or property resulting from any ideas, methods, instructions or products referred to in the content. |
© 2023 by the authors. Licensee MDPI, Basel, Switzerland. This article is an open access article distributed under the terms and conditions of the Creative Commons Attribution (CC BY) license (https://creativecommons.org/licenses/by/4.0/).
Share and Cite
MDPI and ACS Style
Yun, Y.; Kim, G.; Cho, G.; Lee, Y.; Yun, T.; Kim, H. Effect of Nitrogen Application Methods on Yield and Grain Quality of an Extremely Early Maturing Rice Variety. Agriculture 2023, 13, 832. https://doi.org/10.3390/agriculture13040832
AMA Style
Yun Y, Kim G, Cho G, Lee Y, Yun T, Kim H. Effect of Nitrogen Application Methods on Yield and Grain Quality of an Extremely Early Maturing Rice Variety. Agriculture. 2023; 13(4):832. https://doi.org/10.3390/agriculture13040832
Chicago/Turabian StyleYun, Yeotae, Gyucheol Kim, Giwon Cho, Youngju Lee, Tugsang Yun, and Hakhun Kim. 2023. "Effect of Nitrogen Application Methods on Yield and Grain Quality of an Extremely Early Maturing Rice Variety" Agriculture 13, no. 4: 832. https://doi.org/10.3390/agriculture13040832
Note that from the first issue of 2016, this journal uses article numbers instead of page numbers. See further details here.